
High Aspect Ratio Composite Wings: Geometrically Nonlinear Aeroelasticity, Multi-Disciplinary Design Optimization, Manufacturing, and Experimental Testing
 , , ,
, , ,  ,
, 
Abstract
1. Introduction
- The study proposes a novel MMDO method to optimize the performance of a composite UAV wing by addressing structural, material, aeroelastic, and manufacturing constraints. It focuses on key variables such as upper and lower skin region dimensions and layup stacking sequence, spar thickness, and rib placement to address critical aspects such as buckling, deformations, stress limits, and composite failure.
- Examining the influence of large deformations on aeroelastic instability limits and failure mechanisms, this paper emphasizes the importance of addressing geometrically nonlinear constraints. The study makes a significant contribution to optimizing highly flexible composite wings by highlighting the need to consider geometric nonlinearity.
- The paper introduces NAS2, a fully automated in-house software for optimizing and designing composite aircraft structures.
- Manufacturing, material characterization, and experimental tests are conducted on the optimized composite wing to validate the NAS2 in-house software and to correlate the finite element numerical model. Also, the study aims to gain insights into the practical challenges of this multidisciplinary field. This research distinguishes itself from a limited number of studies concentrating on the experimental facets of high aspect ratio composite aircraft wing design, offering a unique level of comprehensiveness.
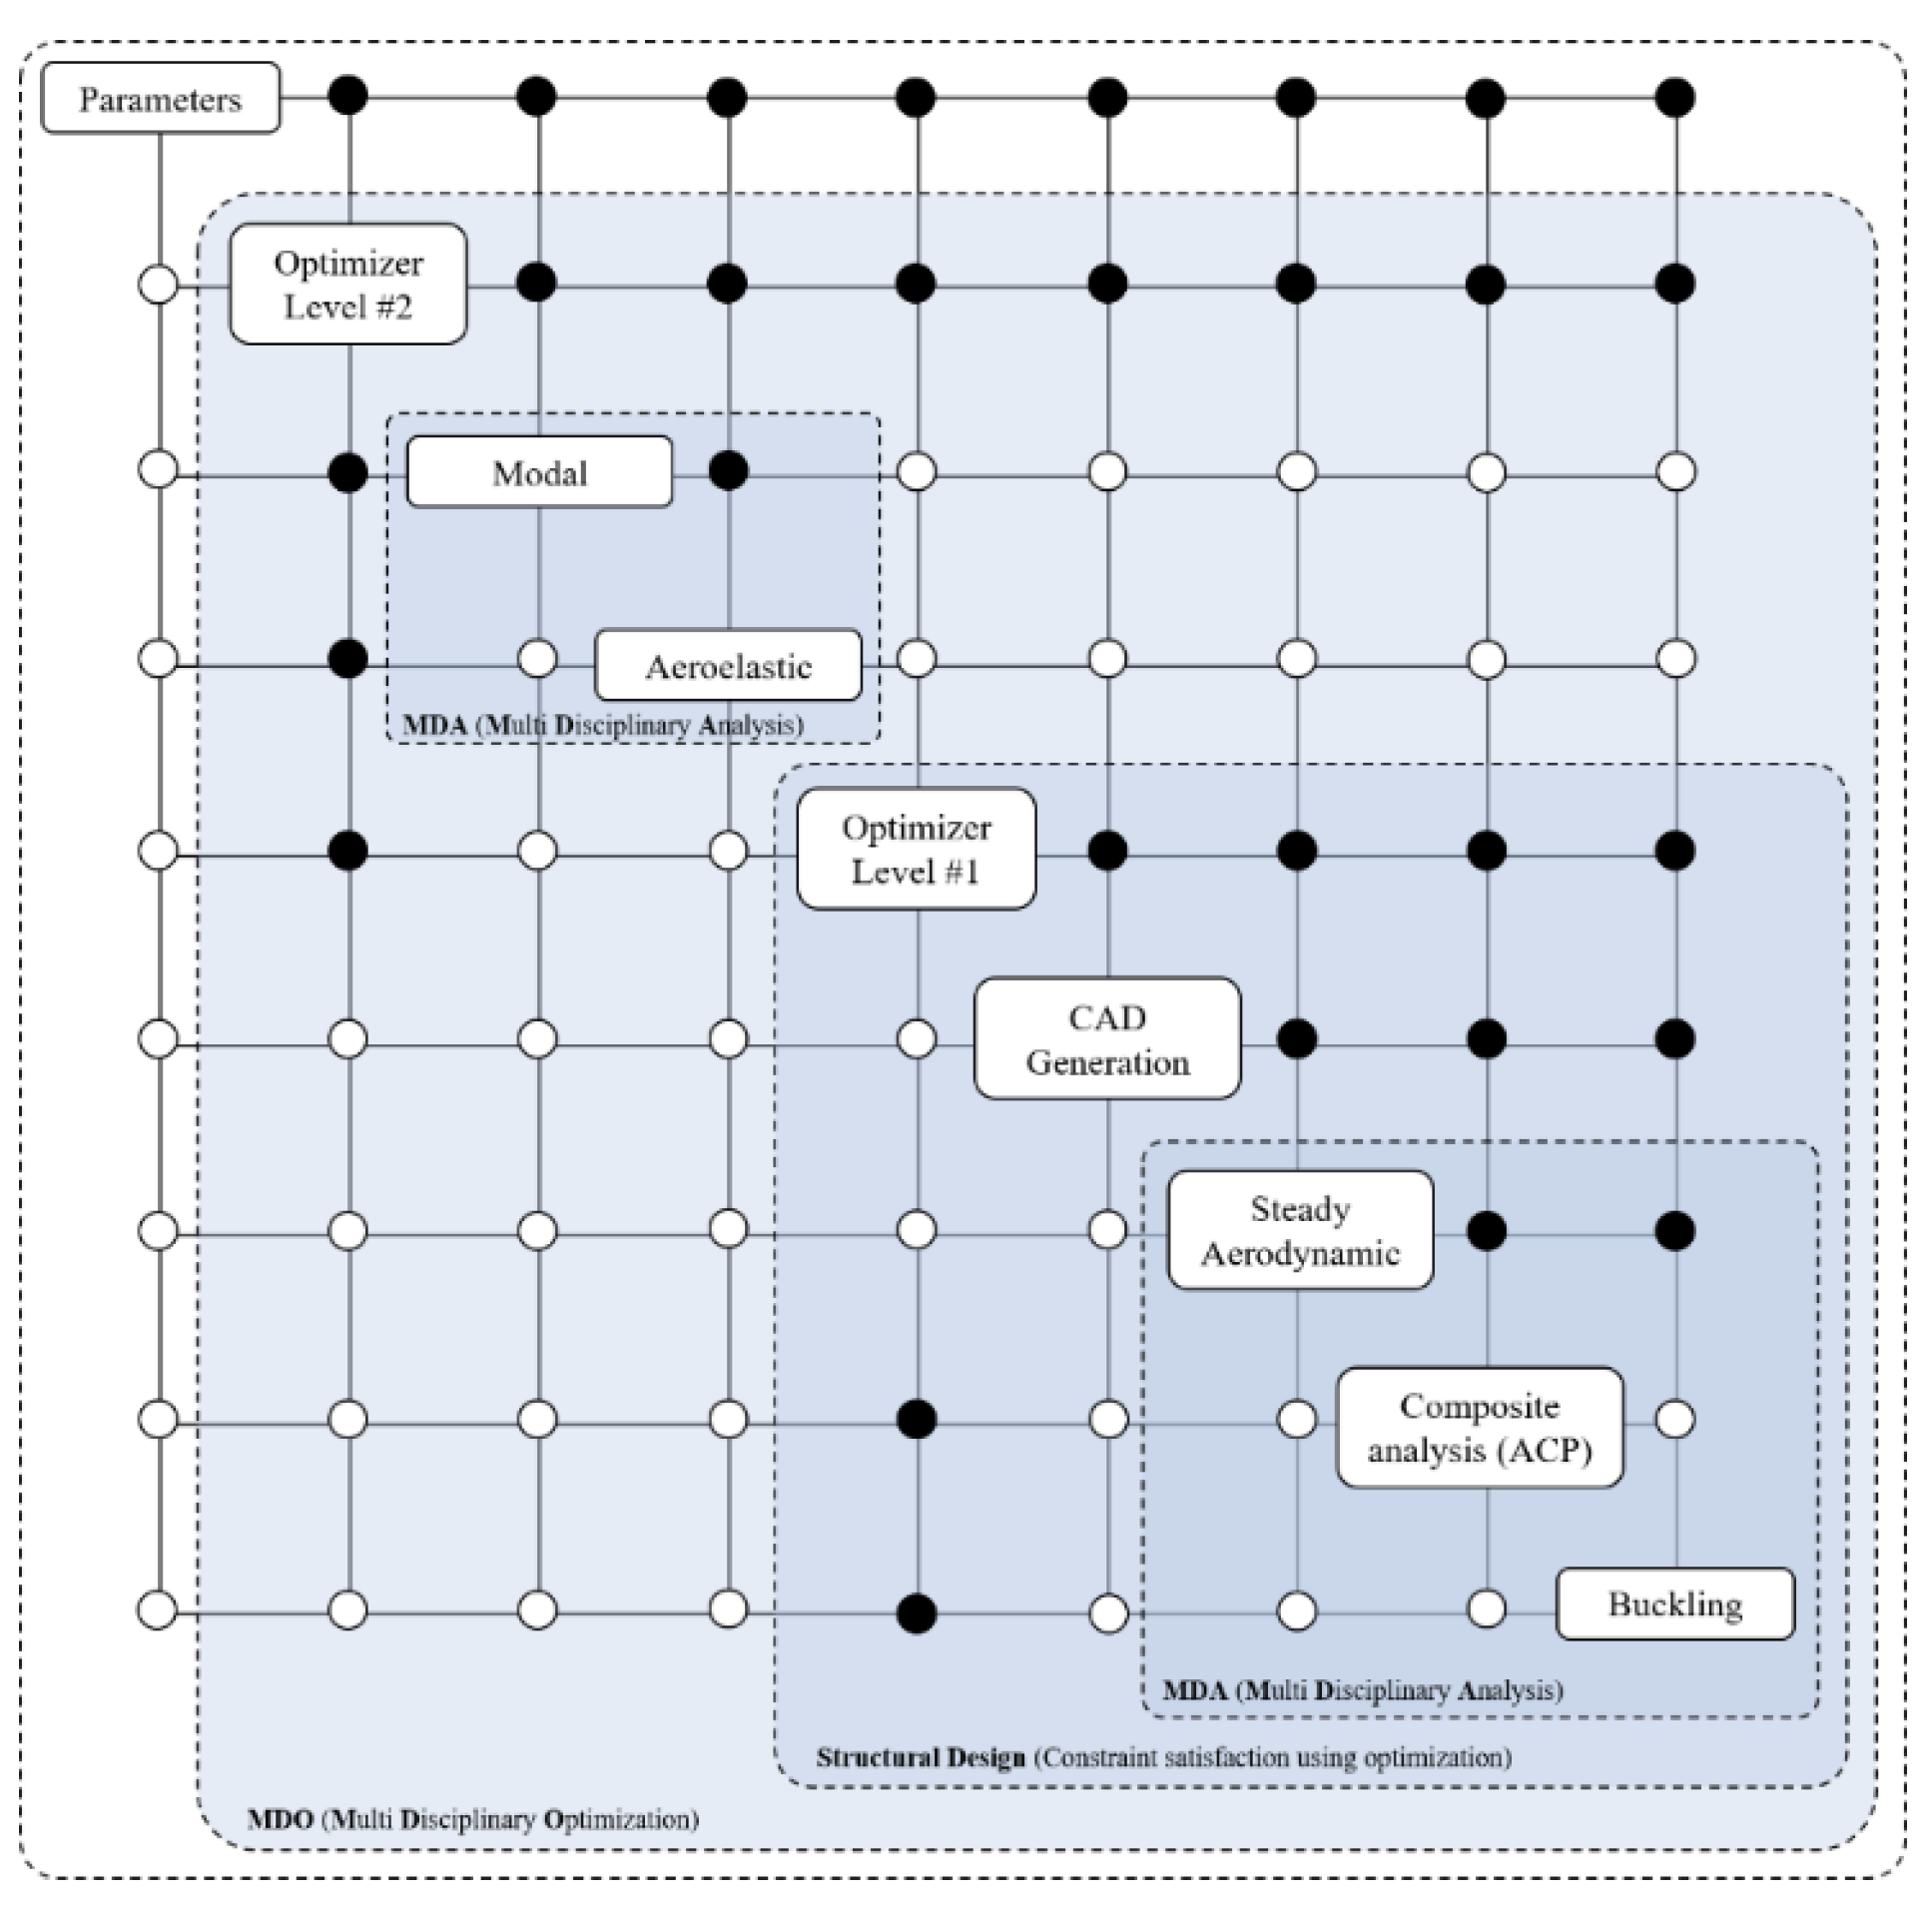
2. General MDO Framework
3. Geometrical Nonlinear Analysis
4. Nonlinear Aeroelastic Simulation Software (NAS2)
- NAS2 relies on a combination of in-house-developed codes, open-source tools, and commercial software, selected based on availability and the required fidelity for specific projects. The interface is crafted using C# (C-Sharp), while the core code is written in C++ and FORTRAN. The automatic creation of the structured grid without user interference via intelligent algorithms is facilitated in the model module.
- The structural model within NAS2 encompasses both linear and nonlinear structural beam and shell models that can be seamlessly imported from open-source and commercial software. Additionally, it incorporates specialized in-house models such as the Geometrically Exact Beam Theory (GEBT) [45], the nonlinear shell model [21], and the geometrically nonlinear Thin Wall Beam (TWB) model [38,39]. Cross-sectional properties are computed using VABS (Variational Asymptotic Beam Sectional Analysis) [46] and in-house software based on the Librescu thin wall beam theory [47,48,49], accounting for nonlinear and coupling stiffness terms. Both the first and secondary warping models are considered in the theory. The structural solver employs the finite element (FE) method. The structural model incorporates viscoelastic models to represent structural damping [50].
- The integration of ANSYS ACP with NAS2 forms a powerful alliance, particularly in the realm of composite failure analysis. ANSYS ACP, renowned for its expertise in handling composite materials, complements the computational capabilities of NAS2.
- For aerodynamic modeling, NAS2 employs the Vortex Lattice Method, in-house 3D panel theory [51], strip theory (incompressible and compressible aerodynamics) [39], and piston theory [52]. Aerodynamic loads can be imported from MSC NASTRAN [53] and ZONA ZAERO [54] commercial software. To expedite the solution of nonlinear aeroelastic problems, an in-house nonlinear ROM has been developed.
- The coupling algorithm within NAS2 orchestrates the seamless interaction of all the aforementioned modules, enabling the attainment of fully nonlinear simulations. This comprehensive approach ensures that NAS2 is well-equipped to handle diverse engineering projects, offering a sophisticated and integrated solution for structural and aerodynamic analyses, particularly in the context of aeroelastic optimization of high aspect ratio composite wings.
5. Design Framework
5.1. Structural Analysis
Inverse Reverse Factor (IRF)
5.2. ROM Aeroelastic Analysis (Flutter and Gust Analysis)
6. Numerical Results and Discussions
6.1. Numerical Validation of NAS2
6.2. Case Study—Wing Model
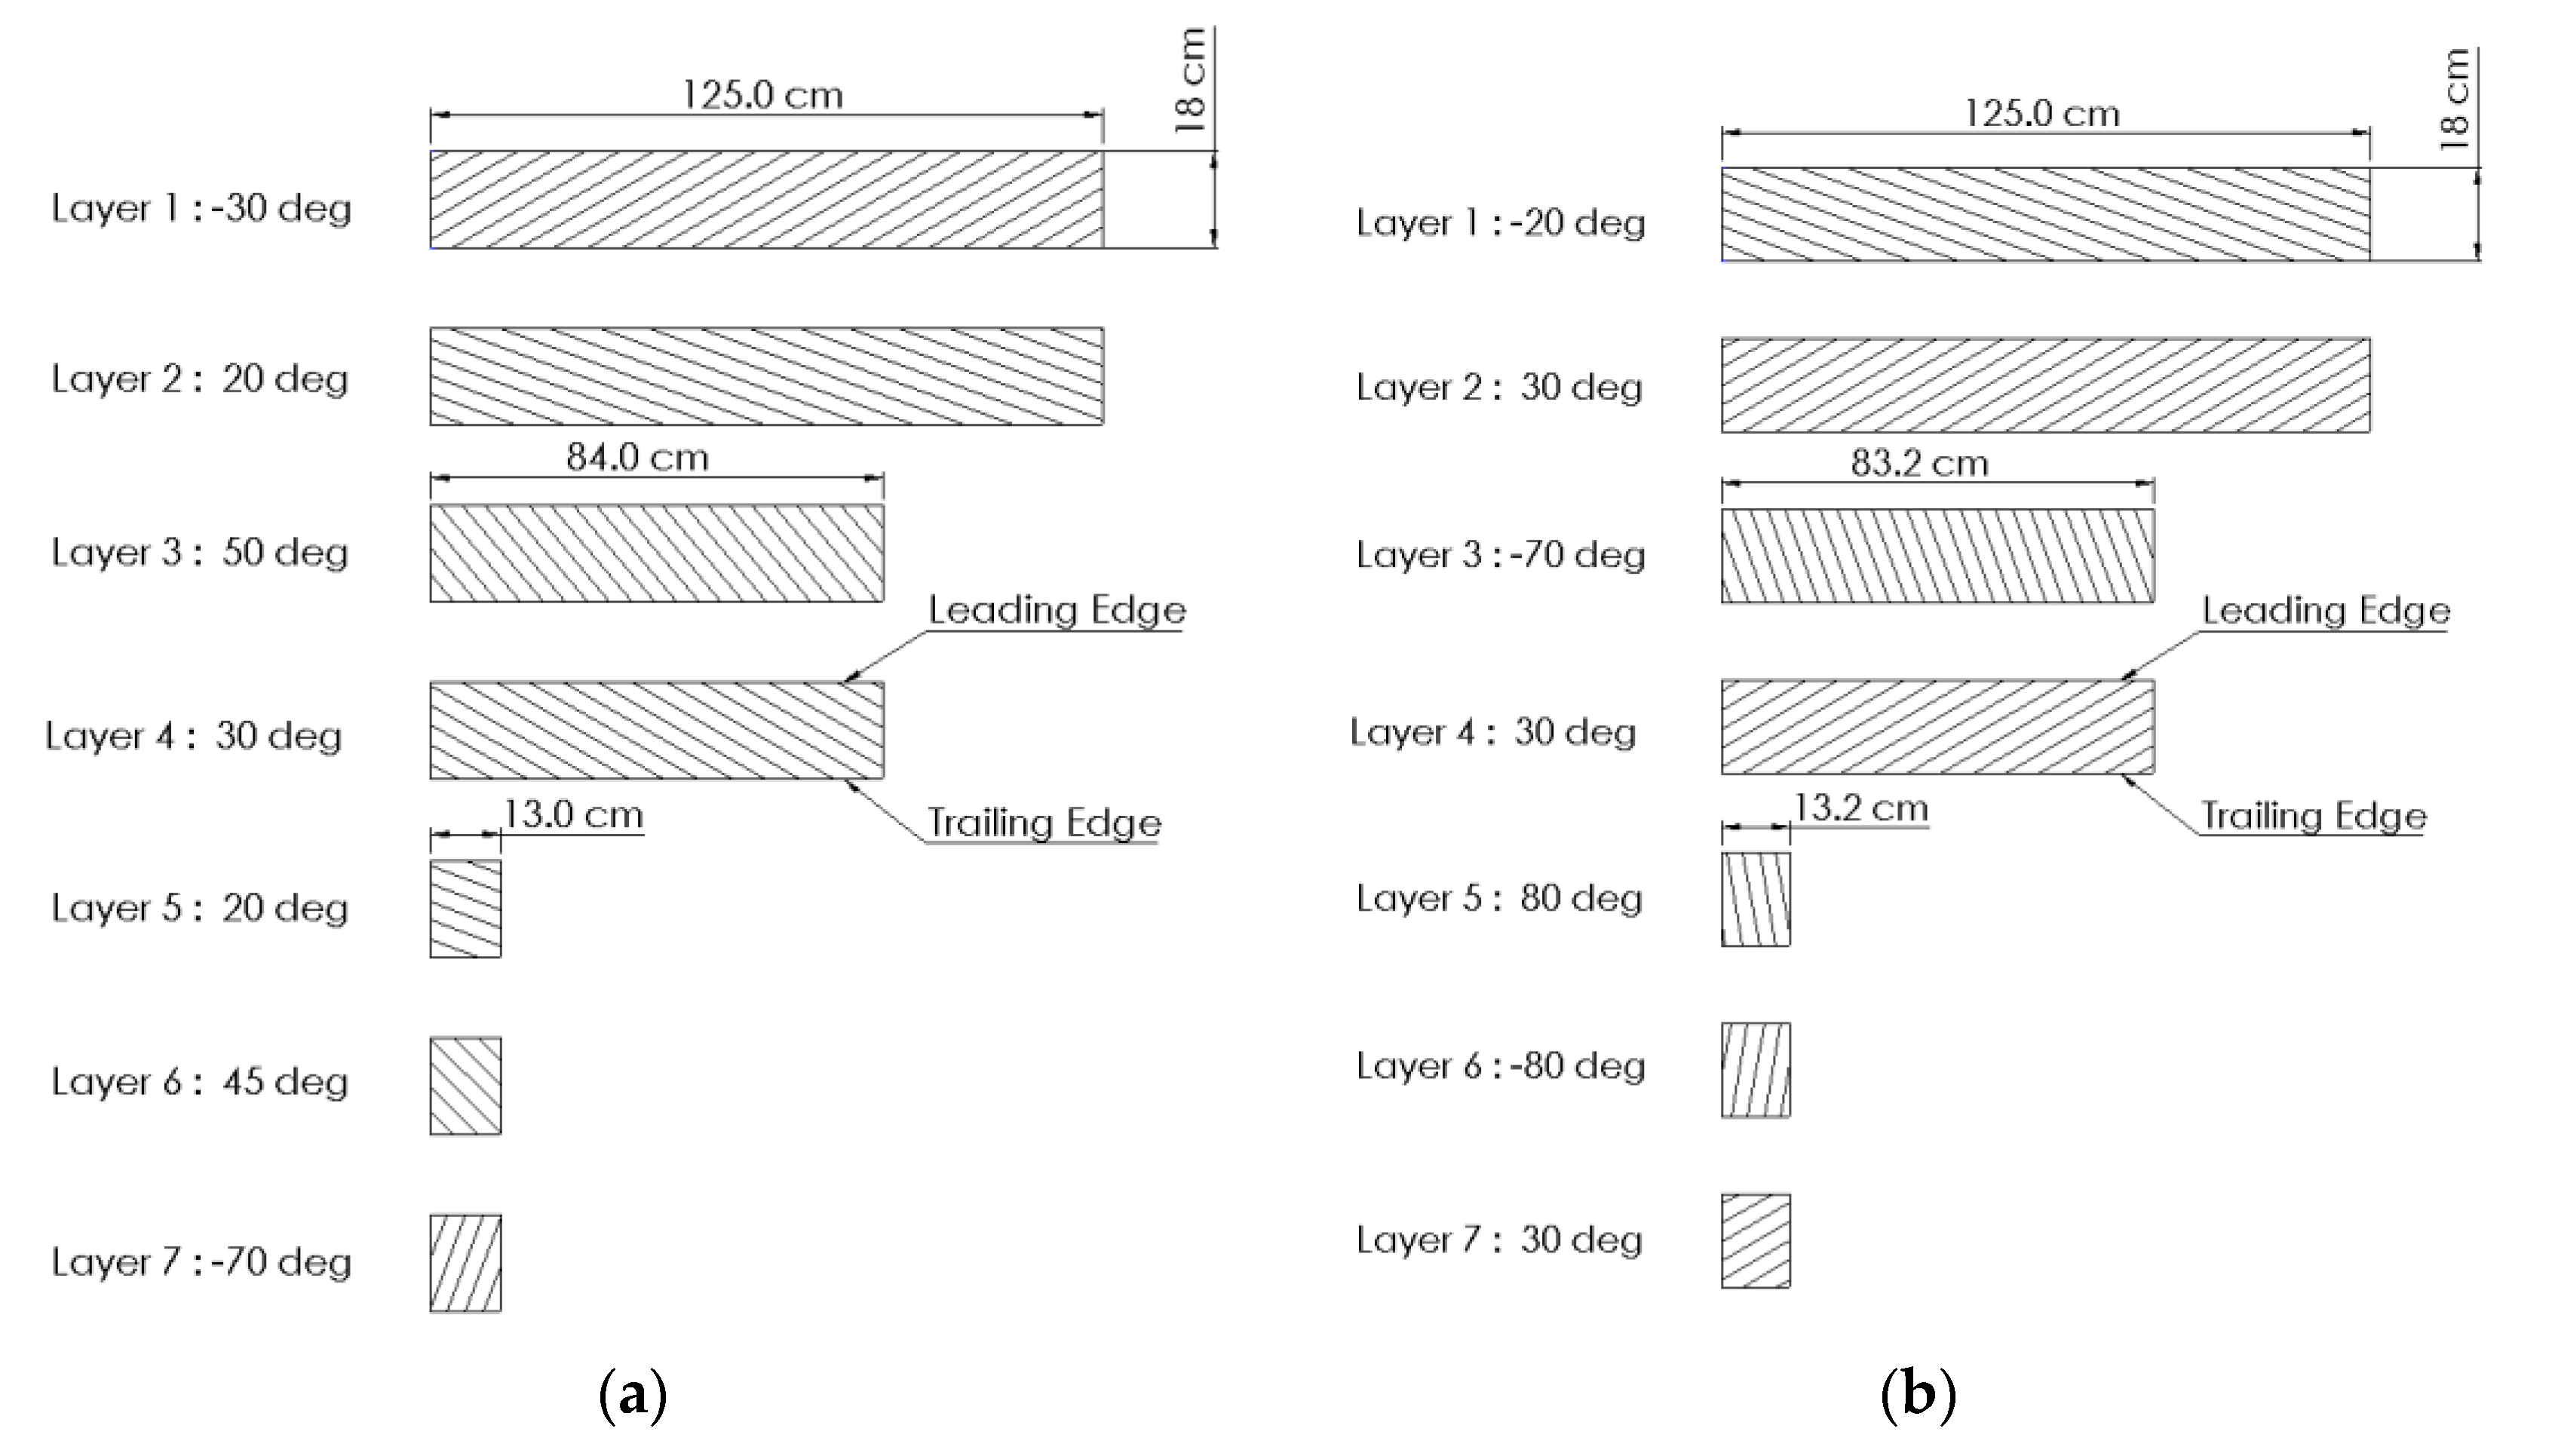
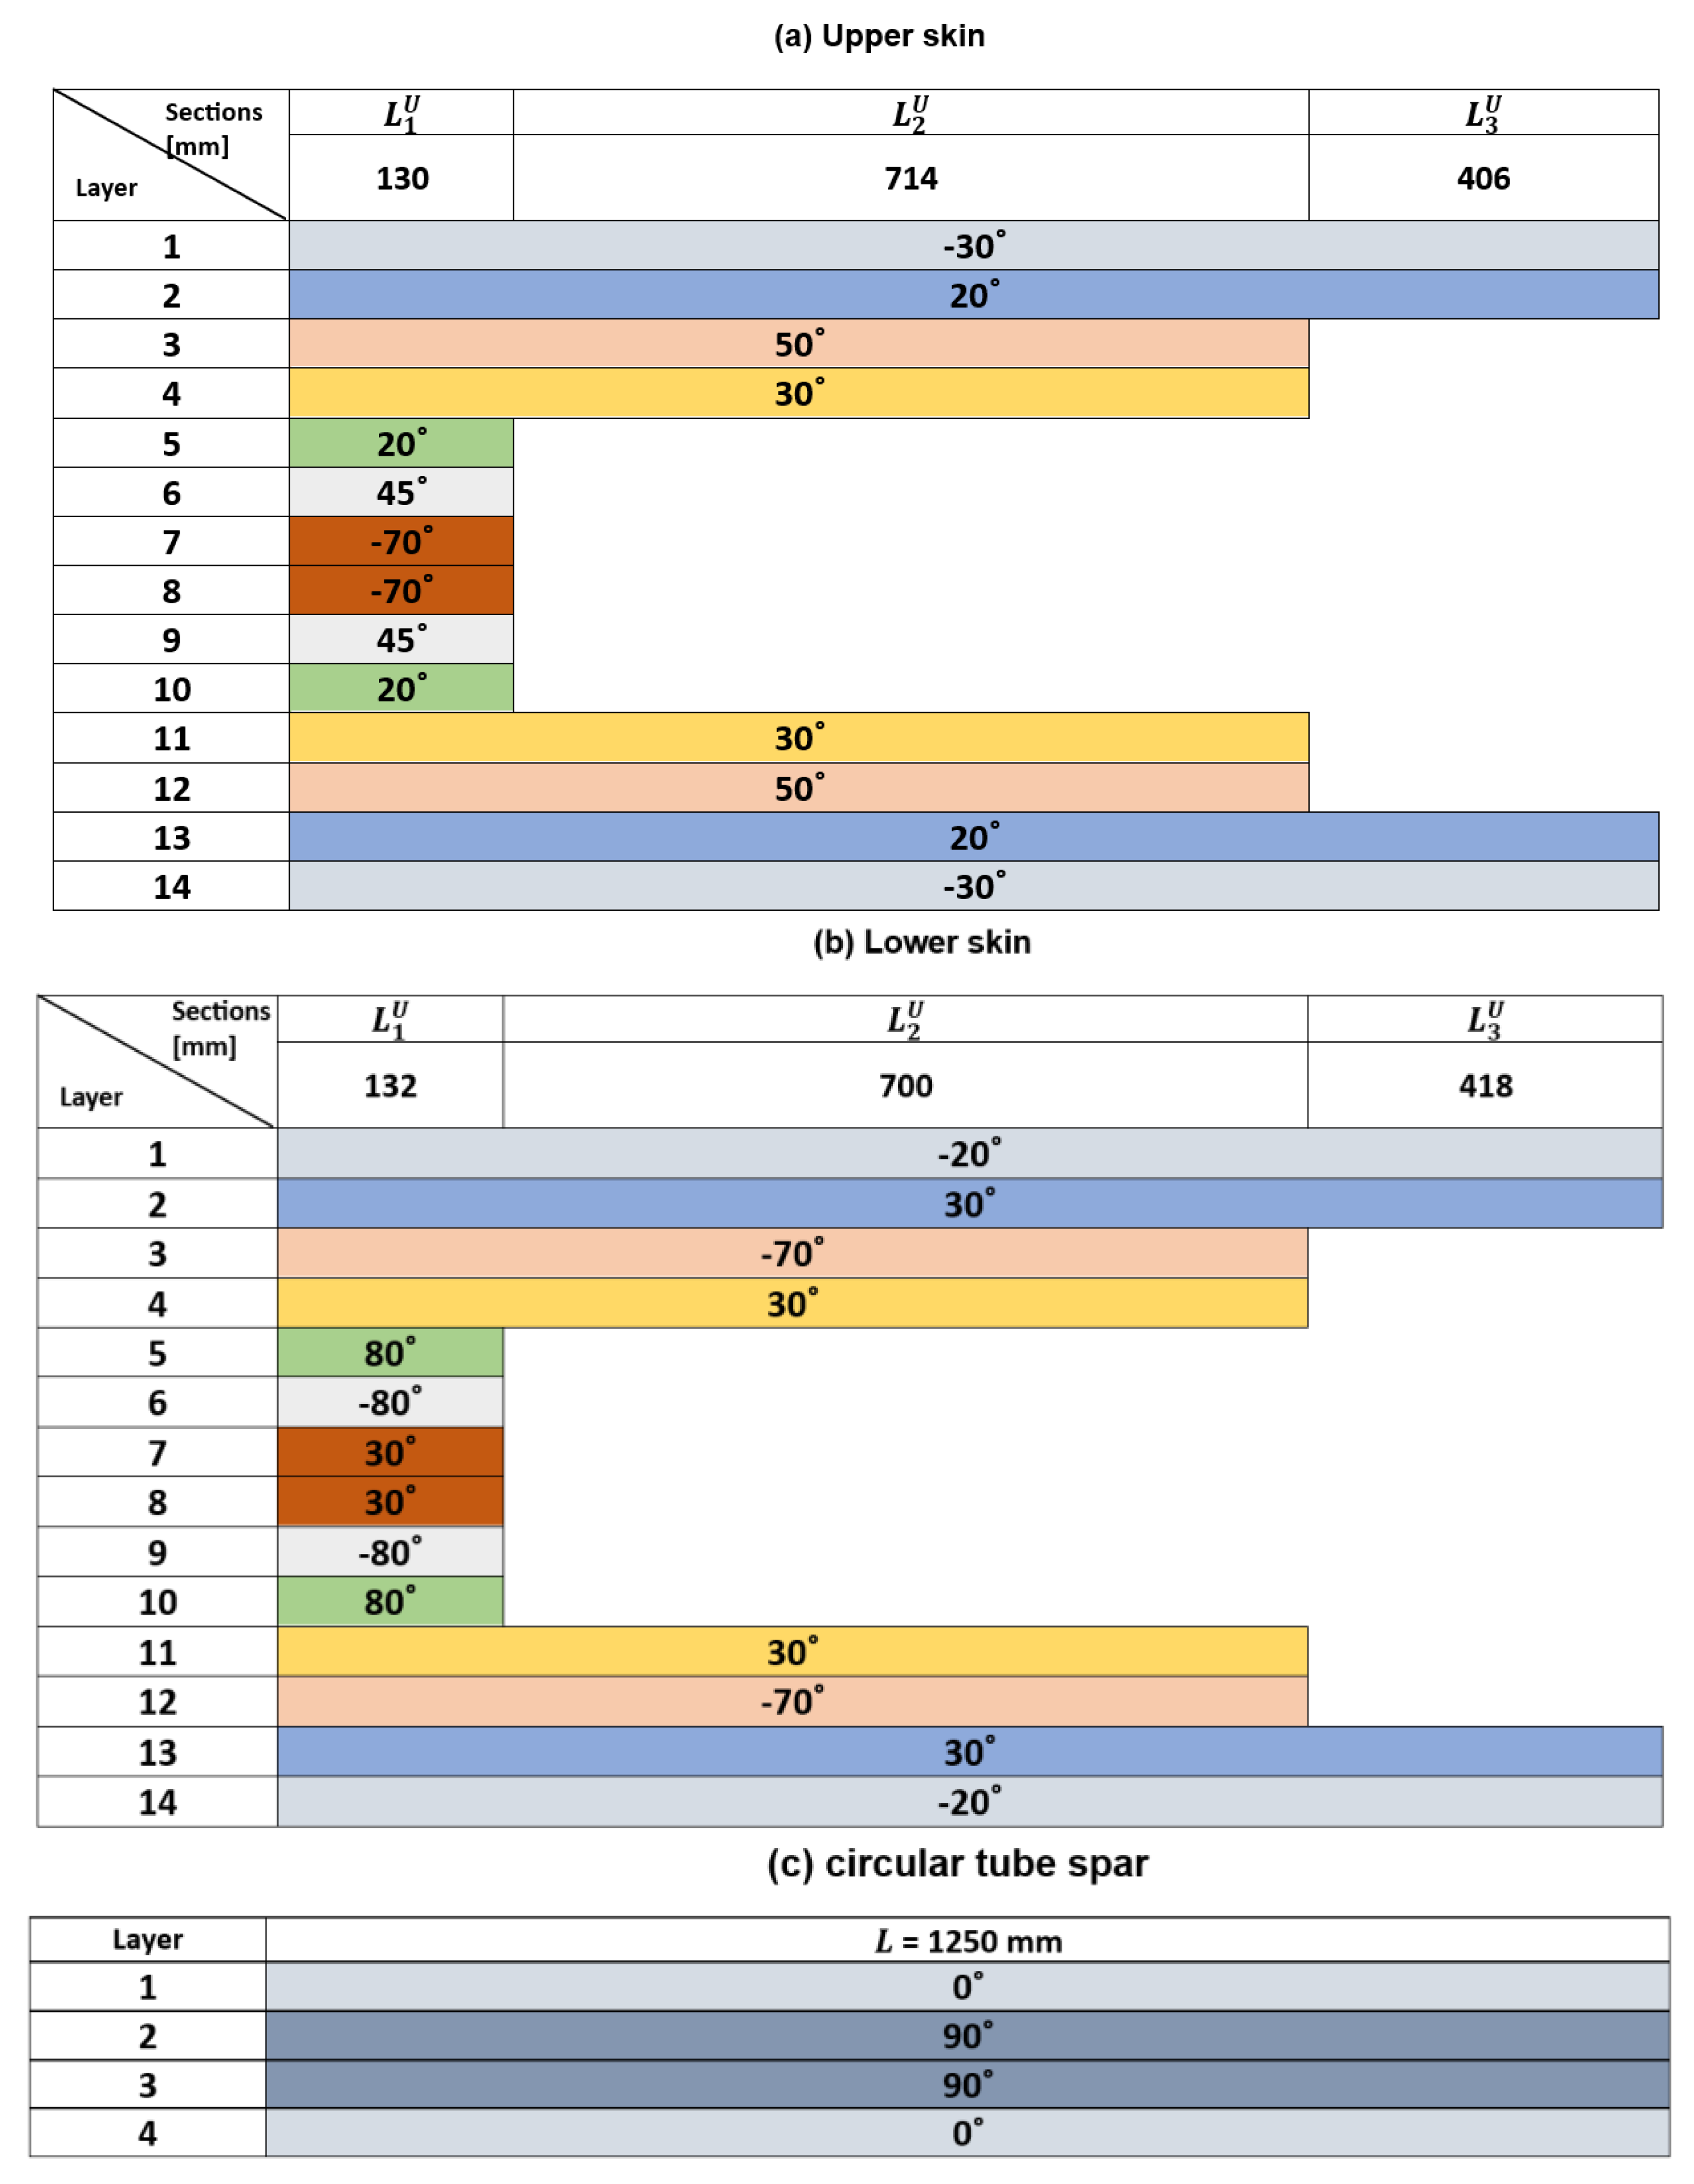
6.2.1. Stacking Sequence of the Optimized Composite Wing
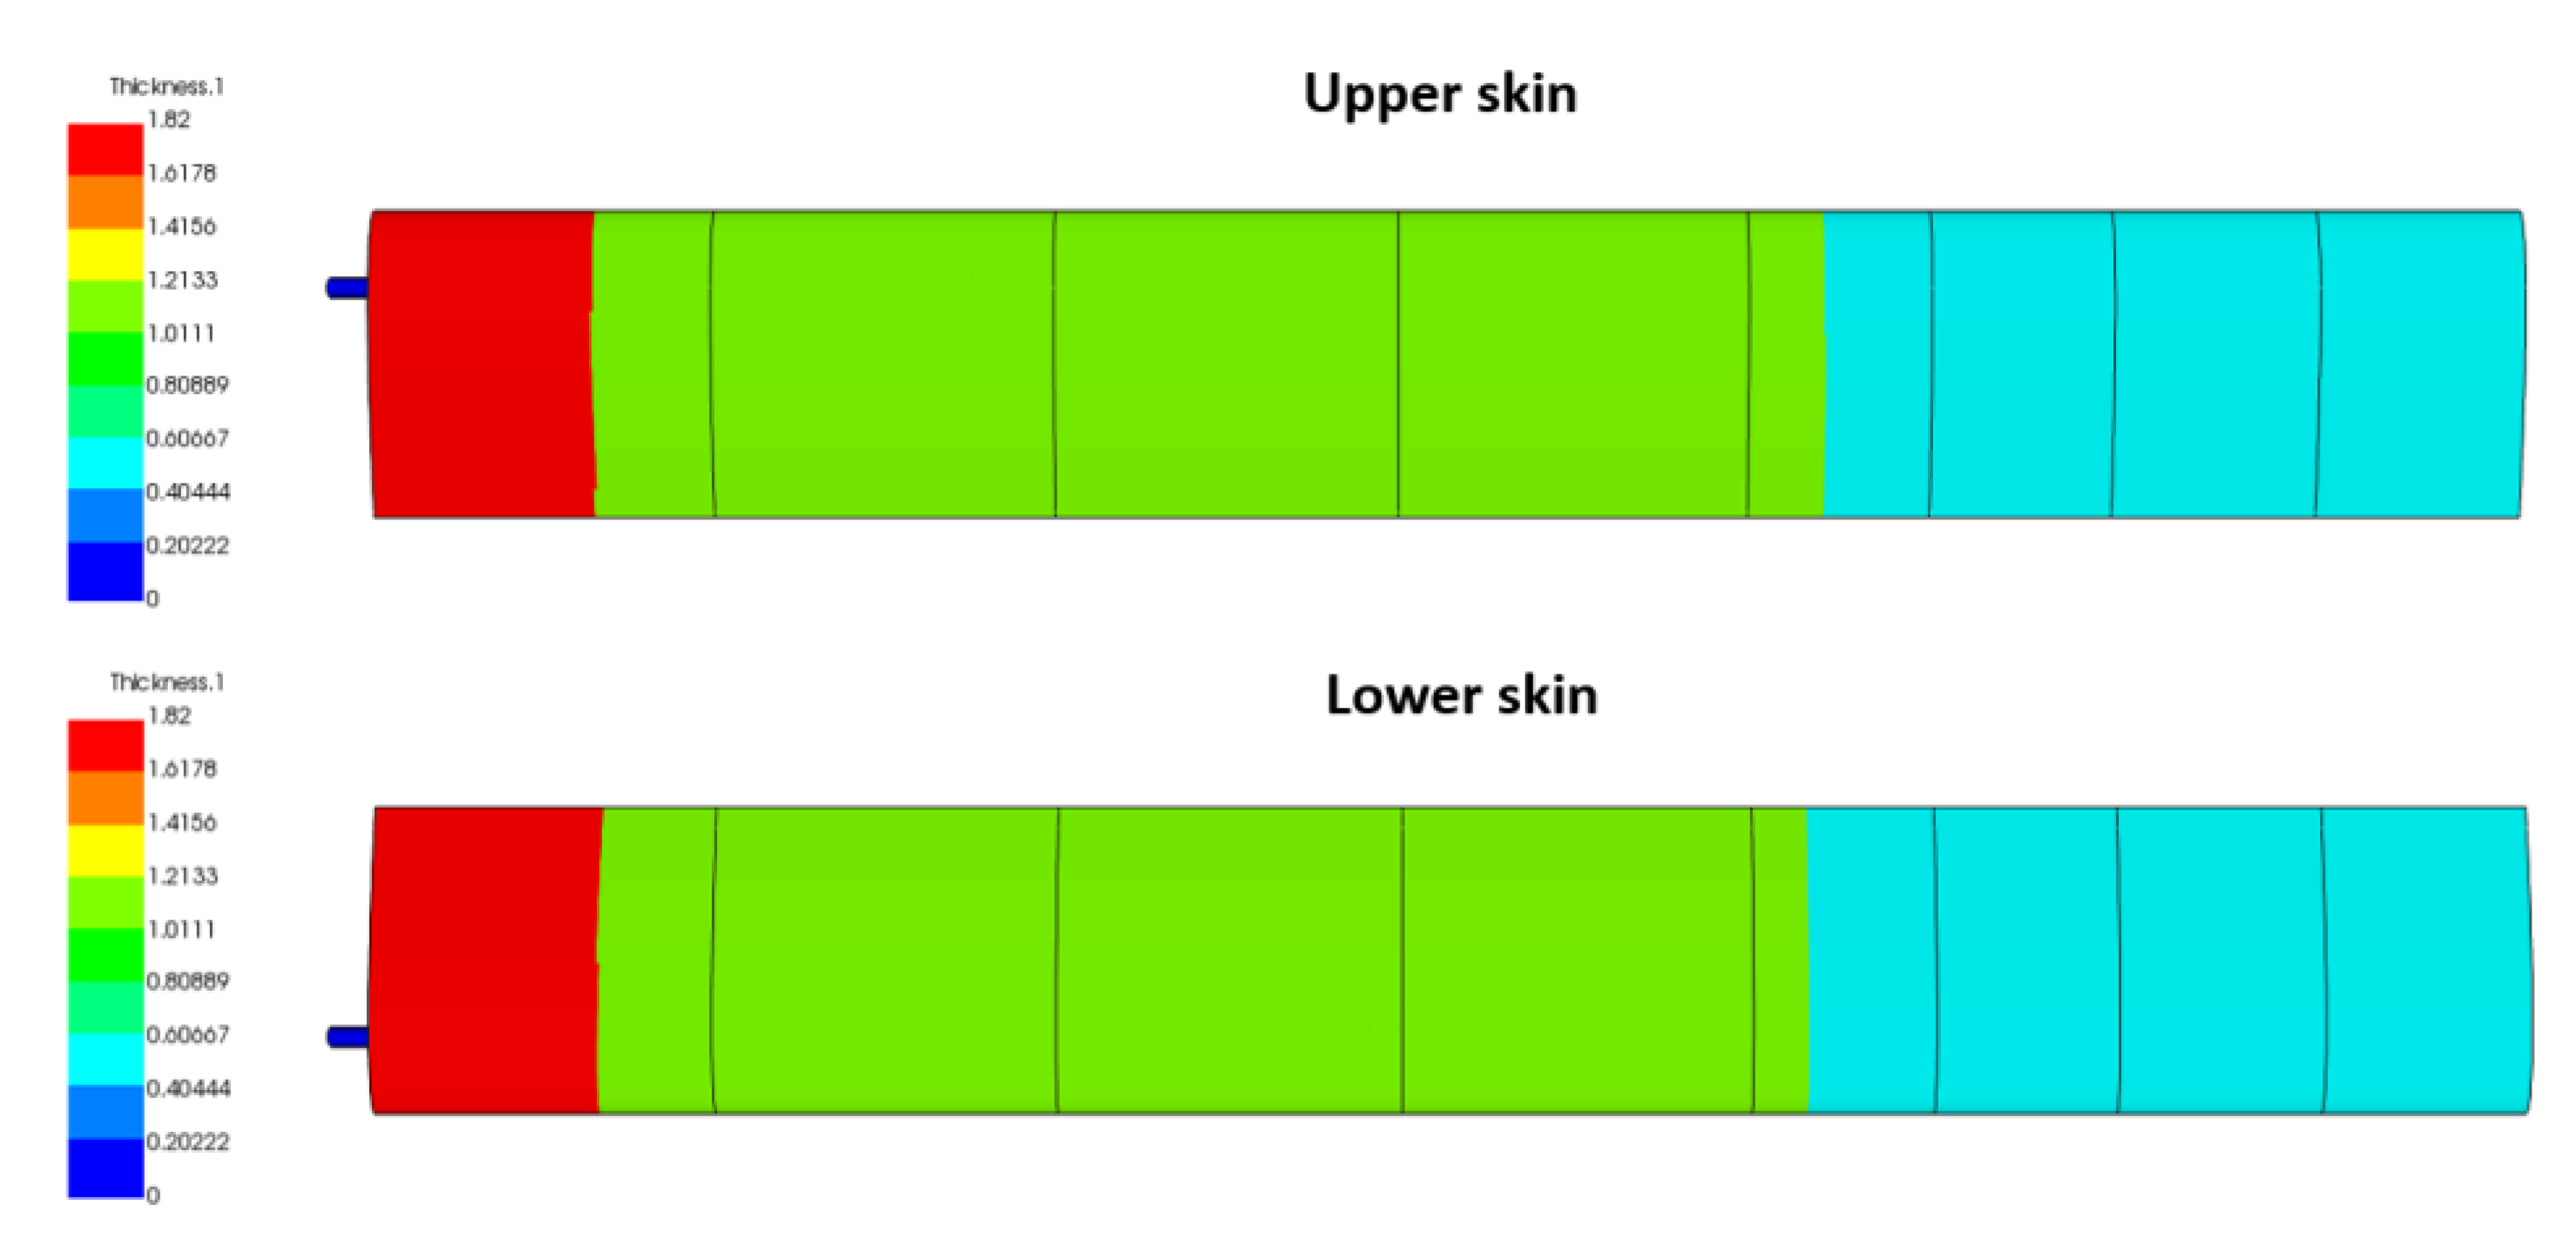
6.2.2. Thickness Distribution of the Optimized Wing
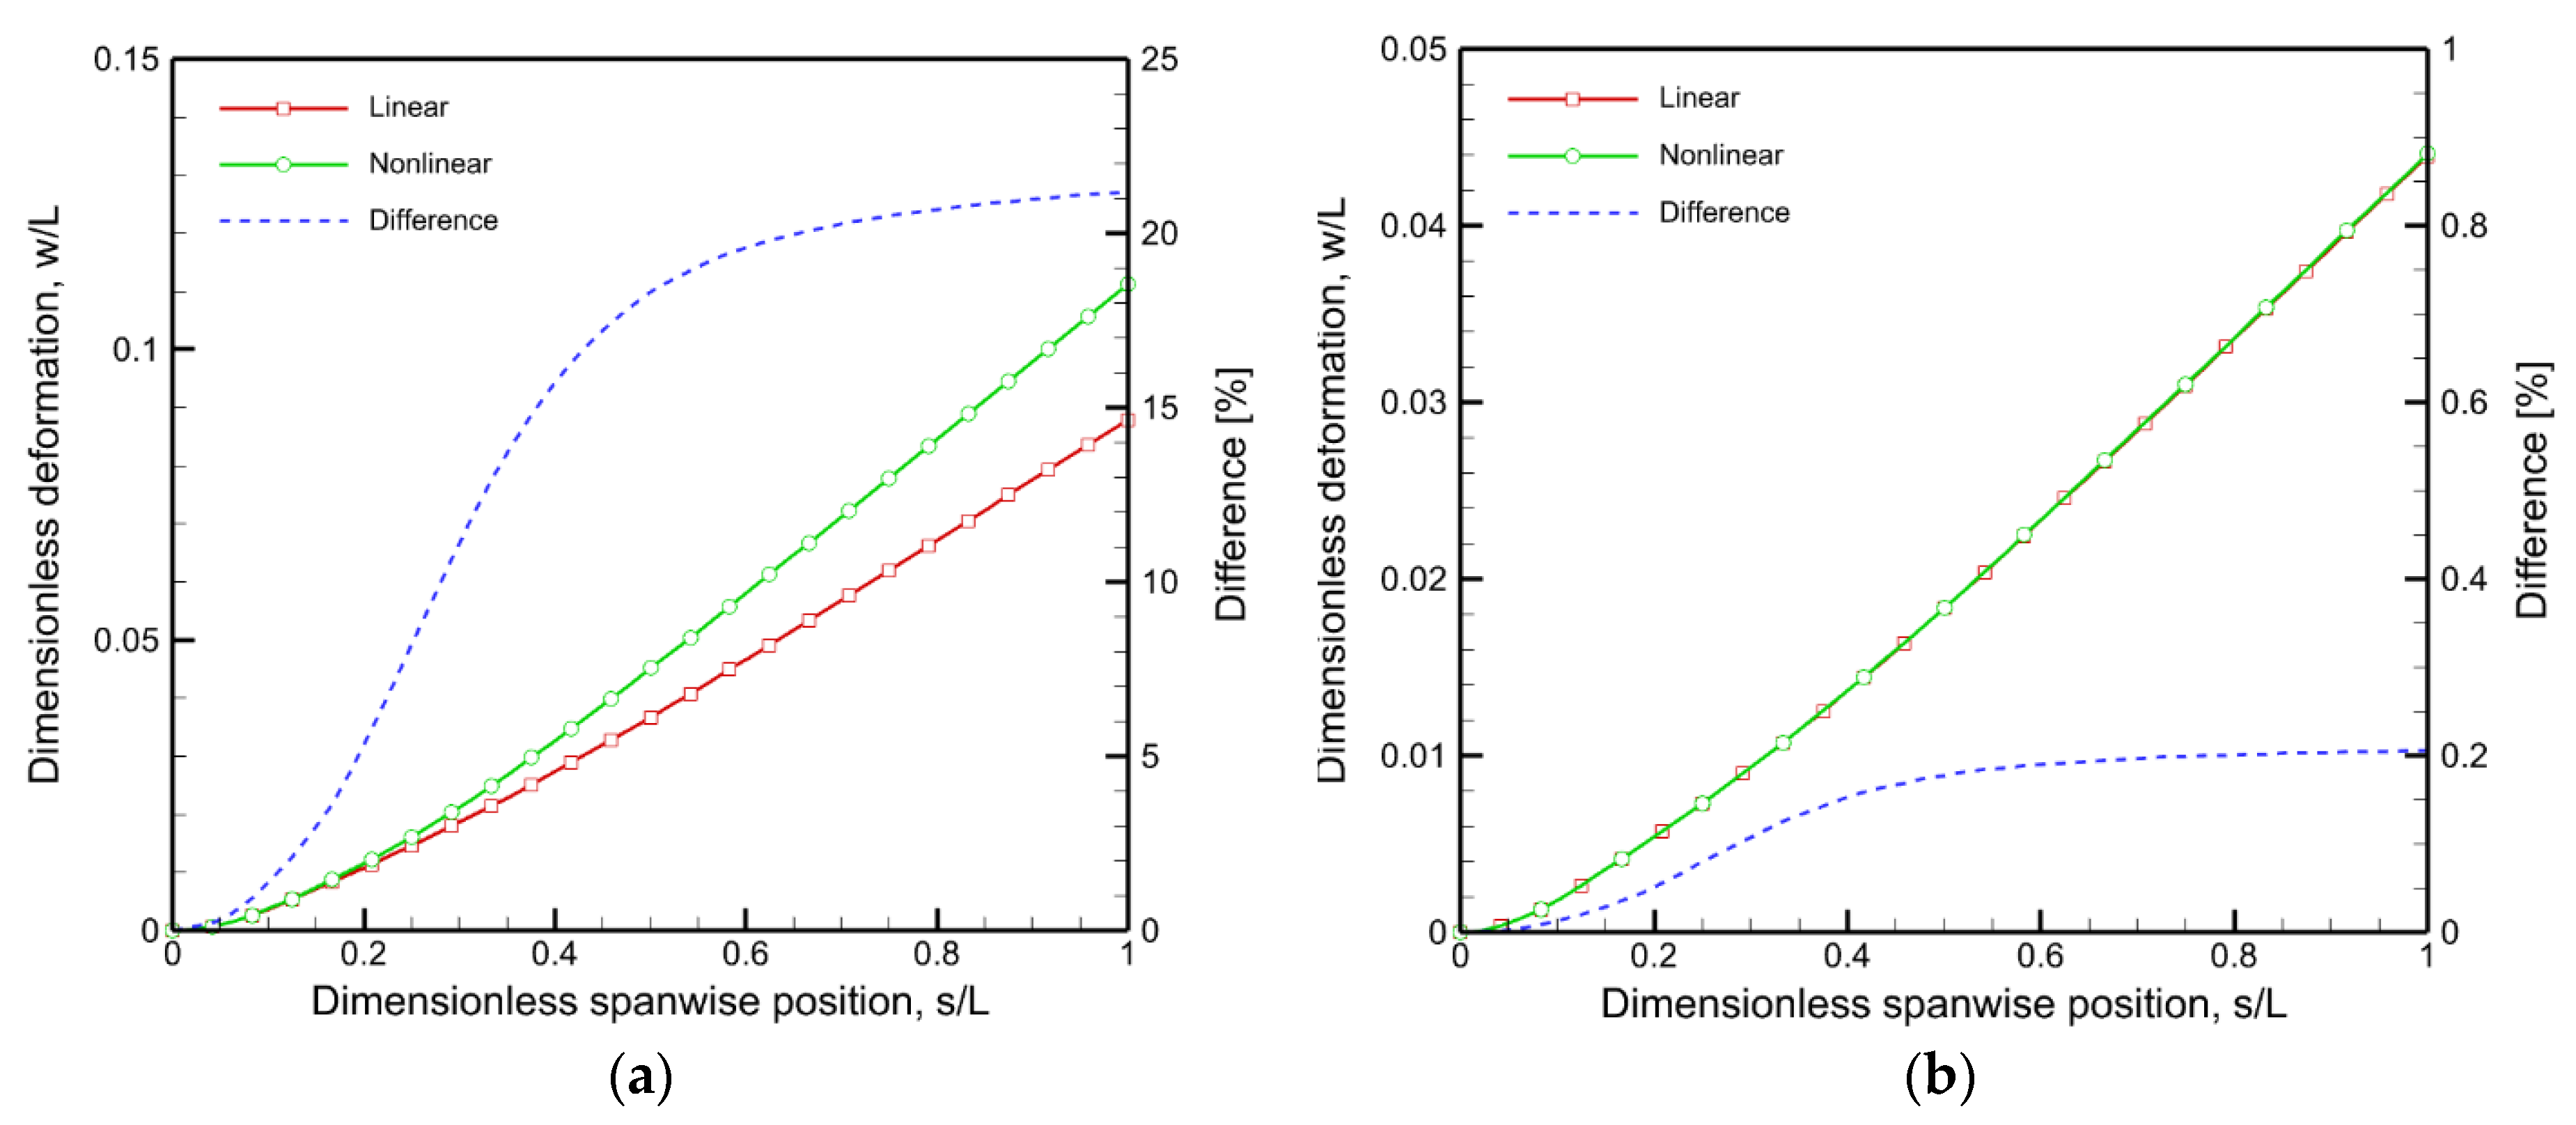
6.2.3. Static Flapwise Deformation of the Optimized Wing
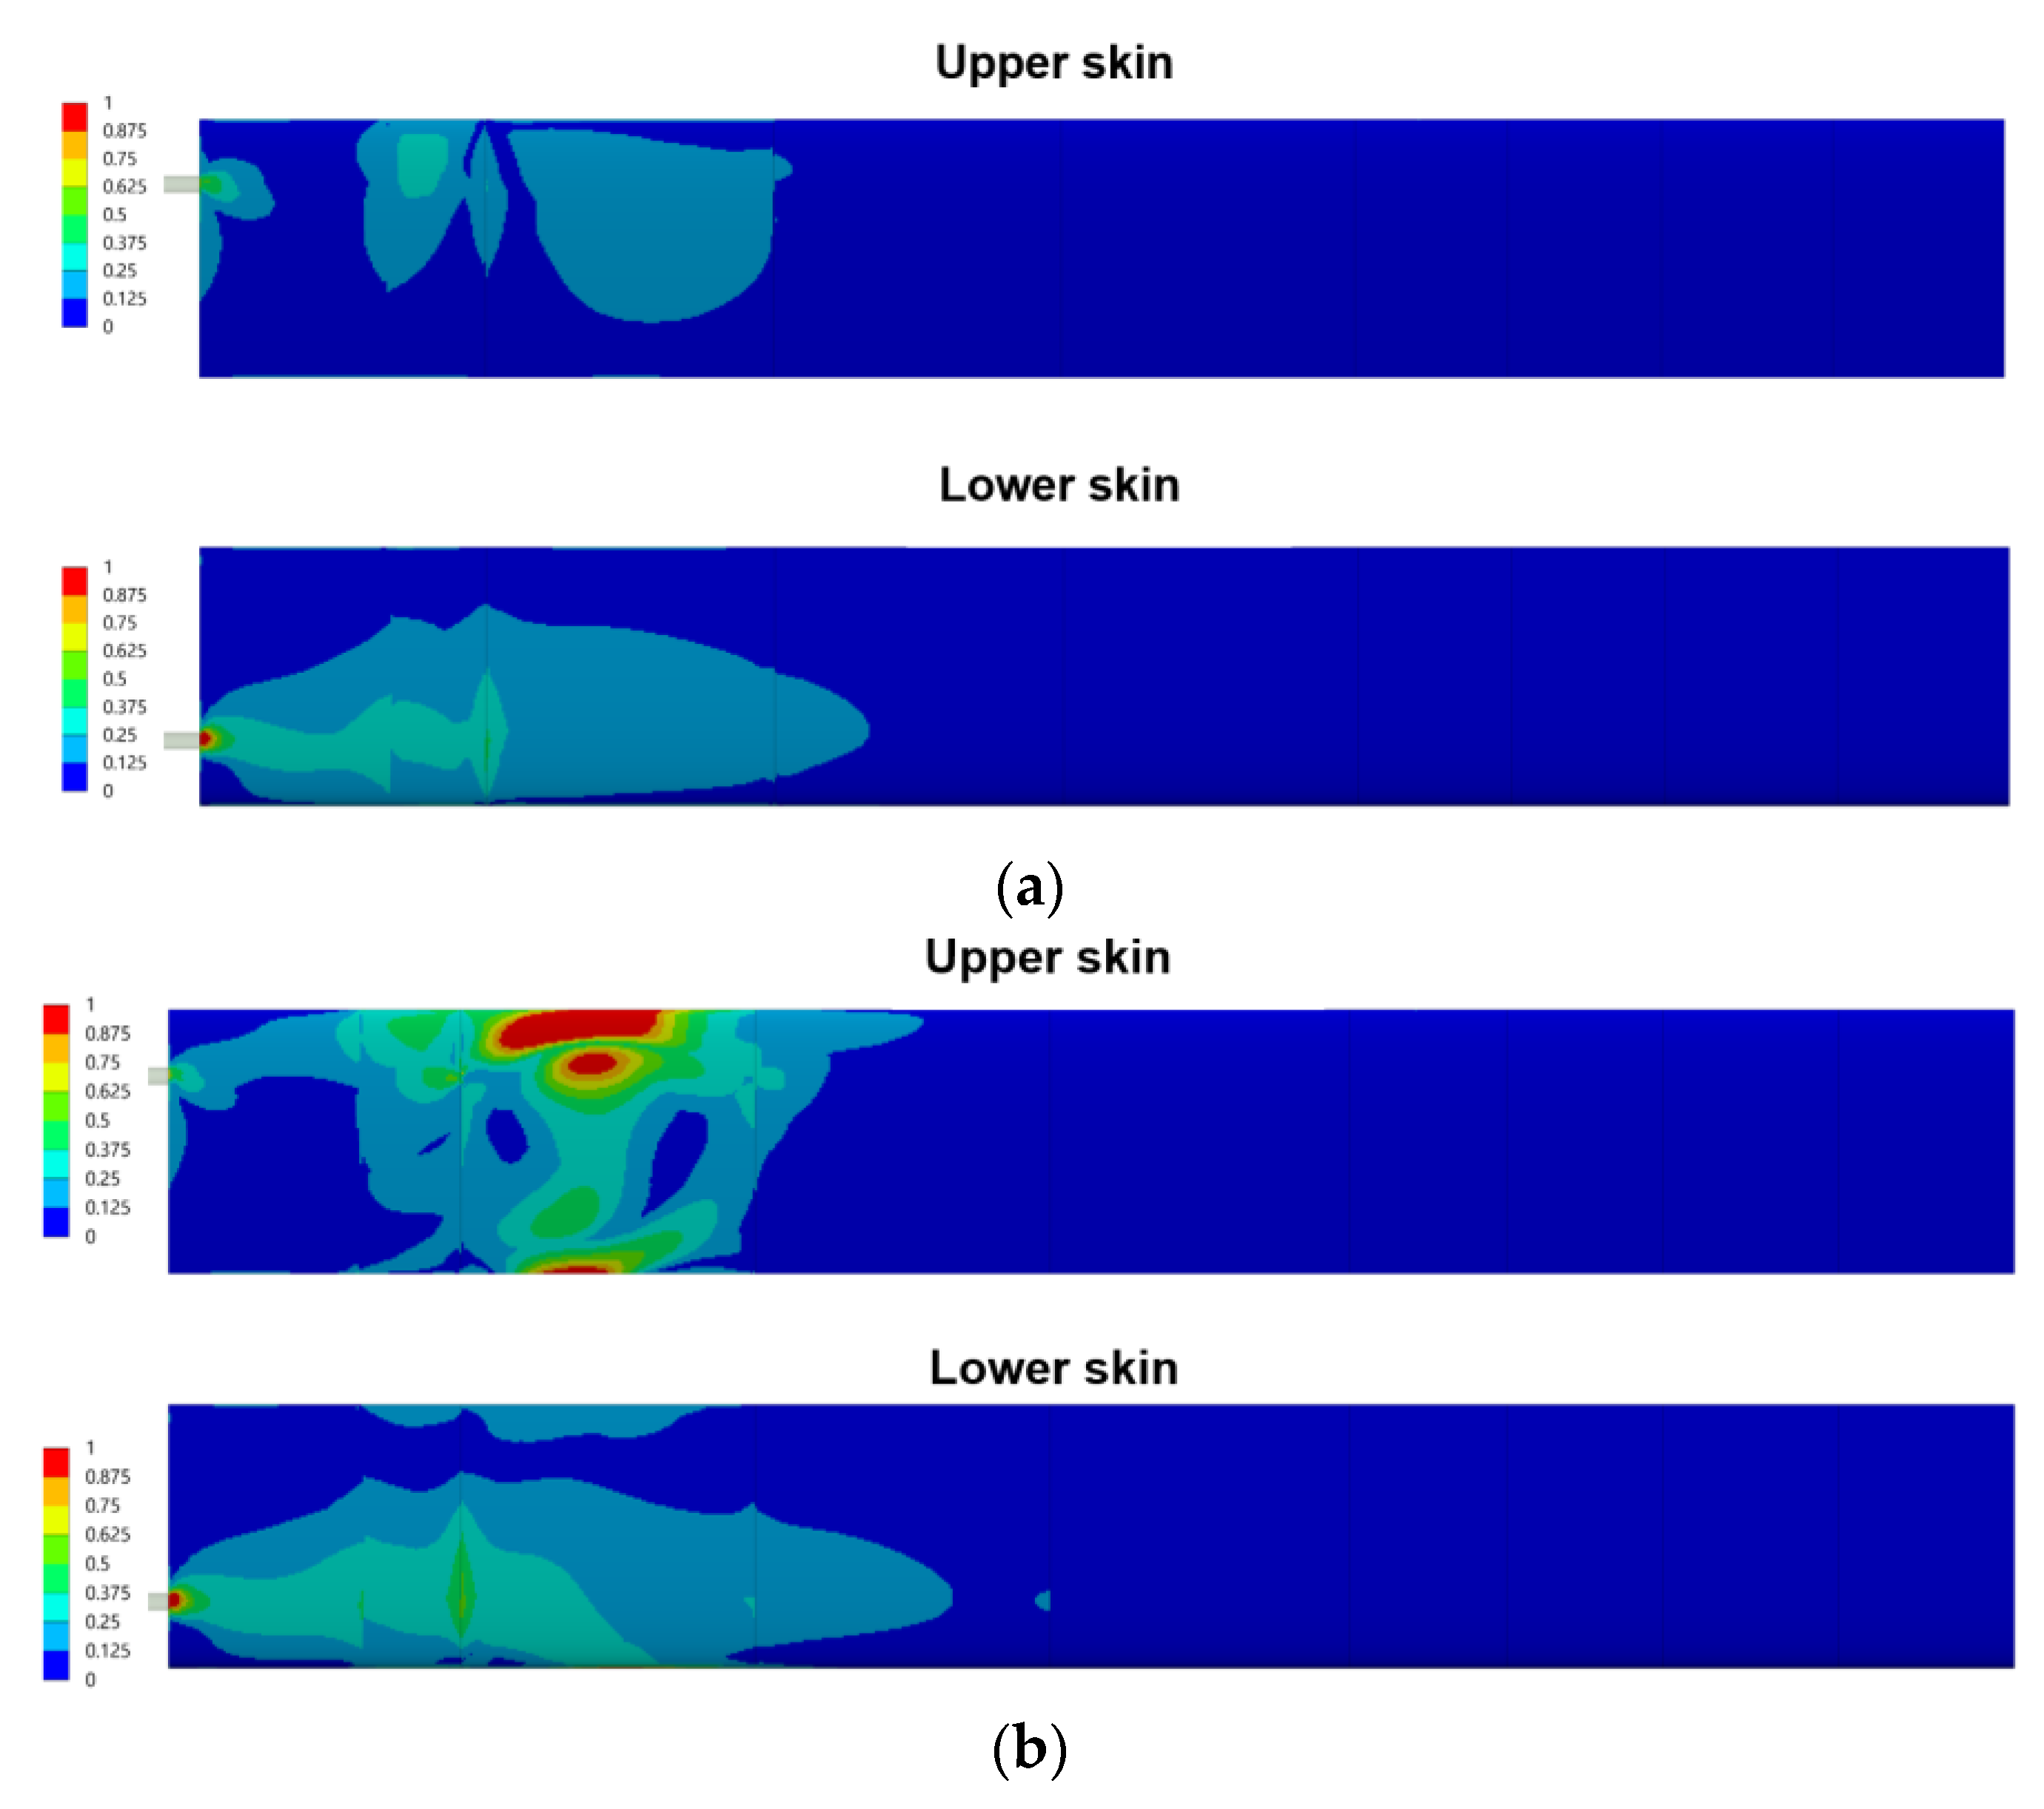
6.2.4. Inverse Reverse Factor (IRF) and Buckling Distribution of the Optimized Wing
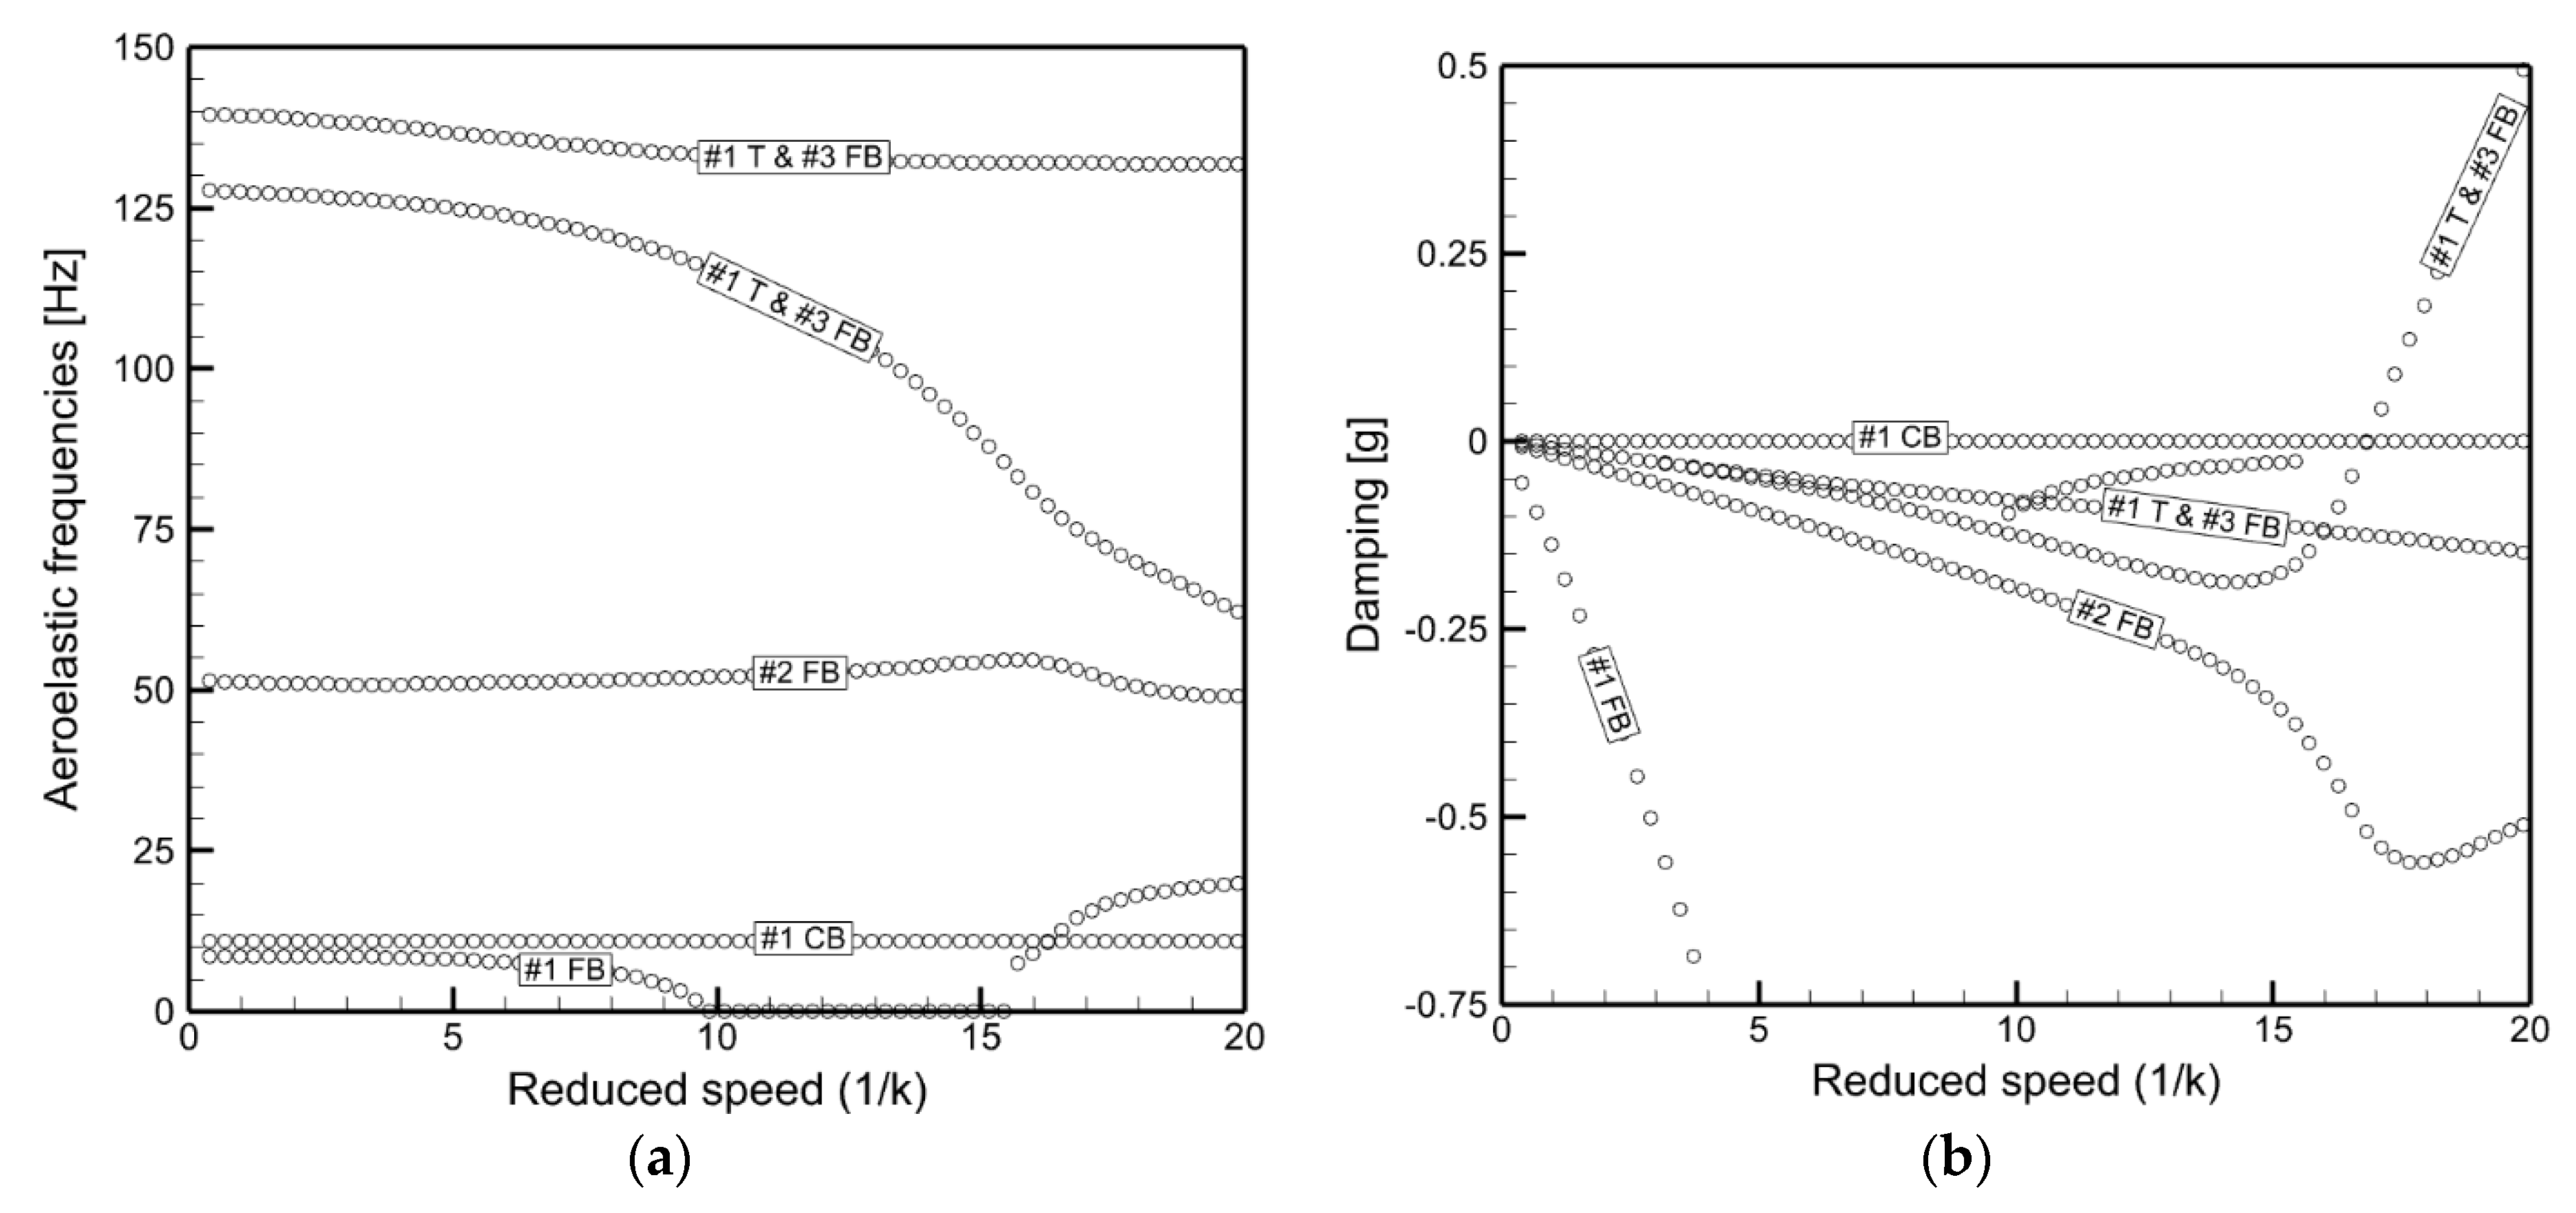
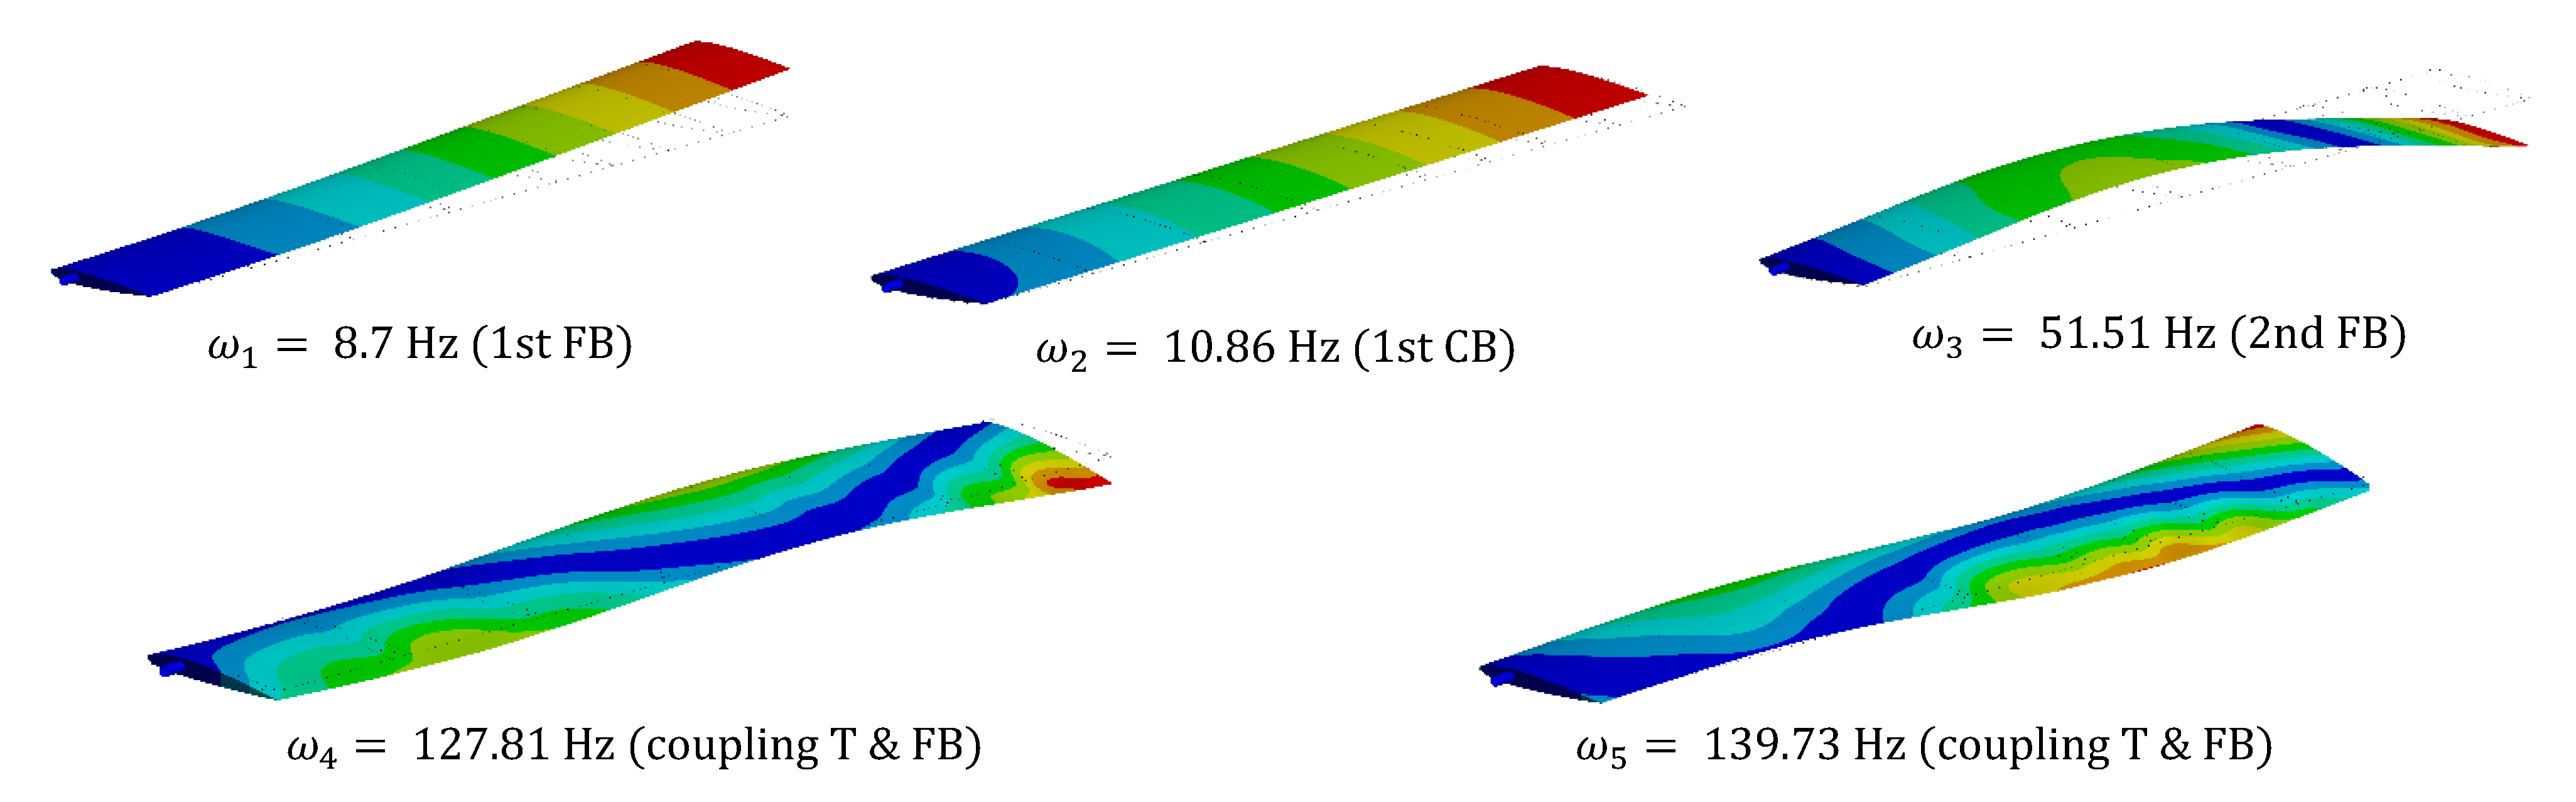
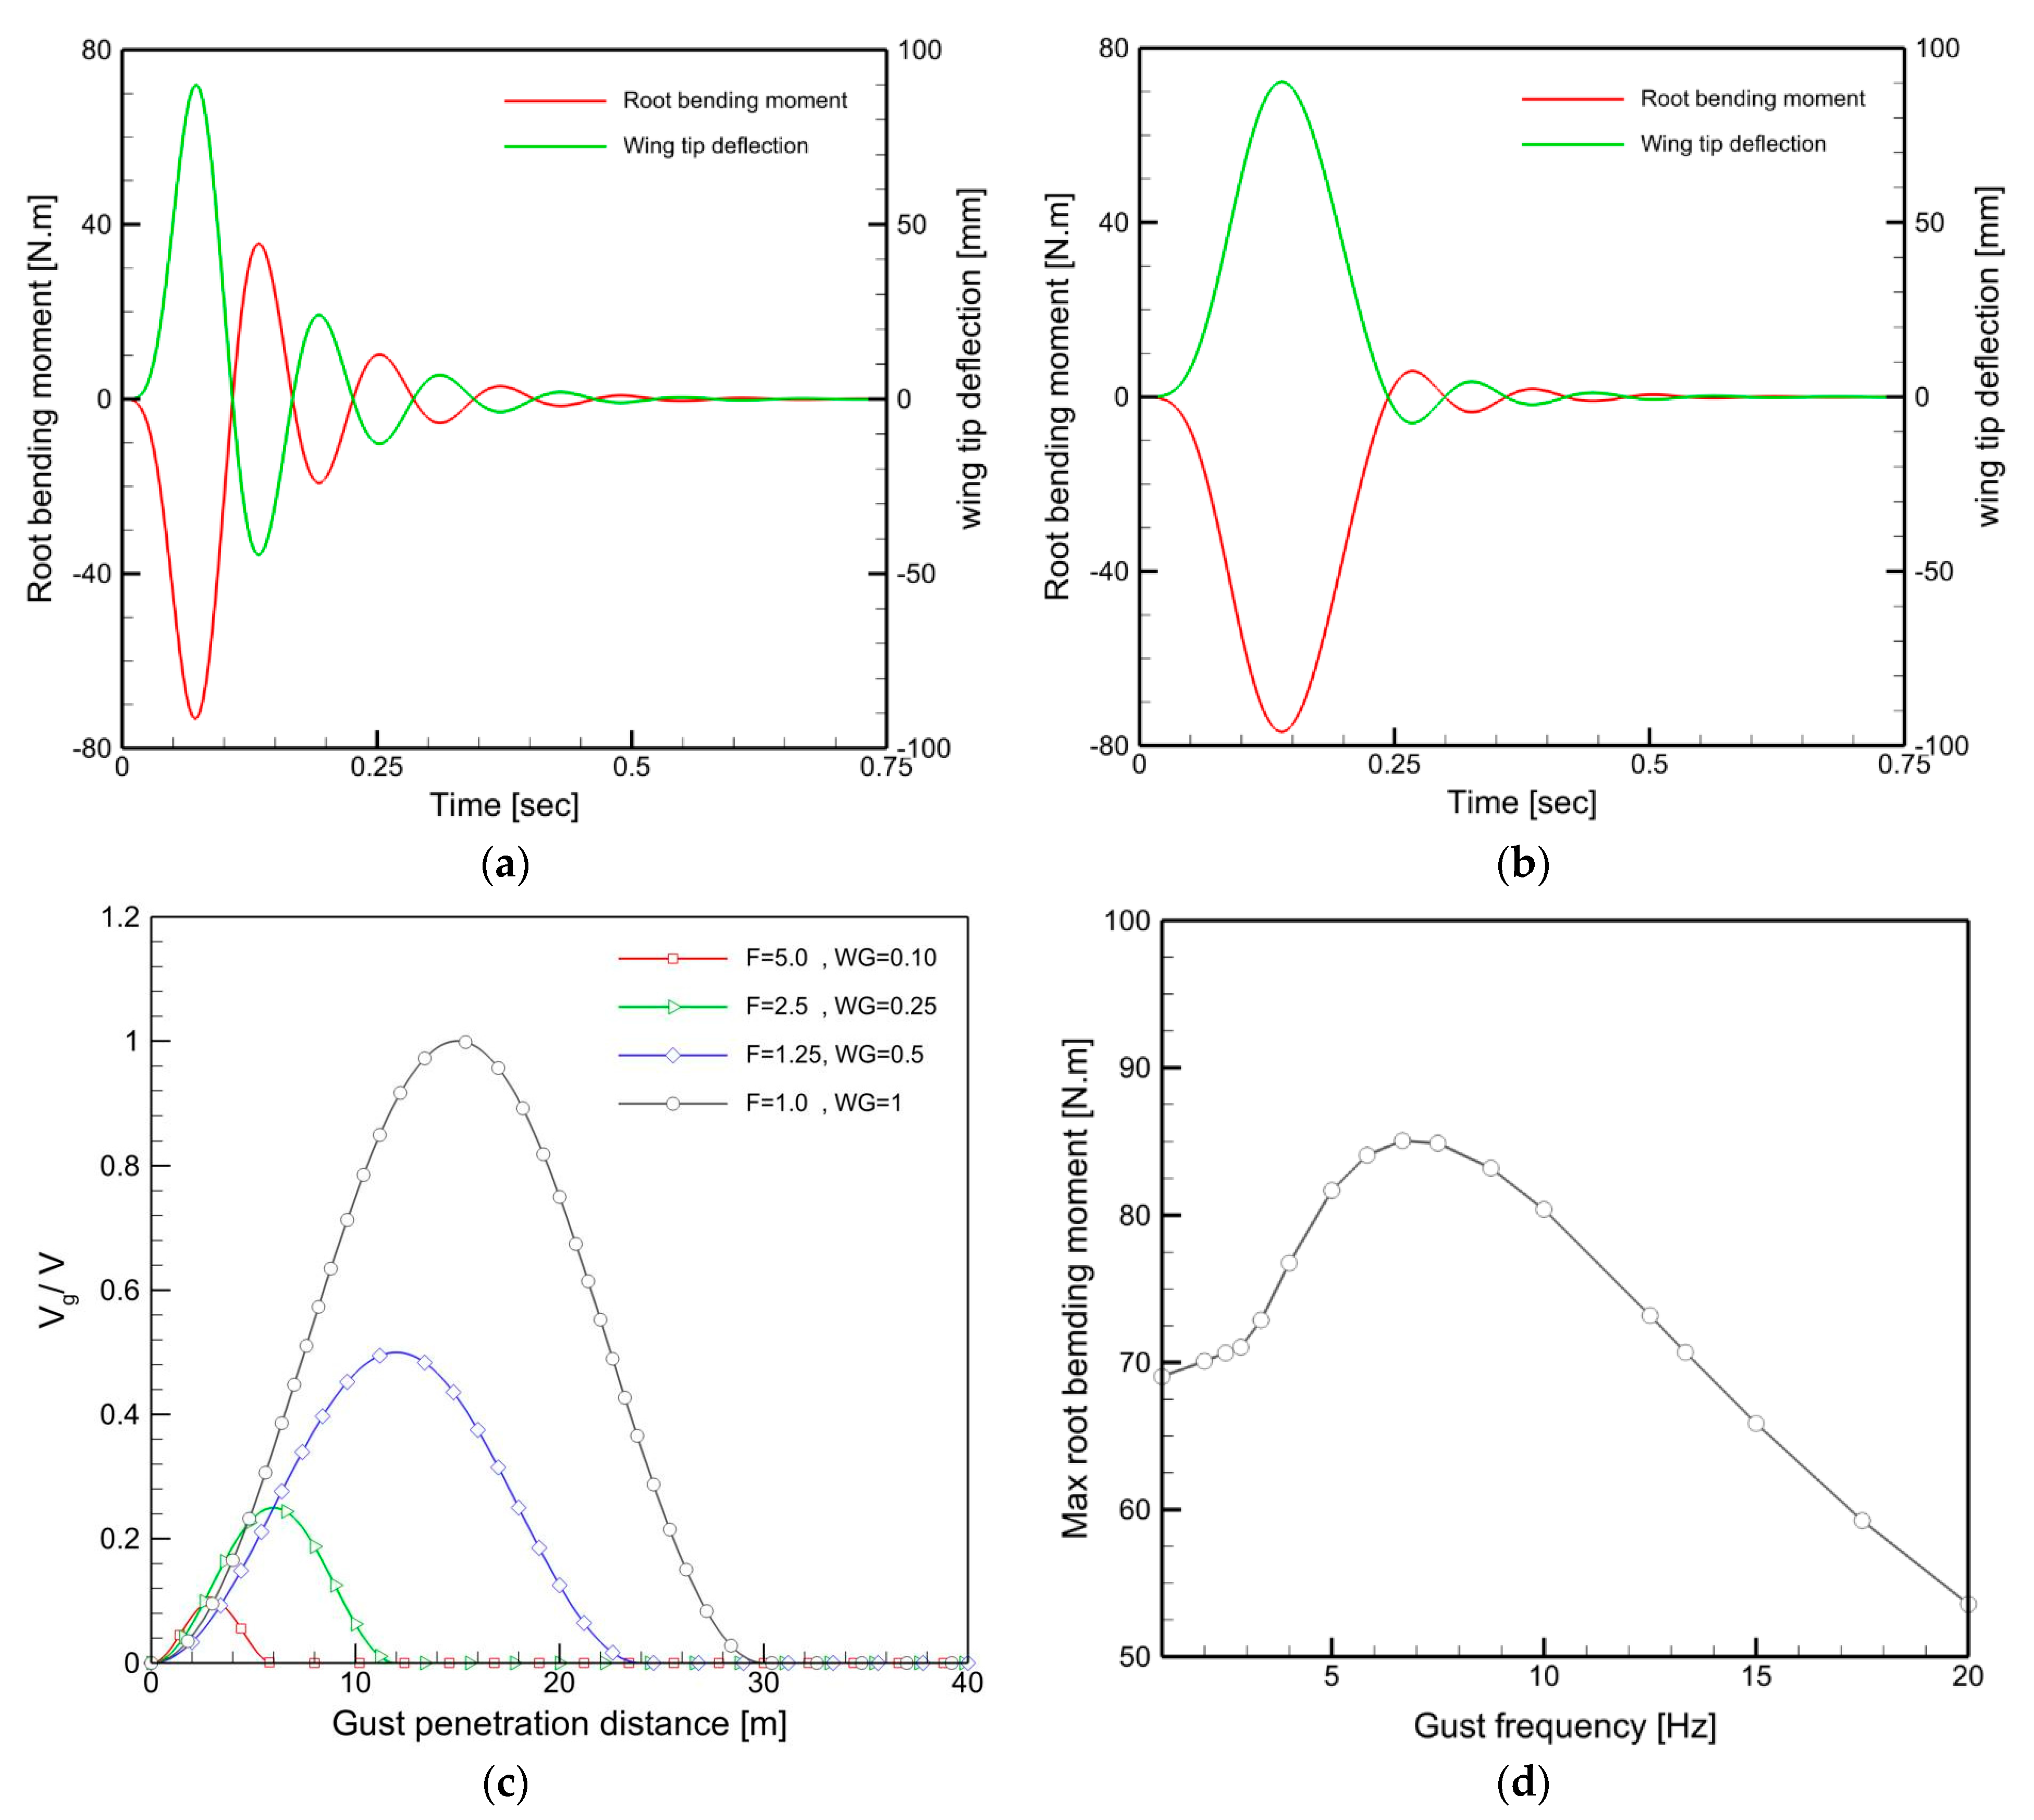
6.2.5. Structural Dynamic, Aeroelastic Instability, and Gust Response
7. Experimental Results and Discussions
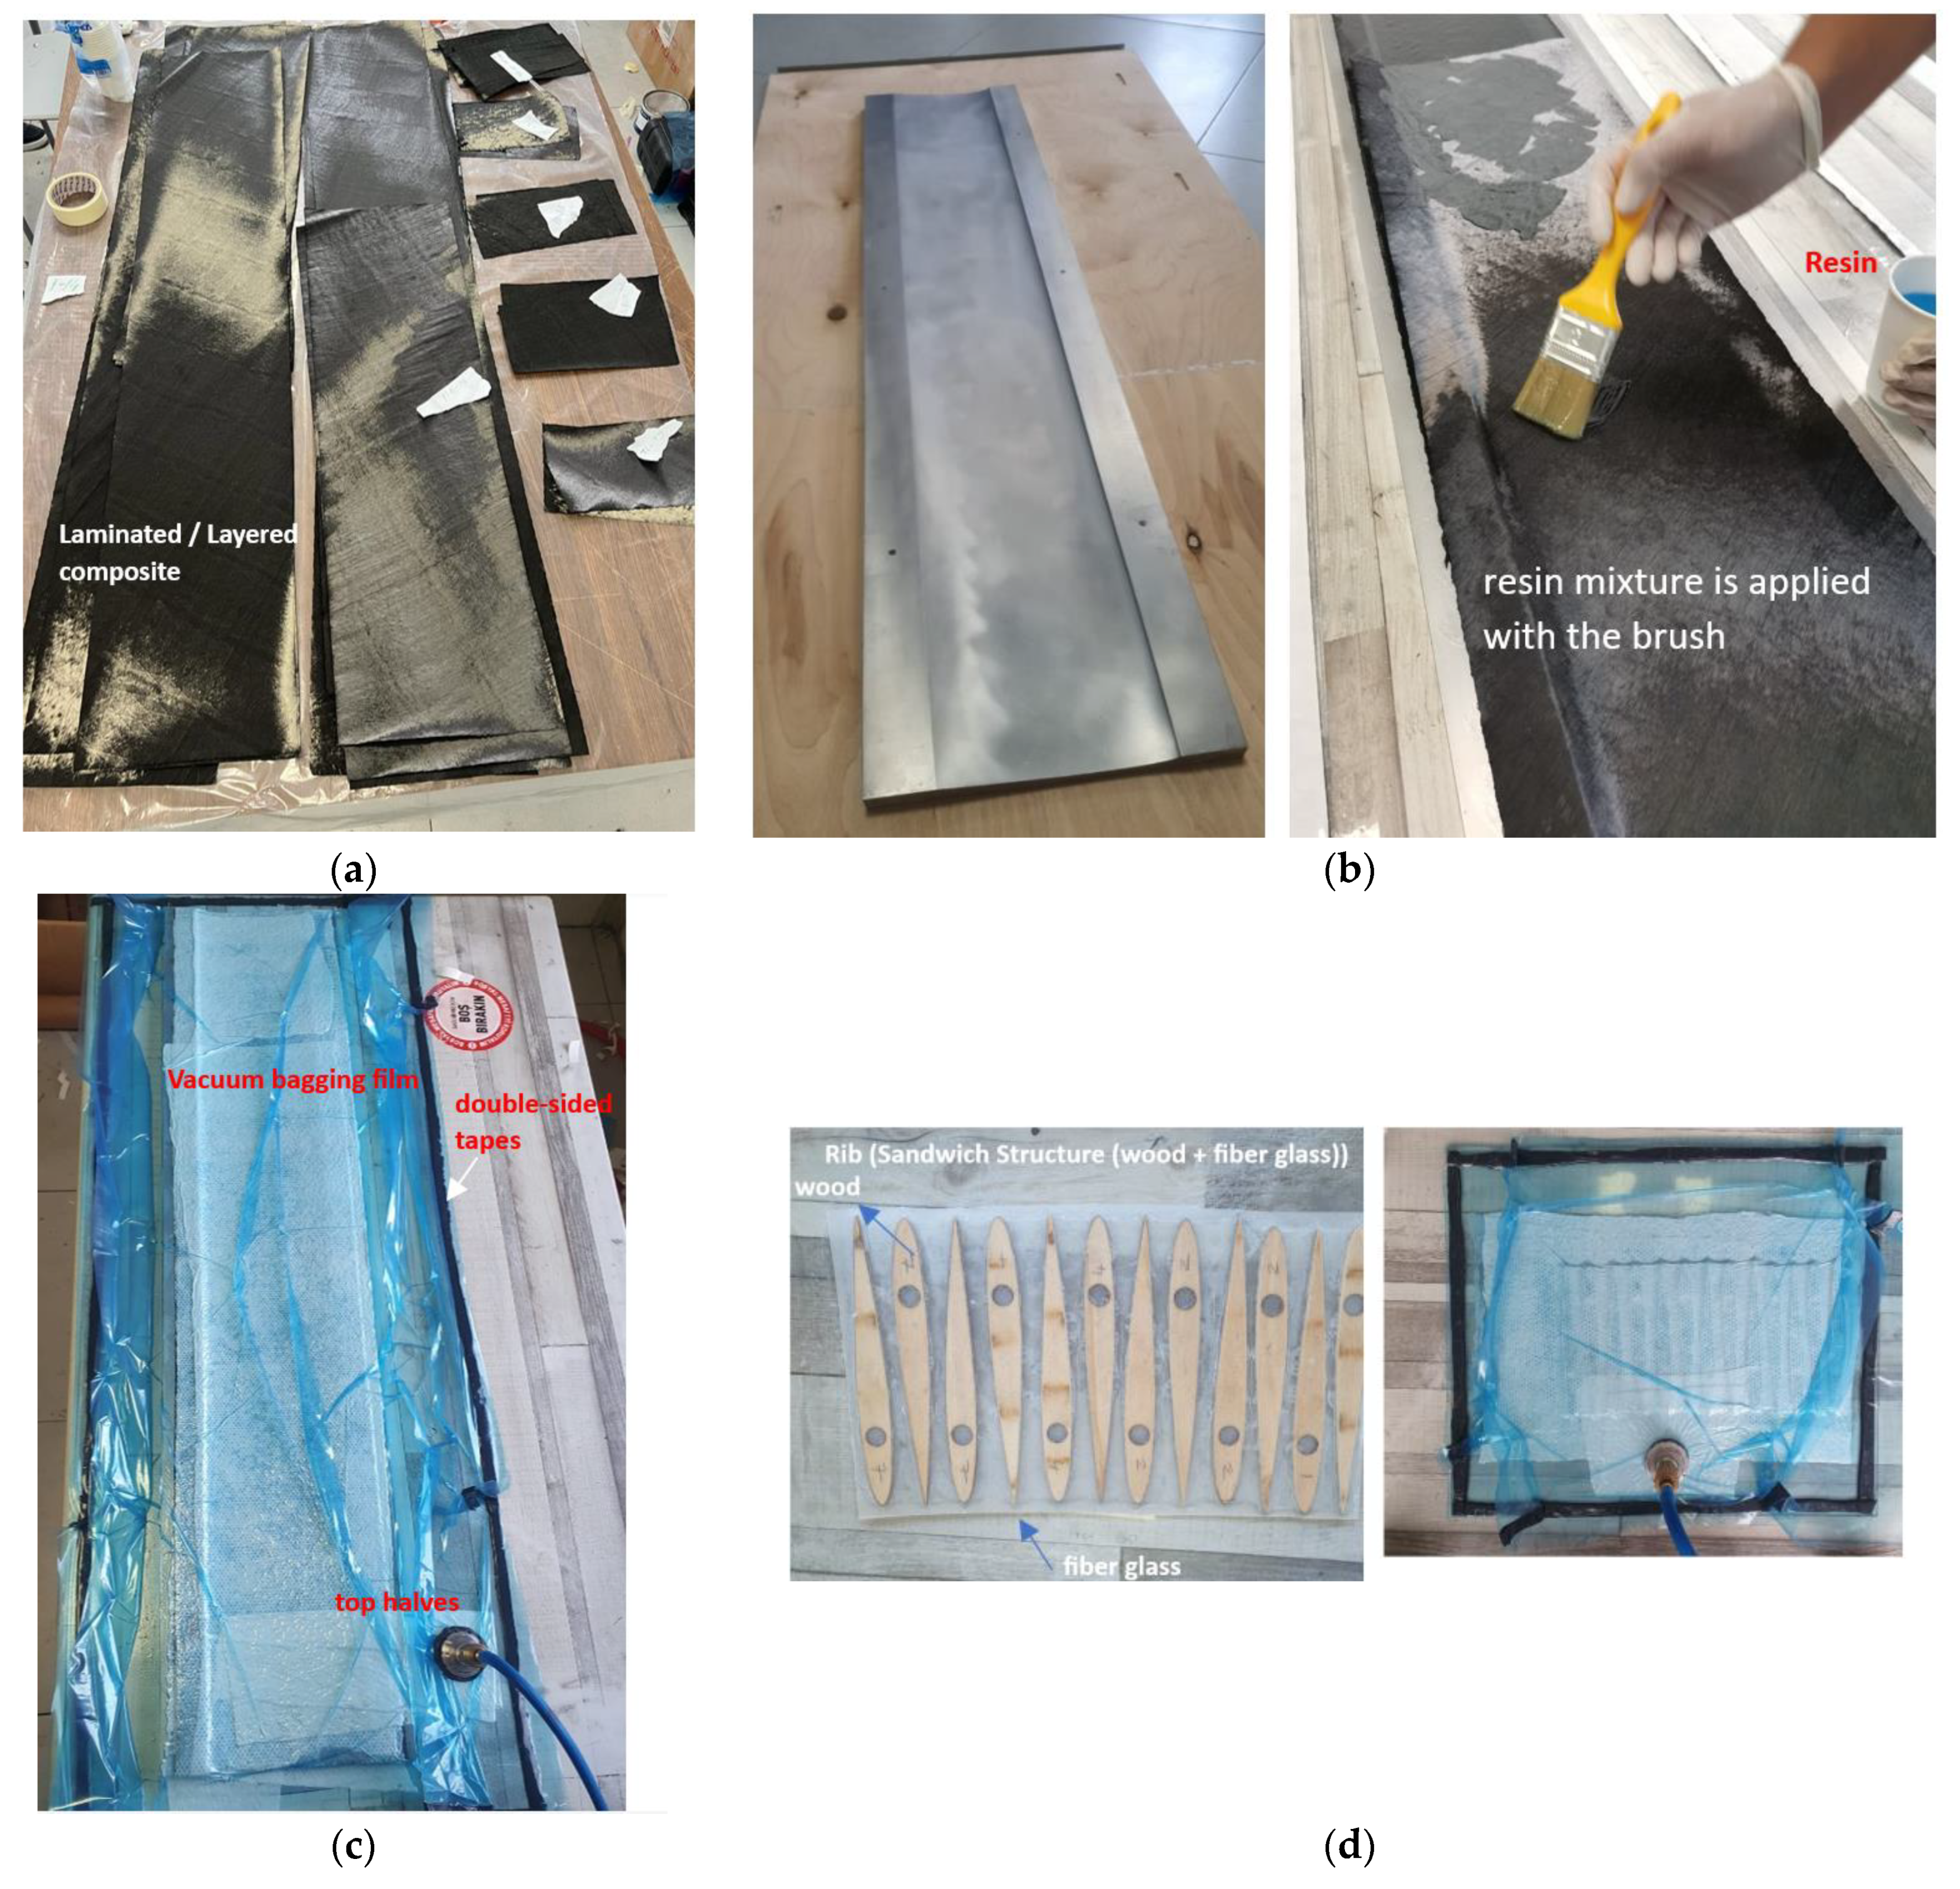
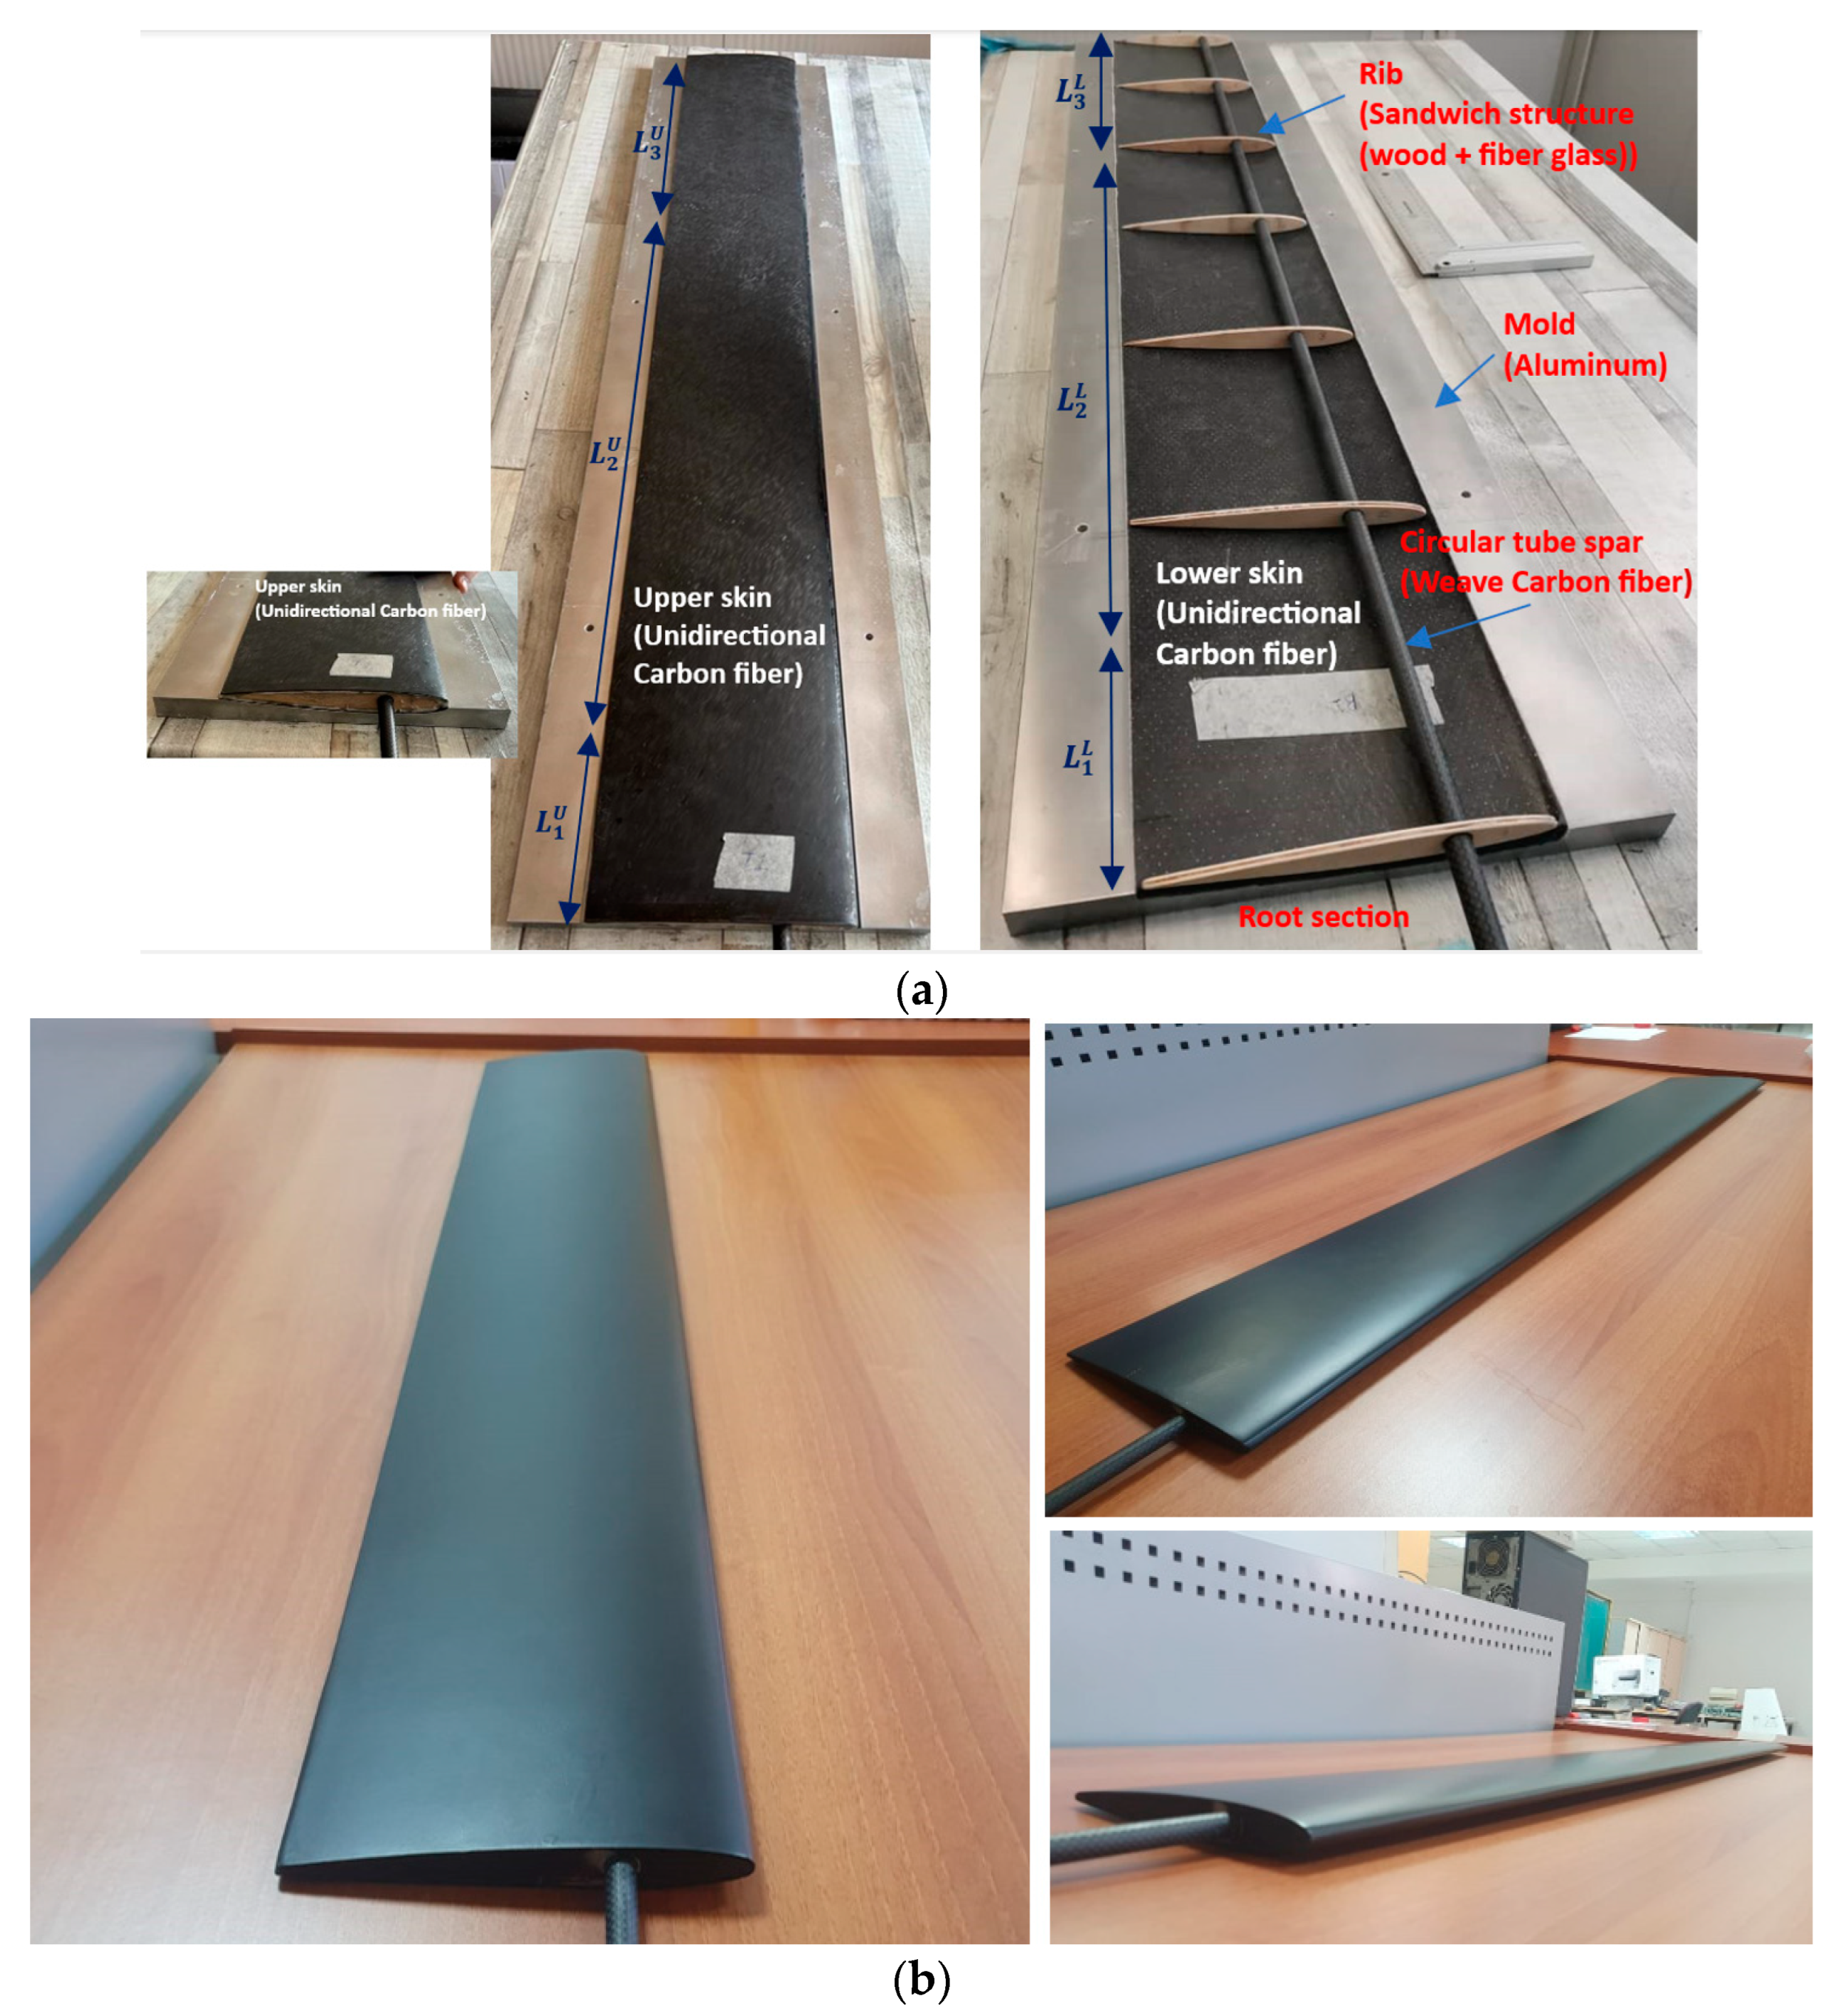
7.1. Manufacturing of the Optimized Composite Wing
7.2. Assembling the Manufactured Parts
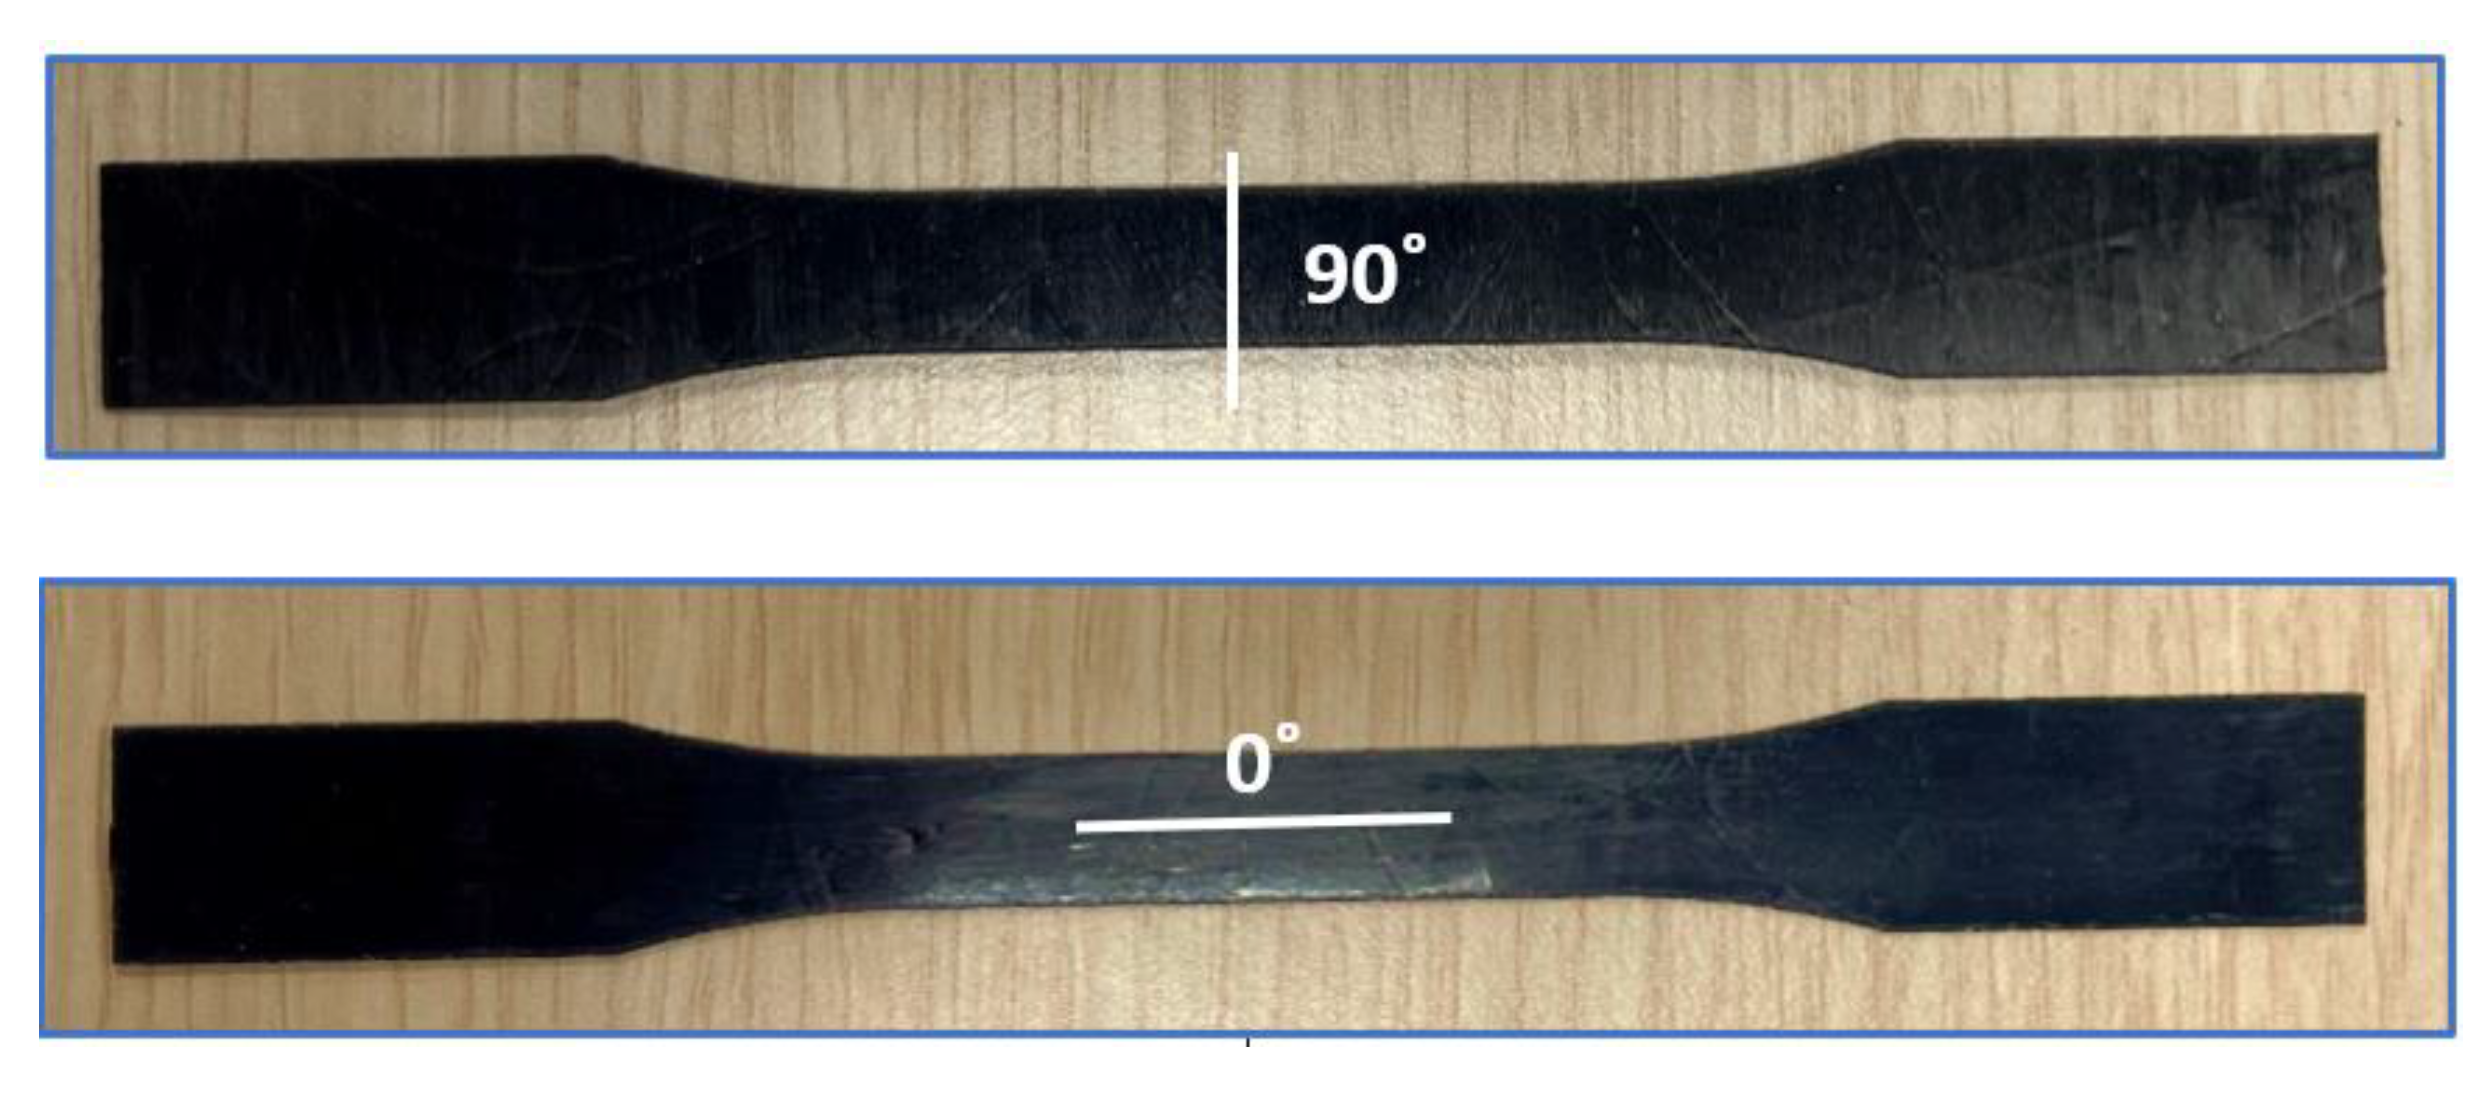
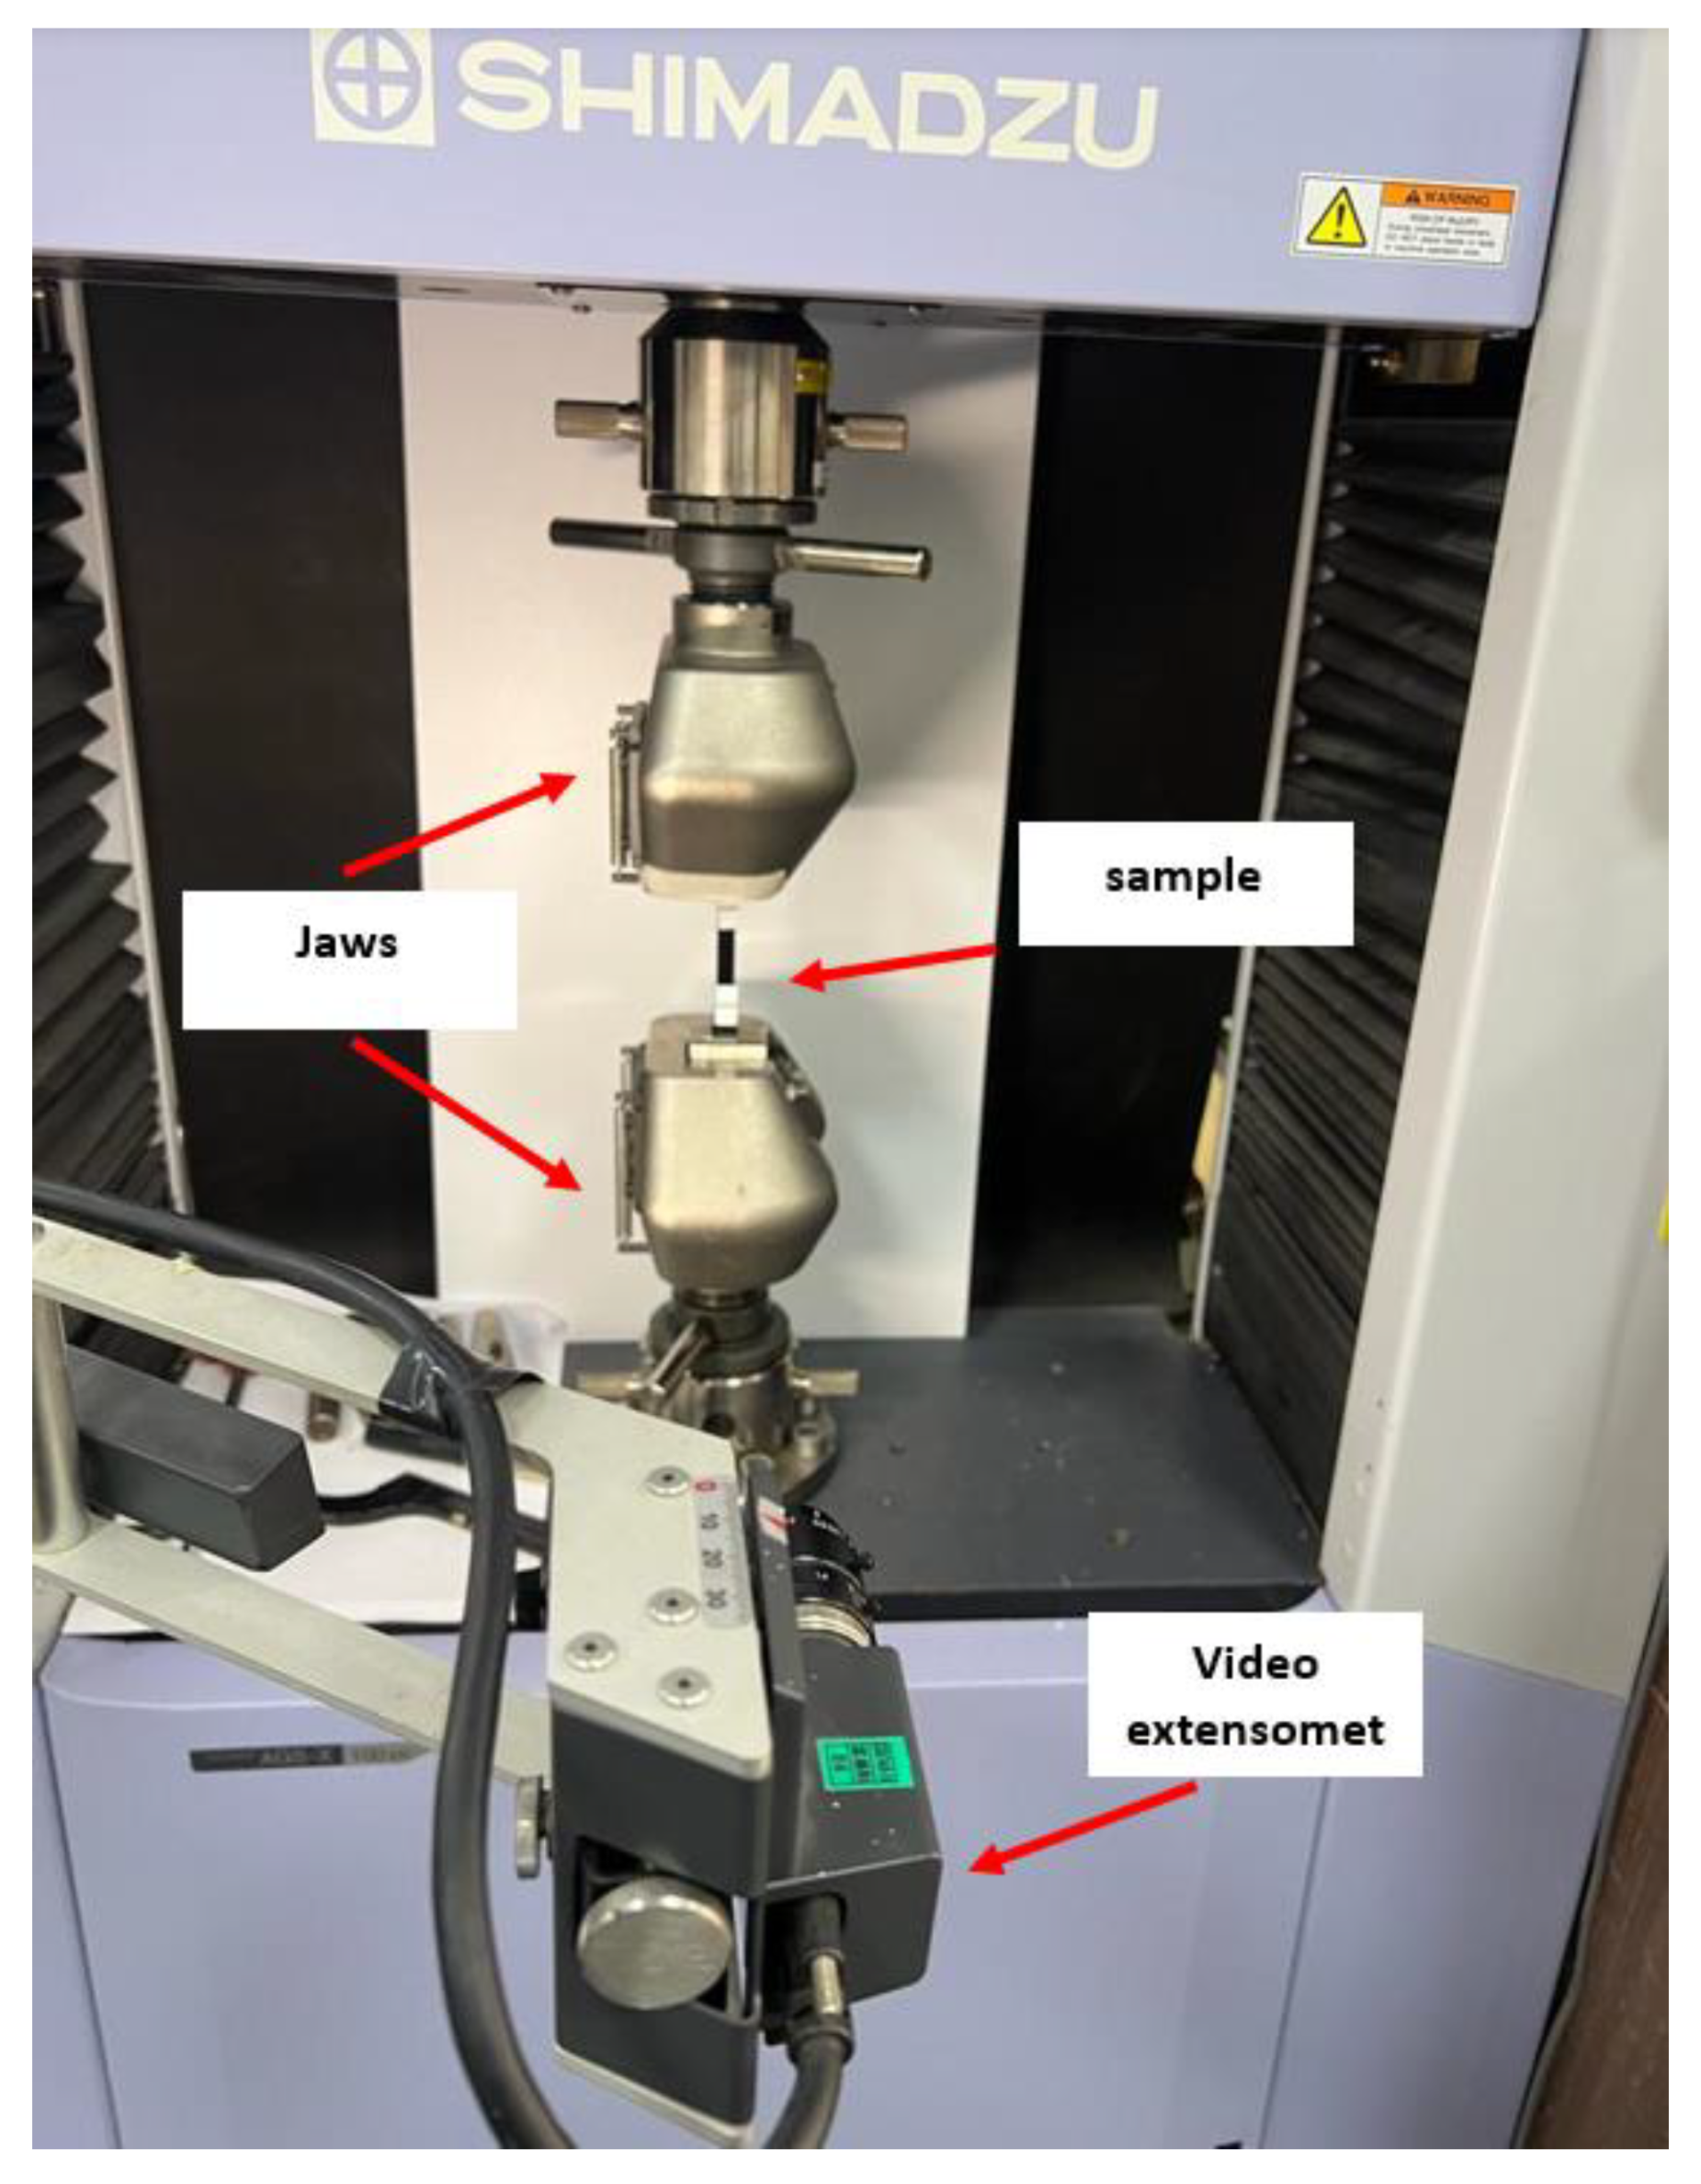
7.3. Characterization of the Materials Used in the Composite Wing
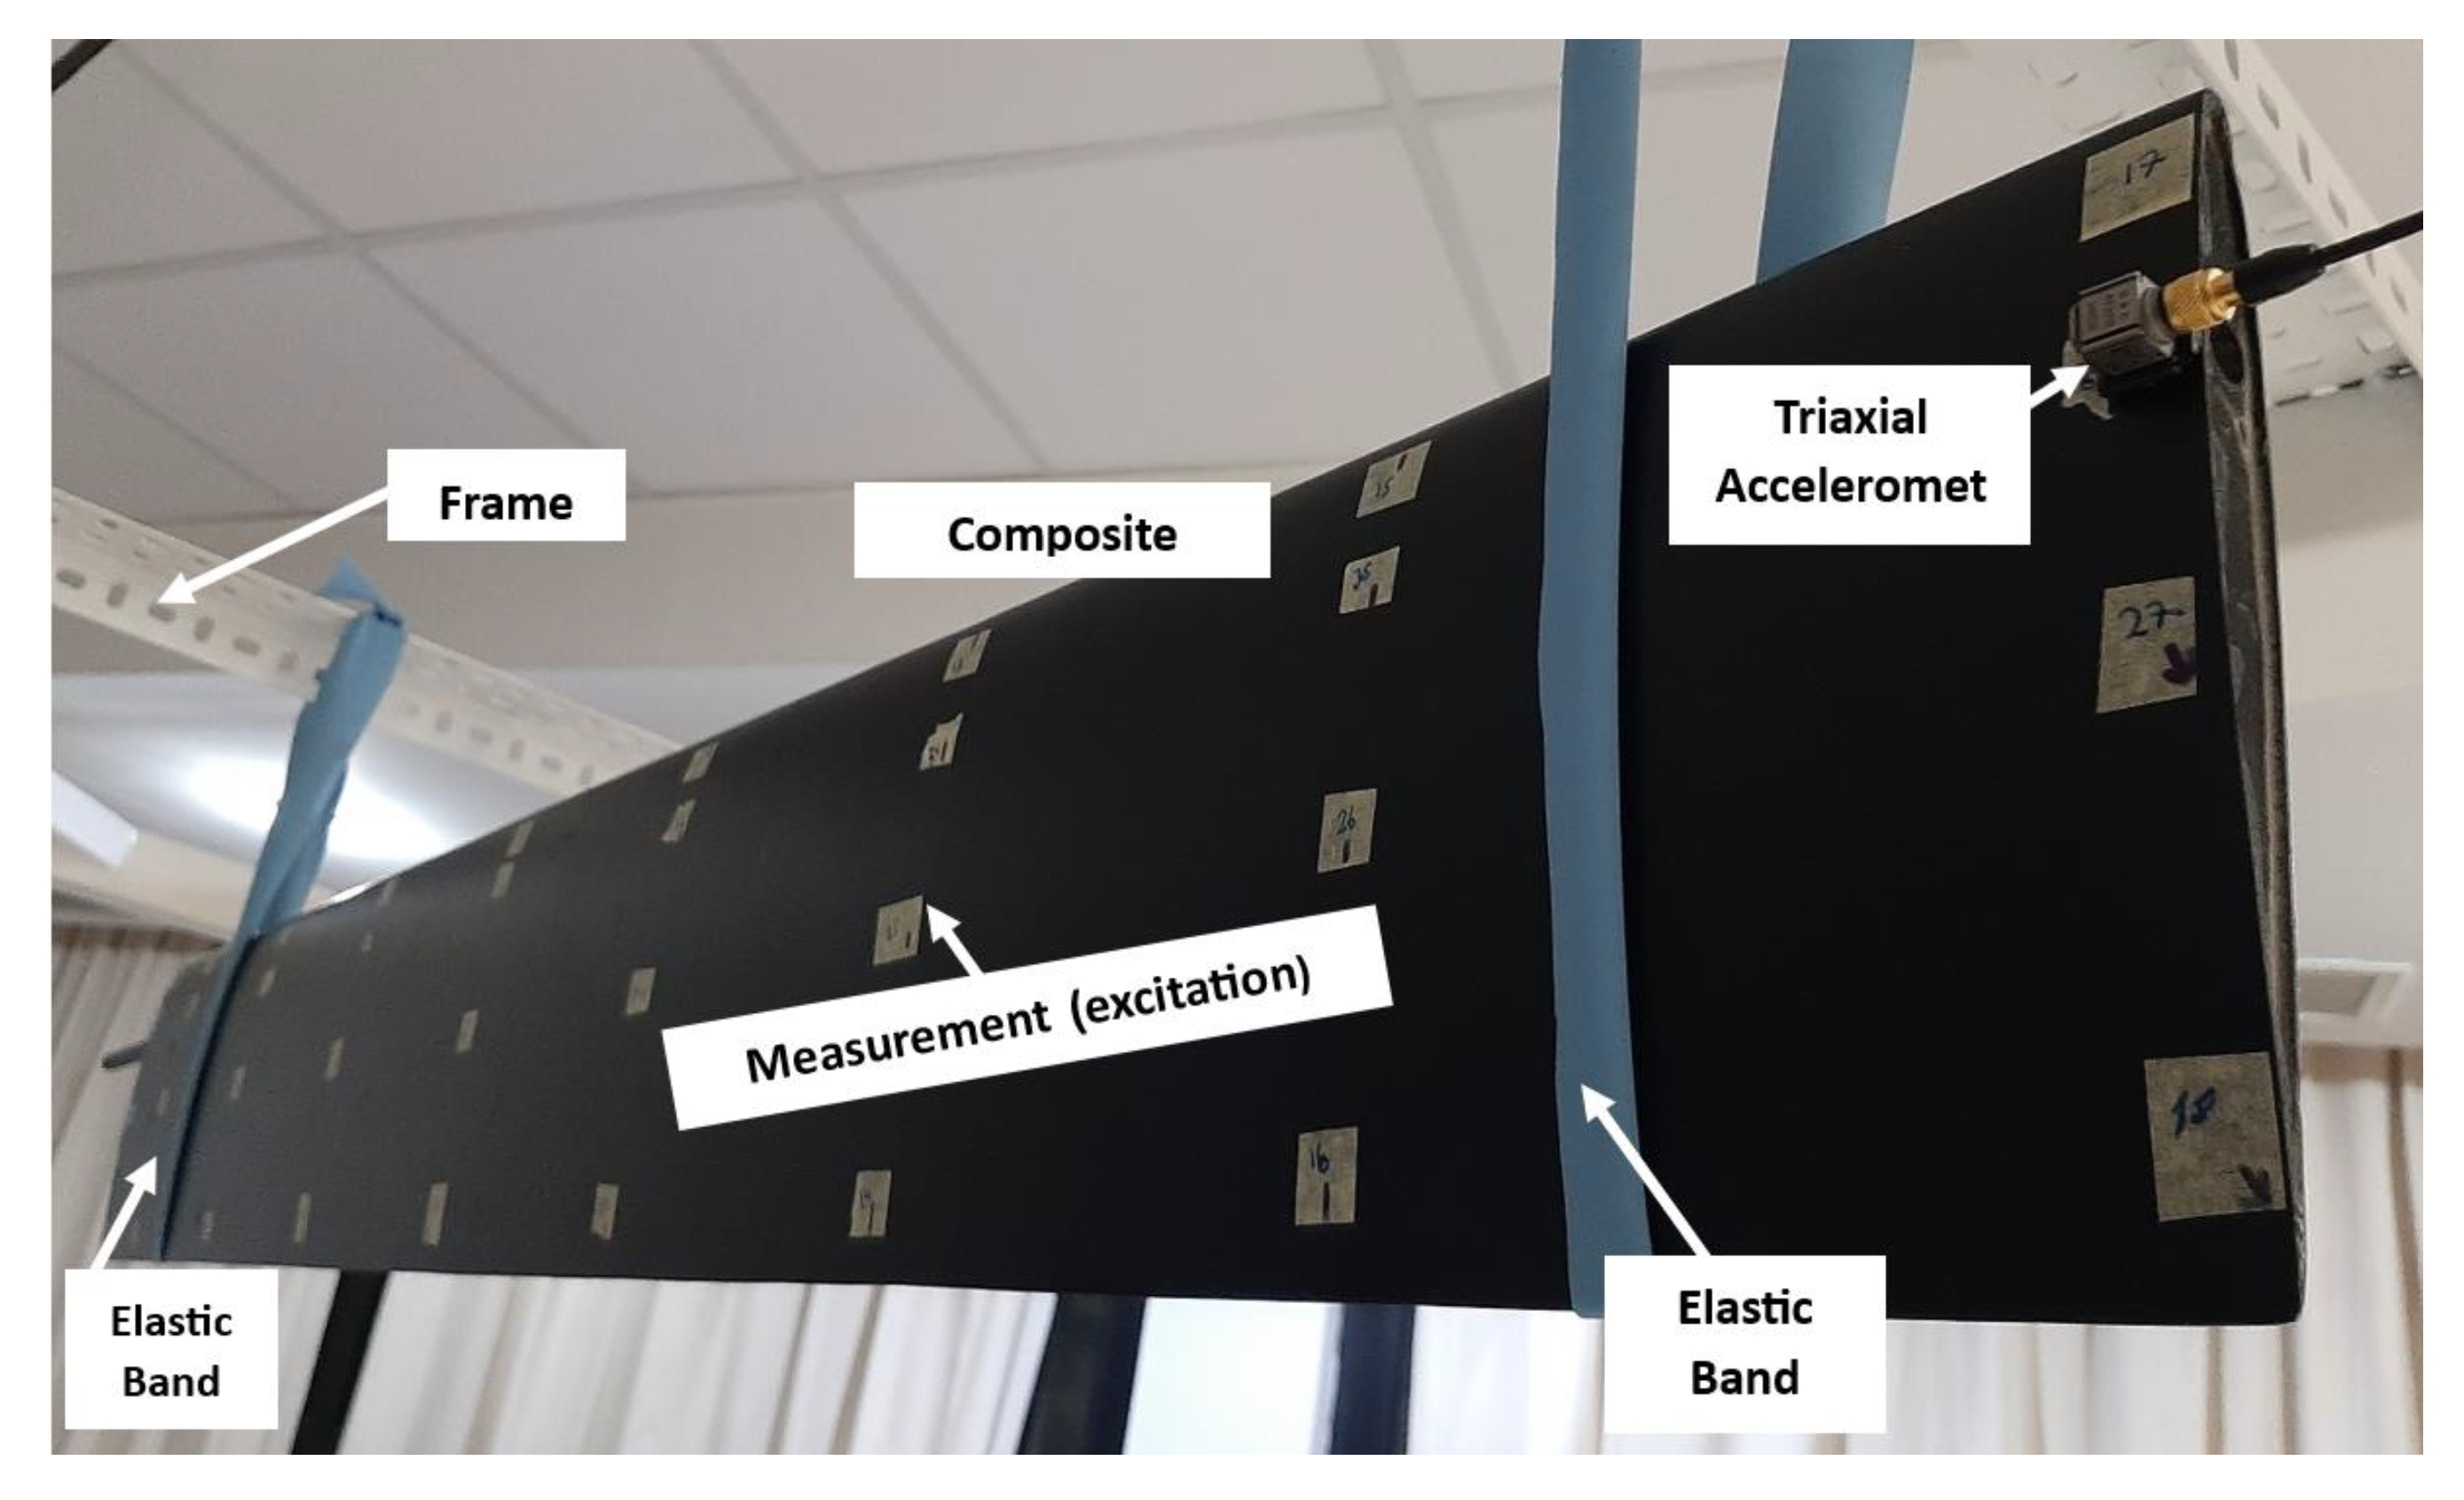
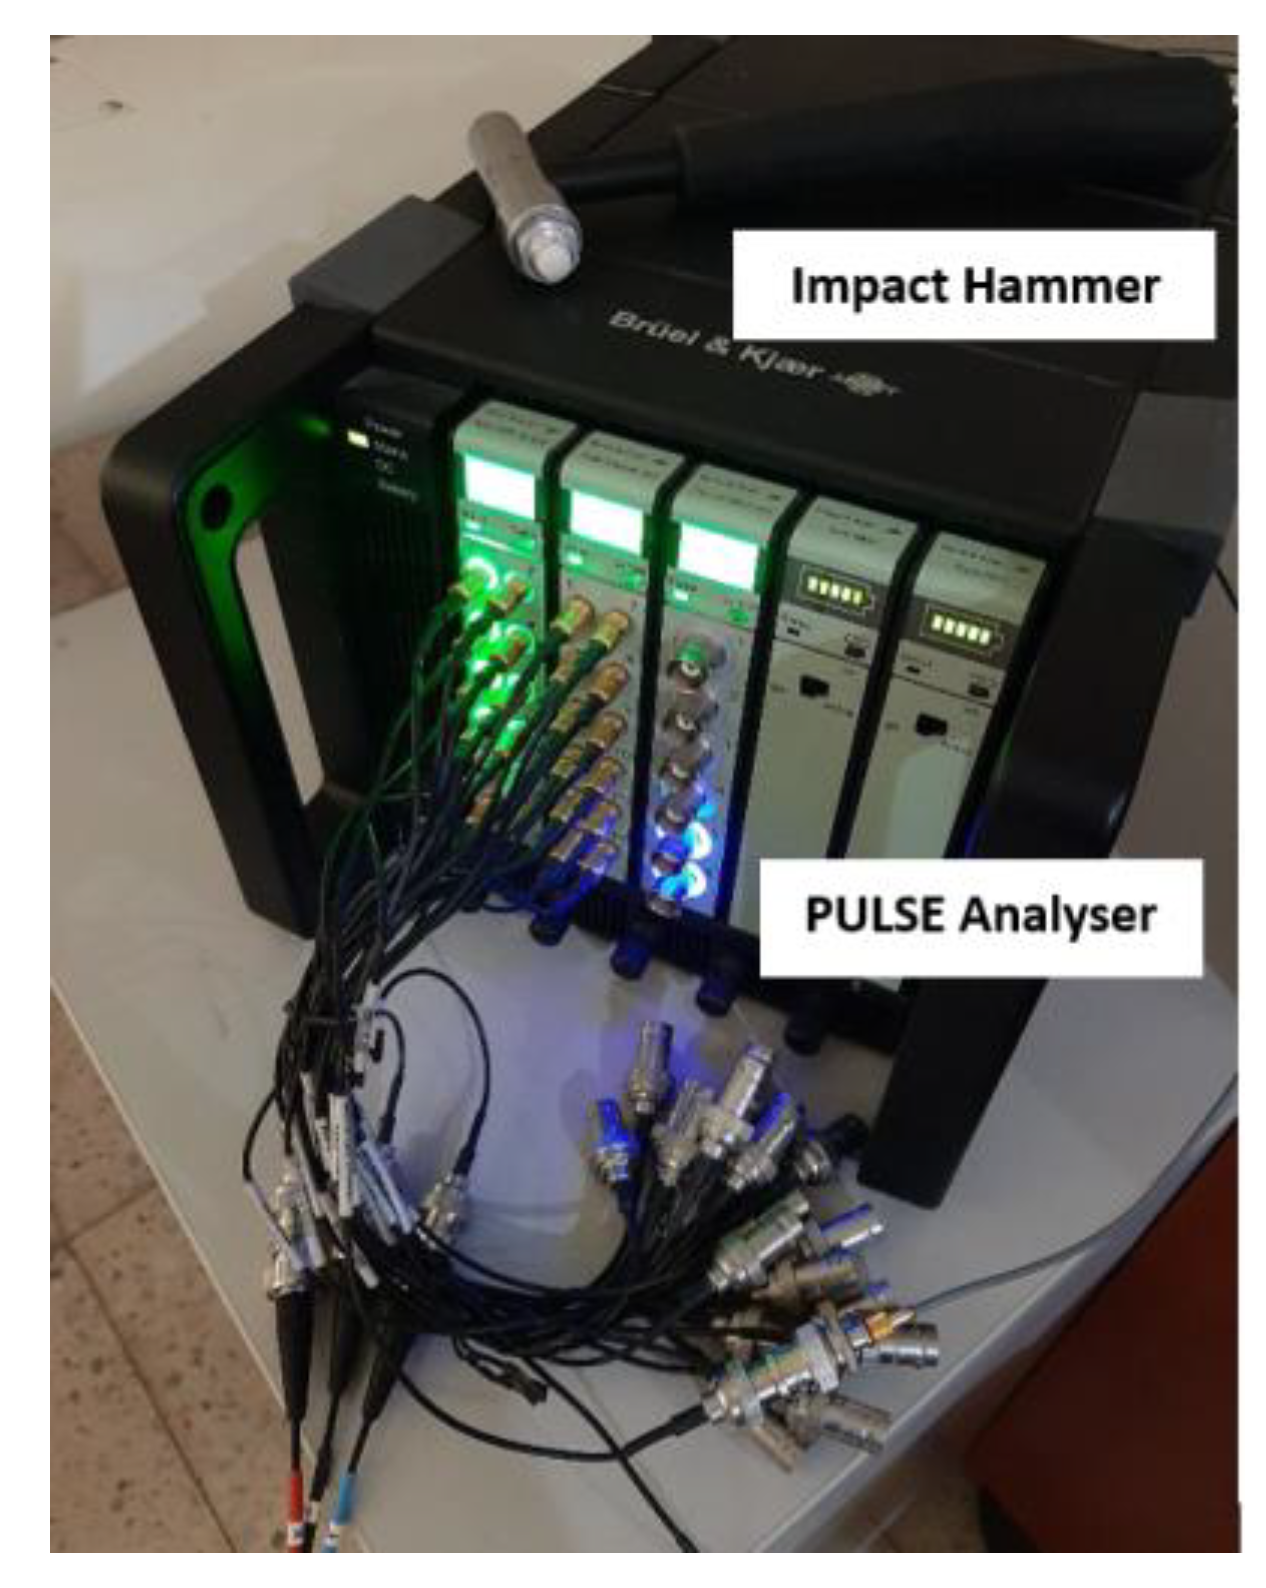
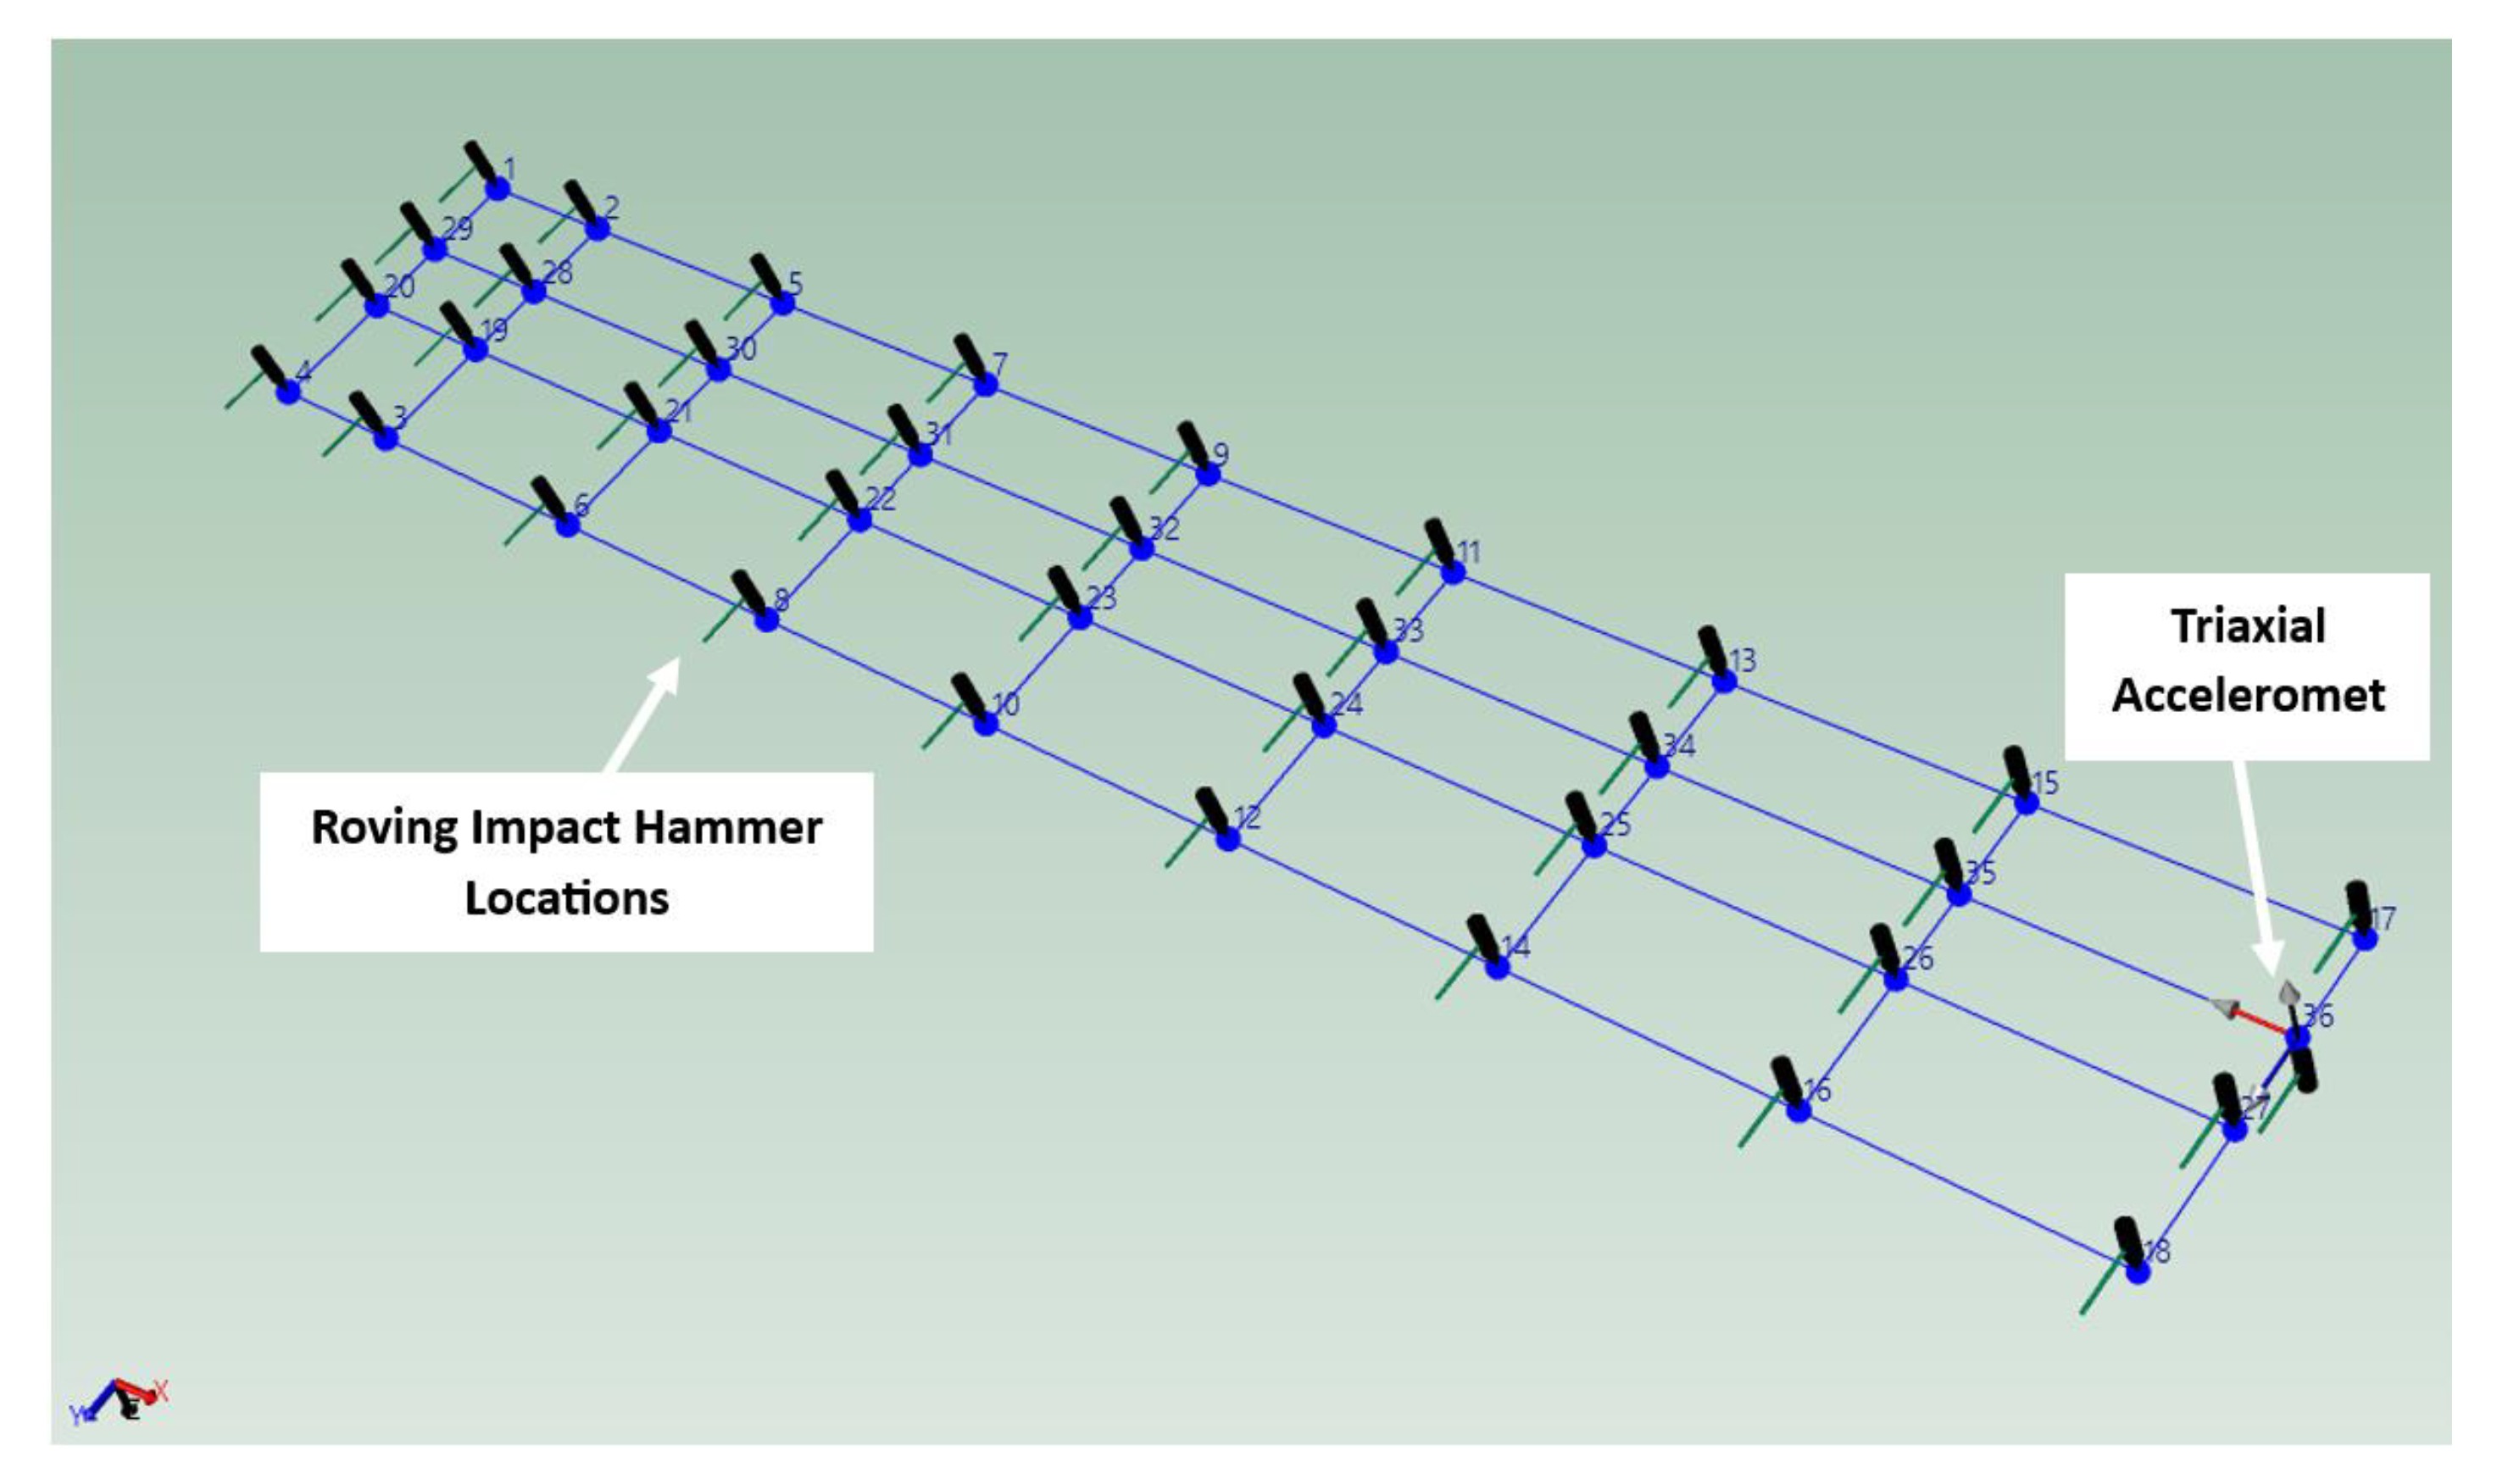
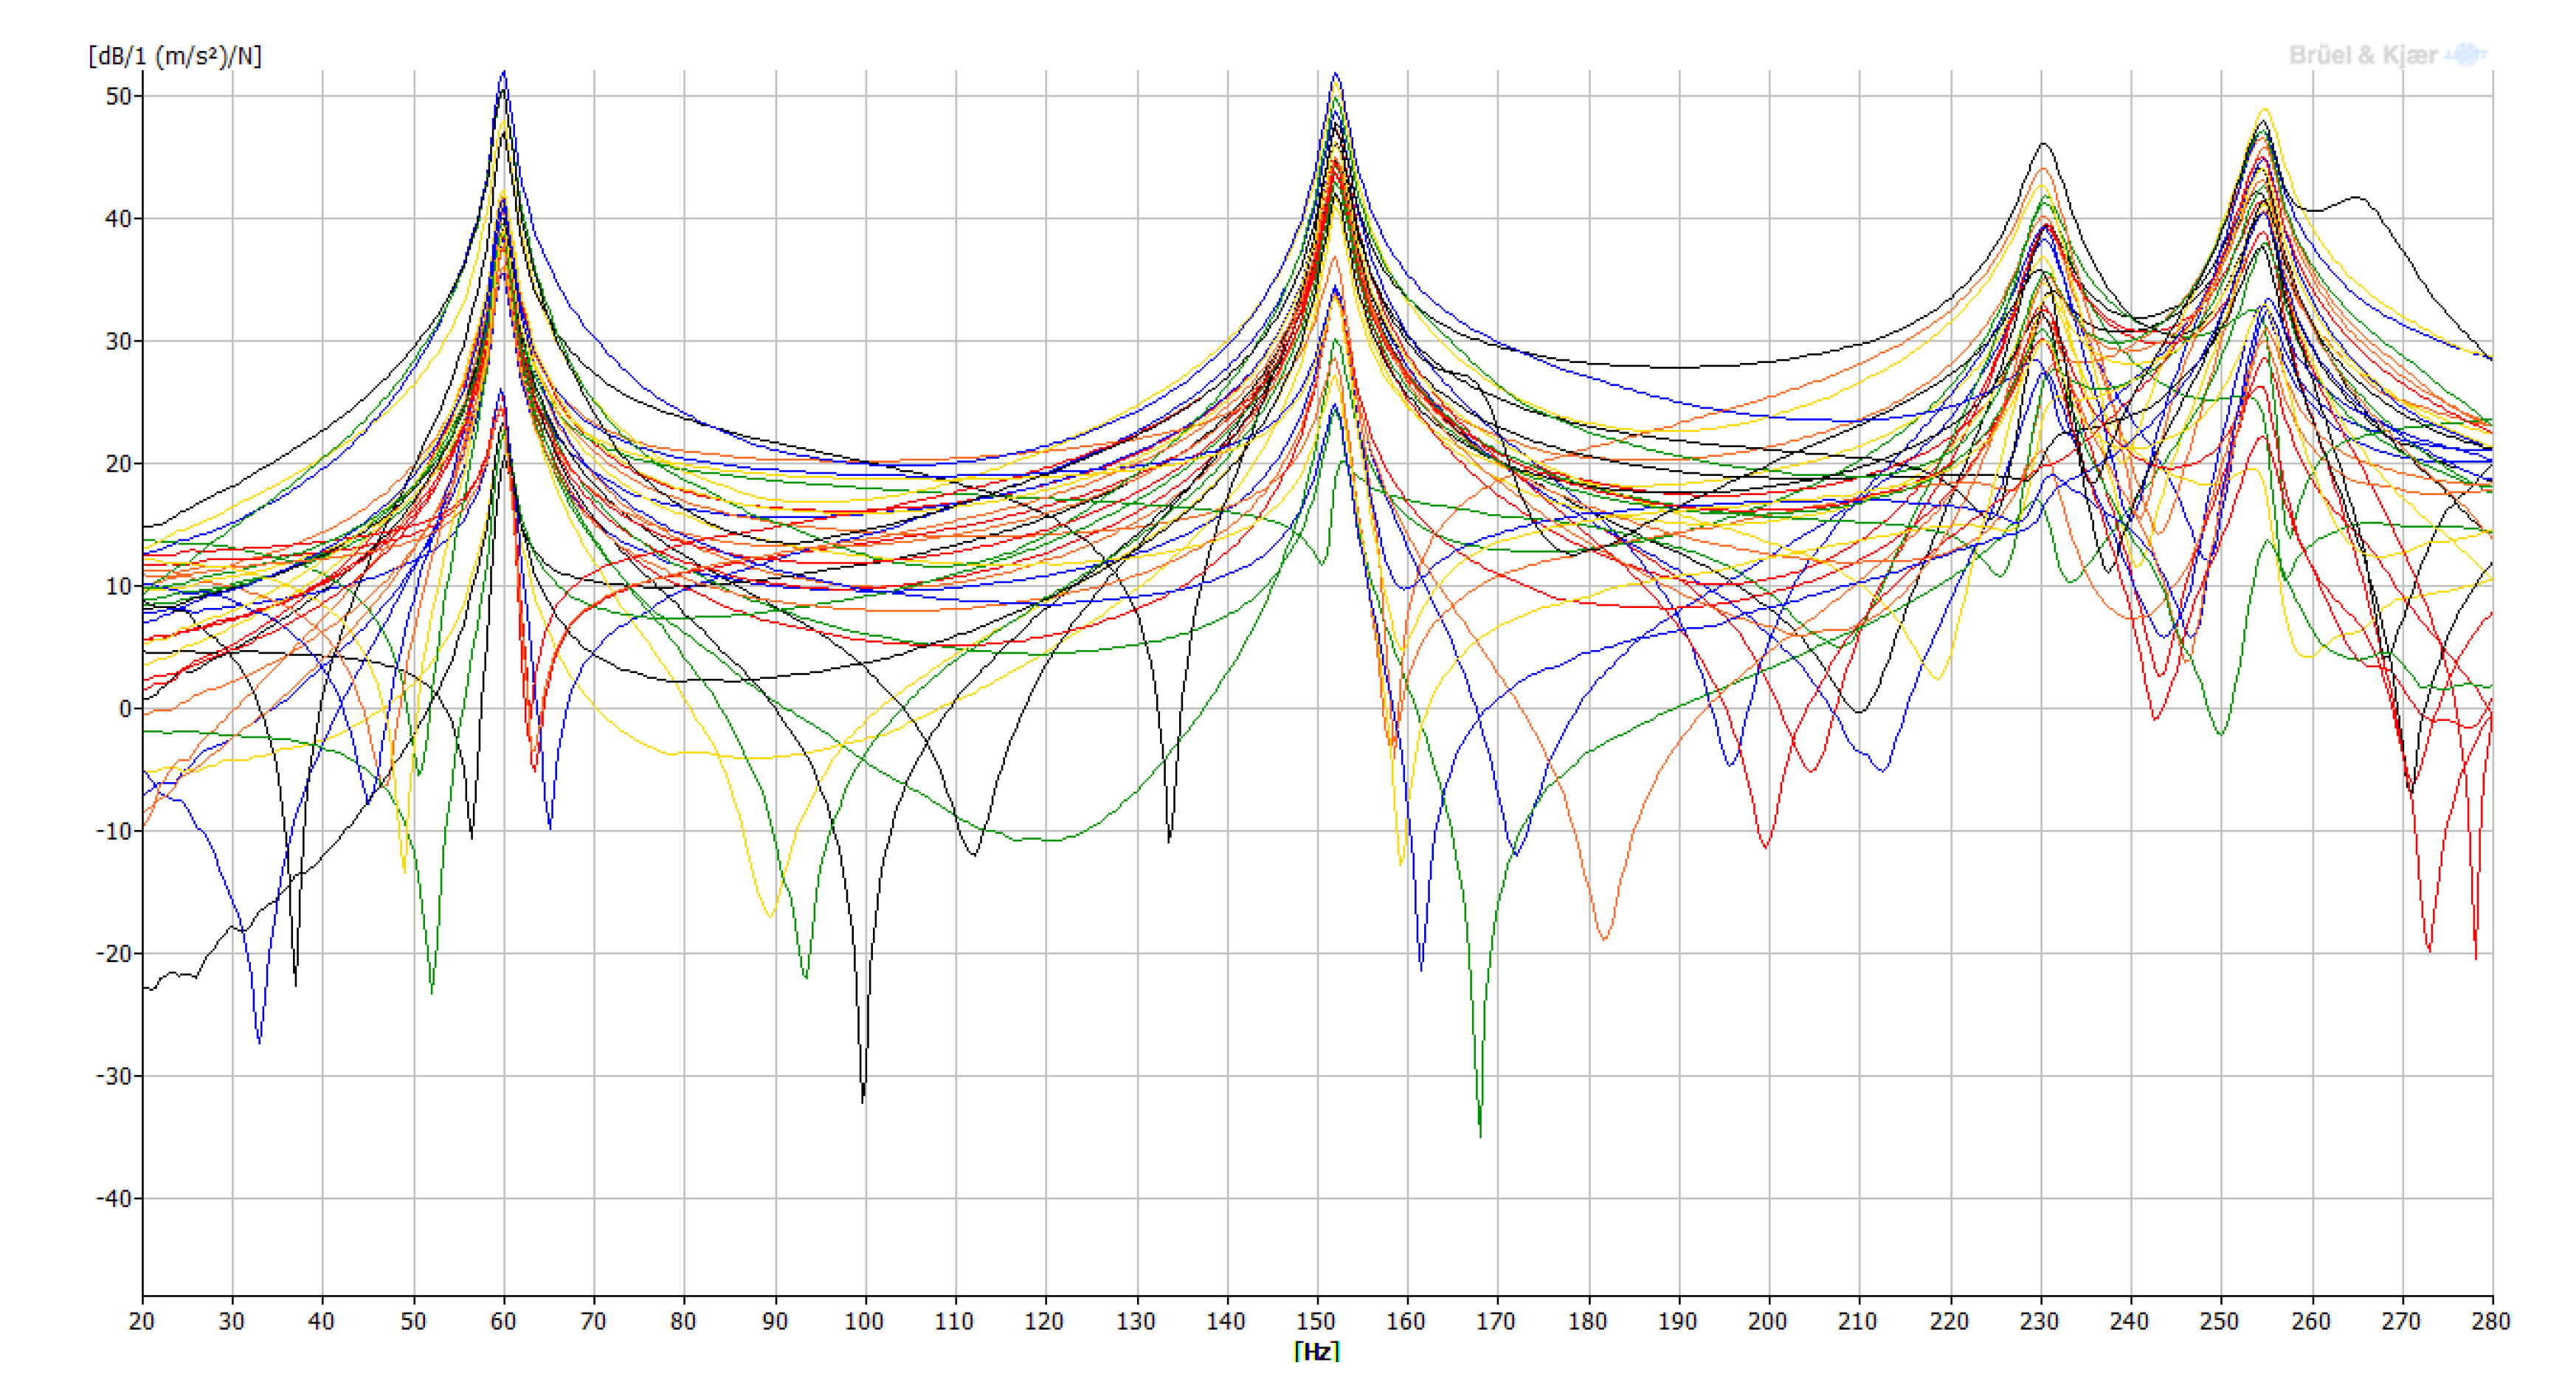
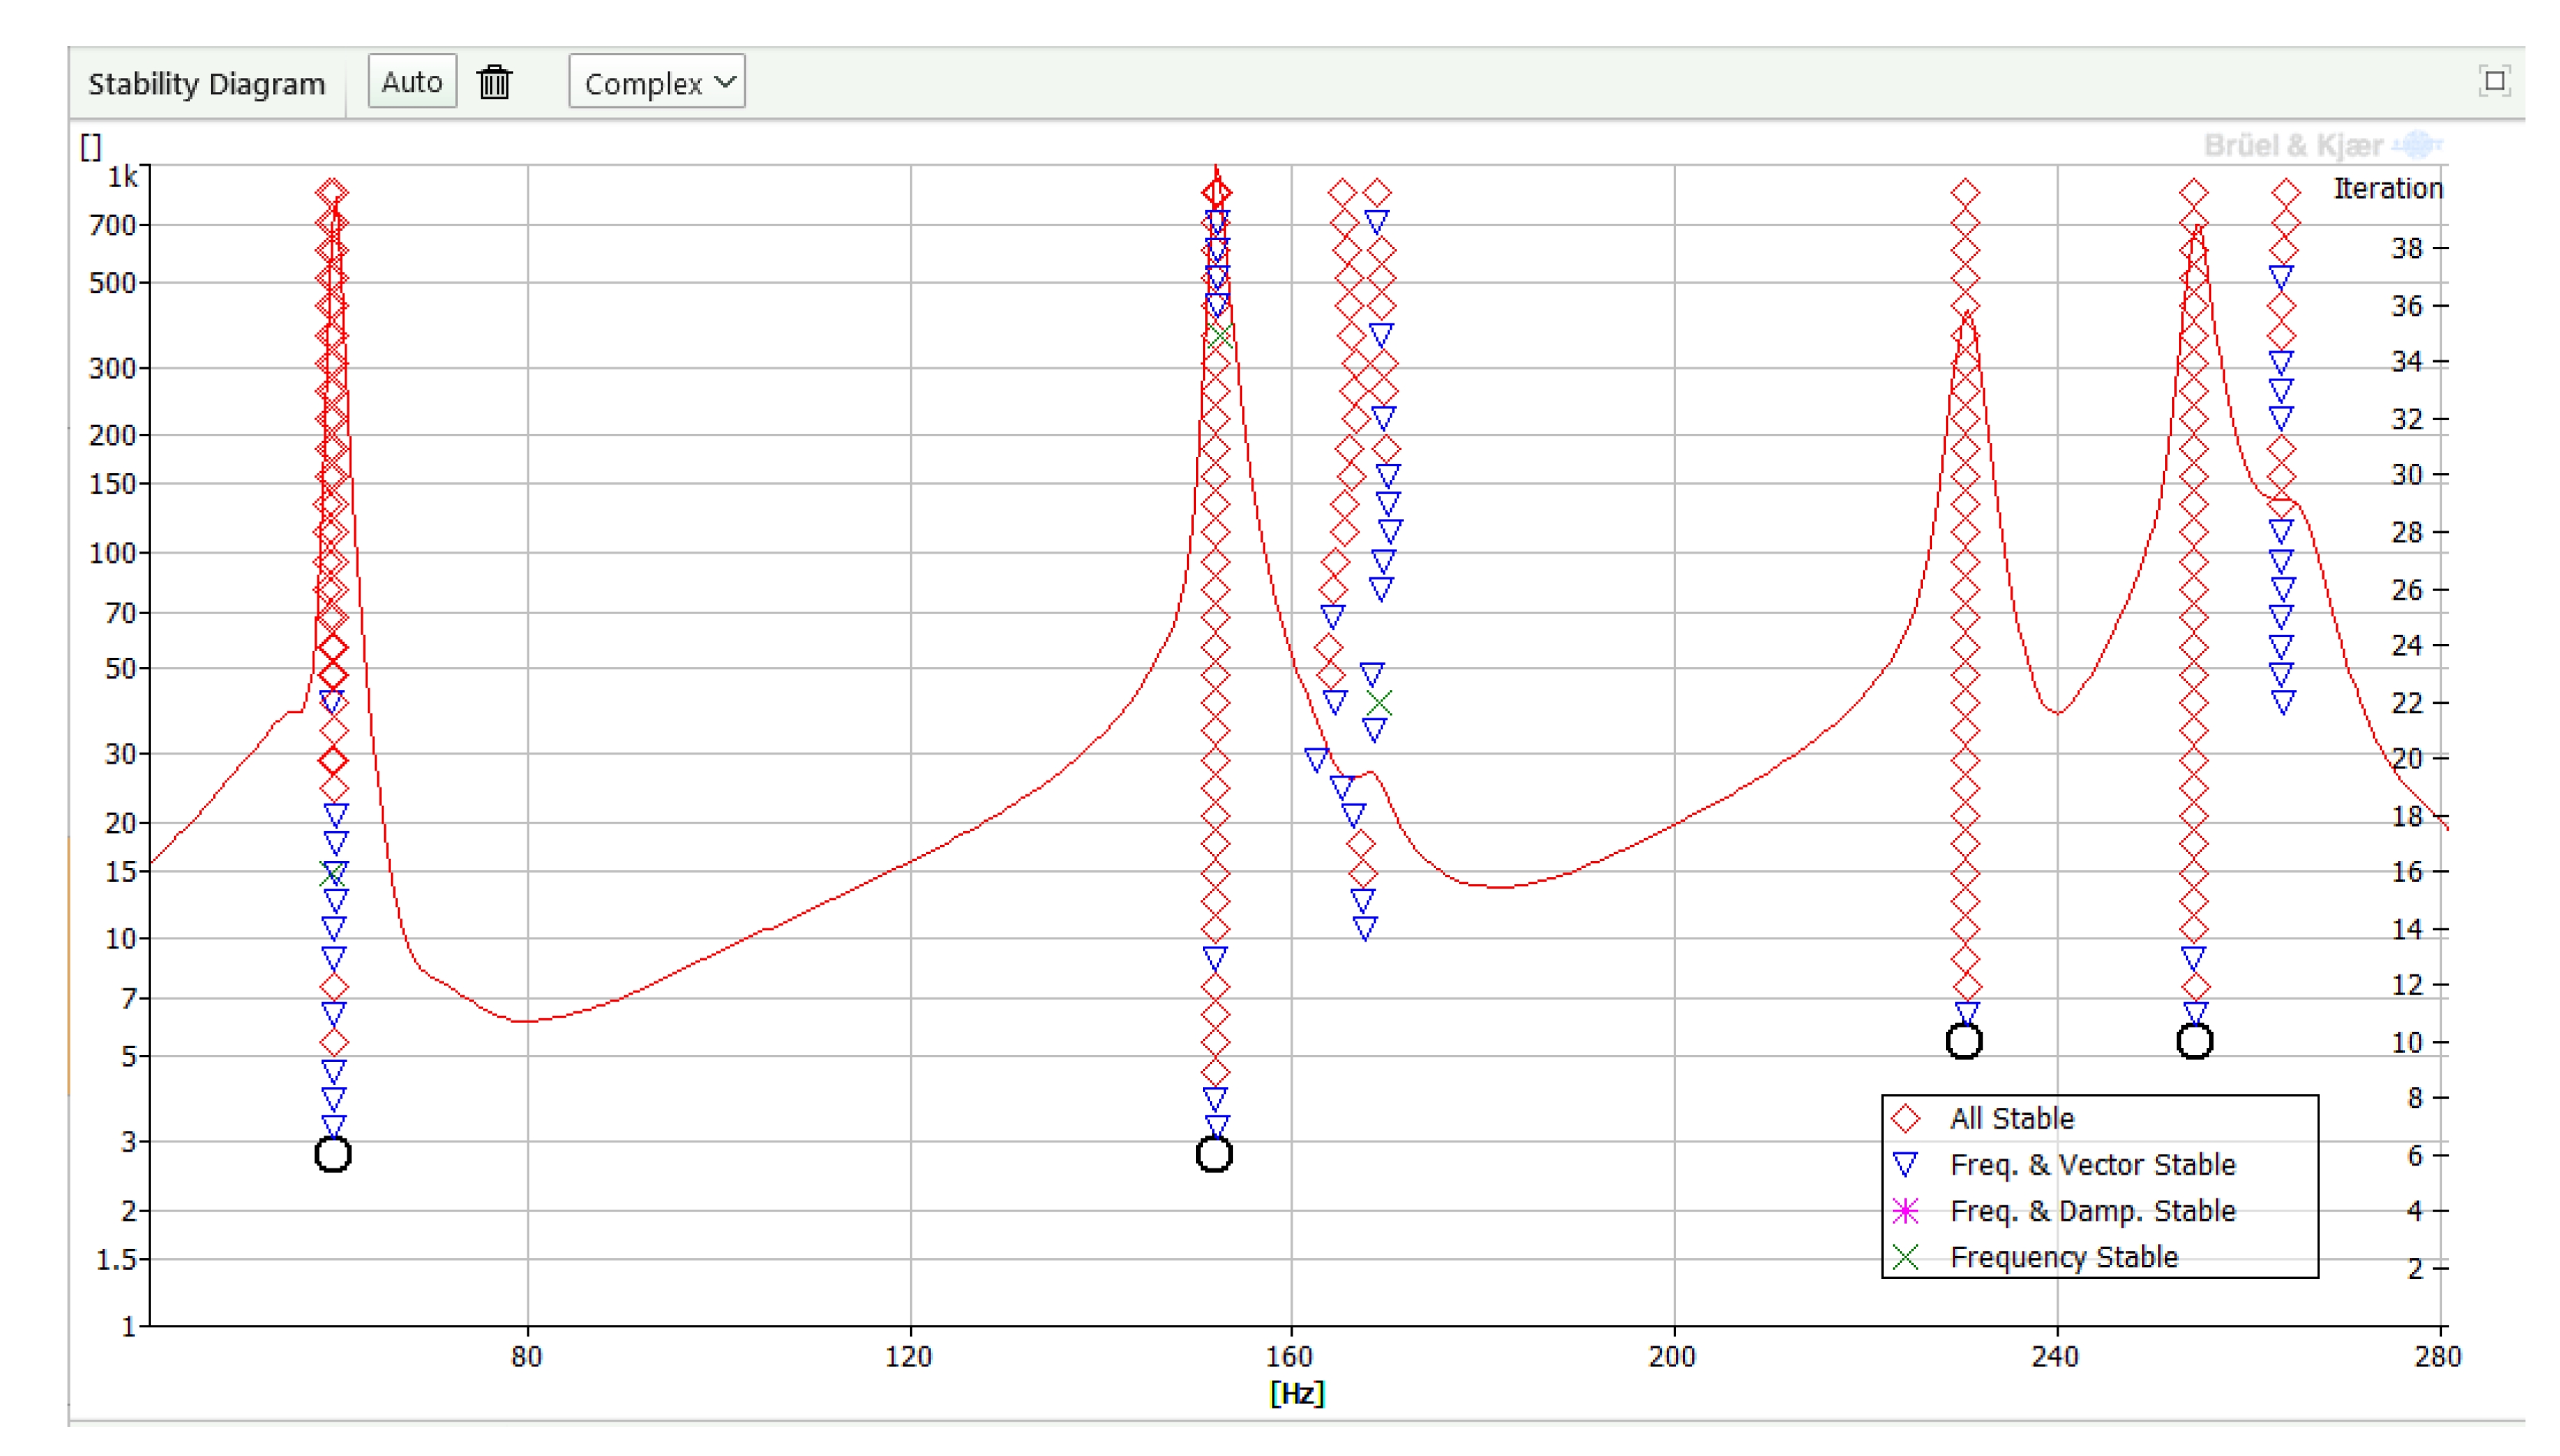
7.4. Experimental Modal Tests of the Optimized Composite Wing
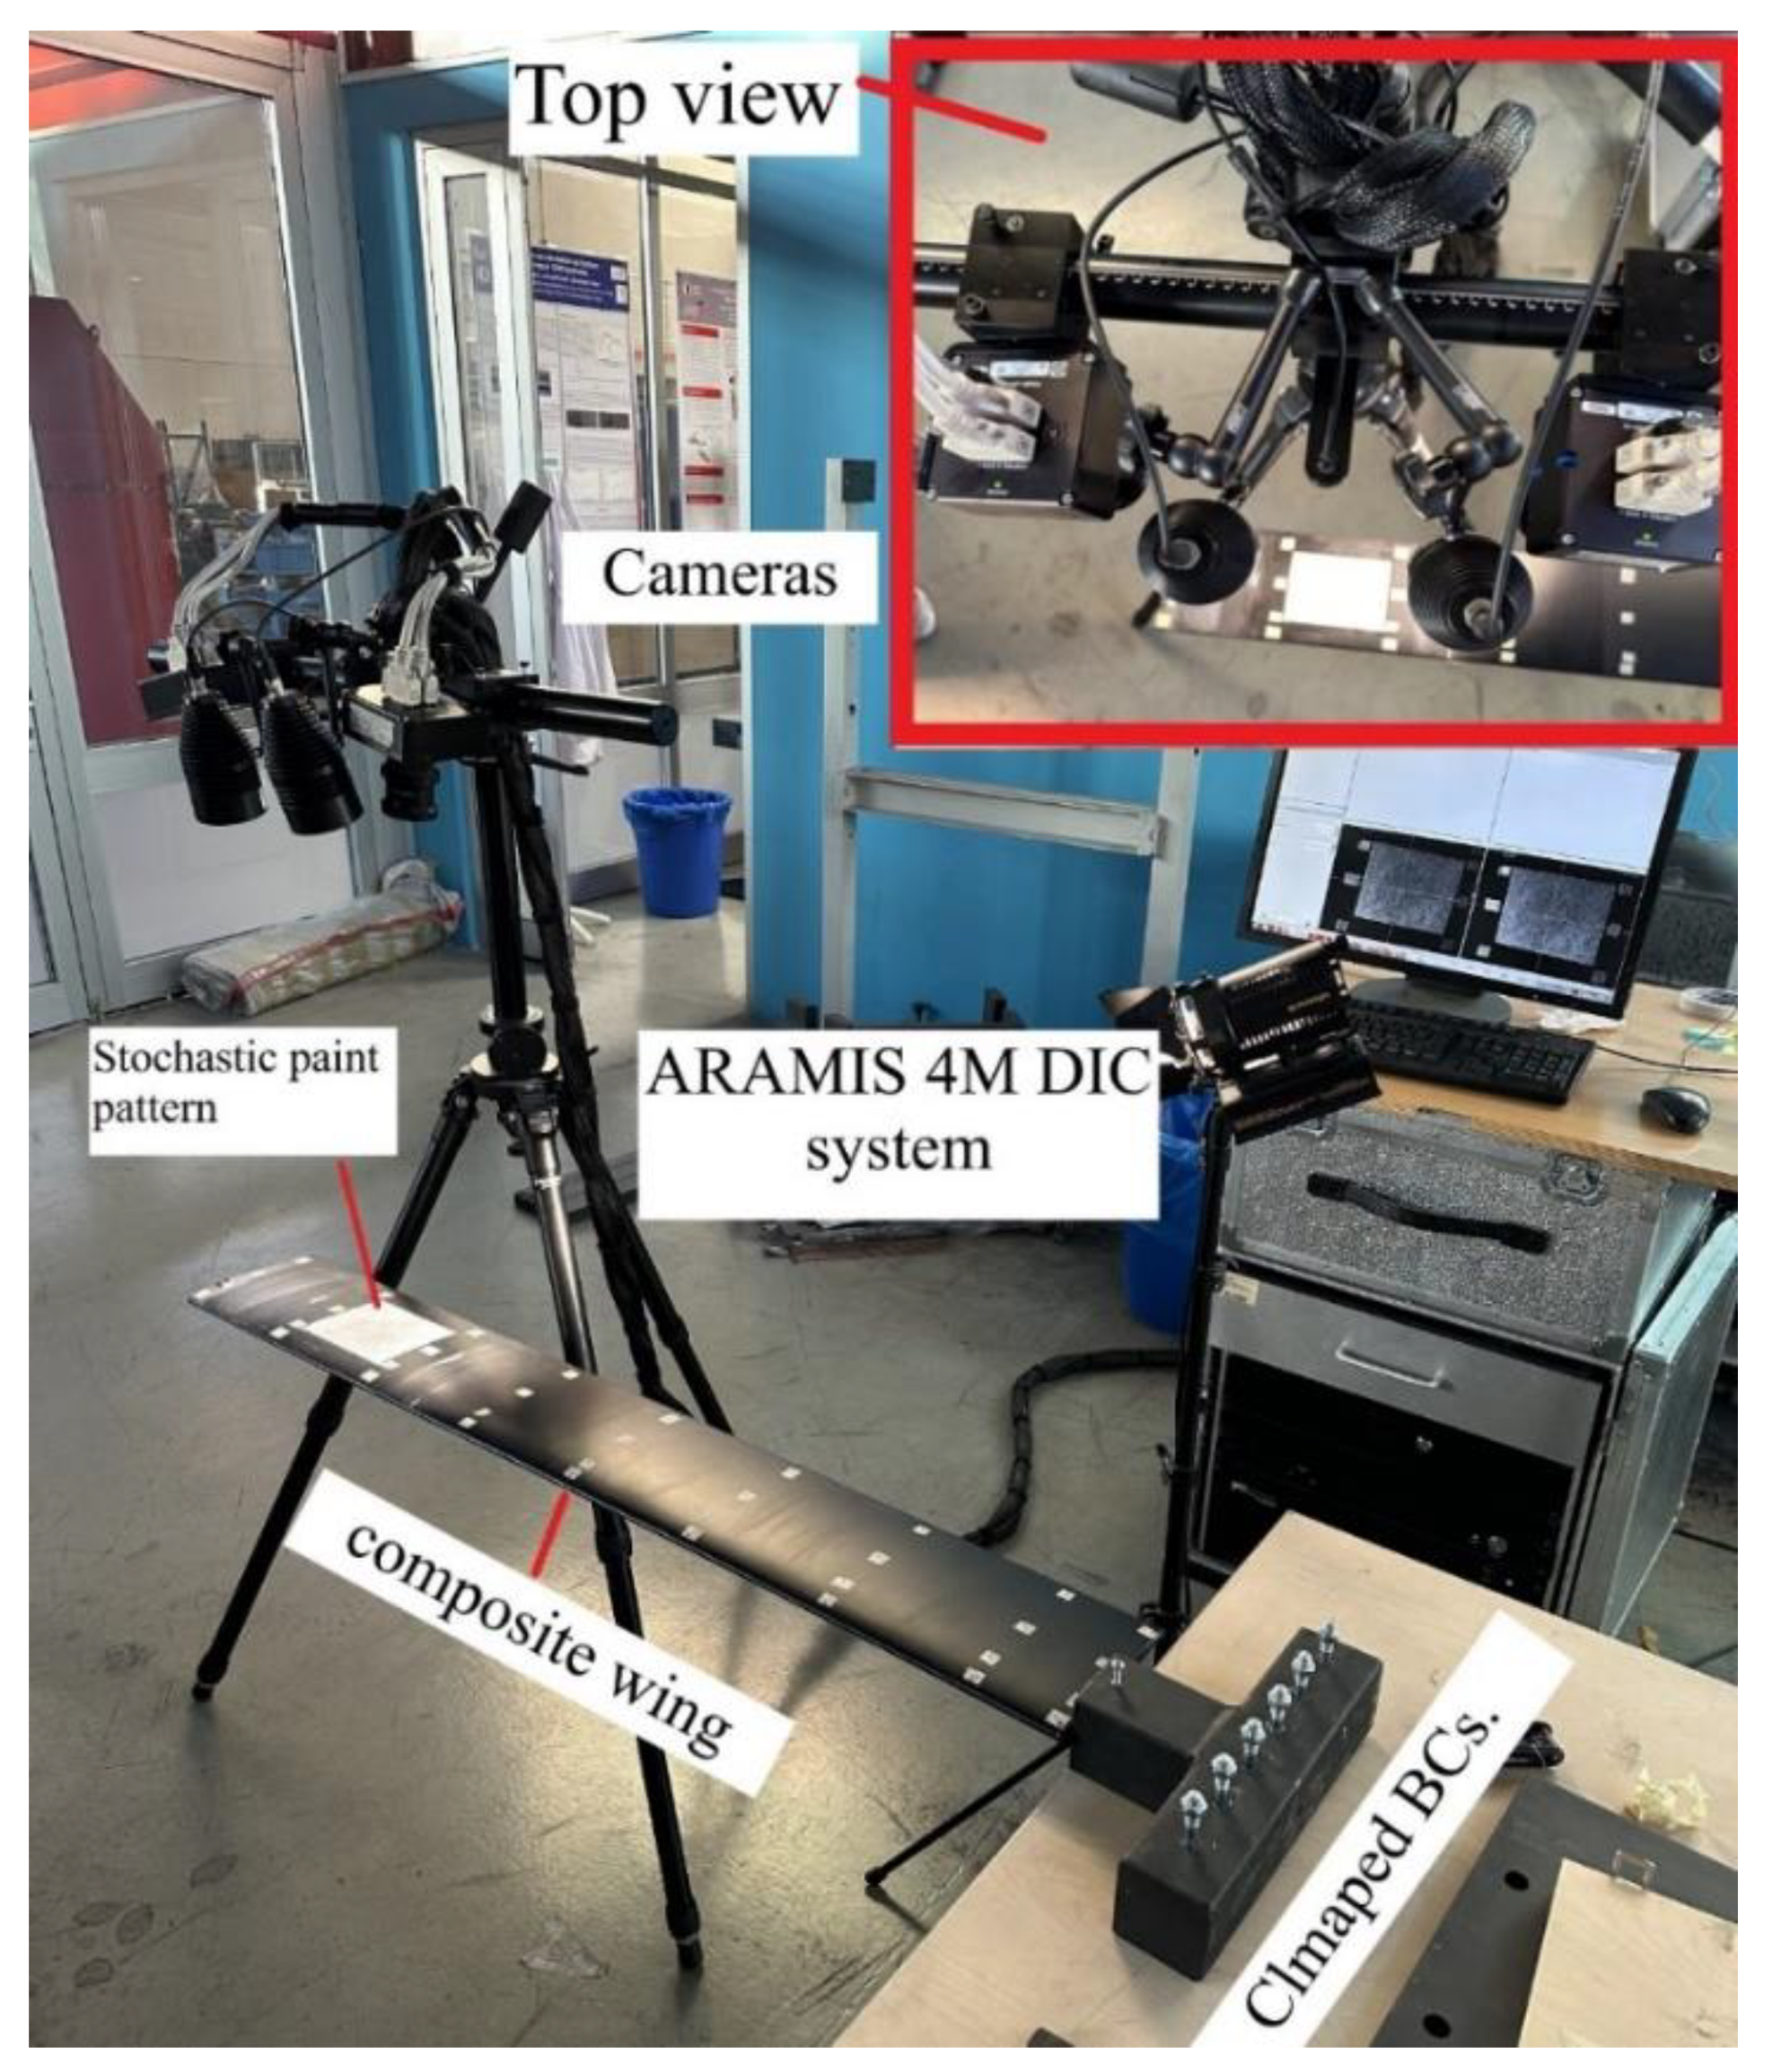
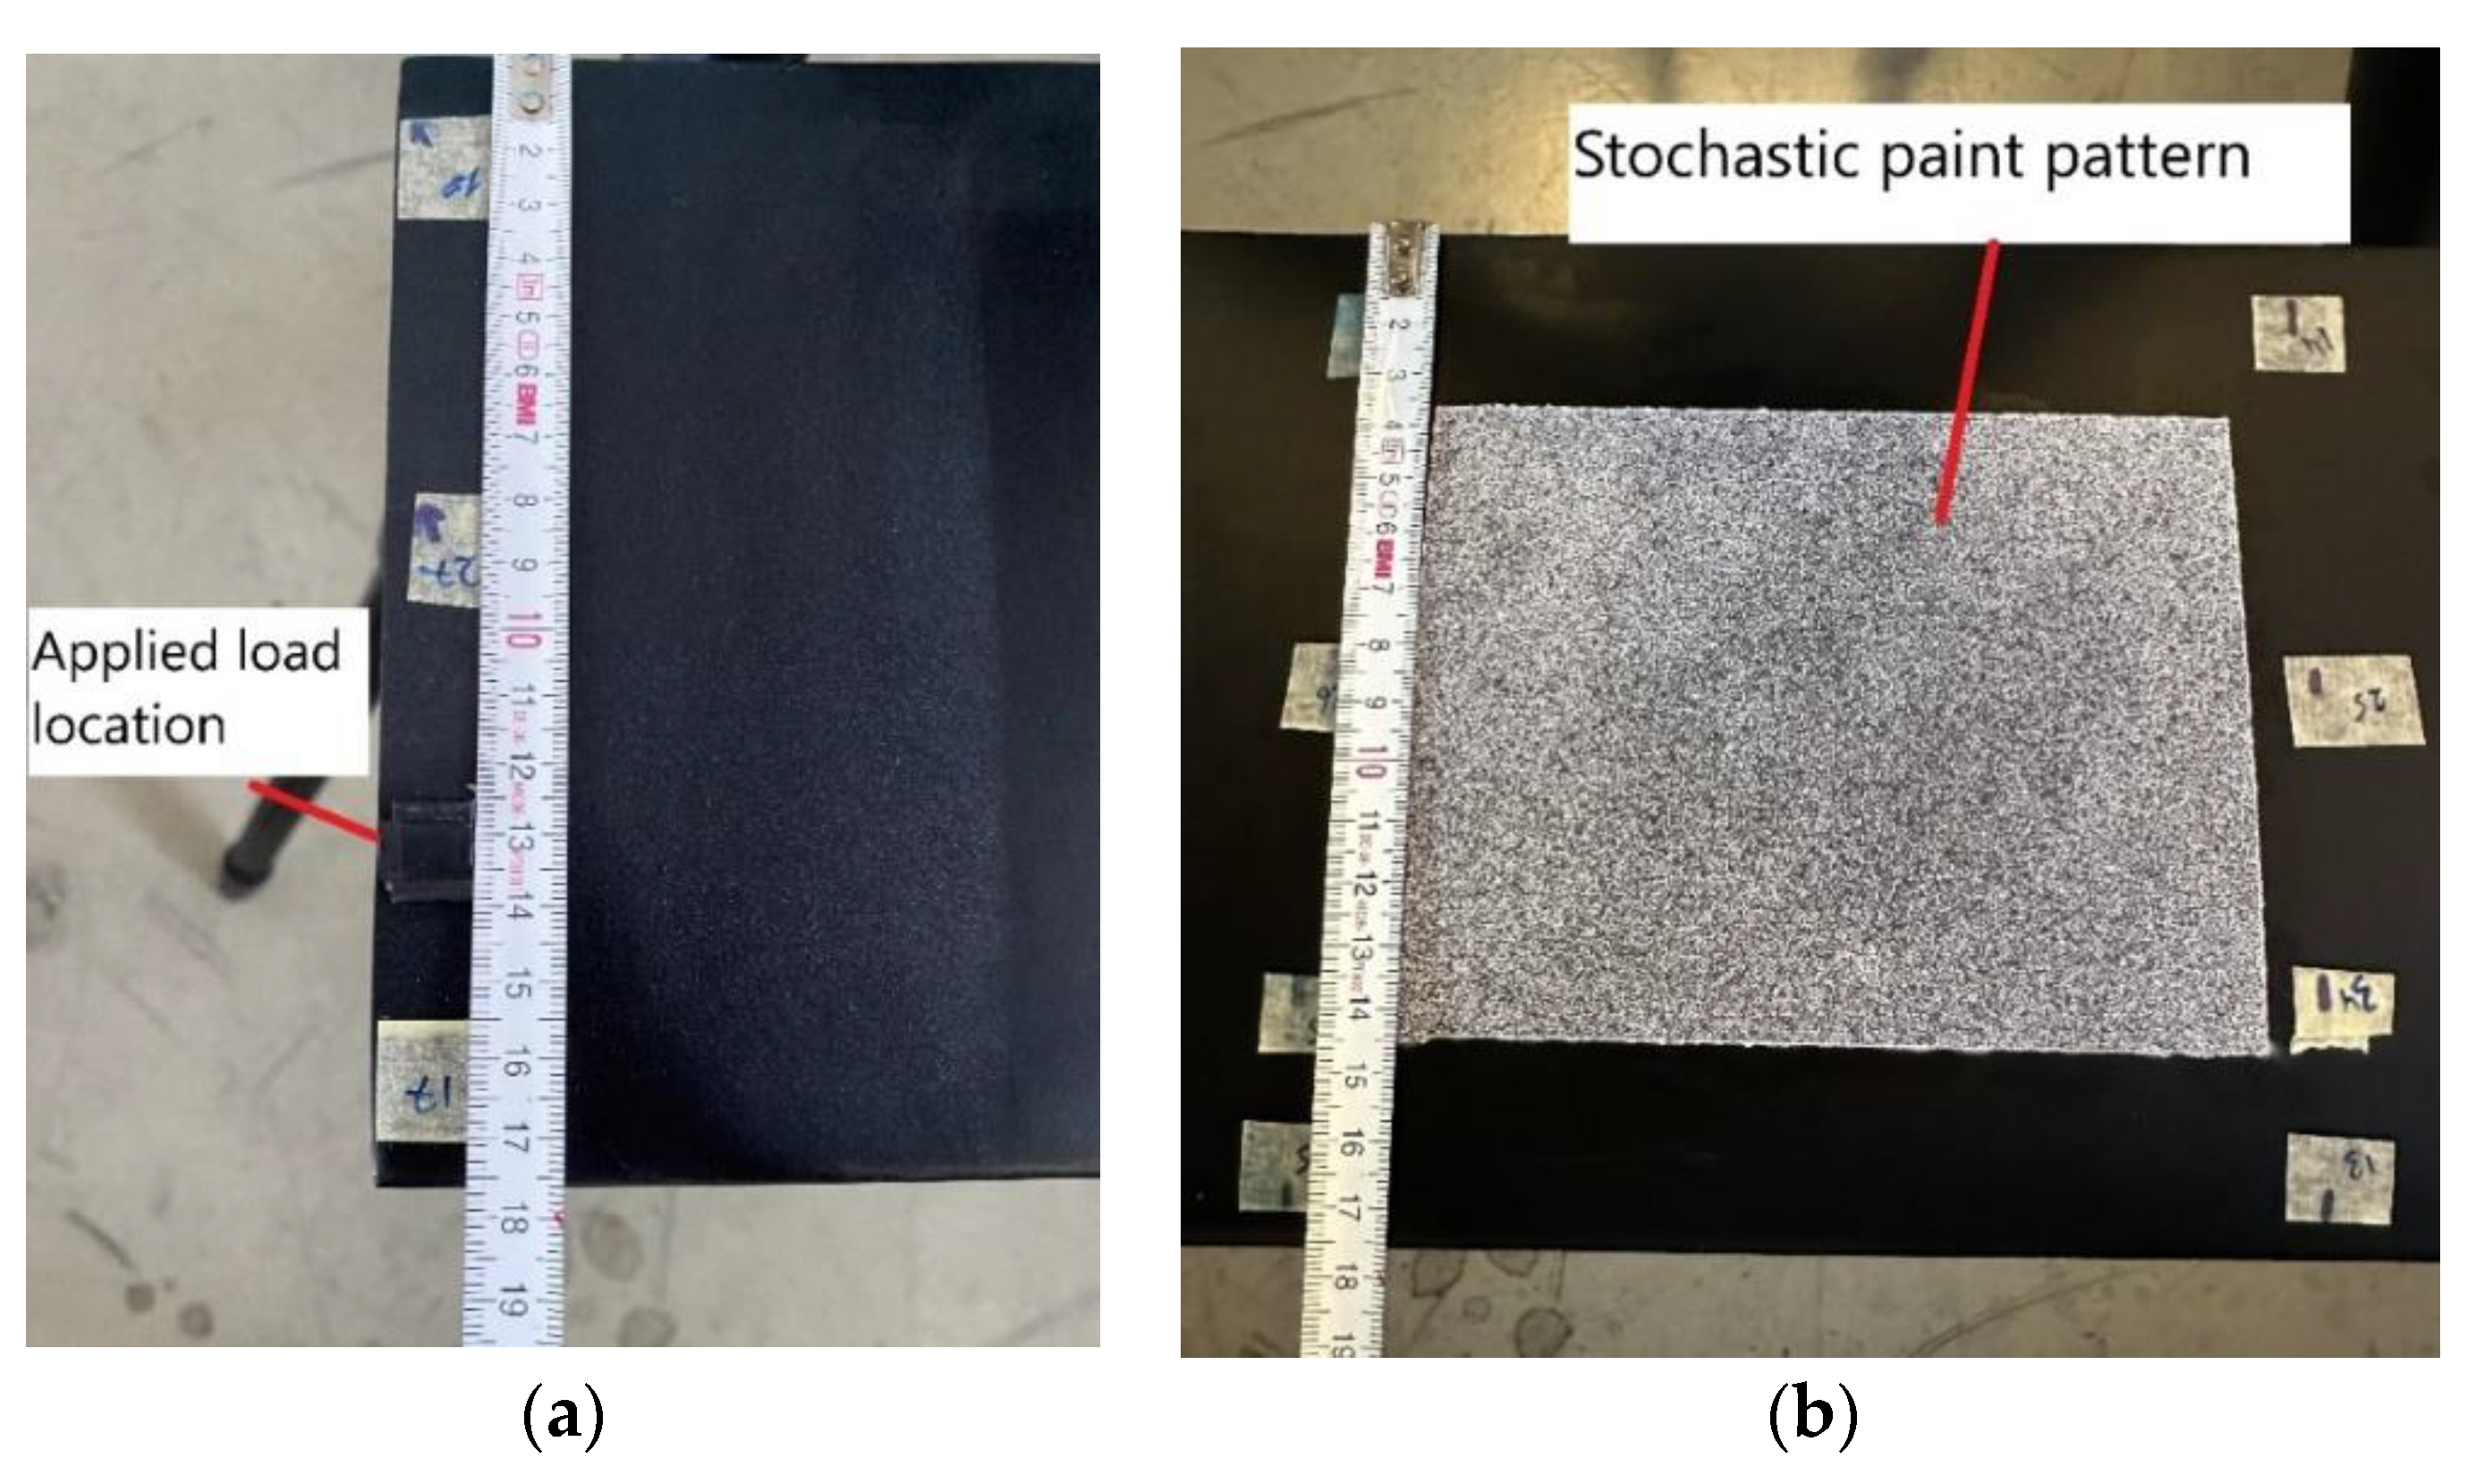
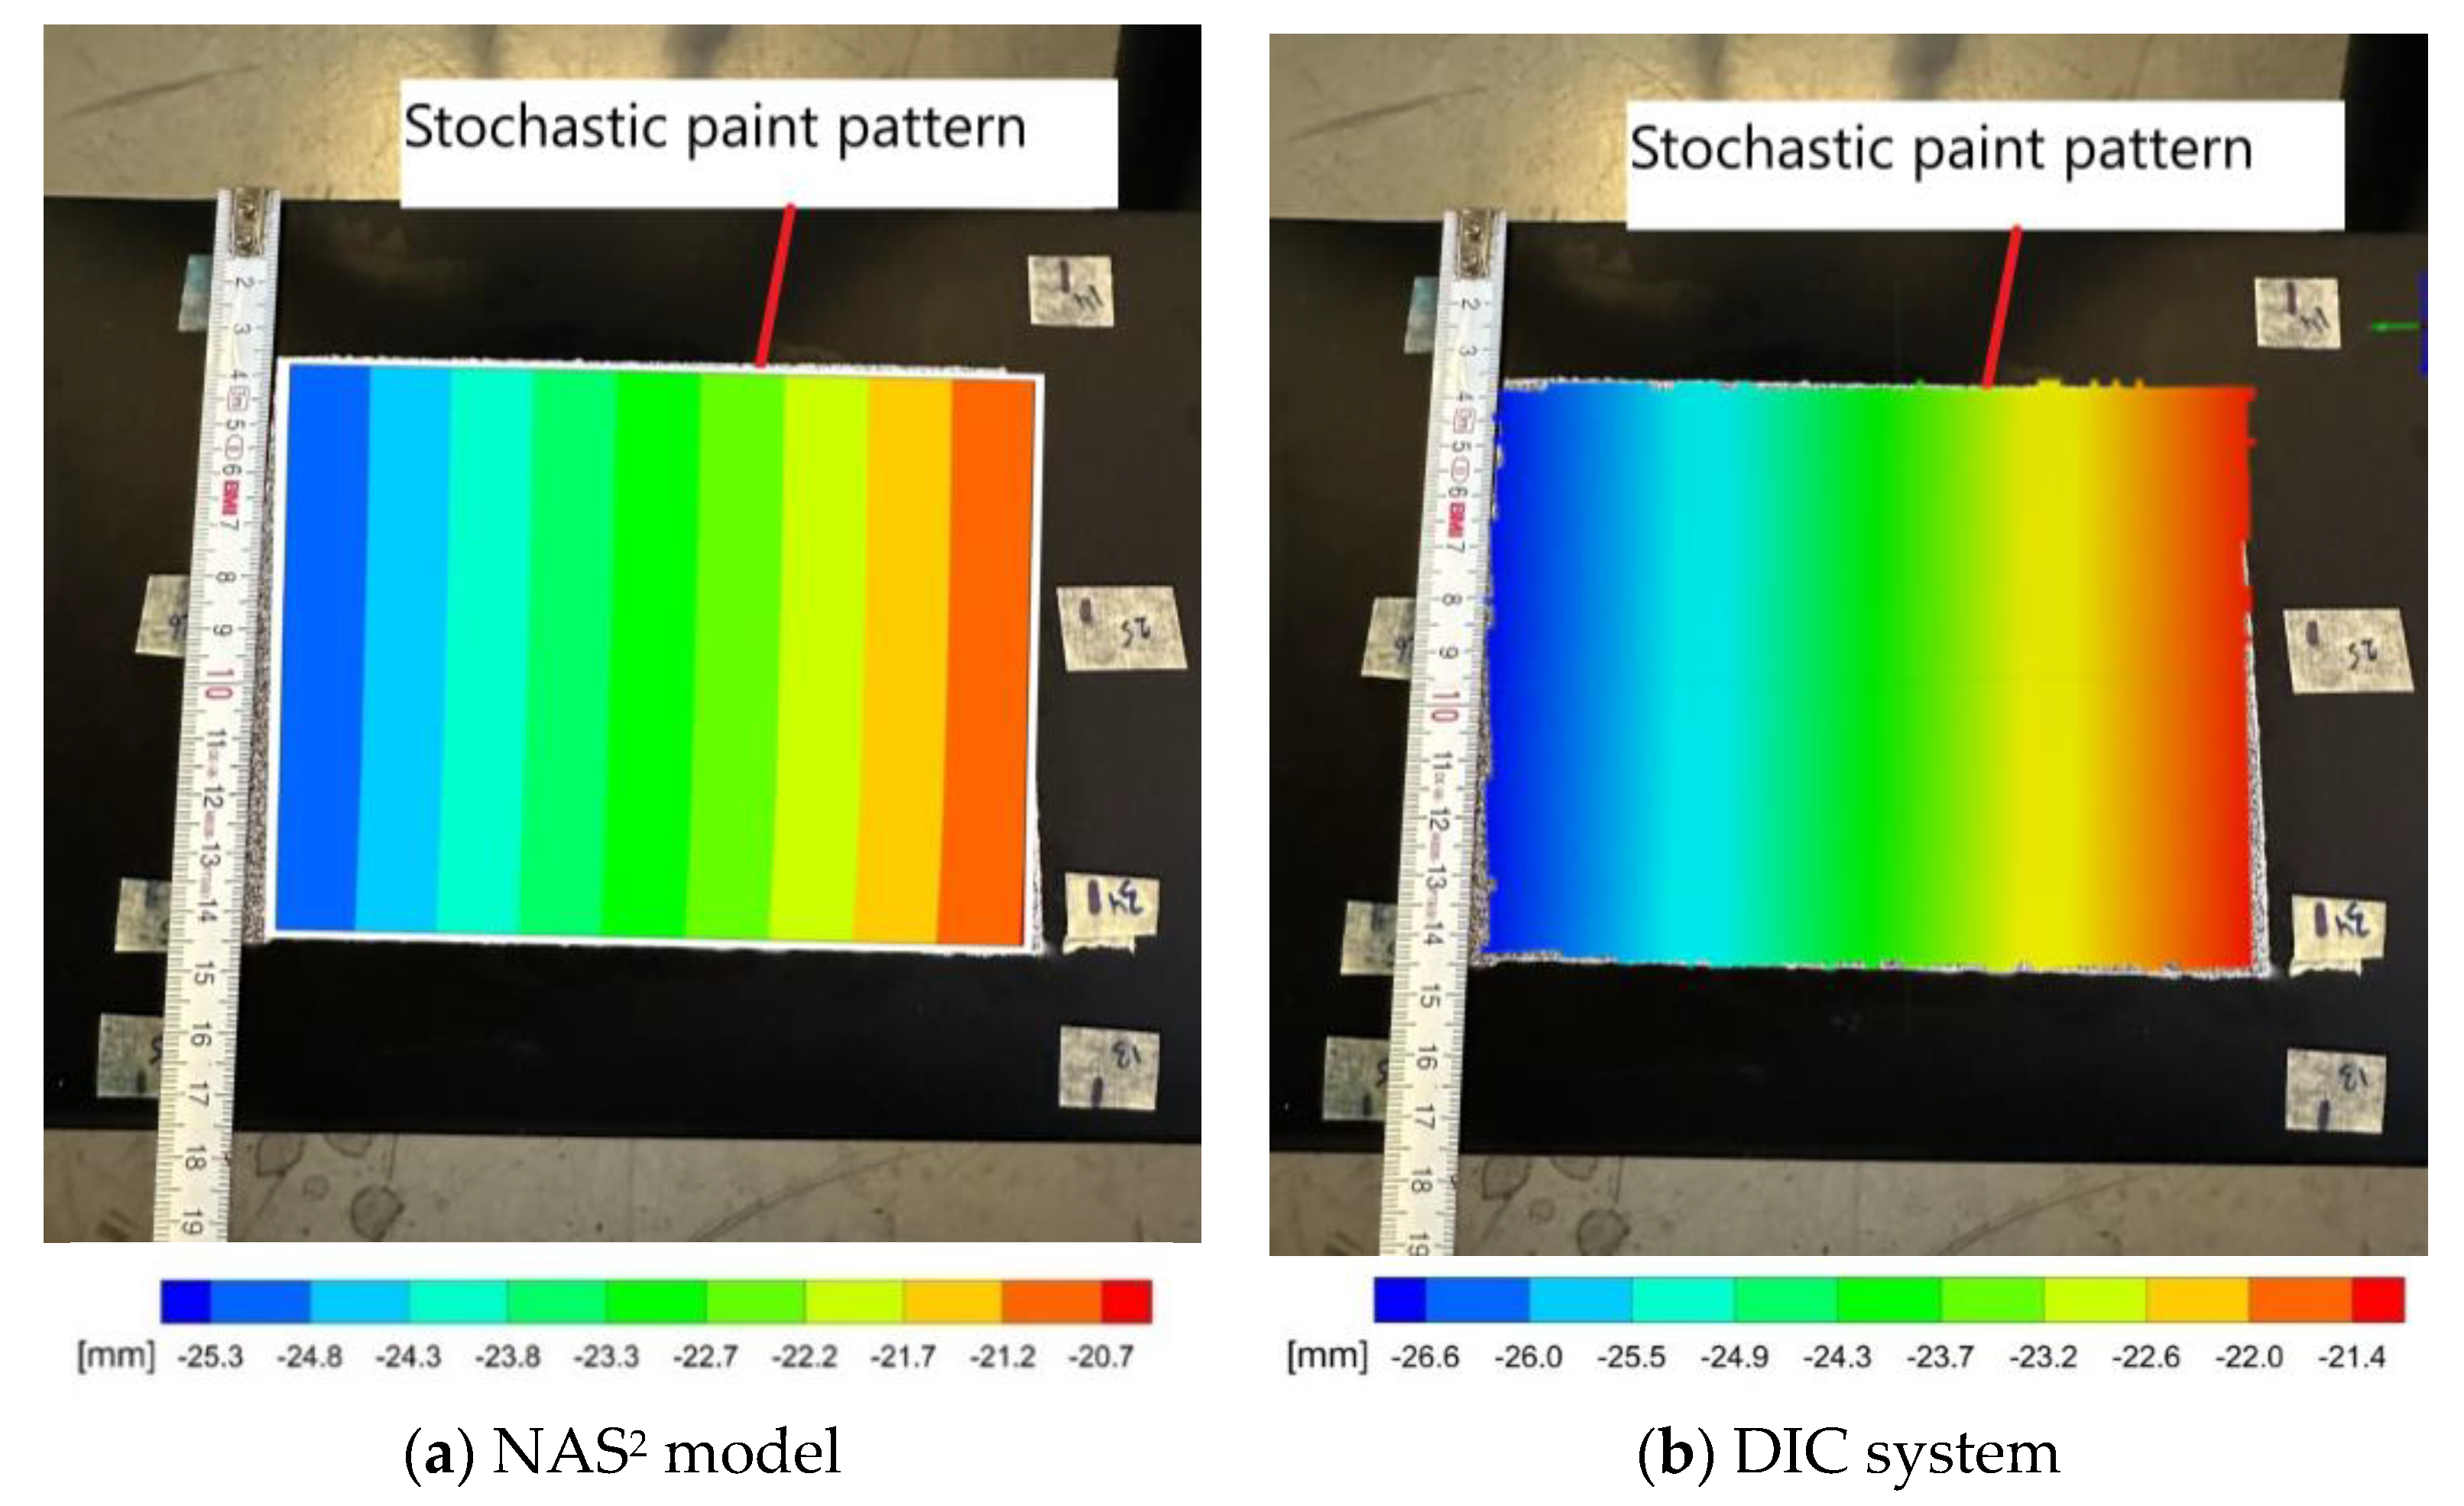
7.5. Experimental Static Deflection of the Optimized Composite Wing
8. Conclusions
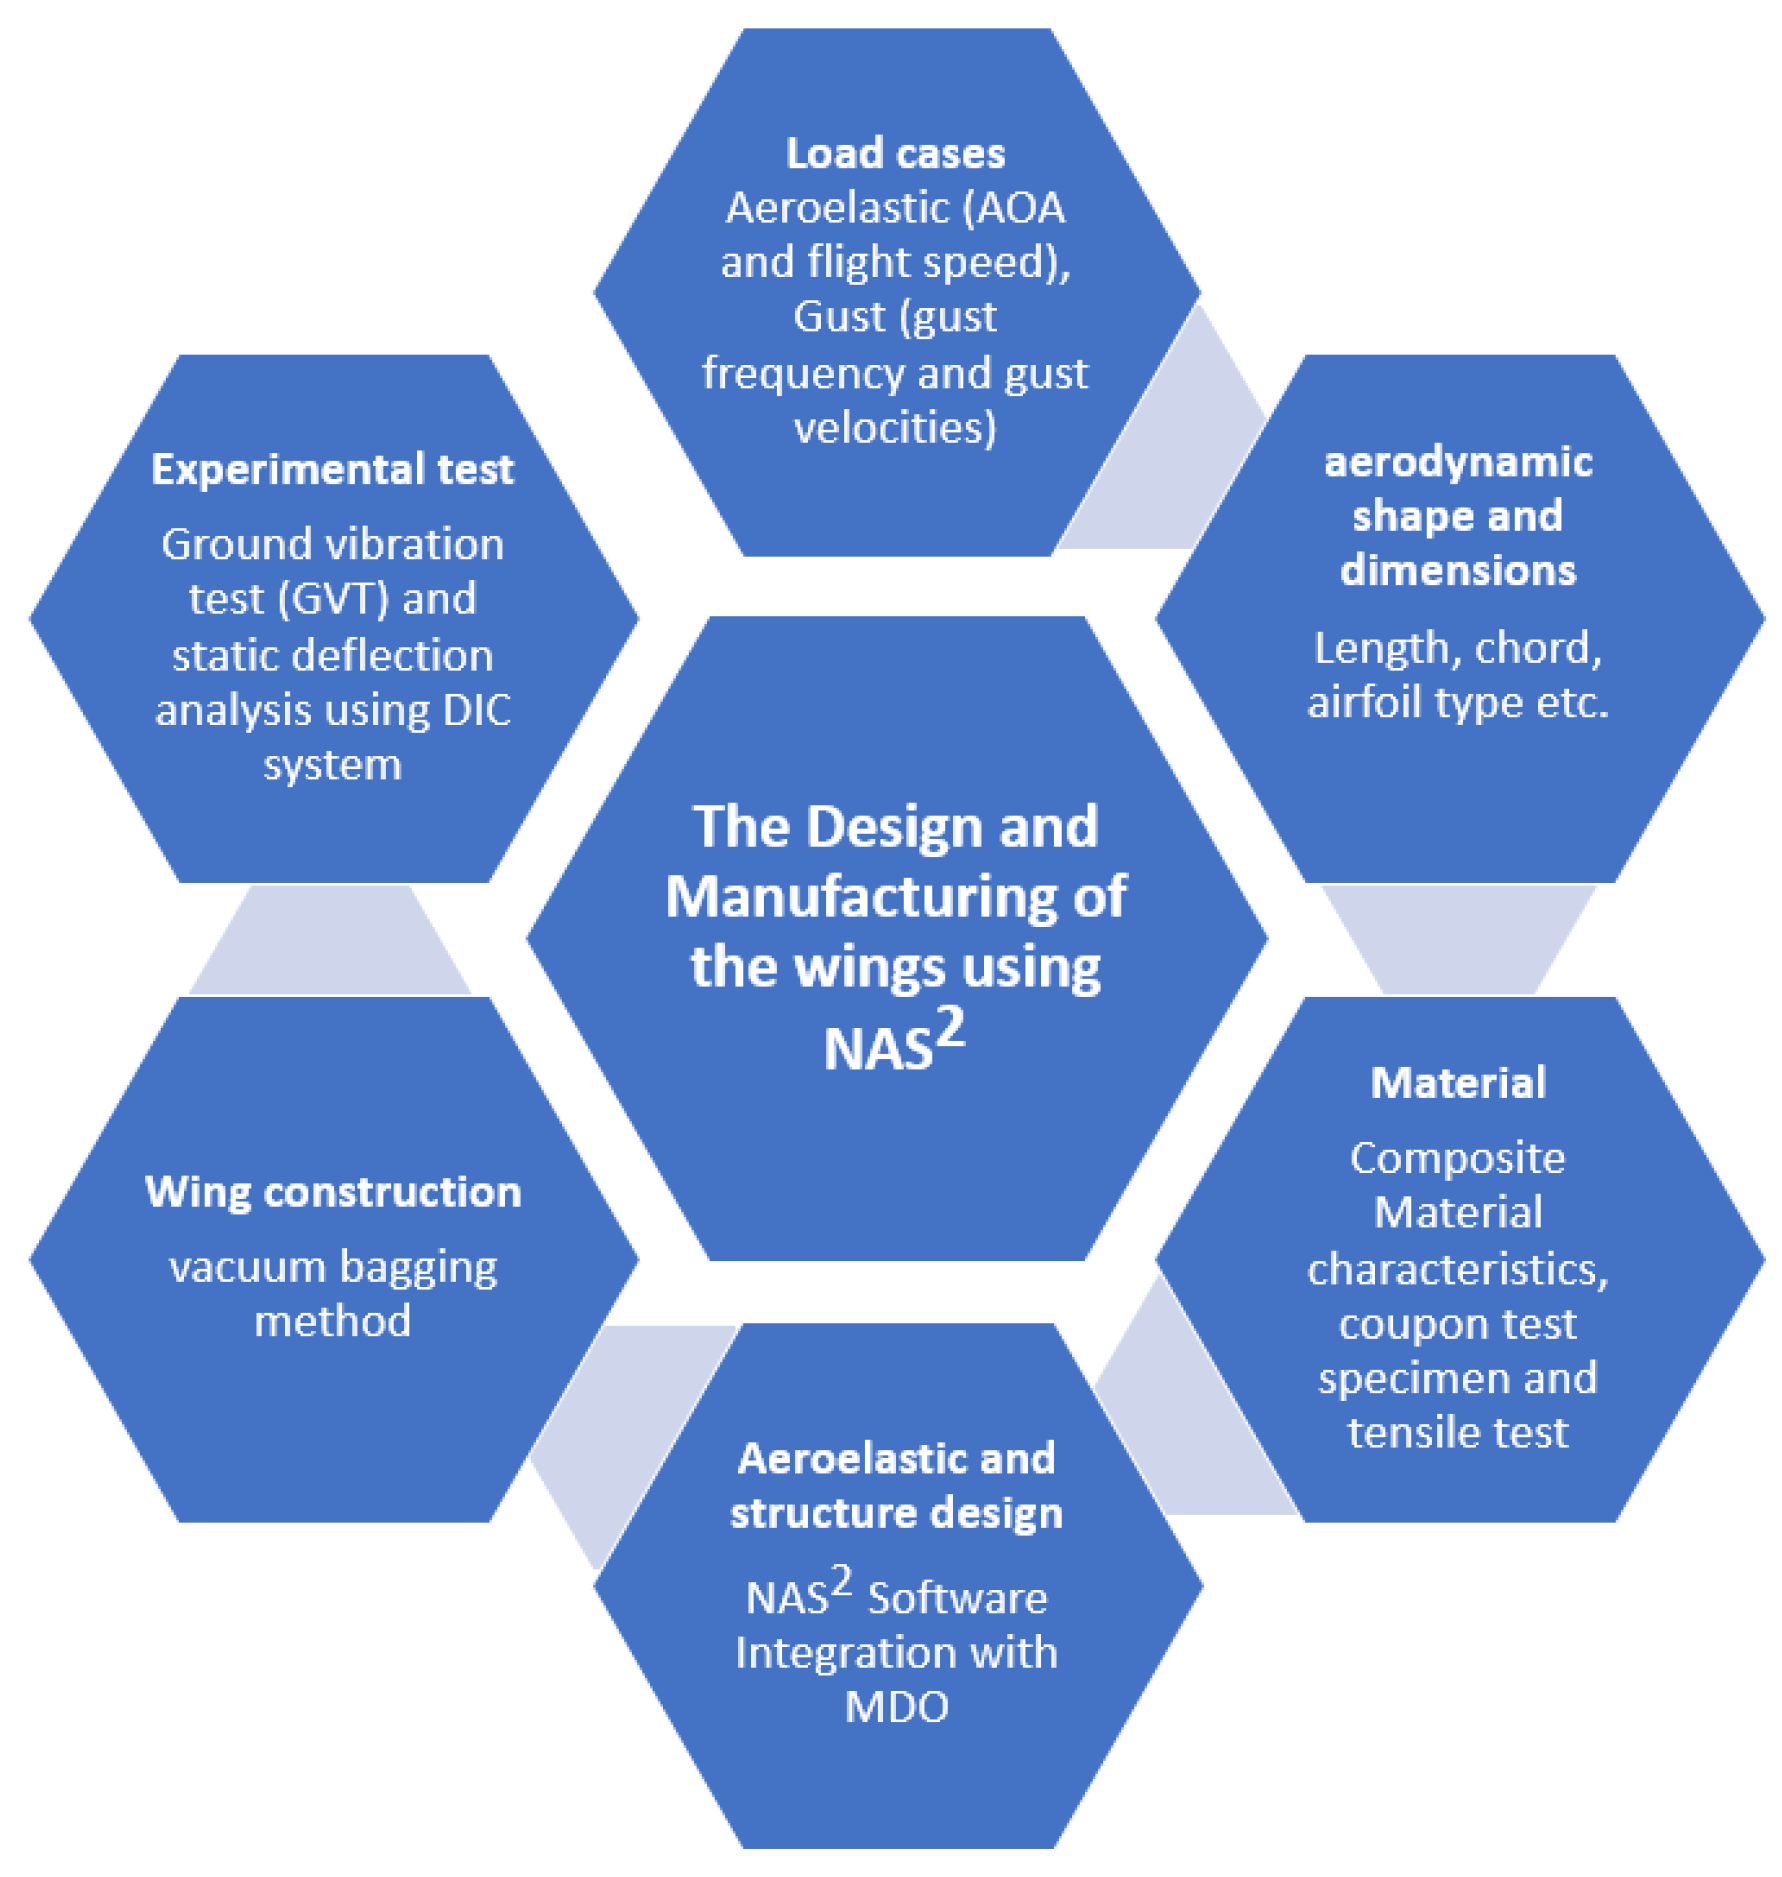
- The objective is to comprehend the practical behavior of high aspect ratio wings constructed from composite materials, considering both static and aeroelastic constraints, and assess the efficiency of optimization in enhancing the overall performance. To achieve this goal, a flexible wing with an aspect ratio of 14 and a span of 1.25 m was specifically designed to be critical in terms of structural, static, and dynamic parameters.
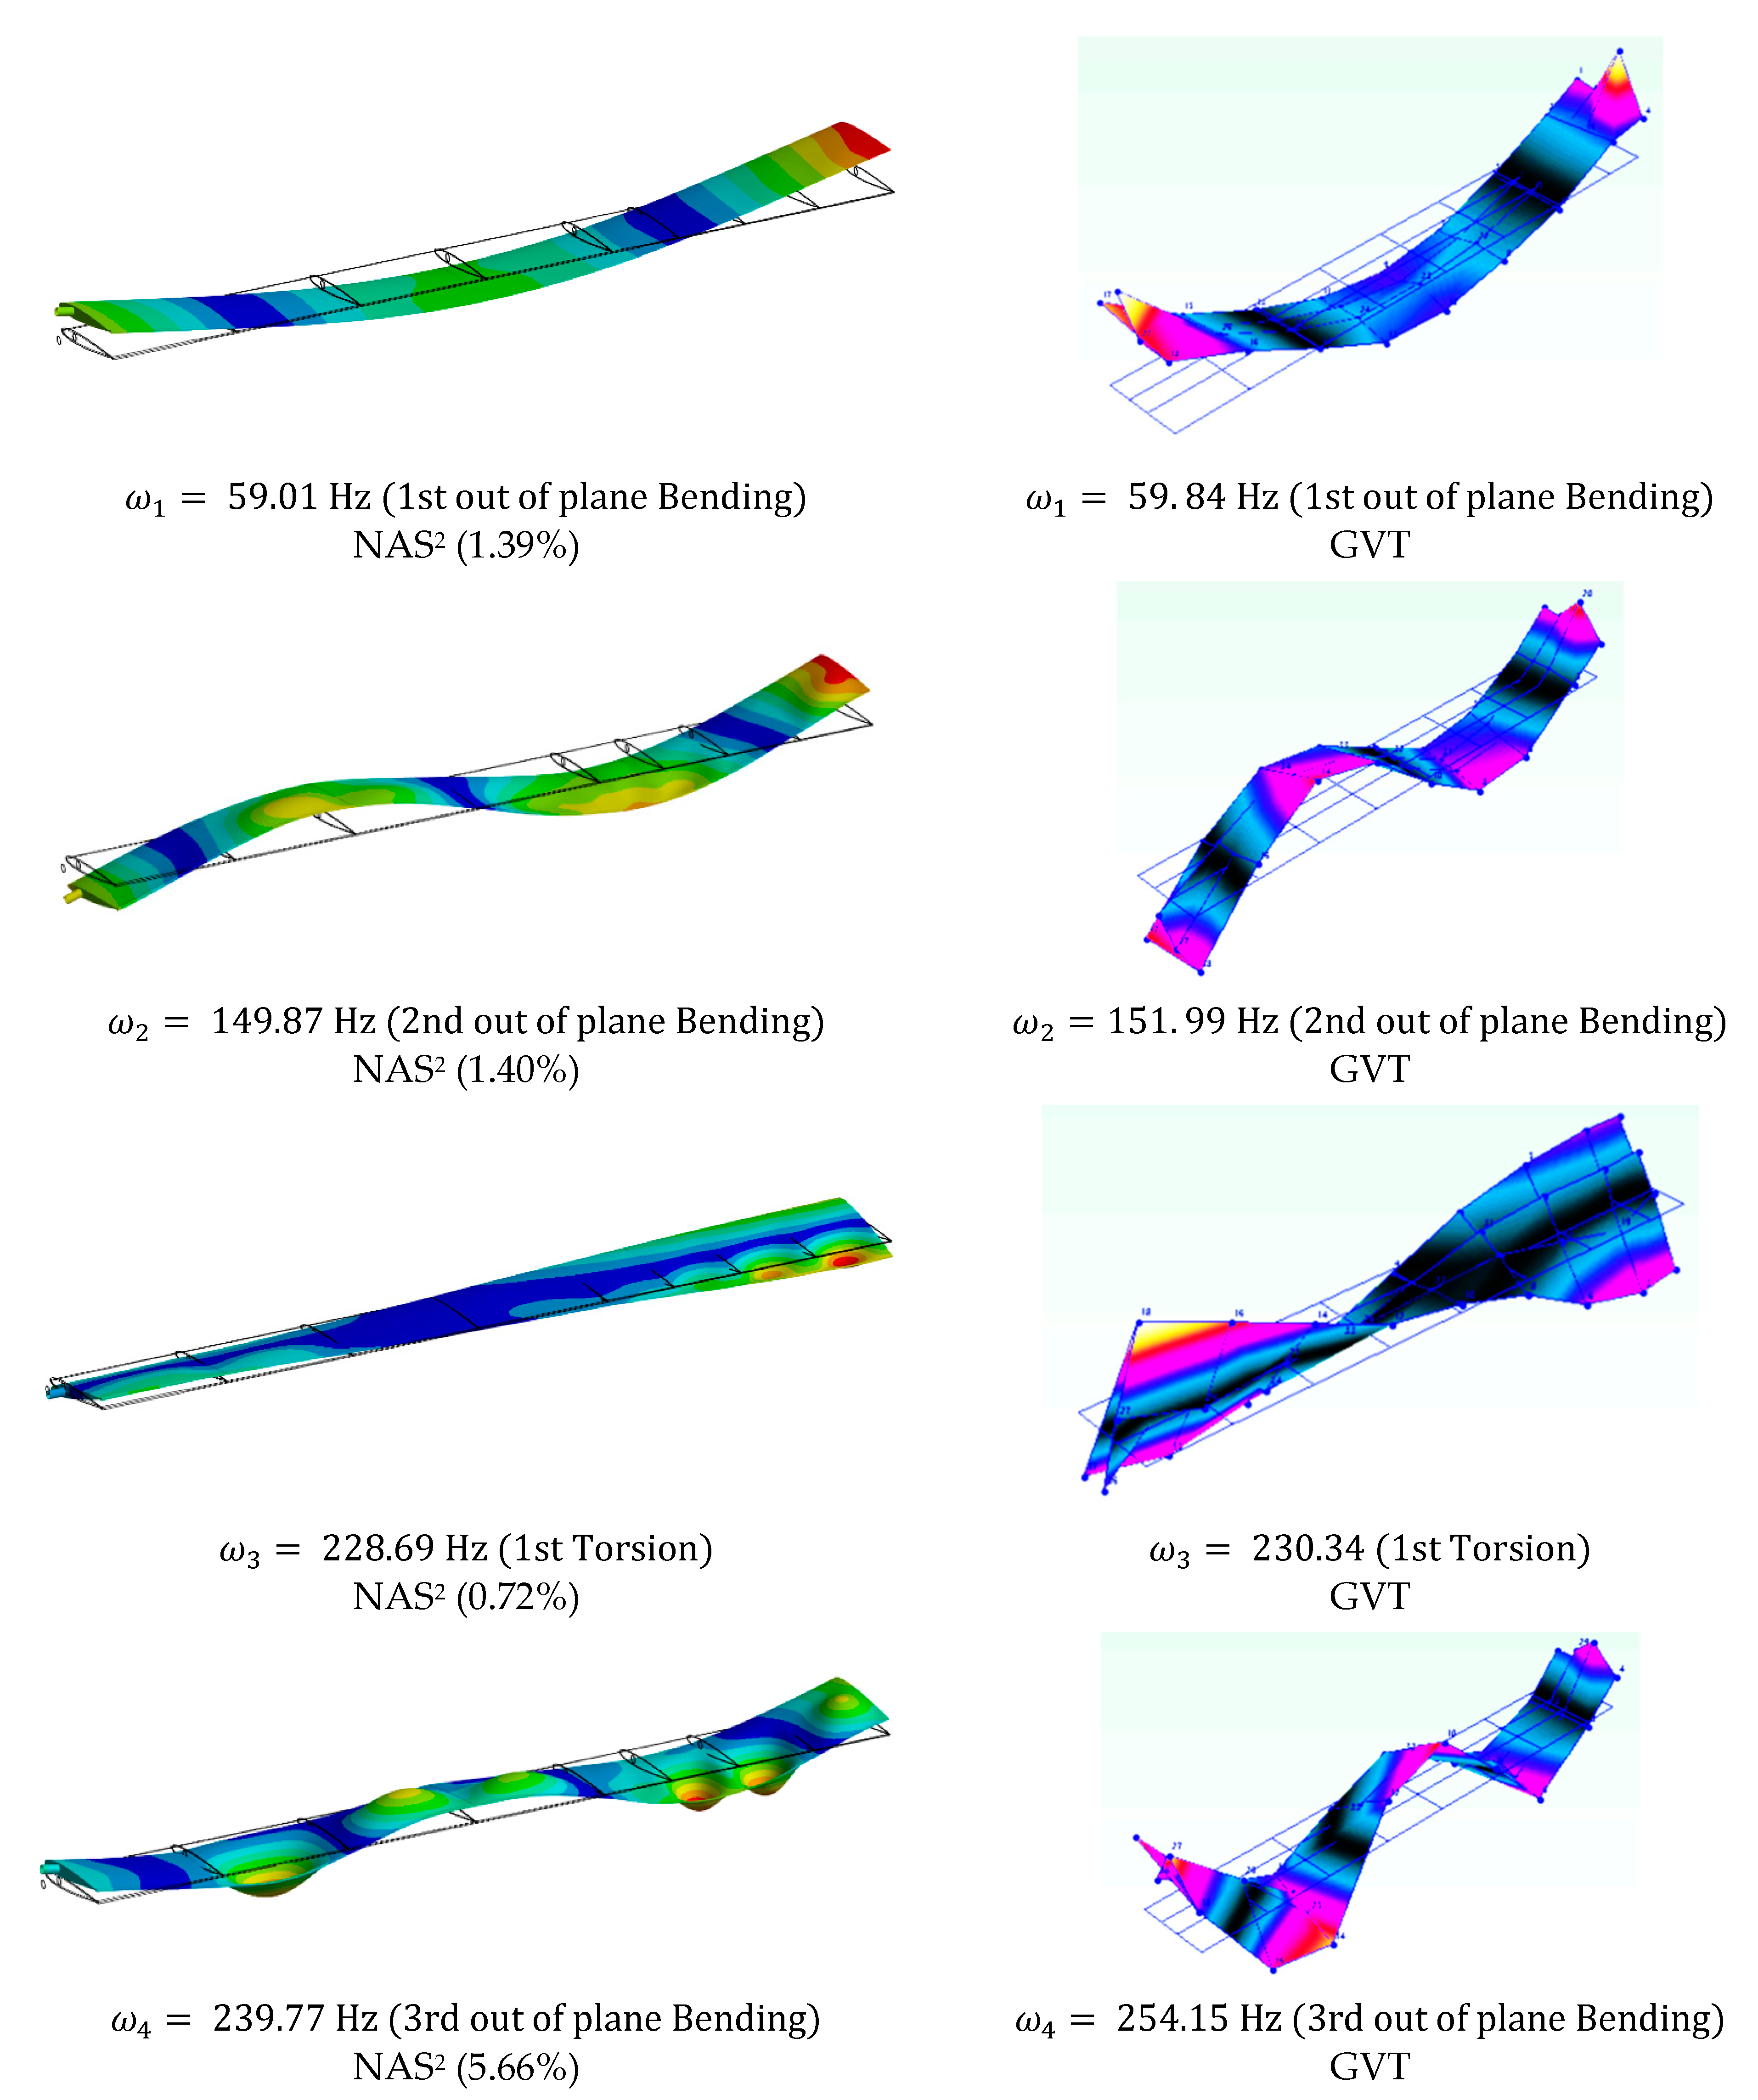
- The optimized wing was constructed using UD TR50S carbon fiber and subjected to a Ground Vibration Test (GVT) for evaluation. The GVT results validated and correlated well with the numerical simulation employed in designing the optimized wing, demonstrating a reasonable accuracy with a maximum difference of less than 6%.
- Across different load cases, the impact of nonlinearity on flutter boundaries may vary. However, it notably impacts the aeroelastic and failure criteria of a composite wing. For the load case with U = 30 m/s and α = 5°, differences of 21.1% and 27.5%, respectively, are observed between geometrically linear and nonlinear solutions in terms of static aeroelastic deflection and failure criteria.
- The proposed MMDO method introduces several unique aspects that significantly advance the optimization of composite aircraft structures compared to existing approaches. Firstly, its adoption of a multilayer optimization approach enables the seamless integration of various methods with different levels of accuracy and speed, resulting in a comprehensive system capable of achieving high accuracy and performance. Secondly, the inclusion of unit twist as a parameter in the initial optimization layer serves to expedite subsequent optimization processes, enhancing overall efficiency. Additionally, the method’s innovative combination of linear and nonlinear methods ensures a nuanced approach to capturing the complex physics of composite aircraft structure optimization while effectively managing simulation time. This balanced integration ultimately leads to a more comprehensive and efficient optimization process, distinguishing MMDO from existing approaches and promising significant advancements in the field.
- NAS2 Software Validation: Enhance NAS2 software reliability through additional validation studies, comparing predictions with wind tunnel experimental data across various angles of attack and Reynolds numbers.
- Industry Impact: MMDO optimization of composite wing designs promises substantial cost savings by reducing material usage and improving structural efficiency. NAS2’s user-friendly interface and robust optimization capabilities make it highly feasible for industry adoption. Integration into existing workflows empowers manufacturers with advanced tools for efficient wing optimization.
- Research Directions: Future research aims to integrate active and passive control surface mechanisms, such as folding wingtip devices, to enhance high aspect ratio wing performance in turbulent conditions. Furthermore, the enhancement of NAS2 entails the development of an integrated framework for aeroelastic analysis MDO. This involves the integration of Computational Fluid Dynamics (CFD) and Computational Structural Dynamics (CSD) methods to capture superior interaction dynamics, particularly in scenarios with higher Reynolds numbers where viscosity plays a crucial role and in cases of high torsional deformation where dynamic stall may occur.
Author Contributions
Funding
Data Availability Statement
Conflicts of Interest
References
- Toffol, F.; Ricci, S. Preliminary Aero-Elastic Optimization of a Twin-Aisle Long-Haul Aircraft with Increased Aspect Ratio. Aerospace 2023, 10, 374. [Google Scholar] [CrossRef]
- Wunderlich, T.F. Multidisciplinary wing optimization of commercial aircraft with consideration of static aeroelasticity. CEAS Aeronaut. J. 2015, 6, 407–427. [Google Scholar] [CrossRef]
- Dillinger, J.K.; Abdalla, M.M.; Meddaikar, Y.M.; Klimmek, T. Static aeroelastic stiffness optimization of a forward swept composite wing with CFD-corrected aero loads. CEAS Aeronaut. J. 2019, 10, 1015–1032. [Google Scholar] [CrossRef]
- Zhao, W.; Kapania, R.K. Static aeroelastic optimization of aircraft wing with multiple surfaces. In Proceedings of the 18th AIAA/ISSMO Multidisciplinary Analysis and Optimization Conference, Denver, CO, USA, 5–9 June 2017; p. 4320. [Google Scholar]
- Dillinger, J.K.S.; Klimmek, T.; Abdalla, M.M.; Gürdal, Z. Stiffness optimization of composite wings with aeroelastic constraints. J. Aircr. 2013, 50, 1159–1168. [Google Scholar] [CrossRef]
- Stanford, B.K.; Jutte, C.V.; Wieseman, C.D. Trim and structural optimization of subsonic transport wings using nonconventional aeroelastic tailoring. AIAA J. 2016, 54, 293–309. [Google Scholar] [CrossRef]
- Jutte, C.; Stanford, B.K. Aeroelastic Tailoring of Transport Aircraft Wings: State-of-the-Art and Potential Enabling Technologies; (No. NASA/TM-2014-218252); NTRS—NASA Technical Reports Server: Fort Worth, TX, USA, 2014.
- Stodieck, O.; Cooper, J.E.; Weaver, P.M.; Kealy, P. Improved aeroelastic tailoring using tow-steered composites. Compos. Struct. 2013, 106, 703–715. [Google Scholar] [CrossRef]
- Bordogna, M.T.; Lancelot, P.; Bettebghor, D.; De Breuker, R. Static and dynamic aeroelastic tailoring with composite blending and maneuver load alleviation. Struct. Multidiscip. Optim. 2020, 61, 2193–2216. [Google Scholar] [CrossRef]
- Belardo, M.; Marano, A.D.; Beretta, J.; Diodati, G.; Graziano, M.; Capasso, M.; Di Palma, L. Wing structure of the Next-Generation Civil Tiltrotor: From concept to preliminary design. Aerospace 2021, 8, 102. [Google Scholar] [CrossRef]
- Rafiee, R.; Farsadi, T.; Tehrani, M.A.; Sharifi, P. Linkage Learning Optimization of Aeroelastic and Structural Behavior of Composite Wings. Int. J. Aeronaut. Space Sci. 2023, 24, 1187–1198. [Google Scholar] [CrossRef]
- Wang, Z.; Peeters, D.; De Breuker, R. An aeroelastic optimisation framework for manufacturable variable stiffness composite wings including critical gust loads. Struct. Multidiscip. Optim. 2022, 65, 290. [Google Scholar] [CrossRef]
- Zhu, Q.; Zhou, L.; Wen, J.; Liu, T.; Zhang, J.; Tang, H.; Zhang, H. Laminar flow over a rectangular cylinder experiencing torsional flutter: Dynamic response, forces and coherence modes. Phys. Fluids 2023, 35, 093610. [Google Scholar] [CrossRef]
- Liu, Z.; Zhou, L.; Tang, H.; Wang, Z.; Zhao, F.; Ji, X.; Zhang, H. Primary instability, sensitivity and active control of flow past two tandem circular cylinders. Ocean Eng. 2024, 294, 116863. [Google Scholar] [CrossRef]
- Wen, J.; Zhou, L.; Zhang, H. Mode interpretation of blade number effects on wake dynamics of small-scale horizontal axis wind turbine. Energy 2023, 263, 125692. [Google Scholar] [CrossRef]
- Mitrotta, F.M.A.; Rajpal, D.; Sodja, J.; De Breuker, R. Multi-fidelity design of an aeroelastically tailored composite wing for dynamic wind-tunnel testing. In Proceedings of the AIAA Scitech 2020 Forum, Orlando, FL, USA, 6–9 January 2020; p. 1636. [Google Scholar]
- Ma, Y.; Elham, A. Designing high aspect ratio wings: A review of concepts and approaches. Prog. Aerosp. Sci. 2024, 145, 100983. [Google Scholar] [CrossRef]
- Farsadi, T.; Asadi, D.; Kurtaran, H. Fundamental frequency optimization of variable stiffness composite skew plates. Acta Mech. 2021, 232, 555–573. [Google Scholar] [CrossRef]
- Handojo, V.; Himisch, J.; Bramsiepe, K.; Krüger, W.R.; Tichy, L. Potential Estimation of Load Alleviation and Future Technologies in Reducing Aircraft Structural Mass. Aerospace 2022, 9, 412. [Google Scholar] [CrossRef]
- Farsadi, T.; Rahmanian, M.; Kurtaran, H. Nonlinear lay-up optimization of variable stiffness composite skew and taper cylindrical panels in free vibration. Compos. Struct. 2021, 262, 113629. [Google Scholar] [CrossRef]
- Wang, Y.; Li, X.; Wu, T.; Yin, H. Multidisciplinary Design and Optimization of Variable Camber Wing with Non-Equal Chord. Aerospace 2023, 10, 336. [Google Scholar] [CrossRef]
- Benaouali, A.; Kachel, S. Multidisciplinary design optimization of aircraft wing using commercial software integration. Aerosp. Sci. Technol. 2019, 92, 766–776. [Google Scholar] [CrossRef]
- Sinha, K.; Klimmek, T.; Schulze, M.; Handojo, V. Loads analysis and structural optimization of a high aspect ratio, composite wing aircraft. CEAS Aeronaut. J. 2021, 12, 233–243. [Google Scholar] [CrossRef]
- Silva, G.H.; do Prado, A.P.; Cabral, P.H.; De Breuker, R.; Dillinger, J.K. Tailoring of a composite regional jet wing using the slice and swap method. J. Aircr. 2019, 56, 990–1004. [Google Scholar] [CrossRef]
- Saporito, M.; Da Ronch, A.; Bartoli, N.; Defoort, S. Robust multidisciplinary analysis and optimization for conceptual design of flexible aircraft under dynamic aeroelastic constraints. Aerosp. Sci. Technol. 2023, 138, 108349. [Google Scholar] [CrossRef]
- Rajpal, D.; Gillebaart, E.; De Breuker, R. Preliminary aeroelastic design of composite wings subjected to critical gust loads. Aerosp. Sci. Technol. 2019, 85, 96–112. [Google Scholar] [CrossRef]
- Kilimtzidis, S.; Kostopoulos, V. Static Aeroelastic Optimization of High-Aspect-Ratio Composite Aircraft Wings via Surrogate Modeling. Aerospace 2023, 10, 251. [Google Scholar] [CrossRef]
- Kafkas, A.; Kilimtzidis, S.; Kotzakolios, A.; Kostopoulos, V.; Lampeas, G. Multi-Fidelity Optimization of a Composite Airliner Wing Subject to Structural and Aeroelastic Constraints. Aerospace 2021, 8, 398. [Google Scholar] [CrossRef]
- Landsberger, B.J.; Dugundji, J. Experimental aeroelastic behavior of unswept and forward-swept cantilever graphite/epoxy wings. J. Aircr. 1985, 22, 679–686. [Google Scholar] [CrossRef]
- Chen, G.S.; Dugundji, J. Experimental aeroelastic behavior of forward-swept graphite/epoxy wings with rigid-body freedom. J. Aircr. 1987, 24, 454–462. [Google Scholar] [CrossRef]
- Meddaikar, Y.M.; Dillinger, J.K.; Sodja, J.; Mai, H.; De Breuker, R. Optimization, manufacturing and testing of a composite wing with maximized tip deflection. In Proceedings of the 57th AIAA/ASCE/AHS/ASC Structures, Structural Dynamics, and Materials Conference, San Diego, CA, USA, 4–6 January 2016; p. 0489. [Google Scholar]
- Krüger, W.R.; Meddaikar, Y.M.; Dillinger, J.K.; Sodja, J.; De Breuker, R. Application of Aeroelastic Tailoring for Load Alleviation on a Flying Demonstrator Wing. Aerospace 2022, 9, 535. [Google Scholar] [CrossRef]
- Meddaikar, M.Y.; Dillinger, J.; Ritter, M.R.; Govers, Y. Optimization testing of aeroelastically-tailored forward swept wings. In Proceedings of the IFASD 2017—International Forum on Aeroelasticity and Structural Dynamics, Como, Italy, 25–28 June 2017. [Google Scholar]
- Ritter, M.; Dillinger, J.; Meddaikar, Y.M. Static and dynamic aeroelastic validation of a flexible forward swept composite wing. In Proceedings of the 58th AIAA/ASCE/AHS/ASC Structures, Structural Dynamics, and Materials Conference, Grapevine, TX, USA, 9–13 January 2017; p. 0637. [Google Scholar]
- Turgut, T. Manufacturing and Structural Analysis of a Lightweight Sandwich Composite UAV Wing. Master’s Thesis, Middle East Technical University, Ankara, Turkey, 2007. [Google Scholar]
- Rajpal, D.; Mitrotta, F.M.A.; Socci, C.A.; Sodja, J.; Kassapoglou, C.; De Breuker, R. Design and testing of aeroelastically tailored composite wing under fatigue and gust loading including effect of fatigue on aeroelastic performance. Compos. Struct. 2021, 275, 114373. [Google Scholar] [CrossRef]
- Farsadi, T.; Rahmanian, M.; Kayran, A. Geometrically nonlinear aeroelastic behavior of pretwisted composite wings modeled as thin walled beams. J. Fluids Struct. 2018, 83, 259–292. [Google Scholar] [CrossRef]
- Farsadi, T.; Rahmanian, M.; Kayran, A. Reduced order nonlinear aeroelasticity of swept composite wings using compressible indicial unsteady aerodynamics. J. Fluids Struct. 2020, 92, 102812. [Google Scholar] [CrossRef]
- Tang, D.; Dowell, E.H. Experimental and theoretical study on aeroelastic response of high-aspect-ratio wings. AIAA J. 2001, 39, 1430–1441. [Google Scholar] [CrossRef]
- Gray, A.C.; Riso, C.; Jonsson, E.; Martins, J.R.; Cesnik, C.E. High-fidelity Aerostructural Optimization with a Geometrically Nonlinear Flutter Constraint. AIAA J. 2023, 61, 2430–2443. [Google Scholar] [CrossRef]
- Chao, A.; Chao, Y.; Changchuan, X.; Lan, Y.A.N.G. Flutter and gust response analysis of a wing model including geometric nonlinearities based on a modified structural ROM. Chin. J. Aeronaut. 2020, 33, 48–63. [Google Scholar]
- Riso, C.; Cesnik, C.E.S. Geometrically Nonlinear Effects in Wing Aeroelastic Dynamics at Large Deflections. J. Fluids Struct. 2023, 120, 103897. [Google Scholar] [CrossRef]
- Jonsson, E.; Riso, C.; Lupp, C.A.; Cesnik, C.E.; Martins, J.R.; Epureanu, B.I. Flutter and post-flutter constraints in aircraft design optimization. Prog. Aerosp. Sci. 2019, 109, 100537. [Google Scholar] [CrossRef]
- Hodges, D.H. Geometrically exact equations for beams. Encycl. Contin. Mech. 2020, 1042–1049. [Google Scholar]
- Yu, W.; Hodges, D.H.; Ho, J.C. Variational asymptotic beam sectional analysis–an updated version. Int. J. Eng. Sci. 2012, 59, 40–64. [Google Scholar] [CrossRef]
- Farsadi, T. Aeroelastic Analysis of Composite Wings and Wind Turbine Blades Including Geometrical Nonlinearity and Compressibility. Ph.D. Thesis, Middle East Technical University, Ankara, Turkiye, 2018. [Google Scholar]
- Librescu, L.; Song, O. Thin-Walled Composite Beams: Theory and Application; Springer Science Business Media: Berlin/Heidelberg, Germany, 2005; Volume 131. [Google Scholar]
- Sina, S.A.; Farsadi, T.; Haddadpour, H. Aeroelastic stability and response of composite swept wings in subsonic flow using indicial aerodynamics. J. Vib. Acoust. 2013, 135, 051019. [Google Scholar] [CrossRef]
- Permoon, M.R.; Farsadi, T. Free vibration of three-layer sandwich plate with viscoelastic core modelled with fractional theory. Mech. Res. Commun. 2021, 116, 103766. [Google Scholar] [CrossRef]
- Katz, J.; Plotkin, A. Low-Speed Aerodynamics; Cambridge University Press: Cambridge, UK, 2001; Volume 13. [Google Scholar]
- Farsadi, T.; Rahmanian, M.; Kurtaran, H. Nonlinear analysis of functionally graded skewed and tapered wing-like plates including porosities: A bifurcation study. Thin-Walled Struct. 2021, 160, 107341. [Google Scholar] [CrossRef]
- Rodden, W.P.; Johnson, E.H. MSC/NASTRAN Aeroelastic Analysis: User’s Guide; Version 68; MacNeal-Schwendler Corporation: Santa ANA, CA, USA, 1994. [Google Scholar]
- ZONA Technology, Inc. (ZONA). Available online: https://www.zonatech.com/zaero.html (accessed on 10 January 2023).
- Balatti, D.; Haddad Khodaparast, H.; Friswell, M.I.; Manolesos, M. Improving Wind Tunnel “1-cos” Gust Profiles. J. Aircr. 2022, 59, 1514–1528. [Google Scholar] [CrossRef]
- Kayran, A. Küssner’s Function in the Sharp Edged Gust Problem-A Correction. J. Aircr. 2006, 43, 1596–1599. [Google Scholar] [CrossRef]
- Asadi, D.; Farsadi, T.; Kayran, A. Flutter optimization of a wing–engine system with passive and active control approaches. AIAA J. 2021, 59, 1422–1440. [Google Scholar] [CrossRef]
- Marini, F.; Walczak, B. Particle swarm optimization (PSO). A tutorial. Chemom. Intell. Lab. Syst. 2015, 149, 153–165. [Google Scholar] [CrossRef]
- Groenwold, A.A.; Haftka, R.T. Optimization with non-homogeneous failure criteria like Tsai–Wu for composite laminates. Struct. Multidiscip. Optim. 2006, 32, 183–190. [Google Scholar] [CrossRef]
- Balatti, D.; Khodaparast, H.H.; Friswell, M.I.; Manolesos, M.; Castrichini, A. Experimental and numerical investigation of an aircraft wing with hinged wingtip for gust load alleviation. J. Fluids Struct. 2023, 119, 103892. [Google Scholar] [CrossRef]
- Murua, J.; Palacios, R.; Graham, J.M.R. Assessment of wake-tail interference effects on the dynamics of flexible aircraft. AIAA J. 2012, 50, 1575–1585. [Google Scholar] [CrossRef]
- Wang, Z.; Chen, P.C.; Liu, D.D.; Mook, D.T.; Patil, M.J. Time domain nonlinear aeroelastic analysis for HALE wings. In Proceedings of the 47th AIAA/ASME/ASCE/AHS/ASC Structures, Structural Dynamics, and Materials Conference, Newport, RI, USA, 1–4 May 2006; p. 1640. [Google Scholar]
- Riso, C.; Cesnik, C.E.S. Available online: https://github.com/UM-A2SRL/AePW3-LDWG/tree/main/04_2023_JFS_Riso_Cesnik (accessed on 10 January 2023).


| Objectives: Minimize the combined objective function f(x) representing the trade-off between minimizing the wing weight and maximizing the unit twist factor: f(x) = Wing Weight(x) − λ × Unit Twist Factor(x) where x is the vector of design variables, and λ is a weight factor. Variables: Design variables (x): Length of regions for the upper skin, Length of regions for the lower skin, Number of layers for the upper skin, Number of layers for the lower skin, Number of layers for the spar, Fiber angle for the upper skin, Fiber angle for the lower skin, Fiber angle for the spar, Rib positions, Constraints: The optimization problem is subject to the following constraints: Load Multiplier: Buckling(x), Inverse Reverse Factor: Static Strength(x) and Composite Failure(x) Flutter and Divergence: Aeroelastic Instability(x) Manufacturability: See Figure 3 Load Cases: The optimization considers three load cases: Static Load (Function of flight speed (V) and AOA (α)) Dynamic Load (Function of flight speed (V) and AOA (α)) Gust Load (Function of gust frequencies and gust velocities ) |
| Instability Speed (m/s) | Instability Freq. (rad/s) | |
|---|---|---|
| NAS2 | 164 | 64 |
| Murua et al. [61] | 165 | 69 |
| Wang et al. [62] | 164 | - |
| V (m/s) | 30 | 40 | 50 | 60 |
|---|---|---|---|---|
| NAS2 | 10 | 18.59 | 30.29 | 43.98 |
| Fully nonlinear [43] | 9.87 (−1.3%) | 18.57 (−0.11%) | 30.41 (0.4%) | 44.28 (0.68%) |
| Non-follower loads [43] | 9.82 (−1.8%) | 18.22 (−1.99%) | 28.94 (−4.46%) | 40.39 (−8.16%) |
| Linear kinematics [43] | 9.98 (−0.2%) | 19.32 (3.93%) | 34 (12.25%) | 57.72 (31.24%) |
| Fully linear [43] | 9.98 (−0.2%) | 19.31 (3.87%) | 34 (12.25%) | 57.71 (31.22%) |
| Objectives: f(x) = Wing Weight(x) − λ × Unit Twist Factor(x) Variables: [mm] (0 to 1250); [mm] (0 to 1250); (2 to 16); (2 to 16); (fixed at 4); [°](−90 to 90); [°](−90 to 90); [°](−90 to 90); [mm] (0 to 625) Constraints: Buckling(x) ≥ 1.1; Static Strength(x) ≤ 0.9; Composite Failure(x) ≤ 0.9; Aeroelastic Instability(x) ≥ 75 m/s Load Cases: Static Load and Dynamic Load (V = 30 m/s, α = 5° & α = −2.5°) Gust Load ( (1 to 20); (0.1 to 1)) |
| Failure Criteria | Linear | Nonlinear | ||
|---|---|---|---|---|
| α = 5° | α = −2.5° | α = 5° | α = −2.5° | |
| Inverse reverse factor | 0.69 | 0.34 | 0.88 (+27.53%) | 0.33 (−2.93%) |
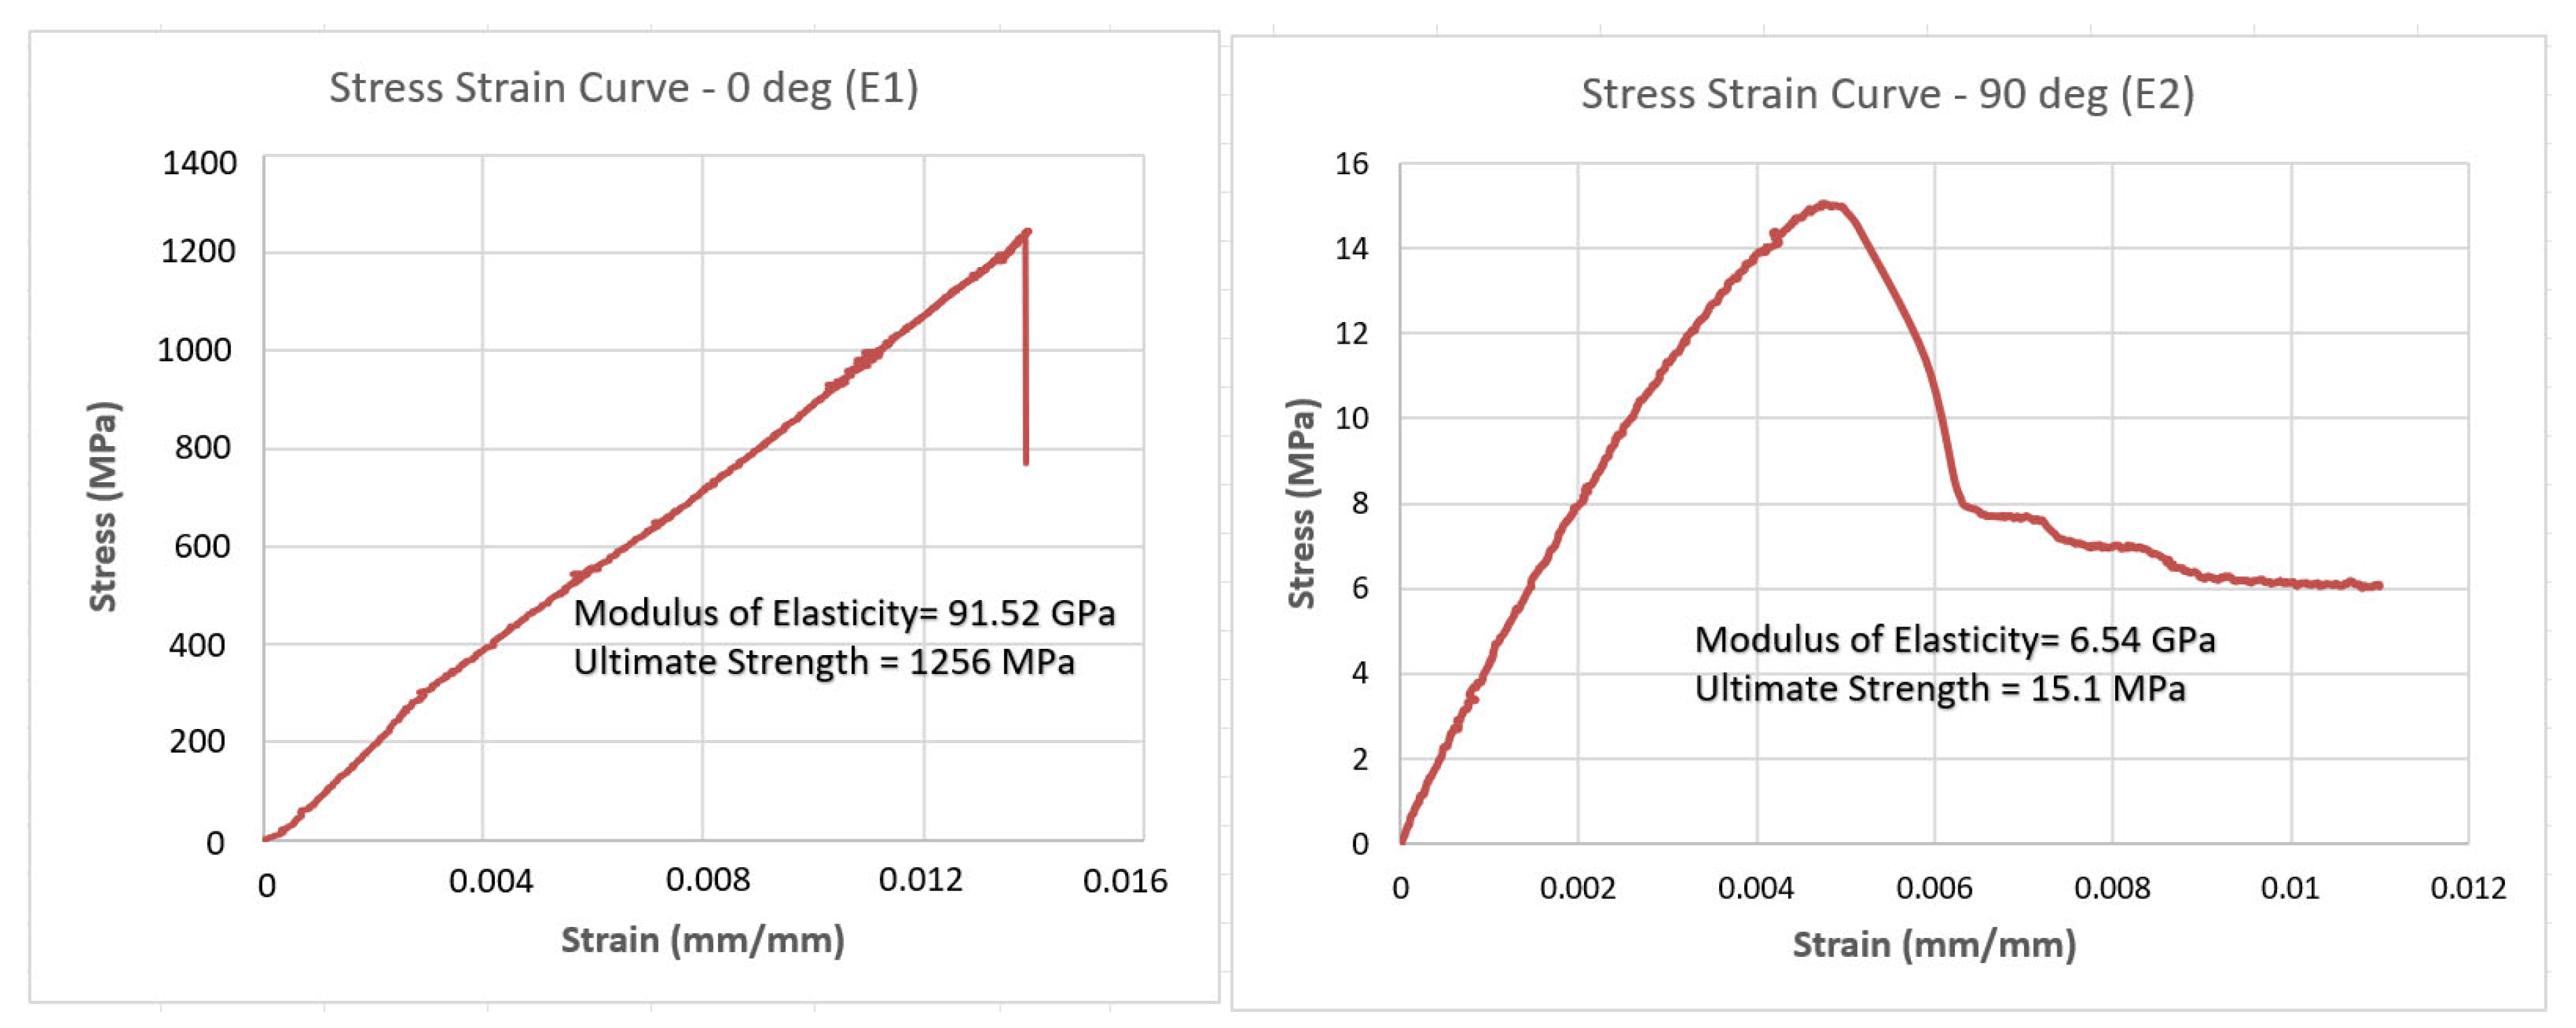
| E1 (GPa) | E2 (GPa) | G12 (GPa) | ν12 | ρ (kg/m3) |
| 91.52 | 6.54 | 3.6 | 0.27 | 1490 |
| XT (MPa) | XC (MPa) | YT (MPa) | YC (MPa) | S (MPa) |
| 1256.0 | 822.3 | 15.1 | 76.0 | 45.6 |
| Loading | DIC Results | NAS2 Results | Diff (%) | DIC Results | NAS2 Results | Diff (%) |
|---|---|---|---|---|---|---|
| from Wing Root | from Wing Root | |||||
| Stage 1 (374 g) | 7.19 | 7.10 | 1.25 | 8.71 | 8.60 | 1.26 |
| Stage 2 (748 g) | 11.08 | 10.87 | 1.89 | 13.51 | 13.22 | 2.15 |
| Stage 3 (1723 g) | 21.60 | 20.70 | 4.16 | 26.43 | 25.30 | 4.27 |
Disclaimer/Publisher’s Note: The statements, opinions and data contained in all publications are solely those of the individual author(s) and contributor(s) and not of MDPI and/or the editor(s). MDPI and/or the editor(s) disclaim responsibility for any injury to people or property resulting from any ideas, methods, instructions or products referred to in the content. |
© 2024 by the authors. Licensee MDPI, Basel, Switzerland. This article is an open access article distributed under the terms and conditions of the Creative Commons Attribution (CC BY) license (https://creativecommons.org/licenses/by/4.0/).
Share and Cite
Farsadi, T.; Ahmadi, M.; Sahin, M.; Haddad Khodaparast, H.; Kayran, A.; Friswell, M.I. High Aspect Ratio Composite Wings: Geometrically Nonlinear Aeroelasticity, Multi-Disciplinary Design Optimization, Manufacturing, and Experimental Testing. Aerospace 2024, 11, 193. https://doi.org/10.3390/aerospace11030193
Farsadi T, Ahmadi M, Sahin M, Haddad Khodaparast H, Kayran A, Friswell MI. High Aspect Ratio Composite Wings: Geometrically Nonlinear Aeroelasticity, Multi-Disciplinary Design Optimization, Manufacturing, and Experimental Testing. Aerospace. 2024; 11(3):193. https://doi.org/10.3390/aerospace11030193
Chicago/Turabian StyleFarsadi, Touraj, Majid Ahmadi, Melin Sahin, Hamed Haddad Khodaparast, Altan Kayran, and Michael I. Friswell. 2024. "High Aspect Ratio Composite Wings: Geometrically Nonlinear Aeroelasticity, Multi-Disciplinary Design Optimization, Manufacturing, and Experimental Testing" Aerospace 11, no. 3: 193. https://doi.org/10.3390/aerospace11030193
APA StyleFarsadi, T., Ahmadi, M., Sahin, M., Haddad Khodaparast, H., Kayran, A., & Friswell, M. I. (2024). High Aspect Ratio Composite Wings: Geometrically Nonlinear Aeroelasticity, Multi-Disciplinary Design Optimization, Manufacturing, and Experimental Testing. Aerospace, 11(3), 193. https://doi.org/10.3390/aerospace11030193