Article

Experimental Investigation of the Effect of Bio-Inspired Wavy Leading-Edges on Aerodynamic Performance and Flow Topologies of the Airfoil

1
School of Aeronautics and Astronautics, Xihua University, Chengdu 610039, China
2
Engineering Research Center of Intelligent Air-Space Integration Vehicle and Control of Ministry of Education, School of Aerospace, Xihua University, Chengdu 610039, China
3
Key Laboratory of Fluid and Power Machinery, Ministry of Education, Xihua University, Chengdu 610039, China
4
School of Power and Energy Engineering, Xi’an Jiaotong University, Xi’an 710049, China
5
High Speed Aerodynamic Institute, China Aerodynamics Research and Development Center, Mianyang 621000, China
*
Author to whom correspondence should be addressed.
Aerospace 2024, 11(3), 194; https://doi.org/10.3390/aerospace11030194
Submission received: 14 January 2024 / Revised: 21 February 2024 / Accepted: 27 February 2024 / Published: 29 February 2024
(This article belongs to the Special Issue Recent Advances in Applied Aerodynamics)

Abstract

:
The characteristic of delayed airfoil stalls caused by the bio-inspired Wavy Leading-Edges (WLEs) has attracted extensive attention. This paper investigated the effect of WLEs on the aerodynamic performance and flow topologies of the airfoil through wind tunnel experiments, while also discussing the flow control mechanism of WLEs. The result shows that, at small Angle of Attack (AOA), the flow through the WLEs exhibits periodic and symmetrical characteristics, where flow vortices upwash at the trough and downwash at the crest, resulting in flow from the crest to the trough. Upwash leads to the formation of a localized three-dimensional laminar separation bubble (LSB) structure at the leading edge of the trough section. At large AOA after baseline airfoil stall, the flow on the airfoil surface of WLEs presents a two-period pattern along the spanwise direction, and the separation zone and the attachment zone appear alternately, indicating that the control effect of delayed stall is accomplished by reducing the separation zone on the airfoil surface. The alternating occurrence of the separation and attachment zones is the result of intricate interactions among flows passing through multiple WLEs. This interaction causes the convergence of high-momentum attached airflows on both sides, thereby constraining the spread of the separation from the leading edge and enabling the re-attachment of separated air. The research results of this paper provide a reference for researchers to reveal the flow control mechanism of WLEs more comprehensively.

1. Introduction

Improving the aerodynamic performance of aircraft remains an ongoing endeavor within the domain of aeronautics and astronautics research. The organisms of nature that exhibit exceptional aerodynamic prowess serve as rich sources of inspiration for researchers [1], exemplified by creatures like humpback whales [2,3,4]. The WLEs on humpback whale fins showcase superior dynamic characteristics [5]. The aerodynamic performance of airfoils featuring WLEs, designed based on humpback whale fins, exhibits the potential for improvement [6,7,8]. Investigations have demonstrated that WLEs can delay stall onset [9,10,11], reduce drag [12,13,14], mitigate shock buffeting [12,15], influence shock wave structure [15], and attenuate noise [16,17,18].
To simplify the irregular WLEs found on fins, researchers frequently approximate the leading edge of airfoil with a sinusoidal shape in their studies. Subsequent investigations have revealed a correlation between the aerodynamic performance of the airfoil and the geometric attributes (amplitude, wavelength, and count) of WLEs. Johari et al. [19] conducted experimental investigations on airfoils featuring two wavelengths and three corresponding amplitudes. Force measurement outcomes indicated that the amplitudes of WLEs exerted a notable influence on the airfoil’s lift and pitch moment, whereas the wavelength exhibited a minor effect on the airfoil’s aerodynamic forces. In contrast, Hansen et al. [20] arrived at a contradictory standpoint, asserting that diminishing the wavelength can enhance lift performance, encompassing the maximum lift coefficient, stall angle, and post-stall attributes, with exceptions in specific instances. Furthermore, airfoils featuring larger amplitudes exhibit enhanced aerodynamic performance during post-stall condition. Cai et al. [21,22] considered the mutual influence of airflow between multiple WLEs, and therefore studied the effect of a single WLE on the aerodynamic performance. Aerodynamic force measurements revealed that airfoils featuring a single WLE display a two-step stall pattern, where the ratio of amplitude to wavelength takes a pivotal role in enhancing airfoil aerodynamic performance. The significance of the leading-edge amplitude-to-wavelength ratio has similarly been acknowledged in the works of Hansen et al. [20] and Custodio et al. [23].
The advantages of WLEs have garnered considerable attention, prompting extensive investigations into their internal flow control mechanism. Seyhan et al. [9] demonstrated that regardless of the WLEs waveform, WLEs effectively delay stall. Moreover, WLEs possess an optimal waveform that maximizes enhancements in lift coefficient, stall AOA, and overall aerodynamic performance. Their findings suggest that the vortex pair generated by WLEs contributes significantly to improving airfoil aerodynamic performance. Similarly, research by Colak et al. [24] indicates that rotationally induced vortex pair originating from WLEs contribute to enhancing airfoil aerodynamic performance. The resultant flow control effect arises from the influence of rotating vortices on the separated shear layer. In study of Cai et al. [22] study, the WLEs was found to restrict the local stall area along the spanwise direction of the airfoil, underscoring the significance of spanwise disturbance caused by the WLEs.
To elucidate the formation and development mechanism of streamwise vortices, Rostamzadeh et al. [25,26] investigated the influence of Reynolds number on WLEs airfoil. They elucidated the generation of streamwise vortices through the mechanism of induced tilt, finding that the development of streamwise vortices is accompanied by flow separation in the triangular region near the trailing edge. In comparison to the transitional state, the lift of baseline airfoil after stall in a turbulent state exceeds that of the WLEs airfoil, underscoring the significance of Reynolds number consideration in WLEs engineering applications. Hansen et al. [27] explored the formation and evolution of streamwise vortices through experimental and numerical methods. The outcomes revealed a pronounced pressure gradient near the WLEs that engenders substantial vorticity flux within the vicinity. Once initiated, this vorticity undergoes stretching, tilting, and diffusion in a markedly three-dimensional manner, leading to the formation of a pair of streamwise vortices with opposing rotation directions near the trough between the crest.
Hence, the underlying physical mechanism behind the flow control effect induced by the WLEs may stem from the alteration in pressure distribution at the airfoil’s leading edge [17]. This alteration results in pressure discrepancies between the crest and trough of the WLEs, consequently engendering spanwise flow. The establishment of this progressive flow contributes to the early separation of the WLEs root [4,21]. Moreover, the adverse pressure gradient generated by the WLEs at the leading edge of the airfoil triggers the development of directional vorticity [26,28]. The streamwise vortices that propagate towards the separated shear layer, aided by the incoming flow, enhance the momentum exchange within the shear layer [25], thus improving the aerodynamic performance of the airfoil.
The above research shows that the researchers have done extensive and in-depth research on the effect of the size of WLEs, different airfoil, and different Reynolds number on aerodynamics. However, the research on the impact of WLEs on airfoil surface topologies is relatively limited. Although the numerical simulation results in the existing literature provide a certain description of the impact of WLE on airfoil surface topology [25,26], the reliability of these results is still insufficient, and there is no quantitative standard to evaluate. Therefore, it is necessary to further understand the relevant influence of WLEs on the surface topologies of airfoil in order to fully understand the flow control mechanism of WLEs. In this paper, the effect of the WLEs on the aerodynamic performance of the airfoil and related flow topologies of the flow field is investigated utilizing aerodynamic measurement, global Luminescent oil film (GLOF) visualization, and particle image velocimetry (PIV). The outcomes of this research offer an empirical foundation for researchers to design aircraft that are more efficient and energy-saving, while also refining the understanding of the flow control mechanism of WLEs.

2. Experimental Setup

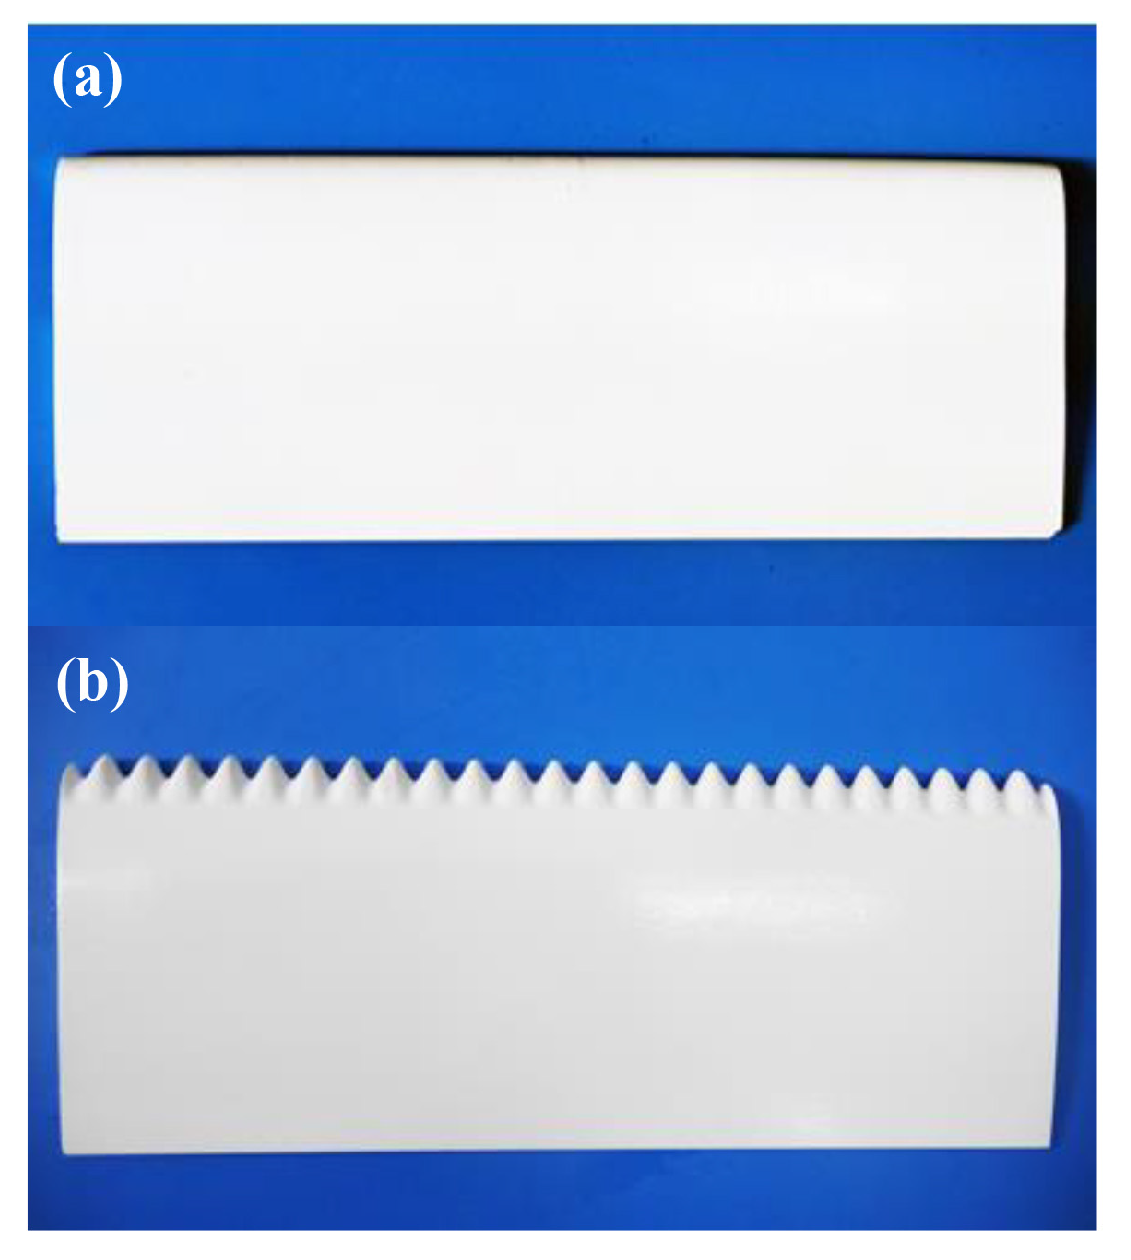
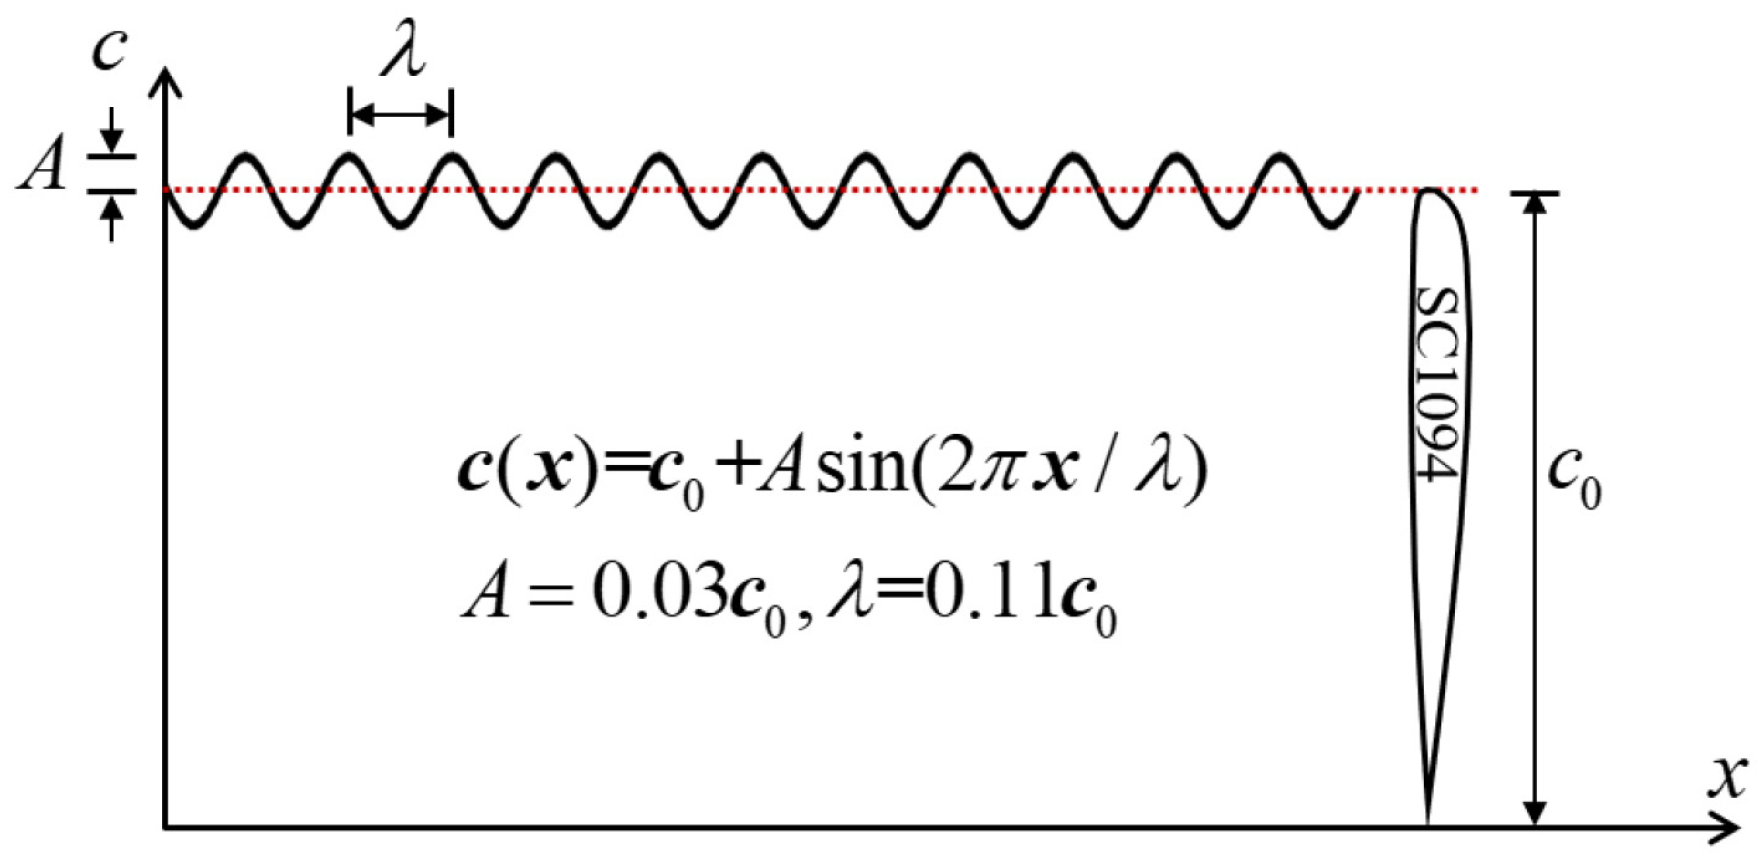
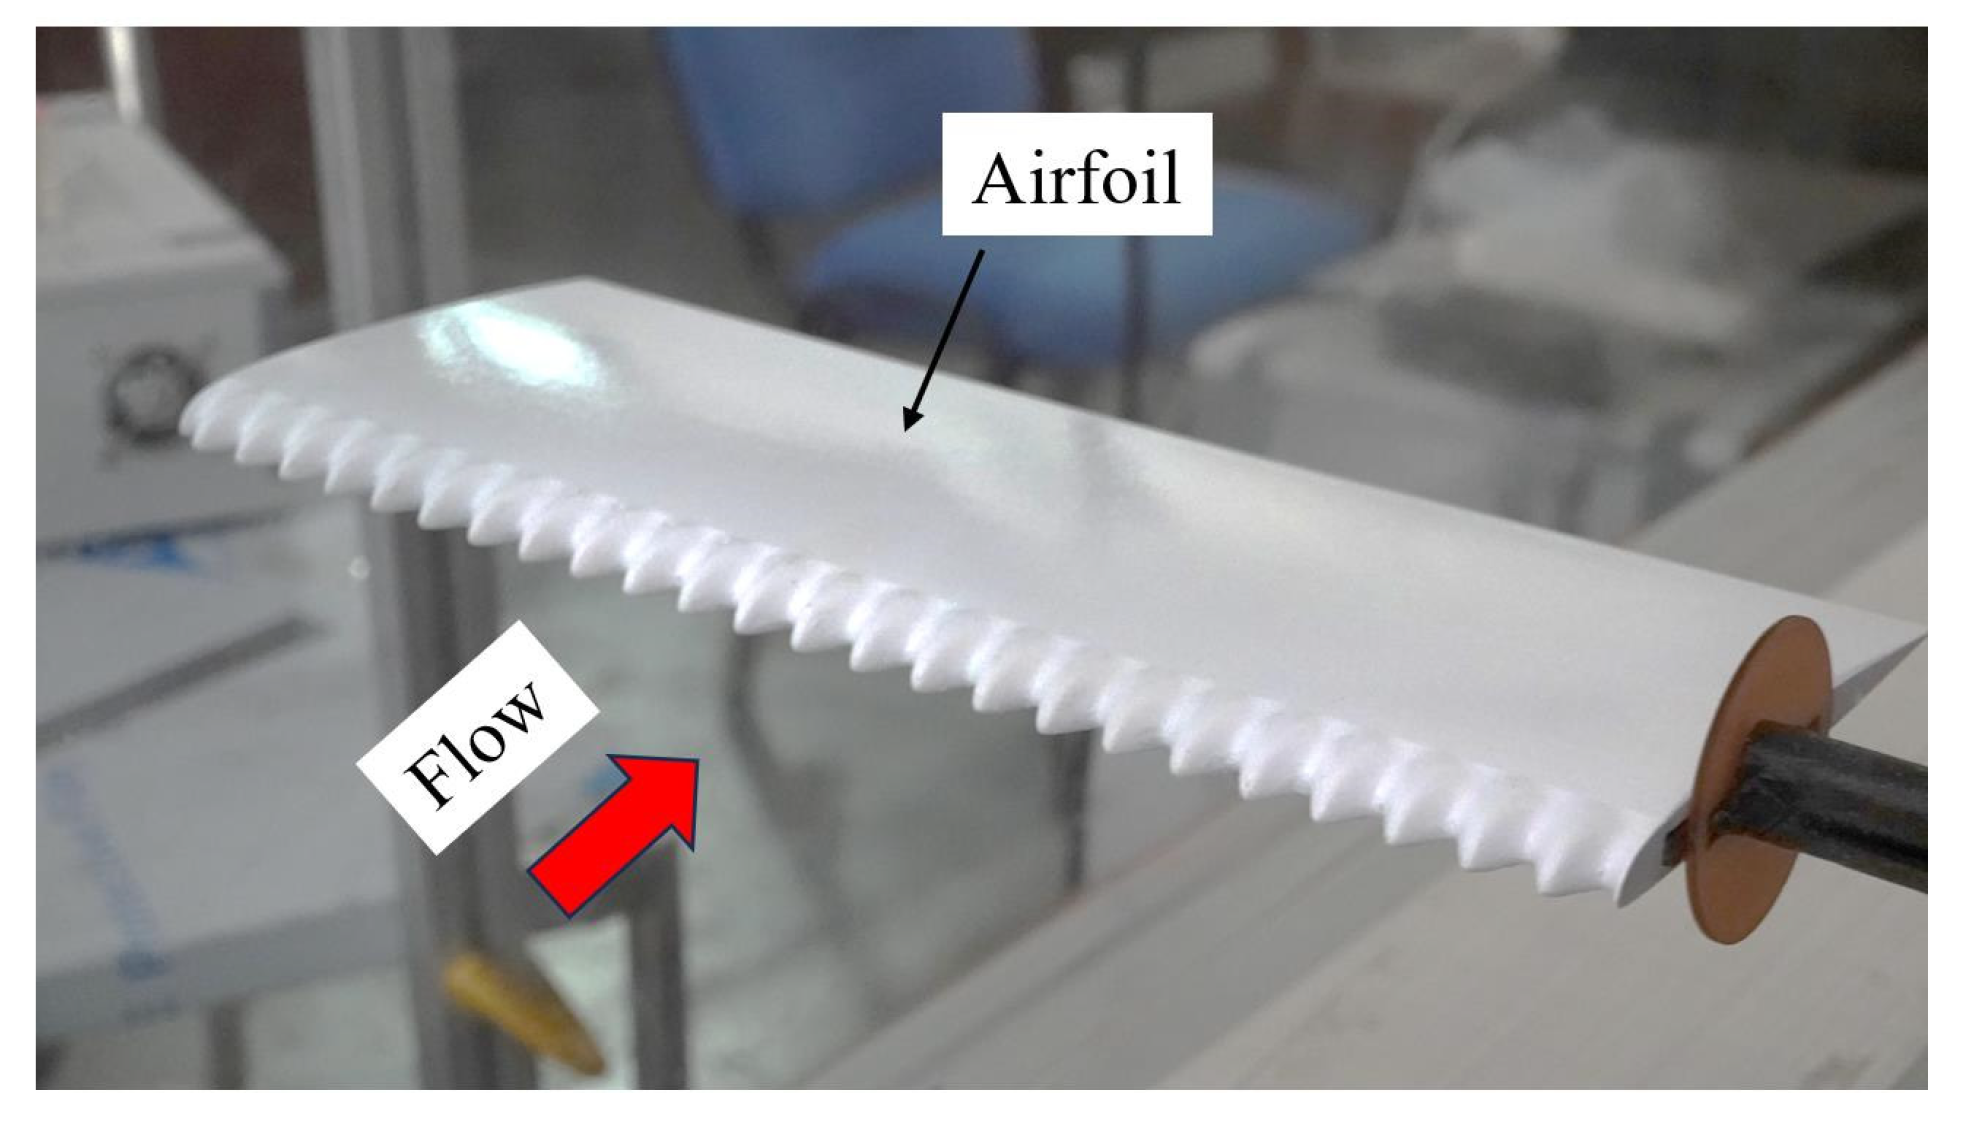
2.1. Experimental Models and Wind Tunnel

As shown in Figure 1, the experimental model consists of a baseline airfoil and a modified airfoil. The baseline airfoil adopted for the experiments was the SC1094, in order to further evaluate the improvement of the aerodynamic performance of the rotor airfoil by WLEs. Even though the experiment was conducted under static conditions, it is important to understand its aerodynamic characteristics. The chord length c0 of the baseline airfoil is 110 mm, and the spanwise length L is 300 mm. The WLEs airfoil is obtained by modifying the leading edge of the baseline airfoil, and its shape is a sine curve, as shown in Figure 2. The choices of amplitude (A) and wavelength (λ) values are referred to Ferreira et al. [28], where A = 0.03 c0, λ = 0.11 c0. It should be noted that both the baseline and WLEs airfoils are 3D printed from a resin material with a machining accuracy of ±0.1 mm.
In addition, the experiments were conducted in a low-speed direct flow wind tunnel of Xihua University, and the experimental picture is shown in Figure 3. The wind tunnel test section was 2 m long, 0.3 m wide, and 0.5 m high, and the shrinkage ratio was 1:4. The top and sides of the test section are plexiglass for optical access. The range of incoming wind speed was 0.5–30 m/s, and the turbulence intensity (the ratio of root-mean-square of pulsating velocity to time averaged velocity) was less than 0.5%.

2.2. Experimental Technique and Analytical Method

2.2.1. Aerodynamic Force Measurement

The influence of the WLEs on the aerodynamic performance of the airfoil is evaluated measuring the aerodynamic force on the model. Figure 4 illustrates the measuring device of the airfoil subjected to aerodynamic force. The ends of the airfoil were near the wall of wind tunnel and secured by metal supports. The metal supports connected the airfoil to the balance to transfer aerodynamic power. The balance was connected to the rotating chassis to adjust the AOA. The coordinate measurement system is shown in Figure 4, where the origin O is at the midpoint of the leading edge of the baseline airfoil and varies with the AOA, and the Oz axis is always perpendicular to the horizontal plane xOy.
In this study, a six-component box balance is used to measure the forces in three directions (Fx, Fy, Fz) and the torques in three directions (Mx, My, Mz). The Fx and The Fy correspond to the lift and drag directions of the airfoil, respectively. Both were measured in a range of 0–5 kg, with a measurement accuracy of 0.3% to 0.5%. The standard deviation of the lift coefficient from three repeated experiments is 0.0087. The lift and drag coefficients of the airfoil are calculated according to the following formulas:
C L = F L 0.5 ρ U 2 s ,
C D = F D 0.5 ρ U 2 s ,
where FL and FD are the airfoil’s lift force and drag force, respectively; ρ is incoming air density; U is the incoming flow velocity; and s is the reference area of the airfoil, s = c0*L.
To verify the accuracy of the experimental device and the aerodynamic measurement, the aerodynamic force of baseline airfoil measured in this experiment was compared with the results obtained by Ferreira et al. [28], as shown in Figure 5. Compared with the data of Ferreira et al. [28], the linear range of the CL measured in this experiment is basically consistent with it, with an average error of 2.28%, while the CD measured in this experiment is relatively high, but the trend of variation with AOA is consistent. This may be due to different model materials leading to different friction, resulting in a deviation in the total resistance. In addition, due to the fact that this experiment did not correct for the blockage effects, this is another important reason for the higher CD values.
In general, the aerodynamic force measured in this experiment is in good agreement with the data in the literature. Additionally, according to the data of Ferreira et al. [28], it is found that the CL between −5°–0° is linear, while the CD is basically maintained at a low level. Therefore, the Aerodynamic force measurement in this paper only measured the aerodynamic force under the positive AOA.

2.2.2. Particle Image Velocimetry

The flow field around the airfoil is obtained by PIV with high time resolution. In this experiment, the deviation between the velocity measurement results of PIV and the wind tunnel inflow velocity (measured by a pitot tube) was within the range of ±0.5 m/s (the main sources of error are the boundary layers near the top, bottom, and sides of the wind tunnel walls). In the experiment, flows on three typical sections were photographed, as shown in Figure 6. The three sections are the middle section of the baseline airfoil, the crest section of the WLE, and the trough section of the WLE. A Vlite-Hi-527 (Beamtech Optronics, Beijing, Chia) dual-pulse laser emitted the laser plate with a laser frequency of 1000 Hz and a thickness of about 2 mm. The tracer particles, about 5μm in diameter, were emitted from a thermostatic electronic cigarette machine at the entrance to the wind tunnel. The Fastcam AX-100 mini has a resolution of 1024 × 1024 pixels2 and a shooting frequency of 2000 Hz. The lens model is Nikon, and the focal length was 105 mm.

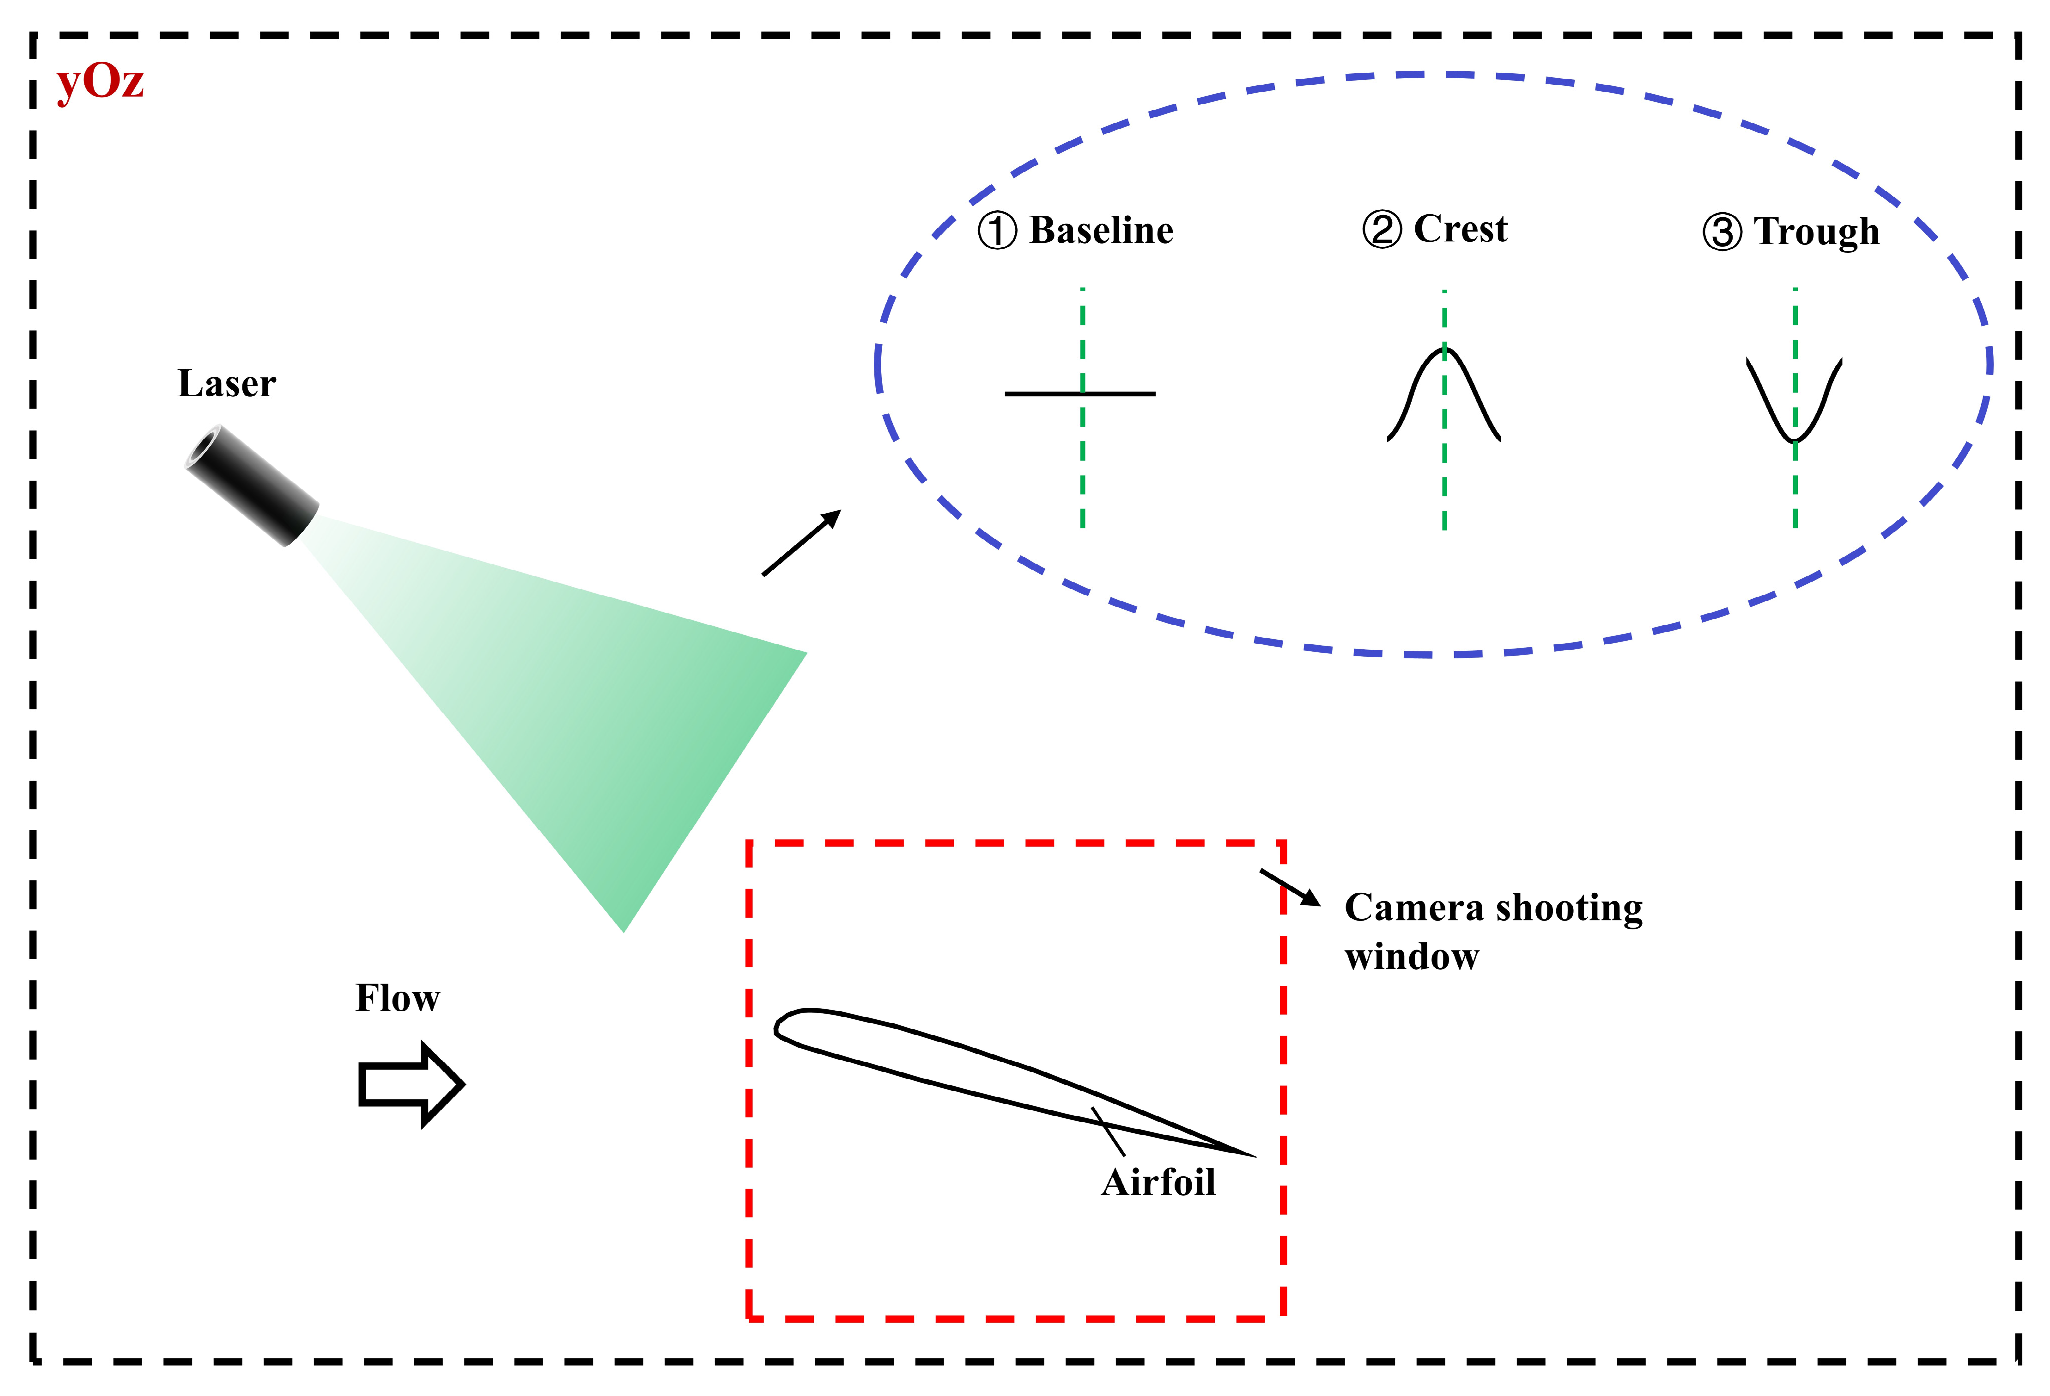
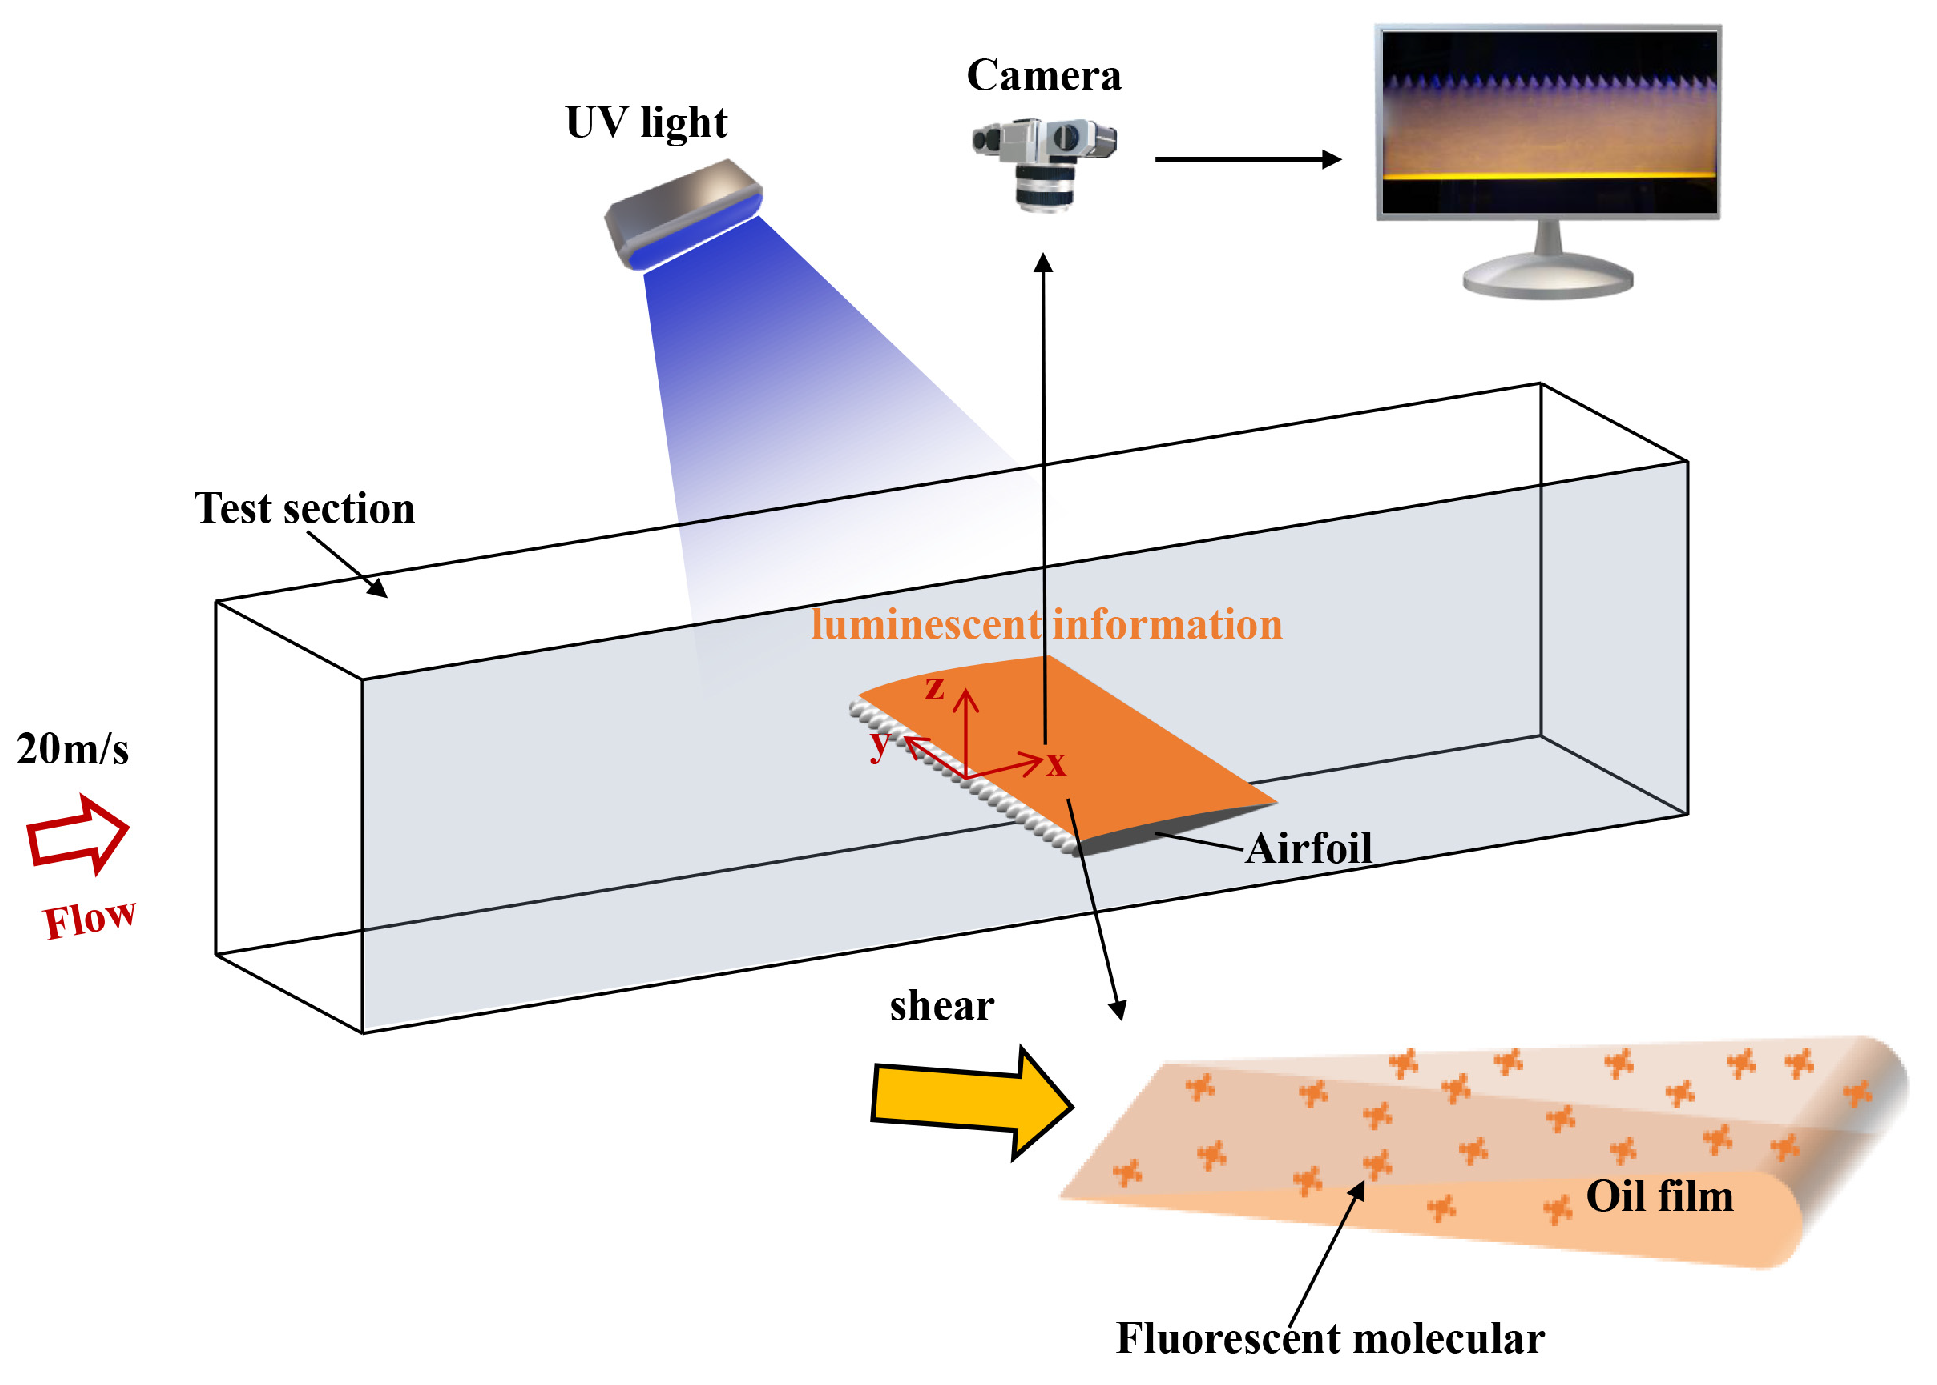
2.2.3. Global Luminescent Oil-Film Visualization

The flow topology of the airfoil surface was obtained using the GLOF visualization, which combines oil flow visualization with the optical flow method from computer vision [29], initially proposed by Liu et al. [30]. The luminescent oil film on the surface of the model can reflect the dynamic evolution process of the near-wall flow field. At the same time, the camera recorded the flow structure of the oil film at different times. From a snapshot taken by the camera, we can get the flow topology on the surface of the airfoil through GLOF.
When the oil film is sufficiently thin, its thickness is proportional to the luminance emitted under ultraviolet excitation, i.e., h = c−1(I/Iex). Where h is the thickness of the oil film, c is the coefficient related to the luminous efficiency of the fluorescent oil film, I is the luminous brightness of the oil film, and Iex is the photo intensity of the ultraviolet excitation light source on the model surface. We define the normalized luminescence intensity g = I/Iex, and the film equation is projected from the surface of the model Xi to the imaging plane xi, and the optical flow equation in general form is obtained [31]:
g t + u g = f ( x 1 , x 2 , g ) ,
where u is surface optical flow, t is the time; ∇ is the Hamiltonian gradient operator of the imaging plane, ∇ = ∂/∂xi (i = 1, 2); and f (x1, x2, g) is the error term of optical flow. In order to solve Equation (3), the global smoothing constraint is introduced. That is, the square of the surface optical flow gradient is minimum. Equation (3) is combined with constraints to form an energy function so that u of the minimum value of the function is the final solution. The energy function in the imaging plane Ω is defined as follows:
J ( τ ¯ ) = Ω ( g t + u g f ( x 1 , x 2 , g ) ) 2 + α u 1 ¯ 2 + u 2 ¯ 2 d x 1 d x 2
where α is the Lagrange multiplier used to smooth the weight relationship between optical flow data items and constraint items. The variational method was used to solve Equation (4), described in detail in Liu et al. [30].
Figure 7 shows the fluorescent oil film measuring device in the experiment. The fluorescent oil film was made of fluorescent powder with Dow Corning PMX-200 (Dow, Midland, Michigan, USA) silicone oil (viscosity is 100 cs and 350 cs). The UV excitation light source was a LUYOR-3121 UV lamp (LUYOR, Joliet, IL, USA). In this study, the Fastcam AX-100 mini (Photron, Tokyo, Japan)was used as a high-speed camera with a resolution of 1024 × 1024 pixels2. The Nikon lens had a focal length range of 14–24 mm. The camera shoots at 50 Hz. Usually, the optical flow algorithm can get a surface optical flow snapshot solution by processing the front and back images. This study averages 50–200 snapshots to obtain a stable and uniform flow topology.
In addition, Liu et al. [32] used the Poincare–Bendixson exponential formula, which includes the number of critical points and boundary switch points, as a general method for surface topology analysis in separation flows. Their results make the topology analysis method applicable in the connected region surrounded by permeable boundaries. Topological analysis based on the critical point theory can be used to verify the correctness of flow structure measurement, which is of great significance in explaining and understanding the flow pattern or mechanism. The oil film topology on the airfoil surface is surrounded by a closed boundary, and there are streamlines in and out. In previous studies [32,33,34], the Poincare–Bendixson (P-B) exponential formula was used as the conservation law of the number relationship between critical points and boundary switching points in the topology to test the correctness and consistency of the surface optical flow topology. P–B index formula form for #N − #S = 1 + (#Z+ − #Z)/2 = 0. Where #N represents the number of nodes, #S represents the number of saddle points, and #Z+ and #Z are, respectively, the number of positive and negative boundary switching points. Figure 8 shows the geometric features of critical points and boundary switching points. Nodes that converge to one point are called split nodes. Nodes that diverge from a point are called attached nodes. The focal point (F) caused by the vortices is usually called the spiral node [35]. There is a small enough point Z on the boundary, and if the streamline near this point first flows in from outside the boundary and then flows out from inside, then the switching point is negative, denoted as Z; on the contrary, if the streamline flows out of the boundary first and then into the boundary, then the switch point is positive, denoted as Z+.

3. Results and Discussions

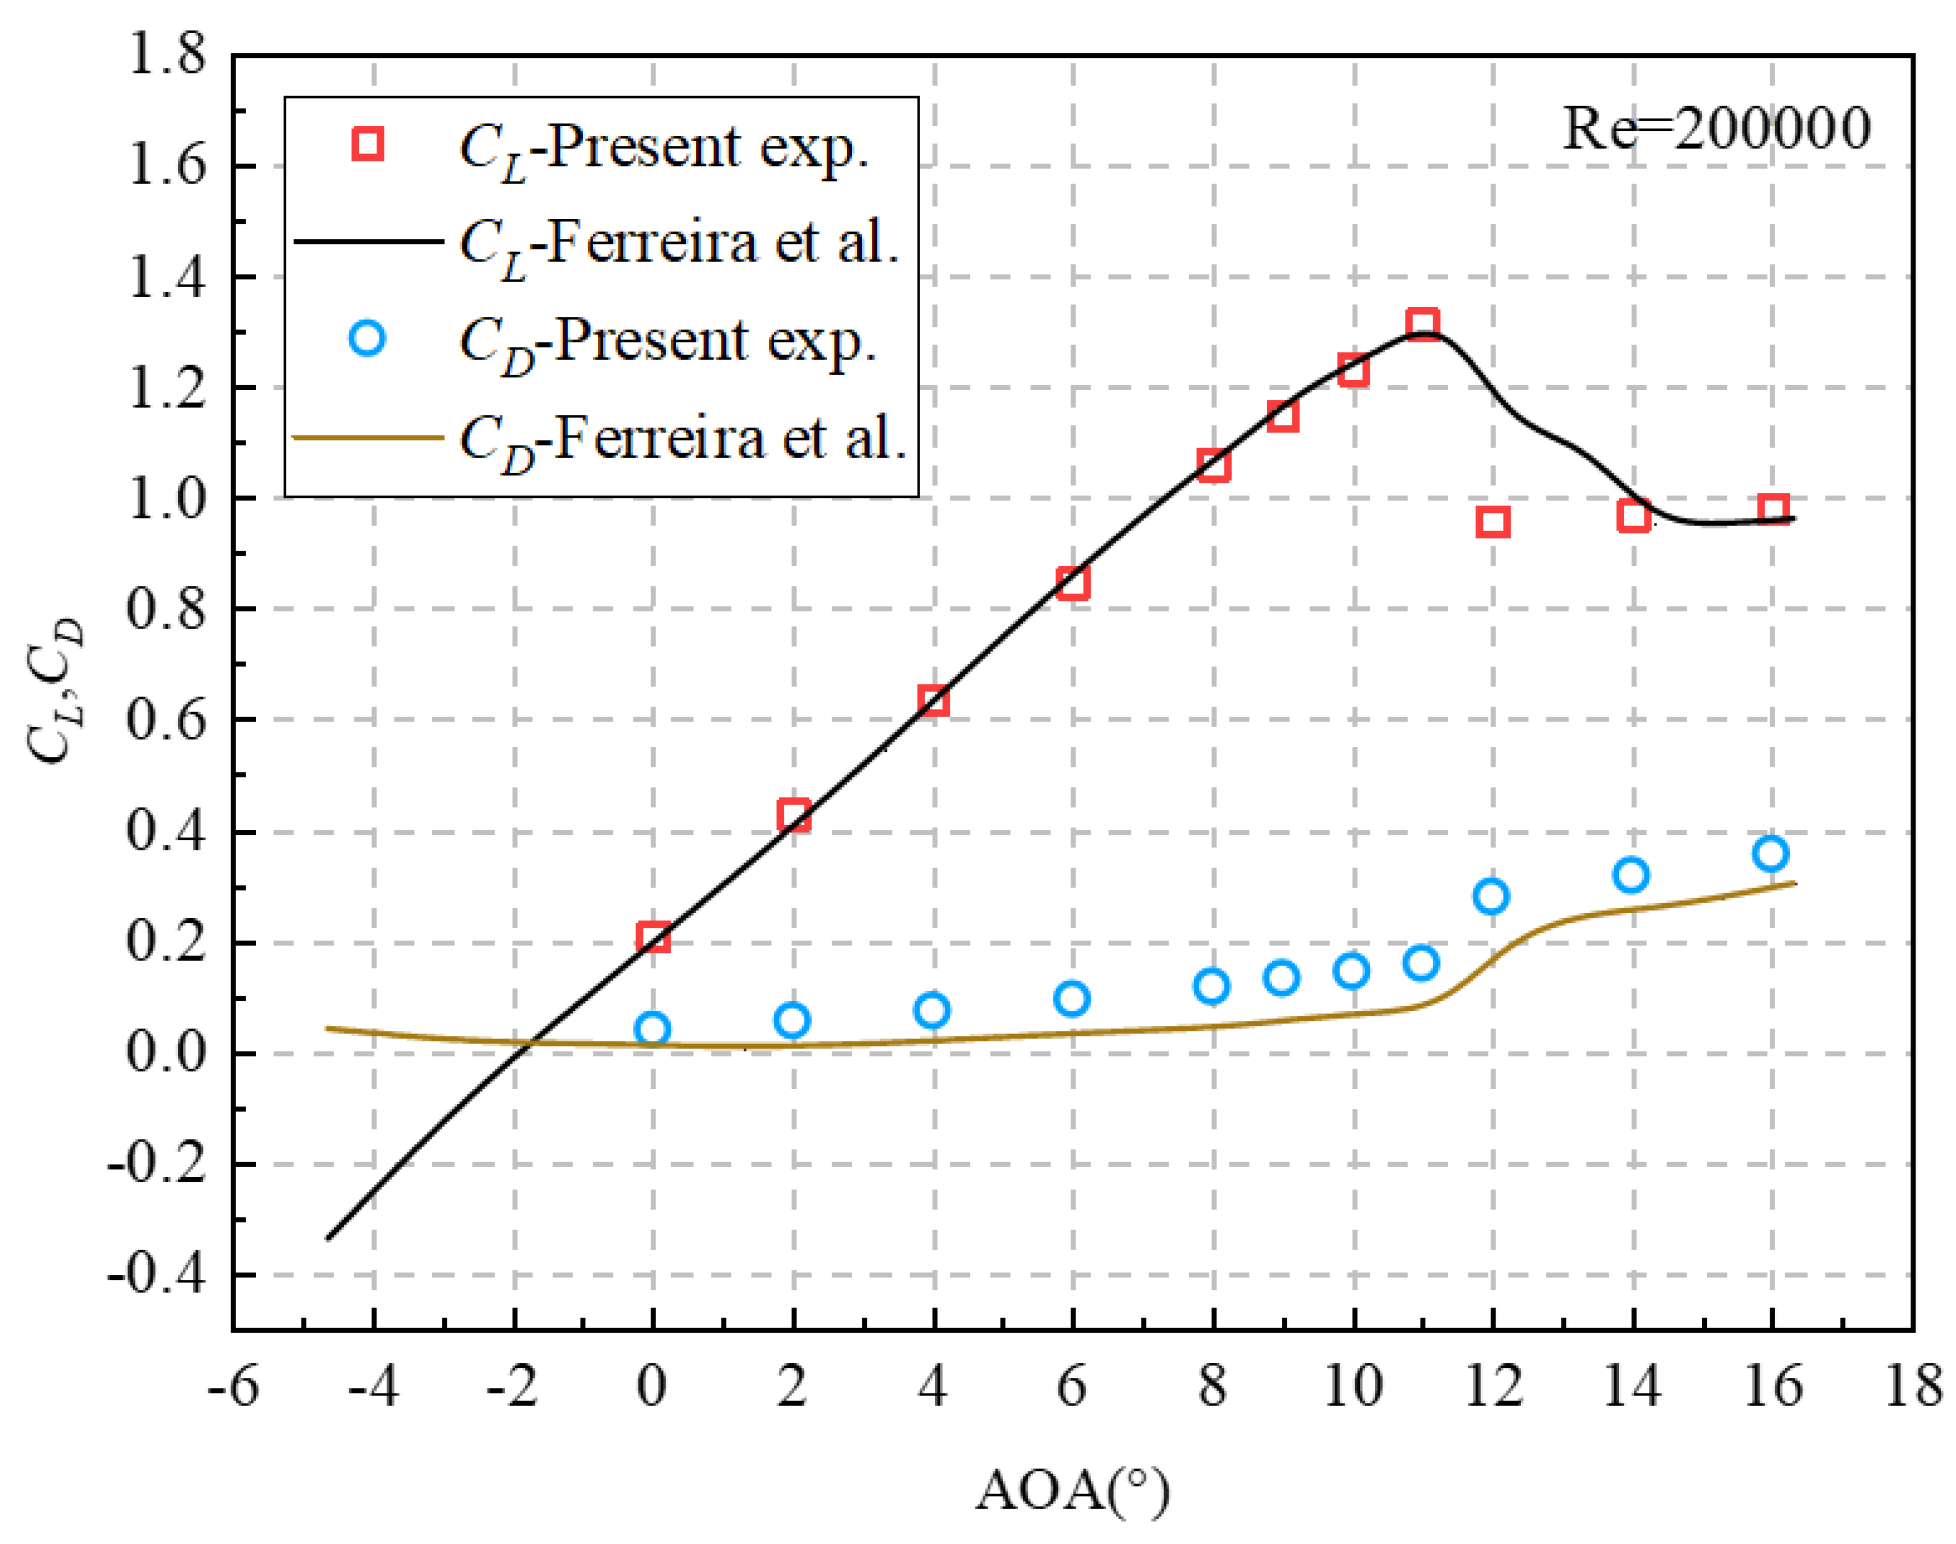
3.1. Aerodynamic Performance

The aerodynamic force acting on the airfoil serves as a direct indicator of the flow control effect brought about by the WLEs. Figure 9 depicts the aerodynamic behavior of airfoils at a Reynolds number (Re) of 140,000, 170,000, and 200,000 varying across different AOA.
As shown in Figure 9, the trend of the lift coefficient curve is typical for the baseline airfoil. The pre-stall CL increases linearly at all Reynolds numbers. With the increase of Reynolds number, the maximum CL increases and the stalling angles of attack increase, which are 8°, 9° and 11°, respectively. After stalling, CL decreases significantly, and the stalling process becomes abrupt with the increase of Reynolds number. When AOA is greater than the corresponding stall AOA, the CD increases rapidly.
For WLEs airfoil, CL increases linearly in the range of 0 to 9° at all Reynolds numbers and decreases slightly after 10° (before reaching the maximum CL), which is consistent with the results of Johari et al. [19]. For the smallest Reynolds number Re = 140,000, CL recovers after 11°, and for the other two Reynolds numbers, CL recovers after 12°. At all Reynolds numbers, the maximum CL appears at 16°, and then the CL decreases significantly and the airfoil stalls. For CD, at all Reynolds numbers, CD increases slowly below 10° and faster after 10°.
It can also be seen from Figure 9 that the difference in aerodynamic characteristics between the baseline airfoil and the WLEs airfoil. The CL of baseline airfoil and WLEs airfoil is almost the same in the lower range of AOA, indicating that WLE has little effect on airfoil lift at small AOA. However, near the corresponding stall AOA at each Reynolds number, the CL of the baseline airfoil is slightly greater than that of the WLEs airfoil. Rostamzadeh et al. [37] measured the surface pressure of the airfoil and believed that the above phenomenon was caused by the LSB phenomenon at the leading edge of the base wing, which can be proved by the LSB structure in the flow topology later in this paper. An LSB appears on the leading edge of the baseline airfoil, while it does not appear on the WLEs airfoil. The presence of the LSB on the baseline airfoil generates additional lift compared to the WLEs airfoil without the LSB.
The CD of the WLEs airfoil is slightly larger than that of the baseline airfoil in the range of the AOA before the baseline airfoil stall. Previous studies [27,38] have shown that the presence of WLEs changes the pressure distribution in the local front flow region, resulting in a vortex structure. It can be inferred that in the non-stalling state, that is, the surface flow of the base airfoil is in the laminar flow stage, WLEs destroys the laminar flow characteristics of the flow field by changing the pressure distribution of the local flow field on the airfoil surface, resulting in the increase of CD.
At a certain AOA after the baseline airfoil stall, WLEs can enhance the aerodynamic performance of the airfoil, as shown in Figure 9. WLEs significantly increased CL compared to the baseline airfoil. In addition, WLE also reduces the CD at this stage. The above results show that WLEs has the characteristic of delayed airfoil stall. The WLEs’ ability to delay stall may be related to the inhibition of airflow separation, and the control mechanism of WLE is discussed in Section 3.3.

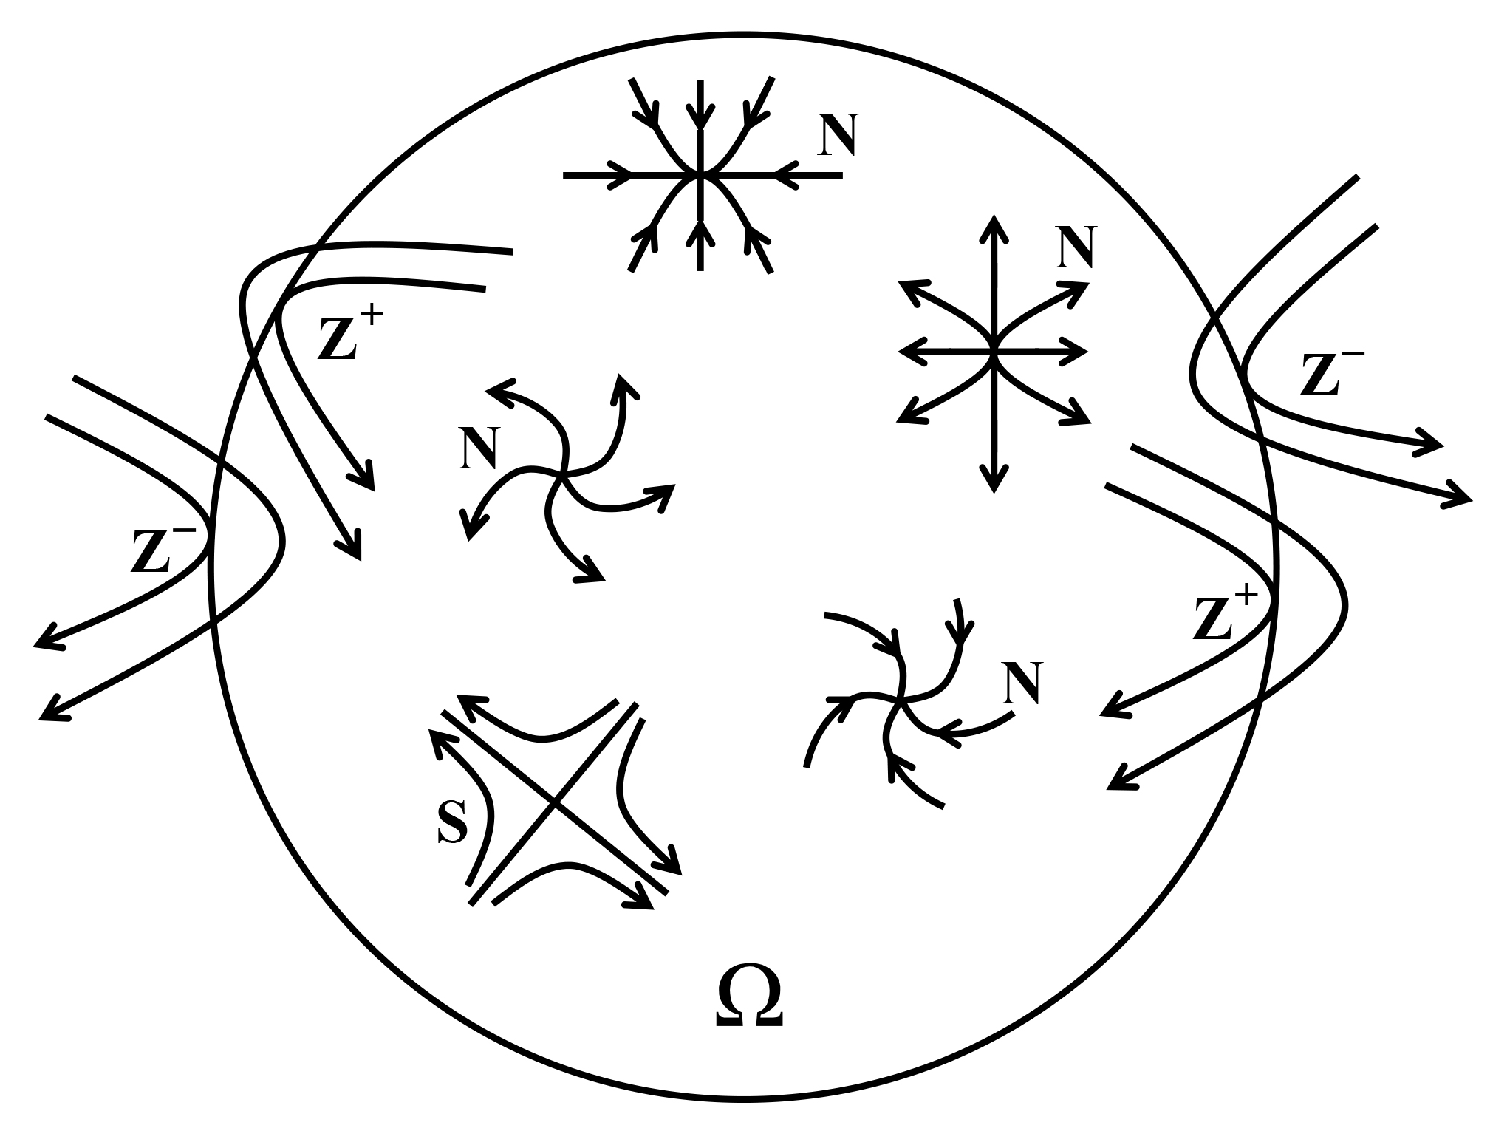
3.2. Flow topologies of Airfoil

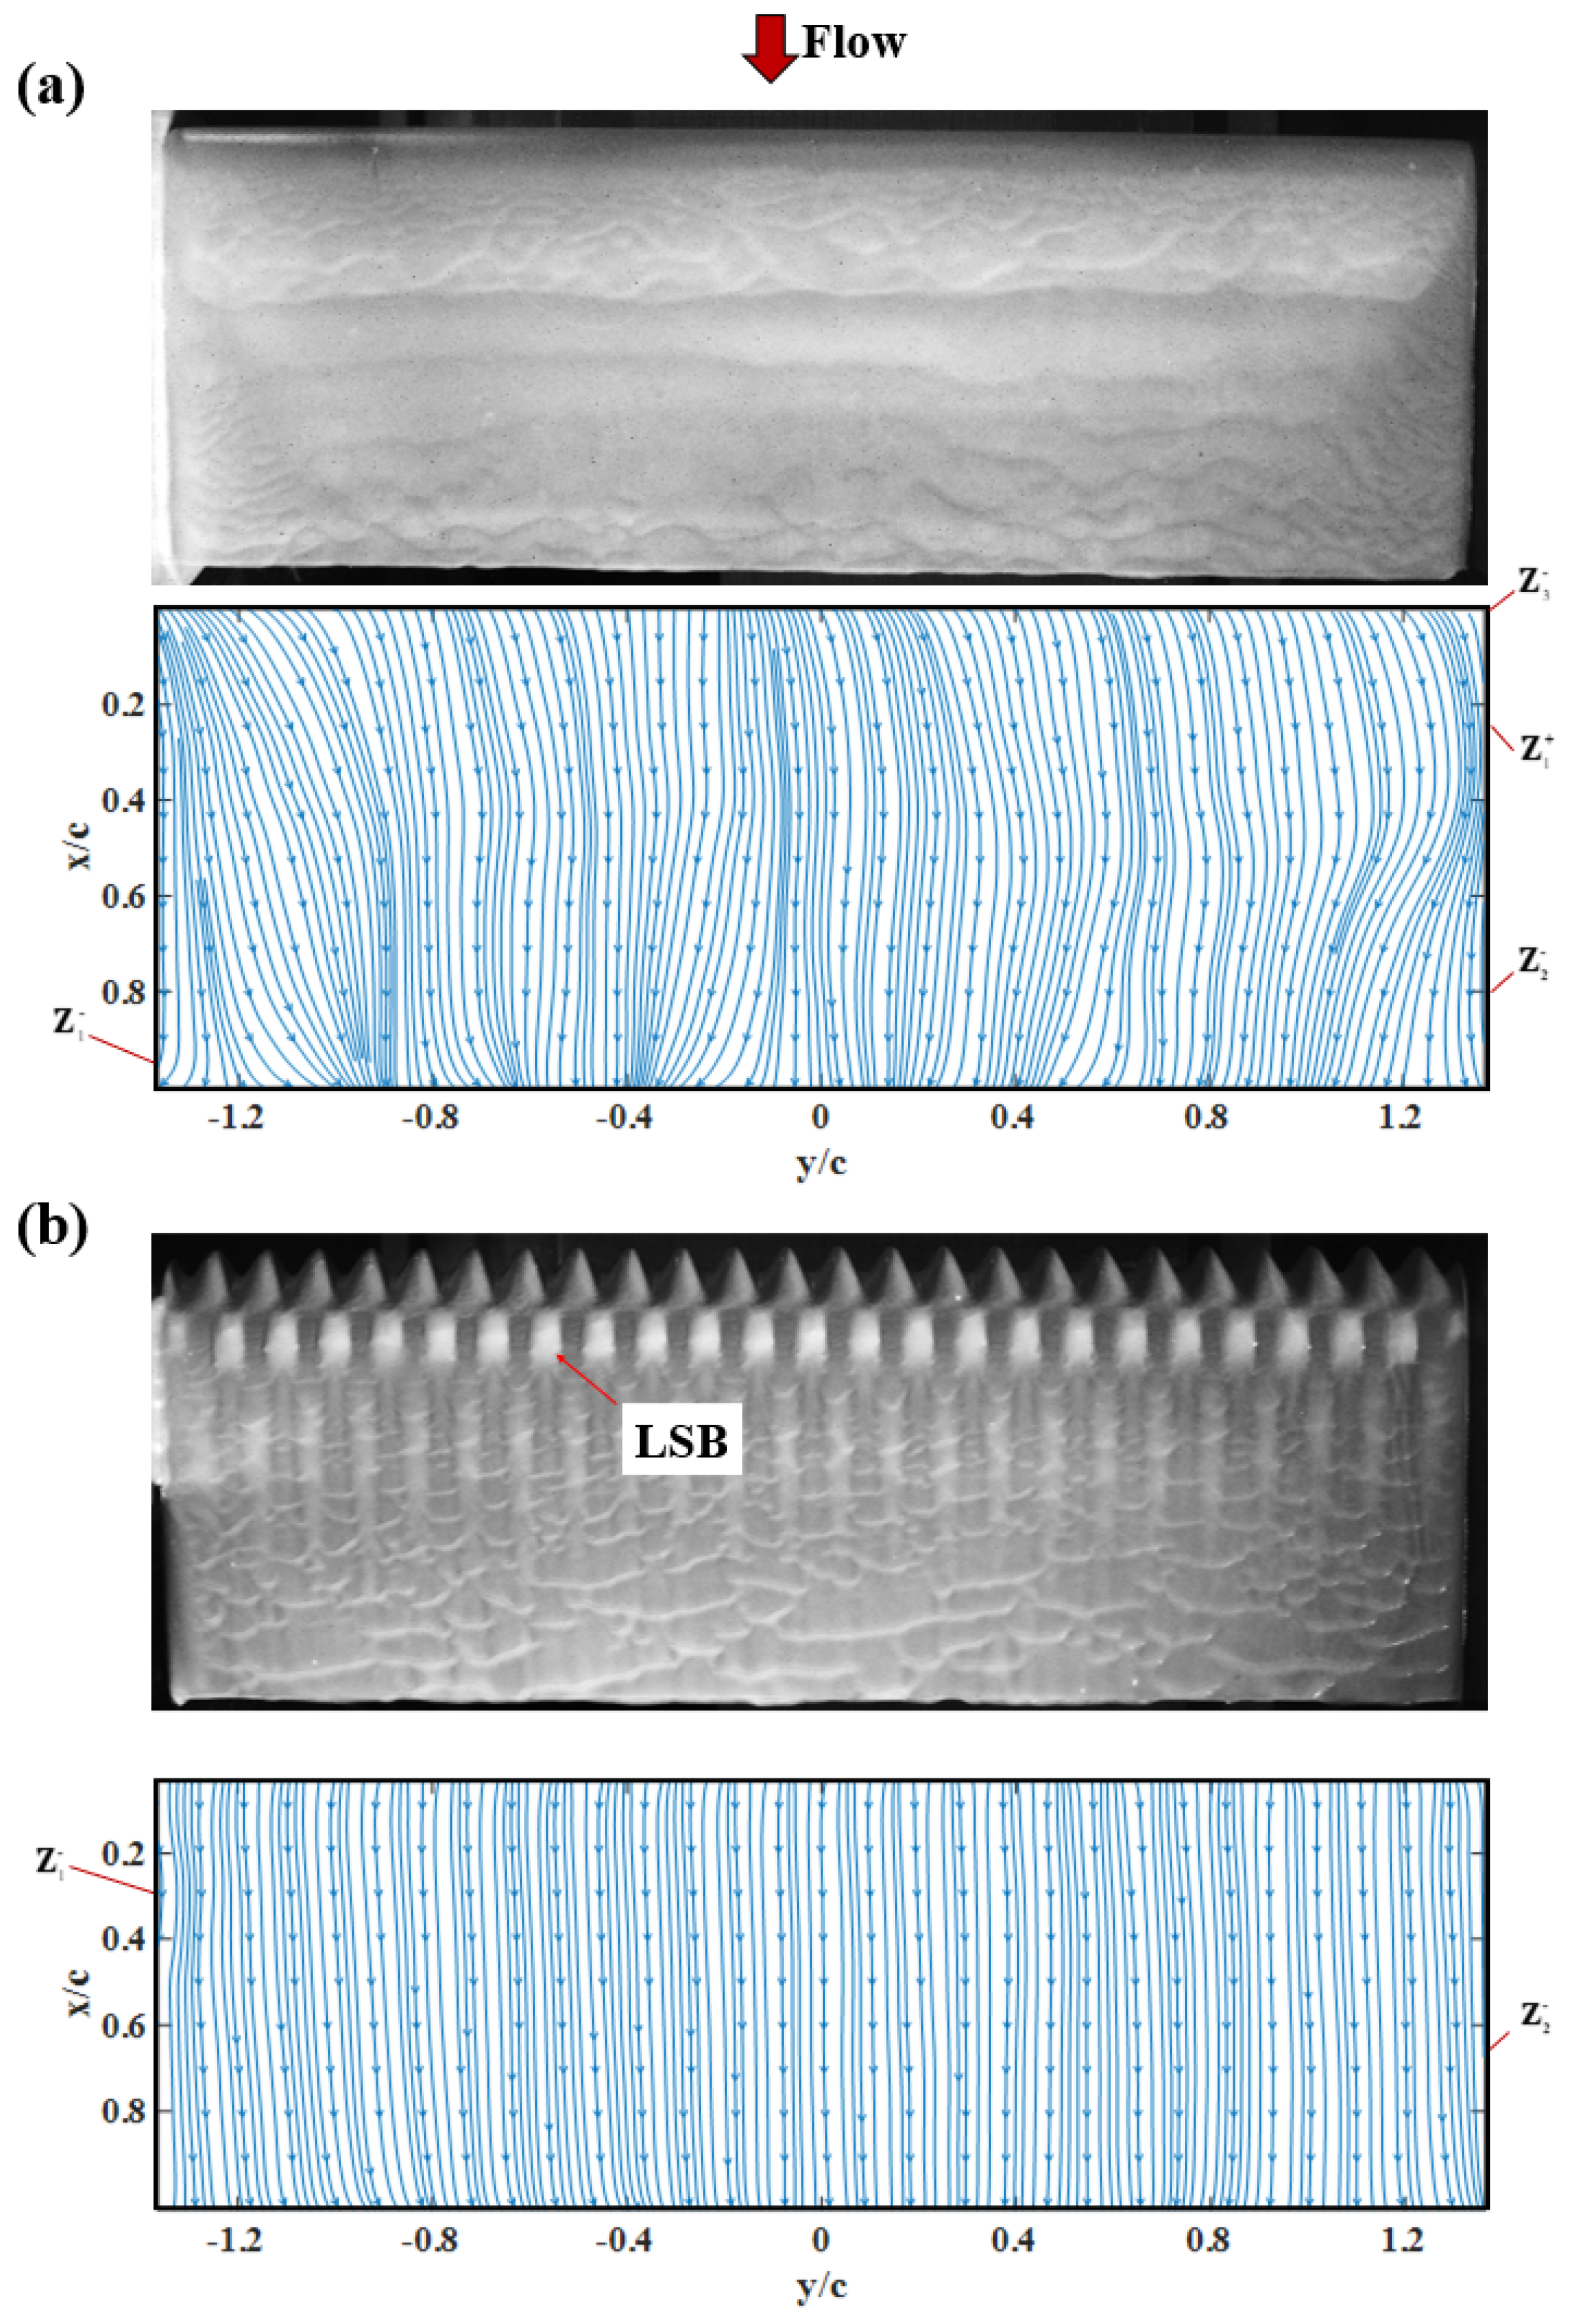
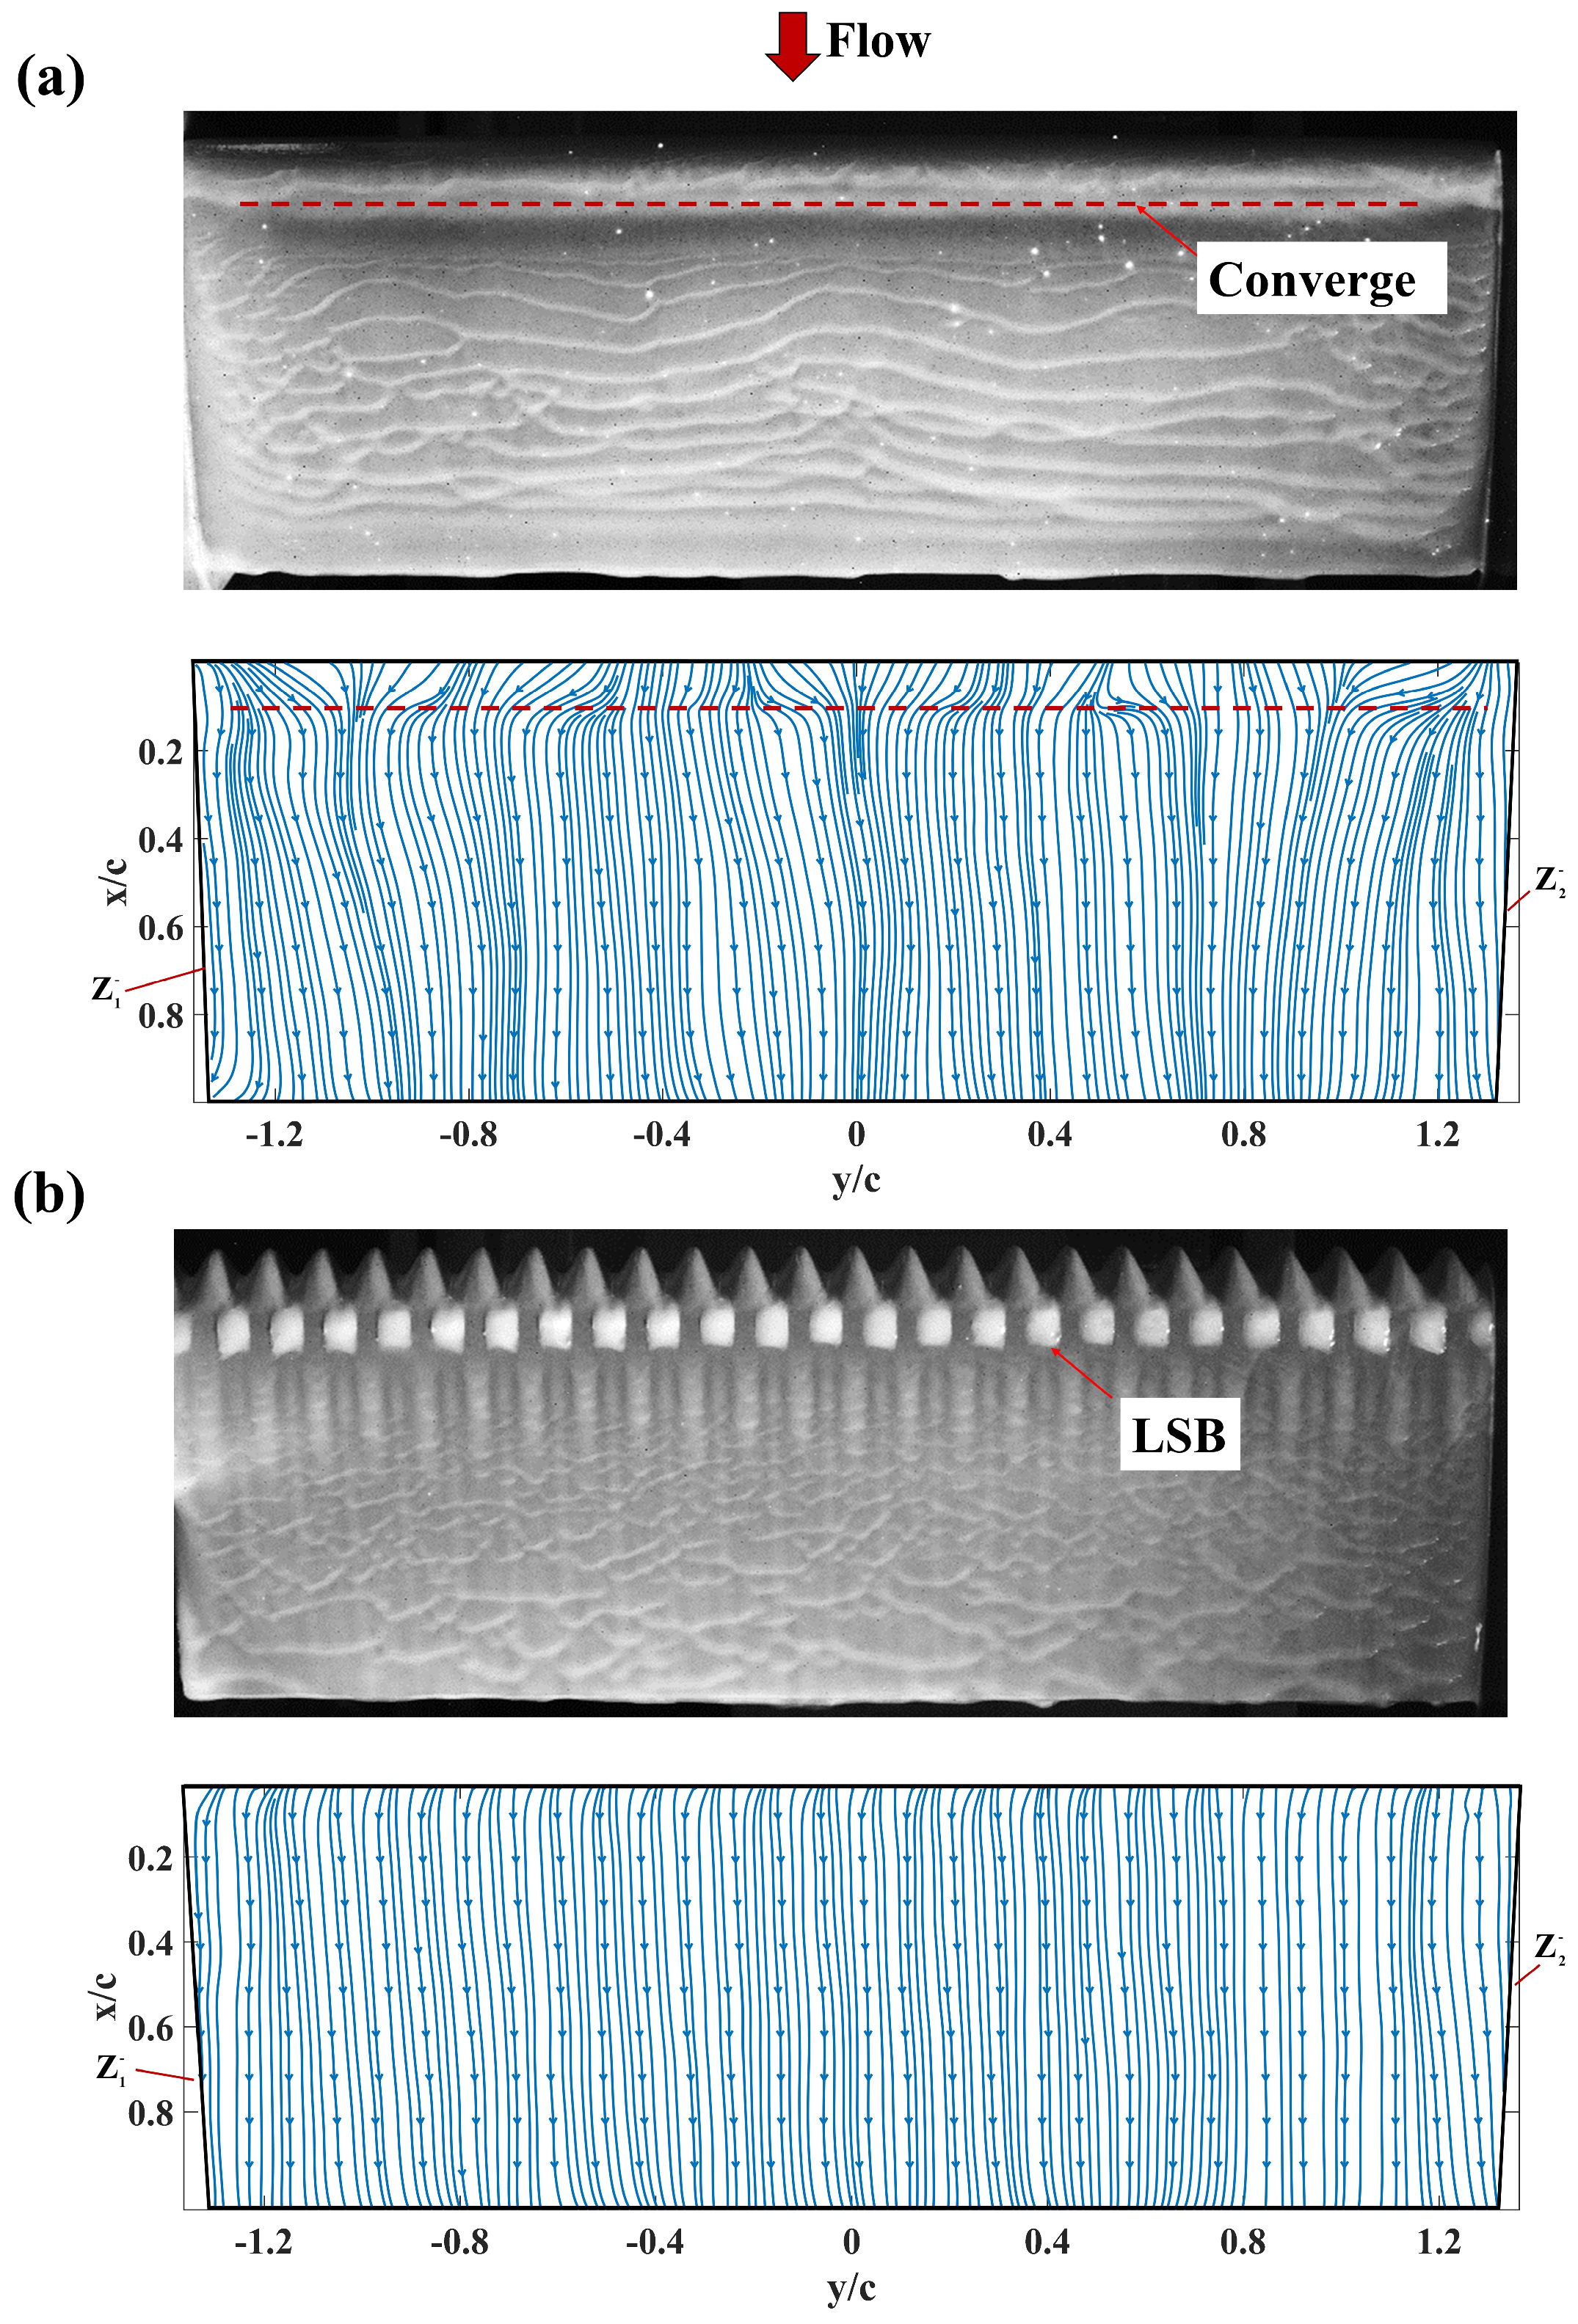
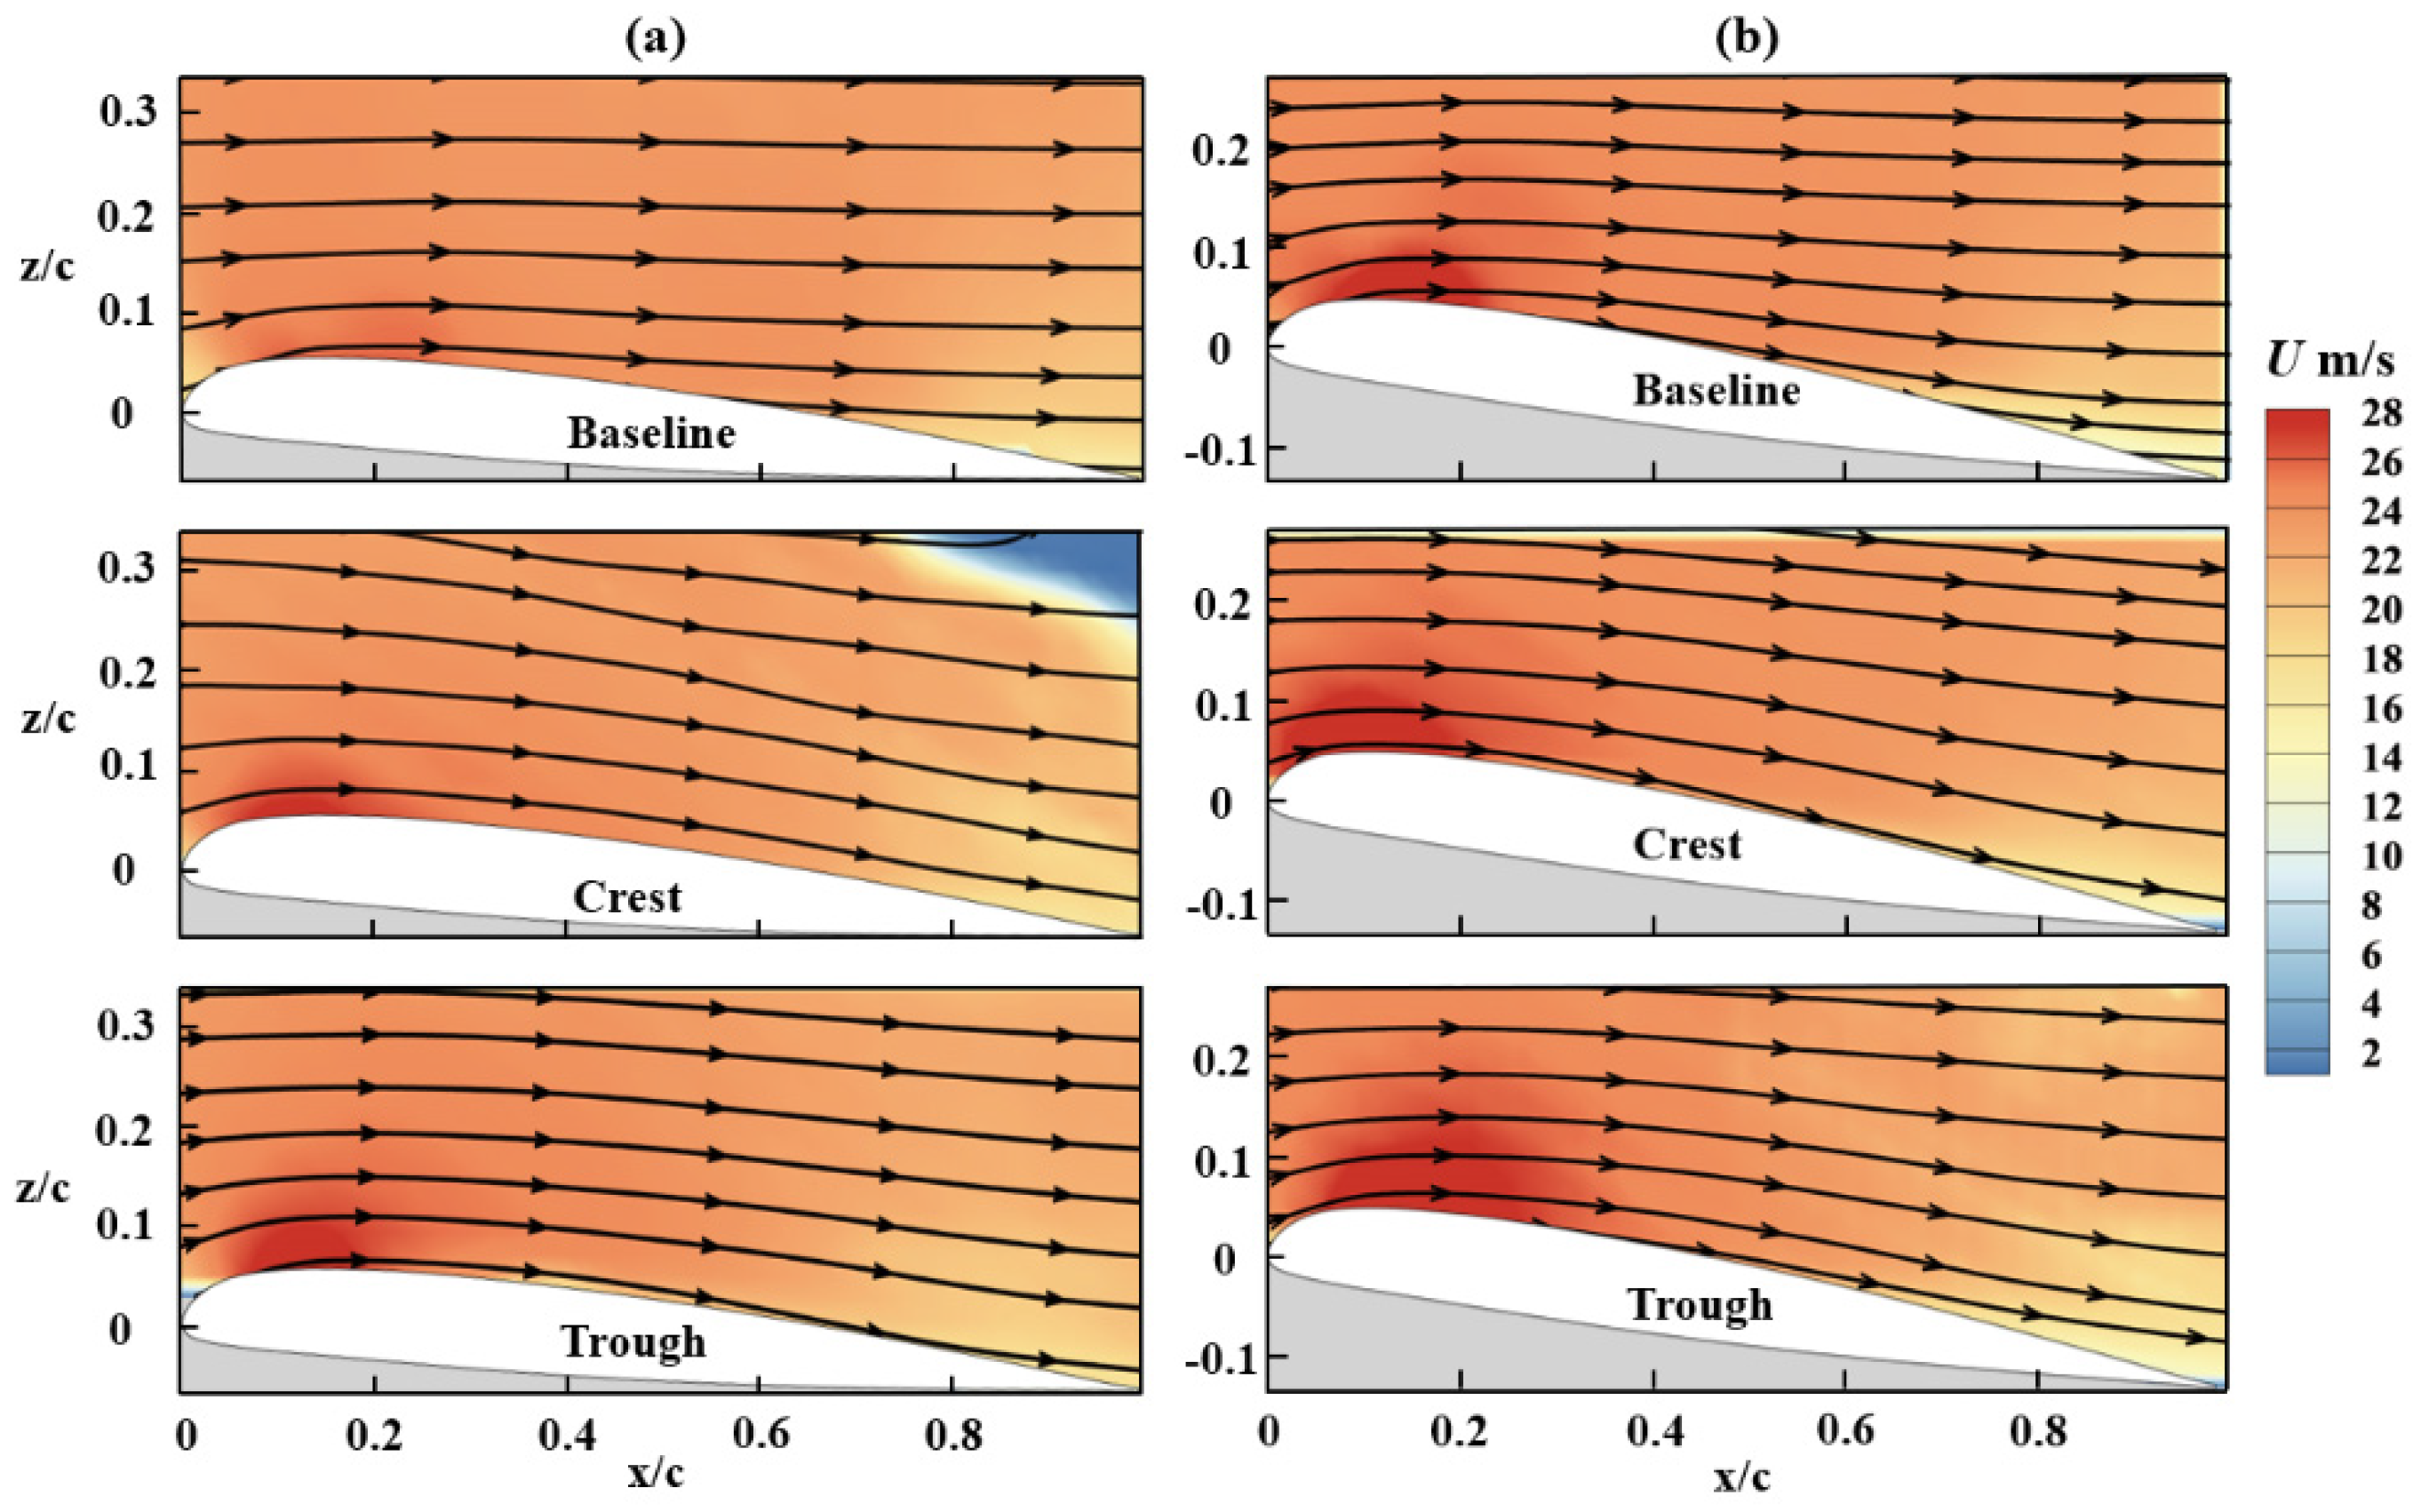
3.2.1. Flow Topologies of Pre-Stall

In view of the greater effect of WLEs on airfoil stall delay at lower Reynolds number, this paper only considers the effect of WLEs on airfoil flow topologies at Re = 140,000, the lowest Reynolds number.
Figure 10 shows the representative oil film image and flow topologies of airfoil suction surface when AOA = 0°, including baseline airfoil and WLEs airfoil. It should be noted that in the topologies of this paper, the topologies of the baseline airfoil cover the whole airfoil suction surface, while the topologies of the WLEs airfoil does not include the WLEs, and all of them are topologies at the condition of Re = 140,000. In Figure 10, three negative switch points Z 1 , Z 2 and Z 3 are identified in the two closed regions, respectively, and no isolated singularities appear, satisfying the P–B law (#N − #S = 1 + (#Z+ − #Z)/2 = 0).
At AOA = 0°, the flow of the baseline airfoil along the flow direction is approximately two-dimensional, but for the WLE airfoil, the flow of each WLE is symmetrical. From the development and evolution of the oil film (not given in Figure 10), it can be seen that in the process of flow downstream, the flow near the WLE flows from the crest section to the trough section, and it can be concluded that the WLE generates a vortex pair in the direction. With the crest of the WLE as the watershed, a pair of flow vortices with opposite flow direction are formed on both sides, which form local downwash at the crest section and local upwash at the trough section with the flow vortices generated by the adjacent WLEs. According to the study of Cai et al. [39], upwash will increase the effective AOA of the trough section, so there may be local separation of trough section at a small AOA. For example, in this work, local three-dimensional LSB appear near the downstream trough, which can be proved by the accumulation of oil film downstream trough. Local three-dimensional LSB have appeared in the studies of Cai et al. [39] and Rostamzadeh et al. [25].
Figure 11 shows the representative oil film image and the flow topology of the suction surface of the airfoil when AOA = 4°, including the baseline airfoil and the WLEs airfoil.
When AOA = 4°, the base airfoil also approximates two-dimensional flow along the flow direction, but the streamline shows obvious spanwise flow near the leading edge, and is partially curved and convergent at about 0.1 c. The convergent surface streamline indicates the beginning of the formation of the separation line. In Figure 11, two negative switch points Z 1 and Z 2 are identified in the two closed regions, respectively, and no isolated singularities appear, satisfying the P–B law (#N − #S = 1 + (#Z+ − #Z)/2 = 0).

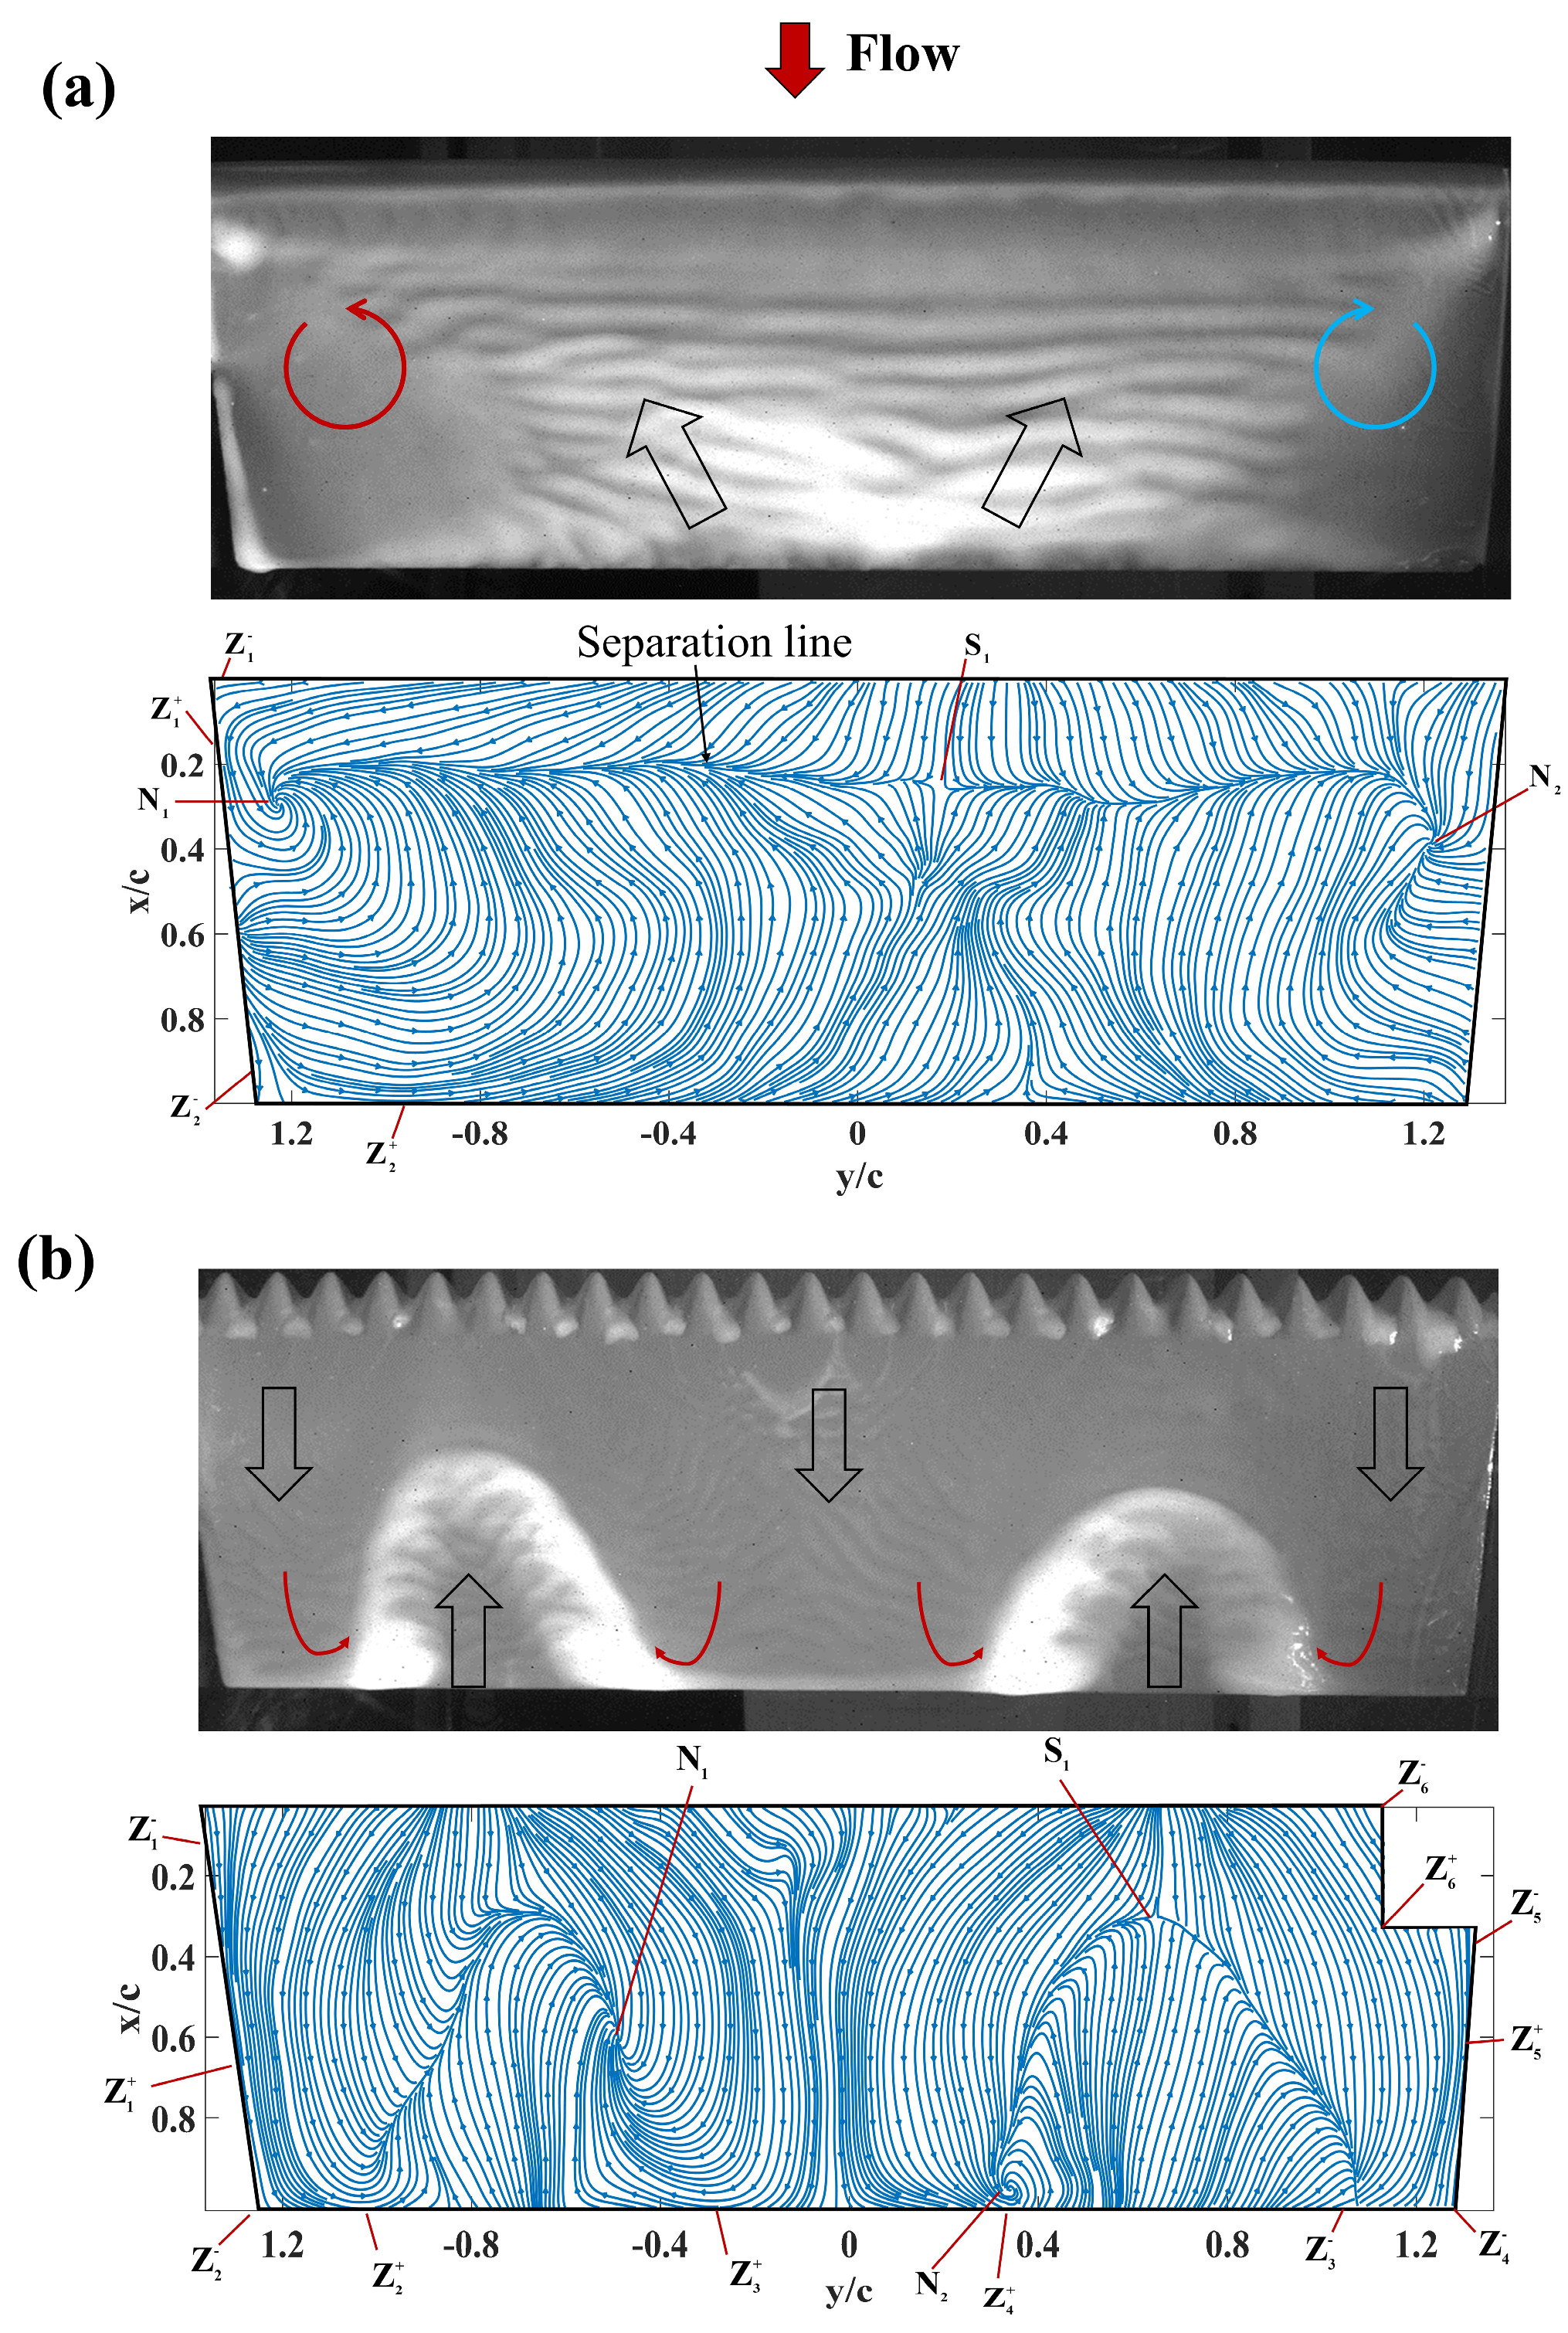
3.2.2. Flow Topologies of Stall Angle

As the AOA increases to 8°, a leading-edge LSB structure appears on the leading edge of the baseline airfoil (see Figure 12a). The line where streamlines converge are separation lines, and the lines that diverge from each other are reattachment line. Two spiral nodes N1 and N2 are identified at both ends of the LSB, which are mainly caused by the edge wall effect. On the separation line, saddle points S1 and S3 alternate with node N3, and saddle point S2 is located on the reattachment line. The consensus is that there are three nodes, three saddle points, one positive switching point, and three negative switching points, and it is established that #N − #S = 1 + (#Z+ − #Z)/2 = 0, satisfying the P–B law. In addition to the influence of wind tunnel walls on both sides, the LSB is generally fully spanwise, supporting the inference that the lift of the baseline airfoil is greater than that of the WLE airfoil when AOA = 8° in Figure 9a. For the WLEs airfoil, the topology is consistent with the rule when AOA = 4°, except that the structure size of the local three-dimensional LSB near the trough section becomes smaller, because the increase of the Angle of attack leads to the acceleration of the air flow near the leading edge, which causes the separated air to rejoin faster, and the lines are still smooth. Two negative switch points Z 1 and Z 2 are identified in the closed region in Figure 12b, and no isolated singularities appear, satisfying the P–B law.
Figure 13 shows the velocity flow field of the airfoil when AOA = 4° and 8°, including the midsection of the baseline airfoil and the crest and trough sections of the WLEs airfoil. Compared with the baseline airfoil, the velocity field of WLEs airfoil changes at crest and trough sections. The velocity of crest and trough section is higher, and the velocity of trough section increases more than that of crest, which was also reported by Hansen et al. [20], and noted that surface flows may actually behave in the opposite way. However, the velocity fields of the crest and trough sections have little effect on the flow field at the rear edge of the airfoil. The wave crest causes the change of the local velocity field of the flow field, destroys the laminar flow characteristics of the flow field, and reduces the aerodynamic performance of the airfoil. This indicates at that base airfoil stall angle and AOA before it, the WLEs increase CD, as shown in Figure 9b.

3.2.3. Flow Topologies of Post-Stall

When the AOA is increased to 12°, according to the aerodynamic results (As shown in Figure 9), the baseline airfoil has stalled while the WLEs airfoil has not. In Figure 14a, the air flow on the baseline airfoil surface is separated at x/c = 0.2, and a significant backflow can be observed downstream, showing a significant stall characteristic. In the topology, it can be seen that a pair of separate vortices with opposite directions appear on both sides of the airfoil spread due to the influence of the wind tunnel side wall [40]. The separation begins at the saddle point S1 and extends to the helical nodes N1 and N2 at both ends. Two negative switch points Z 1 and Z 2 are identified at the boundary junction because there are streamlines into and out of the boundary. Moreover, due to the induction of spiral node N1, positive switching points Z 1 + and Z 2 + are identified at the boundary, and a consensus is reached to two nodes, one saddle point, two positive switching points, and two negative switching points. It is established that #N − #S = 1 + (#Z+ − #Z)/2 = 0, which also satisfies the P–B law.
For WLEs airfoil, different from the flow pattern under low AOA, a special flow pattern appears on the airfoil, with the y/c = 0 section as the center, a symmetrical separation zone appears on both sides, and the reverse vortex trend at the intersection of the separation zone and the attached flow was observed near the trailing edge of the airfoil, Seyhan et al. [9] also obtained similar result. The separation line as a whole presents a special form of double “n”, saddle point S1 appears in the middle of the right “n” type separation line, and two spiral nodes N1 and N2 appear in the middle part of the separation line. The appearance of positive switch points Z 1 + ~ Z 5 + and Z 3 is closely related to this special separation mode. It should be pointed out that the selected closed region does not contain part of the flow line in the upper right corner of the airfoil, which is due to the accumulation of oil film in this part of the region during the experiment, resulting in some errors in the topology. Therefore, the closed region in Figure 14b does not contain this part. In Figure 14b, the closed boundary consensus is divided into two nodes, one saddle point, six positive switching points, and six negative switching points, satisfying the P–B law.
When AOA = 12°, the flow on the entire WLEs airfoil can be partitioned, as shown in Figure 15. It can be seen that the flow behind the WLEs is different at different spanwise positions. Ⅰ is the attached flow near the side wall first expands outward along the direction of flow, and then converges inward after reaching a certain position; Ⅱ is a large separation area that extends along the flow direction to both sides, and then converges near the trailing edge of the airfoil. Ⅲ is the attached flow in the central region and is located between the two symmetric separation regions, and first gathers and then expands along the flow direction, corresponding to the separation region.
At higher Re than the current work, the surface flow structure of the baseline airfoil may show a similar periodic or symmetrical structure, which may be related to factors such as initial conditions, boundary conditions, or some perturbations [41]. The WLEs studied in this work, which are disturbance factors that cannot be ignored in the incoming flow, will have a significant impact on the flow structure. The two separation zones shown in Figure 14b may be the coupling result of multiple WLEs perturbing the incoming flow.
At large AOA, due to the segmentation effect of the WLEs, the separation zone, and the attachment zone appear alternately, showing a two-period pattern [3]. According to the study of Cai et al. [39], due to the induced effect of vortex clusters in the two separation zones, a reverse rotating flow direction vortex pair is formed in the central region, and strong downwash is formed in this region, which will greatly reduce the effective Angle of attack in this region, and thus avoid the separation of this region. Therefore, it can be inferred that the results in this paper also have a similar control mechanism. This phenomenon will be directly reflected in the aerodynamic performance, as shown in Figure 9. In summary, it can be seen that under a large AOA, WLEs can produce a delayed stall control effect, which is achieved by reducing the separation area.
Figure 16 shows the PIV flow field when AOA = 12°. It can be clearly seen that the baseline wing has a flow separation at x/c = 0.2, while for the WLEs wing, the trough and crest sections remain attached to the flow. It is fully demonstrated that WLEs can inhibit flow separation and improve aerodynamic performance of airfoil. According to Figure 14b, it can be seen that the flow at different display positions on the WLEs airfoil is different, and the middle section is attached. Since PIV measures the crest and trough sections in the middle region of the airfoil, the flow is not separated at the reaction point, which also reflects the importance of surface flow display technology for the study of WLE from the side. However, it can be seen from the figure that the acceleration effect of the crest section is significantly greater than that of the trough section, that is, the momentum of the crest interface is greater than that of the trough section. According to Figure 14b and Figure 15, it shows that the spanwise development of the separation region is limited by the high momentum crest section, and the flow field is compartmentalized, which is consistent with the study of Cai et al. [39].

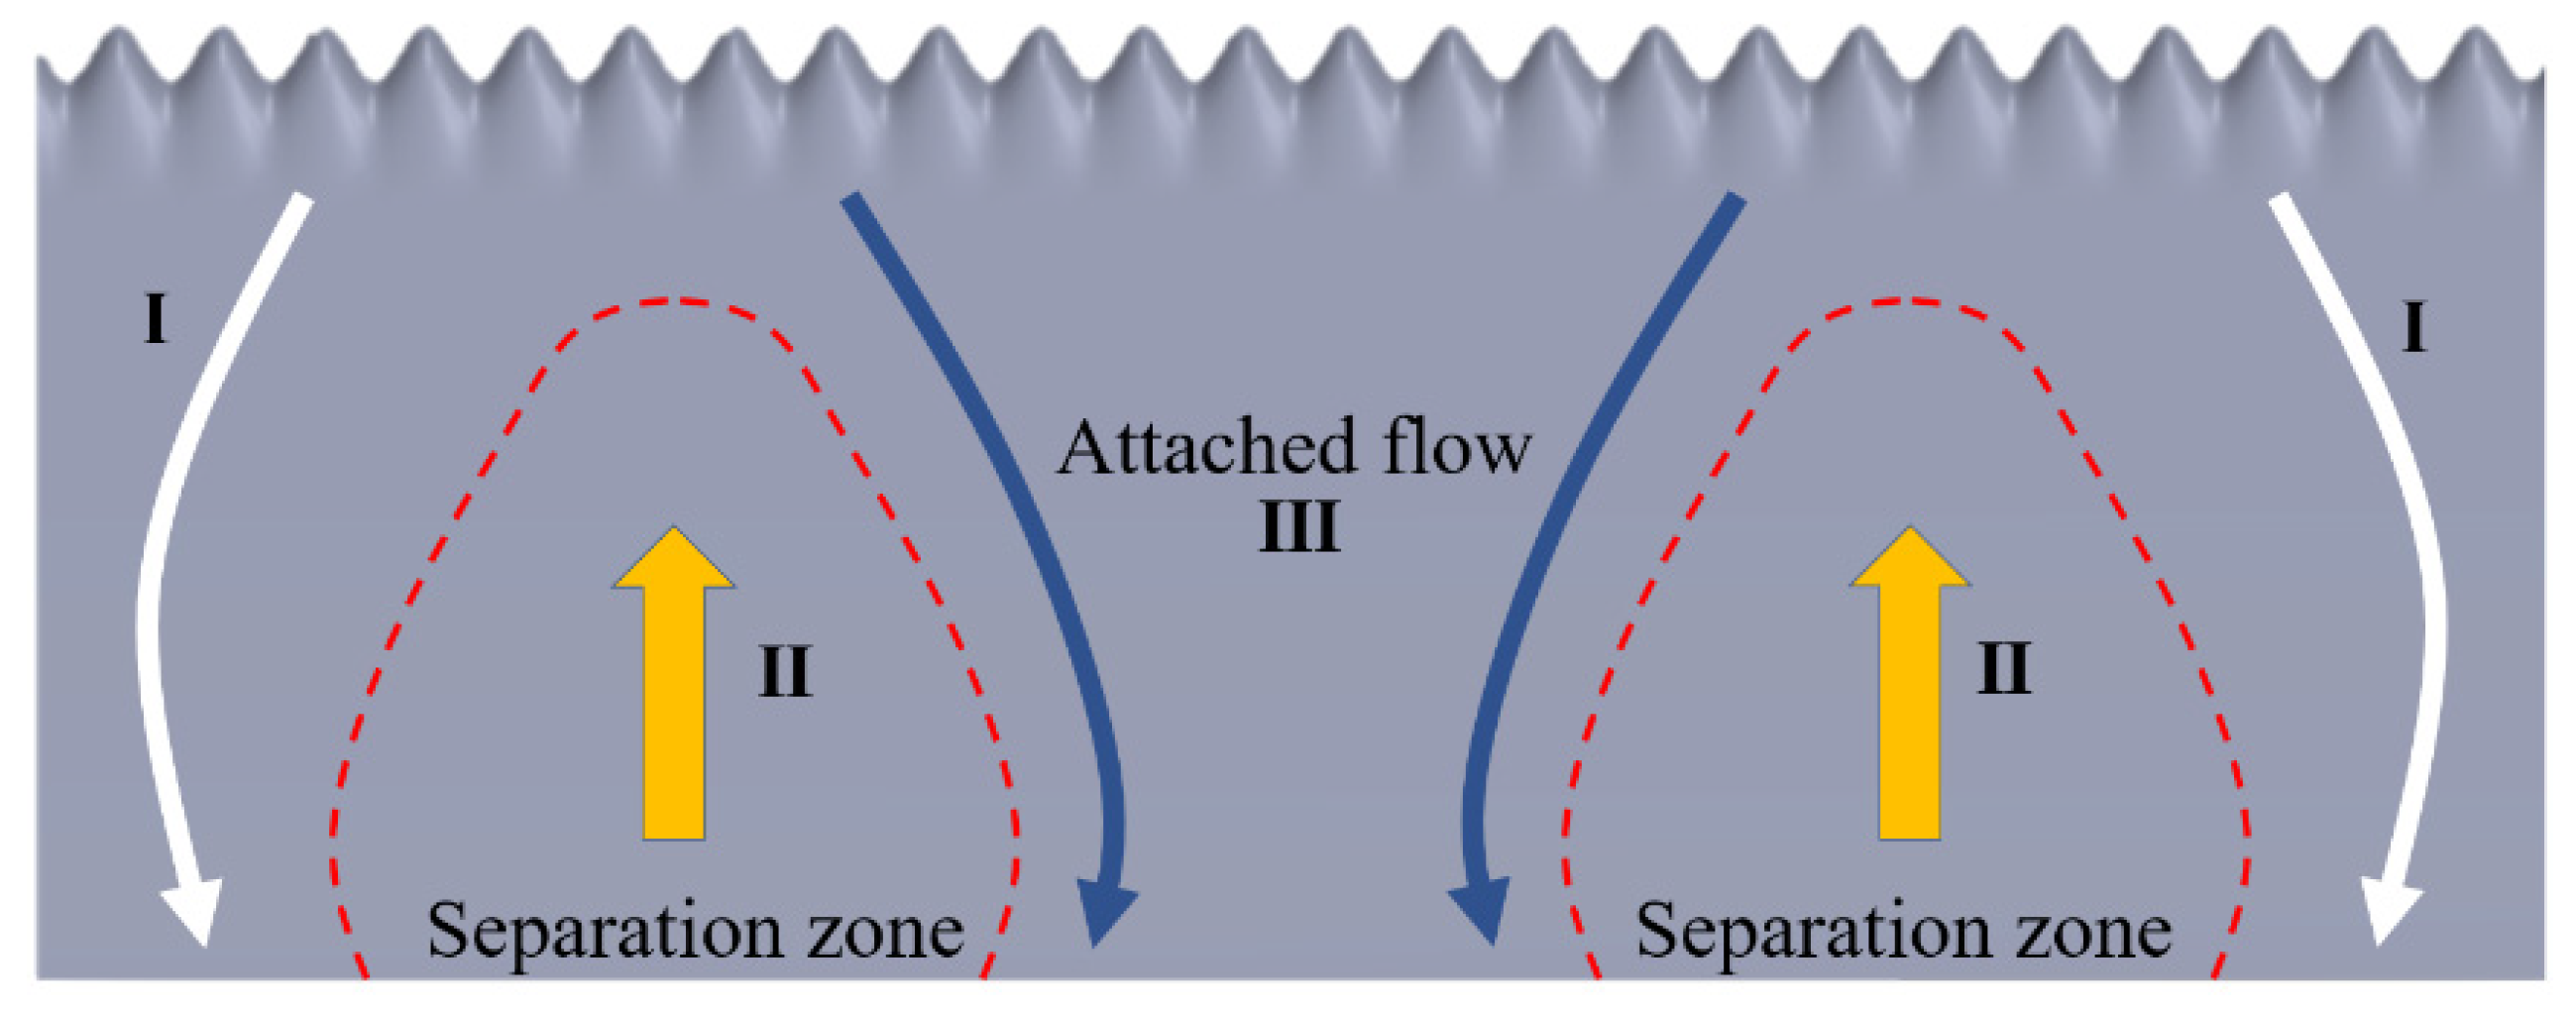
3.3. Discussion on Control Mechanism of WLEs

According to the above, the delayed stall of the WLEs is the comprehensive effect of multiple mechanisms, resulting from the different behaviors of the flow vortex pairs generated by the WLEs at different spanwise positions. According to Cai et al. [39], in the attachment region, due to the induction of the separation vortex, the airflow in the central region washes down and the separation is inhibited, which means that the degree of flow attachment after the crest is greater than that after the trough, which was also reported by Johari et al. [19]. However, how the airflow downwash behavior acts on the airfoil surface has not been fully explained. The behavior of streamwise vortices at different AOA, coupled with its inherent spanwise attributes, forms the fundamental physical mechanism of WLEs for flow control. In this section, the flow topologies near the WLEs will be analyzed to analyze the control mechanism.
Figure 17 shows the oil film evolution images near the WLEs when AOA = 0° and 14°. When AOA = 0°, the post-WLEs flow at different diffusion positions is periodic and symmetrical when AOA is small, while the flow at different diffusion positions is different when AOA is large. The separation zone and the attachment zone appear alternately. Figure 17b shows the oil film evolution image of the central region of the attachment flow, corresponding to Ⅲ in Figure 15.
At the large AOA, the visualization image of the oil flow in the leading-edge region of the WLE airfoil indicates that the WLE will generate vortices in the spanwise direction. Previous studies [17,21,42] also showed that the pressure distribution differed at the spreading nodular crest and trough, resulting in different influences of the vortices on the flow field at the crest and trough of the WLEs. The velocity distribution of the flow field at the WLEs crest and WLEs trough is different, resulting from the streamwise vortices’ influence on the spreading direction.
Figure 18 shows the topologies obtained from the oil film evolution process in Figure 18. Consider connecting the topology in Figure 18a with A to D four-point connection, and the topology in Figure 18b with E to H four-point connection, and identify the critical points and boundary switching points in the topology in counterclockwise order. Obviously, both ABCD and EFGH regions satisfy the P–B law.
In Figure 18a, it can be seen that the flow line at the crest section is straighter than that at the trough section, and the flow convergence trend from the crest to the trough can also be seen. In terms of aerodynamic performance, at low AOA, the WLEs do not significantly improve the aerodynamic performance in a positive way, but the pressure gradient generated by WLEs increases the drag coefficient, as shown in Figure 9. Figure 18b shows the topology of the central attached flow region at a large AOA. Two vortices in opposite directions can be clearly seen, the center of which is the reflux region, indicating that there is a small separation region near the leading edge WLE. However, due to the complex interaction between the air flows passing through multiple WLEs, the converging effect of high momentum attached air flows on both sides is caused, which limits the diffusion of leading-edge separation and makes the separated air re-attach. This is the reason for the alternating appearance of separation and attachment on the surface of the WLEs airfoil at a large AOA, that is, the flow partition shown in Figure 15.

4. Conclusions

In this paper, the WLEs were applied to the SC1094 airfoil and the influence of WLEs on its aerodynamic performance was studied through wind tunnel tests. And for the first time, through GLOF experimental technology, the quantified flow topology structure of WLEs wings was obtained, and the changes in flow topology before and after stall were described in detail. And the flow control mechanism of WLEs was revealed. The main conclusions obtained are as follows:
(1) The aerodynamic force measurement results show that, compared with the baseline airfoil, WLEs can effectively increase the stall Angle of the airfoil under three Reynolds numbers studied in this study, that is, delayed stall. For the WLEs airfoil, there is a small drop in the lift curve after the baseline airfoil stalls, and then the lift continues to increase until the stall. At the three Reynolds numbers of this experiment, WLEs achieved a maximum lift gain of 24.72–31.07% and a maximum drag reduction rate of 30.28–32.11%.
(2) GLOF and PIV results show that at small AOA, the flow around the WLE is periodic and symmetrical, and the flow vortices between WLEs upwash at the trough and downwash at the crest, resulting in the flow from the crest to the trough. Due to upwash, a local three-dimensional LSB structure appears at the trough section. The velocity of the trough section is greater than that of the crest section, which is consistent with the result of Hansen et al. [27].
(3) At large AOA after baseline airfoil stall, the air flow on the airfoil surface of WLEs presents a two-period pattern along the spanwise direction, and the separation zone and the attachment zone appear alternately, indicating that the control effect of delayed stall is accomplished by reducing the separation zone on the airfoil surface. The alternating appearance of the separation zone and the attachment zone is caused by the complex coupling between the flows passing through multiple WLEs, which leads to the convergence of the high-momentum attached air flows on both sides, limiting the diffusion of the separation of the front edge and making the separated air re-attach.
The coupling effect between WLEs is related to the wavelength or number of WLEs. Therefore, the influence of the number and wavelength parameters of WLEs on the topologies will be studied in a future study.

Author Contributions

Conceptualization, H.D.; Formal analysis, H.X.; Investigation, S.C. and J.W.; Methodology, H.D.; Visualization, Z.Y.; Writing—original draft, H.J.; Writing—review and editing, H.D. All authors have read and agreed to the published version of the manuscript.

Funding

This work was funded by the National Natural Science Foundation of China (Grant No. 51806181), the foundation of National Key Laboratory of Science and Technology on Aerodynamic Design and Research (No. 614220121030205) and International Science and Technology Innovation Cooperation/Hong Kong, Macao, and Taiwan Science and Technology Innovation Cooperation Project of Science and Technology Department of Sichuan Province (No. 23GJHZ0164).

Data Availability Statement

Data for this study are available from the corresponding authors upon reasonable request.

Conflicts of Interest

The authors declare no conflicts of interest.

Abbreviations

AbbreviationOriginal text
AOAAngle of Attack
GLOFGlobal Luminescent oil film
LSBLaminar separation bubble
PIVParticle image velocimetry
ReReynolds number
WLEsWavy Leading-Edges

References

  1. Fish, F.E.; Lauder, G.V. Passive and active flow control by swimming fishes and mammals. Annu. Rev. Fluid Mech. 2006, 38, 193–224. [Google Scholar] [CrossRef]
  2. Bolzon, M.D.; Kelso, R.M.; Arjomandi, M. Performance effects of a single tubercle terminating at a swept wing’s tip. Exp. Therm. Fluid Sci. 2017, 85, 52–68. [Google Scholar] [CrossRef]
  3. Cai, C.; Zhou, T.; Liu, S.H.; Zuo, Z.G.; Zhang, Y.A.; Li, Q.A. Modeling of the compartmentalization effect induced by leading-edge tubercles. Phys. Fluids 2022, 34, 15. [Google Scholar] [CrossRef]
  4. Zhao, M.; Xu, L.C.; Li, X.J.; Zhao, Y.J.; Liu, Z.X. Dynamic stall of pitching tubercled wings in vortical wake flowfield. Phys. Fluids 2023, 35, 15. [Google Scholar] [CrossRef]
  5. Troll, M.; Shi, W.C.; Stark, C.; Atlar, M. Vortex dynamics impact on the wake flow of a marine rudder with leading-edge tubercles. J. Ocean Eng. Mar. Energy 2022, 8, 553–571. [Google Scholar] [CrossRef]
  6. Post, M.L.; Decker, R.; Sapell, A.R.; Hart, J.S. Effect of bio-inspired sinusoidal leading-edges on wings. Aerosp. Sci. Technol. 2018, 81, 128–140. [Google Scholar] [CrossRef]
  7. Ni, Z.; Dhanak, M.; Su, T.C. Performance Characteristics of Airfoils with Leading-Edge Tubercles and an Internal Slot. AIAA J. 2019, 57, 2394–2407. [Google Scholar] [CrossRef]
  8. Sudhakar, S.; Karthikeyan, N.; Venkatakrishnan, L. Influence of leading edge tubercles on aerodynamic characteristics of a high aspect-ratio UAV. Aerosp. Sci. Technol. 2017, 69, 281–289. [Google Scholar] [CrossRef]
  9. Seyhan, M.; Sarioglu, M.; Akansu, Y.E. Influence of Leading-Edge Tubercle with Amplitude Modulation on NACA 0015 Airfoil. AIAA J. 2021, 59, 3965–3978. [Google Scholar] [CrossRef]
  10. Chen, W.J.; Qiao, W.Y.; Wei, Z.J. Aerodynamic performance and wake development of airfoils with wavy leading edges. Aerosp. Sci. Technol. 2020, 106, 27. [Google Scholar] [CrossRef]
  11. Kemali, H.; Saydam, A.Z.; Helvacioglu, S. Investigation of the Effect of Leading-Edge Tubercles on Wingsail Performance. J. ETA Marit. Sci. 2020, 8, 54–65. [Google Scholar] [CrossRef]
  12. Degregori, E.; Kim, J.W. Mitigation of transonic shock buffet on a supercritical airfoil through wavy leading edges. Phys. Fluids 2021, 33, 15. [Google Scholar] [CrossRef]
  13. Miklosovic, D.S.; Murray, M.M.; Howle, L.E.; Fish, F.E. Leading-edge tubercles delay stall on humpback whale (Megaptera novaeangliae) flippers. Phys. Fluids 2004, 16, L39–L42. [Google Scholar] [CrossRef]
  14. Smith, T.A.; Klettner, C.A. Airfoil trailing-edge noise and drag reduction at a moderate Reynolds number using wavy geometries. Phys. Fluids 2022, 34, 20. [Google Scholar] [CrossRef]
  15. Degregori, E.; Kim, J.W. An investigation on a supercritical aerofoil with a wavy leading edge in a transonic flow. Phys. Fluids 2020, 32, 17. [Google Scholar] [CrossRef]
  16. Bampanis, G.; Roger, M.; Ragni, D.; Avallone, F.; Teruna, C. Airfoil-Turbulence Interaction Noise Source Identification and Reduction by Leading-Edge Serrations. In Proceedings of the AIAA/CEAS Aeroacoustics Conference, Delft, The Netherlands, 20–23 May 2019; p. 18. [Google Scholar]
  17. Turner, J.M.; Kim, J.W. Aeroacoustic source mechanisms of a wavy leading edge undergoing vortical disturbances. J. Fluid Mech. 2017, 811, 582–611. [Google Scholar] [CrossRef]
  18. Xing, Y.D.; Chen, W.J.; Wang, X.Y.; Tong, F.; Qiao, W.Y. Effect of Wavy Leading Edges on Airfoil Trailing-Edge Bluntness Noise. Aerospace 2023, 10, 17. [Google Scholar] [CrossRef]
  19. Johari, H.; Henoch, C.; Custodio, D.; Levshin, A. Effects of leading-edge protuberances on airfoil performance. AIAA J. 2007, 45, 2634–2642. [Google Scholar] [CrossRef]
  20. Hansen, K.L.; Kelso, R.M.; Dally, B.B. Performance Variations of Leading-Edge Tubercles for Distinct Airfoil Profiles. AIAA J. 2011, 49, 185–194. [Google Scholar] [CrossRef]
  21. Cai, C.; Liu, S.H.; Zuo, Z.G.; Maeda, T.; Kamada, Y.; Li, Q.A.; Sato, R. Experimental and theoretical investigations on the effect of a single leading-edge protuberance on airfoil performance. Phys. Fluids 2019, 31, 16. [Google Scholar] [CrossRef]
  22. Cai, C.; Zuo, Z.G.; Morimoto, M.; Maeda, T.; Kamada, Y.; Liu, S.H. Two-Step Stall Characteristic of an Airfoil with a Single Leading-Edge Protuberance. AIAA J. 2018, 56, 64–77. [Google Scholar] [CrossRef]
  23. Custodio, D.; Henoch, C.W.; Johari, H. Aerodynamic Characteristics of Finite Span Wings with Leading-Edge Protuberances. AIAA J. 2015, 53, 1878–1893. [Google Scholar] [CrossRef]
  24. Colak, A.; Seyhan, M.; Sarioglu, M. Leading-edge tubercle modifications to the biomimetic wings. Phys. Fluids 2023, 35, 14. [Google Scholar] [CrossRef]
  25. Rostamzadeh, N.; Hansen, K.L.; Kelso, R.M.; Dally, B.B. The formation mechanism and impact of streamwise vortices on NACA 0021 airfoil’s performance with undulating leading edge modification. Phys. Fluids 2014, 26, 22. [Google Scholar] [CrossRef]
  26. Rostamzadeh, N.; Kelso, R.M.; Dally, B. A numerical investigation into the effects of Reynolds number on the flow mechanism induced by a tubercled leading edge. Theor. Comput. Fluid Dyn. 2017, 31, 1–32. [Google Scholar] [CrossRef]
  27. Hansen, K.L.; Rostamzadeh, N.; Kelso, R.M.; Dally, B.B. Evolution of the streamwise vortices generated between leading edge tubercles. J. Fluid Mech. 2016, 788, 730–766. [Google Scholar] [CrossRef]
  28. Ferreira, P.H.; Brondani, L.M.; Scarpari, J.R.S.; Correa, F.L.S.; de Paula, A.A.; da Silva, R.G.A. Evaluation of Wavy Leading Edge for Rotary-Wing Applications. In Proceedings of the 2018 Flow Control Conference, Atlanta, Georgia, 25–29 June 2018; p. 20. [Google Scholar]
  29. Liu, T.S.; Chen, T.; Salazar, D.M.; Miozzi, M. Skin friction and surface optical flow in viscous flows. Phys. Fluids 2022, 34, 14. [Google Scholar] [CrossRef]
  30. Liu, T.S.; Montefort, J.; Woodiga, S.; Merati, P.; Shen, L.X. Global luminescent oil-film skin-friction meter. AIAA J. 2008, 46, 476–485. [Google Scholar] [CrossRef]
  31. Horn, B.K.P.; Schunck, B.G. Determining optical flow. Proc. SPIE Int. Soc. Opt. Eng. (USA) 1981, 281, 319–331. [Google Scholar] [CrossRef]
  32. Liu, T.; Woodiga, S.; Ma, T. Skin friction topology in a region enclosed by penetrable boundary. Exp. Fluids 2011, 51, 1549–1562. [Google Scholar] [CrossRef]
  33. Woodiga, S.; Liu, T.S.; Ramasamy, R.S.V.; Kode, S.K. Effects of pitch, yaw, and roll on delta wing skin friction topology. Proc. Inst. Mech. Eng. Part G J. Aerosp. Eng. 2016, 230, 639–652. [Google Scholar] [CrossRef]
  34. Zhong, H.J.; Woodiga, S.; Wang, P.; Shang, J.K.; Cui, X.C.; Wang, J.M.; Liu, T.S. Skin-friction topology of wing body junction flows. Eur. J. Mech. B Fluids 2015, 53, 55–67. [Google Scholar] [CrossRef]
  35. Liu, T.S. Global skin friction measurements and interpretation. Prog. Aeosp. Sci. 2019, 111, 19. [Google Scholar] [CrossRef]
  36. Du, H.; Jiang, H.; Chen, S.; Yang, Z.Y.; Zhang, W.X. Fluorescent oil-film applied to measure skin friction of flat plate with leading edge separation bubble in low Reynolds number. Int. J. Mod. Phys. B 2023, 19, 2350272. [Google Scholar] [CrossRef]
  37. Rostamzadeh, N.; Kelso, R.M.; Dally, B.B.; Hansen, K.L. The effect of undulating leading-edge modifications on NACA 0021 airfoil characteristics. Phys. Fluids 2013, 25, 19. [Google Scholar] [CrossRef]
  38. Pena, B.; Muk-Pavic, E.; Thomas, G.; Fitzsimmons, P. Numerical analysis of a leading edge tubercle hydrofoil in turbulent regime. J. Fluid Mech. 2019, 878, 292–305. [Google Scholar] [CrossRef]
  39. Cai, C.; Zuo, Z.G.; Maeda, T.; Kamada, Y.; Li, Q.A.; Shimamoto, K.; Liu, S.H. Periodic and aperiodic flow patterns around an airfoil with leading-edge protuberances. Phys. Fluids 2017, 29, 14. [Google Scholar] [CrossRef]
  40. Rodríguez, D.; Theofilis, V. On the birth of stall cells on airfoils. Theor. Comput. Fluid Dyn. 2011, 25, 105–117. [Google Scholar] [CrossRef]
  41. Schewe, G. Reynolds-Number Effects in Flow Around More-or-Less Bluff Bodies; Elsevier: Amsterdam, The Netherlands, 2001. [Google Scholar]
  42. Zhao, M.; Xu, L.C.; Tang, Z.Q.; Zhang, X.L.; Zhao, B.; Liu, Z.X.; Wei, Z.Y. Onset of dynamic stall of tubercled wings. Phys. Fluids 2021, 33, 13. [Google Scholar] [CrossRef]
Figure 1. Airfoil model. (a) Baseline airfoil; (b) WLEs airfoil.
Aerospace 11 00194 g001
Figure 2. Geometric parameters of WLEs.
Aerospace 11 00194 g002
Figure 3. Experimental photo of airfoil in wind tunnel.
Aerospace 11 00194 g003
Figure 4. Aerodynamic force measuring device.
Aerospace 11 00194 g004
Figure 5. Comparison between the current experimental force measurement results and the experimental data of Ferreira et al. [28].
Aerospace 11 00194 g005
Figure 6. Three typical cross-section positions measured by PIV.
Aerospace 11 00194 g006
Figure 7. Luminescent oil film measuring device.
Aerospace 11 00194 g007
Figure 8. Geometric characteristics of critical points and boundary switching points [36].
Aerospace 11 00194 g008
Figure 9. CL and CD at different Reynolds numbers. (a) Re = 140,000; (b) Re = 170,000; (c) Re = 200,000.
Aerospace 11 00194 g009
Figure 10. Oil film image and flow topology at AOA = 0°. (a) Baseline; (b) WLEs.
Aerospace 11 00194 g010
Figure 11. Oil film image and flow topology at AOA = 4°. (a) Baseline; (b) WLEs.
Aerospace 11 00194 g011
Figure 12. Oil film image and flow topology at AOA = 8°. (a) Baseline; (b) WLEs.
Aerospace 11 00194 g012
Figure 13. Velocity flow field. (a) AOA = 4°; (b) AOA = 8°.
Aerospace 11 00194 g013
Figure 14. Oil film image and flow topology at AOA = 12°. (a) Baseline; (b) WLEs.
Aerospace 11 00194 g014
Figure 15. Partition of flow structure of airfoil near the wall.
Aerospace 11 00194 g015
Figure 16. Velocity flow field when AOA = 12°.
Aerospace 11 00194 g016
Figure 17. Influence of AOA on flow field at WLEs airfoil. (a) AOA = 0°; (b) AOA = 14°.
Aerospace 11 00194 g017
Figure 18. Flow topology of the local front area of the WLEs airfoil. (a) AOA = 0°; (b) AOA = 14°.
Aerospace 11 00194 g018
Disclaimer/Publisher’s Note: The statements, opinions and data contained in all publications are solely those of the individual author(s) and contributor(s) and not of MDPI and/or the editor(s). MDPI and/or the editor(s) disclaim responsibility for any injury to people or property resulting from any ideas, methods, instructions or products referred to in the content.

