Abstract
After years of preparation, the Indonesia National Observatory, located in Mount Timau, Kupang Regency, is currently in the completion stage of research in astronomy and astrophysics and related subjects. An optic telescope with a 3.8 m diameter is expected to receive its first light in mid-2024. A feasibility study for Indonesia’s radio telescopes and networks is in progress. A single-dish parabolic radio antenna with a diameter of 20 m is proposed to work in a frequency range of 1–50 GHz. An array dipole antenna with an area of 100 m × 100 m will also be installed at a 70–350 MHz frequency. A feasibility study about system design is in progress, and a radio frequency interference (RFI) survey has been underway since 2014. In this paper, we described the design of radio telescopes such as parabolic reflectors, horn antenna, and the radio frequency interference (RFI) in the surrounding area of the National Observatory, covering the frequency band from 45 MHz to 18 GHz. The frequencies in 45–85 MHz and 120–360 MHz intervals are still relatively quiet and suitable for developing radio telescopes. The selected higher frequency of 1.4 GHz for a neutral hydrogen (HI) spectral line, 6.6 GHz for a methanol (CH3OH) spectral line, and 8.6 GHz for a helium (3 He+) spectral line is still relatively quiet and suitable for the development of radio telescopes.
1. Introduction
In order to keep up with global advancements in astronomy, Indonesian astronomers have dedicated themselves to studying the development of new astronomical facilities. They have identified potential locations in southeastern Indonesia where the sky and climate support astronomical observations [1]. Previous surveys have been performed for radio telescope development in a frequency range from low to 8 GHz [2,3].
Recently, Indonesia has been developing the Indonesia National Observatory near Timau Mountain, in the Kupang area, in the province of East Nusa Tenggara for astronomy and astrophysics research. An optical telescope with a 3.8 m diameter is under construction and will be in operation by mid-2024. In addition, a single-dish parabolic radio antenna of the 20 m class and an array of dipole antennas of 100 m × 100 m will be installed near the optical telescope as shown in Figure 1. The development of radio telescopes in the National Observatory is necessary for supporting multiwavelength observations. Meanwhile, radio telescopes in Indonesia will significantly improve the quality of radio telescope networks, such as Very Long Baseline Interferometry (VLBI) [4]. In paper [5], we have studied the possibility of these radio telescopes contributing to various aspects of astronomical research, such as monitoring solar activity, observing active galactic nuclei, and monitoring masers. These telescopes can operate as a single dish or join a network such as VLBI. Besides astronomical purposes, these radio telescopes have a role in other scientific domains. For instance, it is well known that a network of radio telescopes can be used to monitor tectonic plate motion [6,7], monitor earth orientation parameters [8,9], estimate atmospheric parameters [10,11], prove the theory of general relativity [12,13], and support ground stations for tracking satellites [14]. Table 1 shows the possible scientific aims for parabolic and dipole antennas in the Indonesia National Observatory.
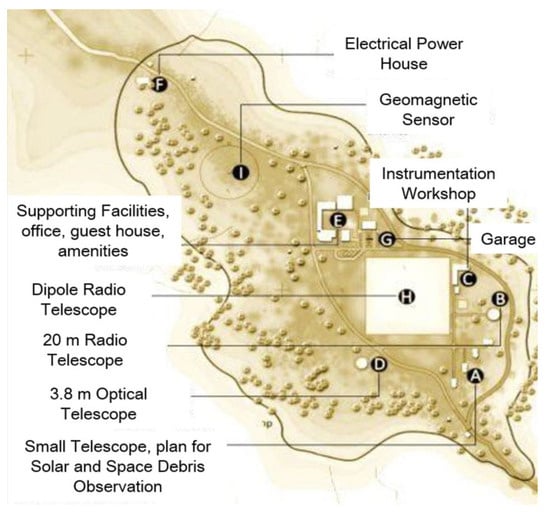
Figure 1.
The location of the Indonesia National Observatory and instruments plan at Mount Timau, at longitude (E) 123°56′48.5″, latitude (S) 9°35′50.2″, and altitude 1352 m [15].

Table 1.
Example of possible scientific goals using the future parabolic and dipole antennas in the Indonesia National Observatory.
Therefore, the single-dish parabolic radio antenna is proposed to be installed at a 1–50 GHz frequency, whereas the array of dipole antennas will work at a 70–350 MHz frequency range. At frequencies above approximately 10 GHz, atmospheric effects are a dominant factor in selecting a site for radio astronomy. Commonly, Indonesia has high rain, which affects radio telescope performance. Site evaluation for an astronomical observatory in Indonesia has been conducted as a feasibility study for a new observatory with a radio telescope of 70–350 MHz and 1–50 GHz. The atmospheric condition in terms of apparent sky fraction has been reported recently in [1], suggesting that East Nusa Tenggara’s regions in southeastern Indonesia are the most promising candidates for such an astronomical observatory.
A frequency below 2 GHz is the most robust consideration for many applications such as radar, radio communication, and radio broadcasting. For example, a radio telescope that can effectively be used in the European VLBI network, at 30–40 m in diameter with a frequency of at least 1.4–32 GHz broadband, has been constructed in the case of the Westerbork Synthesis Radio Telescope, which has two circular multi-frequency front ends (MFFEs) that have receivers at 3.6, 6, 13, 49 cm, and 92 cm [16,17]. We considered population density distribution and meteorological conditions to determine the candidate sites.
Note that a radio telescope is a receiver system that is more sensitive than the radio communication receivers used for telecommunications. A radio quiet zone for radio astronomy observations is needed to manage radio interference from man-made sources, intentional or unintentional.
For optimizing radio astronomy observations, particularly at advanced, costly, and sensitive modern facilities, radio quiet zones (RQZs) have been implemented by some administrations. An RQZ is meant to be any recognized geographic area within which the usual spectrum management procedures are modified to reduce or avoid interference with radio telescopes, thereby maintaining the required standards for the quality and availability of observational data [18]. The radio quiet zone for the National Observatory is planned within 25 km, which will be discussed in Section 3.2. The regulation of a radio quiet zone will be discussed with Kemkominfo, a national regulator for the use of spectrum radio frequencies. A radio frequency survey must be done regularly to monitor radio frequency occupancy.
2. System Design and Radio Frequency Survey (RFS) Measurement
2.1. Reflector and Horn Antenna Design
The height of the parabolic antenna is 26 m, the diameter of the parabolic is 20 m, and the antenna uses a corrugated horn antenna. A detailed design of the radio telescope, parabolic design, and horn antenna design are shown in Figure 2. The main parameters of the radio telescope design are shown in Table 2.
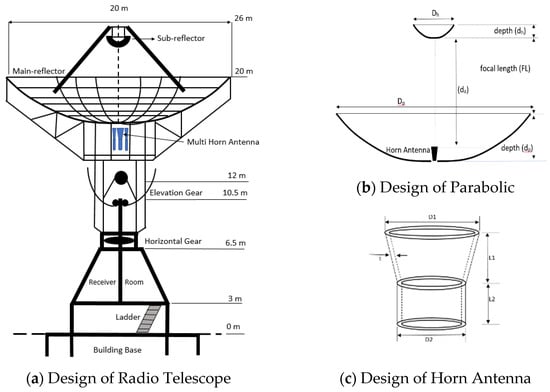
Figure 2.
Design of radio telescope, design of parabolic, design of horn antenna.
Table 2.
Main parameters of the radio telescope design.
2.2. Frequency Plan for Spectral Line Observations
The radio telescope will detect spectral lines with a selected object, such as a hydrogen spectral line at a frequency of 1.42 GHz, a spectral line of methanol at a frequency of 6.66 GHz, a spectral line of helium at a frequency of 8.66 GHz, a spectral line of water vapor at a frequency of 22.23 GHz, and a spectral line of silicon monoxide at a frequency of 43.12 GHz. A detailed plan of this frequency is shown in Table 3.
Table 3.
Plan of radio frequency for radio astronomy at frequencies below 50 GHz.
2.3. Radio Frequency Survey
The antenna for this survey uses a broadband horn antenna, model OBH-10180, and the spectrum analyzer used is the Keysight N9937A Fieldfox Handheld Microwave Spectrum Analyzer, with a maximum frequency of up to 18 GHz. The horn antenna is from 1 to 18 GHz, featuring linear polarization and a typical value gain of 11 dBi, with an antenna size of 160 mm × 241 mm × 204 mm. The antenna used for below 1 GHz is a standard dipole antenna. The survey was done on 4–9 November 2021 and 15–22 February 2022, in the morning, during the day, and at night. A photo of the antenna and spectrum analyzer is shown in Figure 3 and basic parameters of the Keysight N9937A Fieldfox Handheld Microwave Spectrum Analyzer are shown in Table 4.
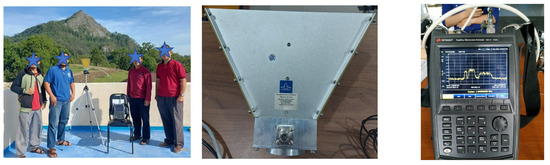
Figure 3.
Photo of measurement site (left), horn antenna (middle), and spectrum analyzer (right).
Table 4.
Basic measurement parameters selected for the spectrum analyzer.
In this survey, the direction of the antenna is in five (5) directions, east west, north south, and vertical direction, to find the direction of radio sources. The survey was done on the observatory site with terrain, as shown in Figure 4.
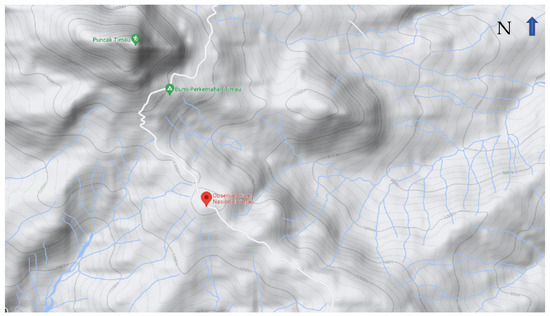
Figure 4.
Photo of the terrain of the National Observatory site by Google Maps.
Figure 5 shows the measurement point (symbol: star) and location of the base transceiver station (symbol: point) near the National Observatory. It is possible to interfere with the signal of the radio telescope in a radius of 25 km, beside the FM radio transmitter at a distance of 70 km in Kupang city.
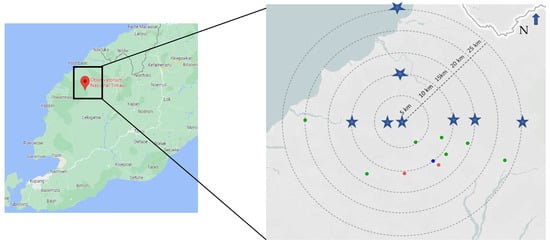
Figure 5.
Location of measurement point and base transceiver station near the Indonesian National Observatory in a radius of 25 km, in East Nusa Tenggara province.
3. Results and Analysis
3.1. Simulation Result of Horn Antenna and Analysis
Due to the limitations in the number of spectrum analyzer units and the heavy terrain of the measurement sites, data collection cannot be carried out simultaneously, on the same frequency, at the same time, at different locations. Ideally, data collection is taken simultaneously at several measurement points. So, in this paper, the results of measurements at the site of the National Observatory and other locations at different times are seen and compared. This measurement result is significant for determining the radio quiet zone (RQZ) around the radio telescope that received weak radio waves generated by space objects. Northeast of the observatory is Dilli, Timor Leste, around 260 km away, and Darwin, Australia, around 800 km in a southeastern direction. That is a possible location for sources of the ground radio transmitters.
The critical parameter for a radio telescope with a parabolic reflector is high directivity and low back side lobe. Figure 6 shows the directivity and radiation pattern of the horn antenna. Antenna directivity at a frequency of 22 GHz for a spectral line of water vapor is around 18.6 dB, a relatively low side lobe is around −10 dB, and the half-power beam width is less than 10 degrees. Low amplitude in the side lobe is crucial to reduce noise from the ground and other directions.
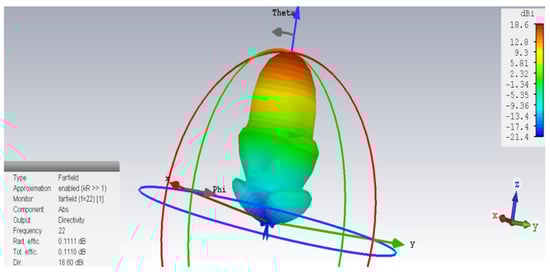
Figure 6.
Directivity and radiation pattern.
Figure 7 shows the return loss of the horn antenna. In this simulation, the horn antenna has a wideband from 15–40 GHz with a return loss lower than −10 dB, and the lowest return loss is on a frequency of around 23 GHz with a value of −80 dB. The wideband of the return loss of the antenna is very important in radio telescopes for flexibility of frequency observation.
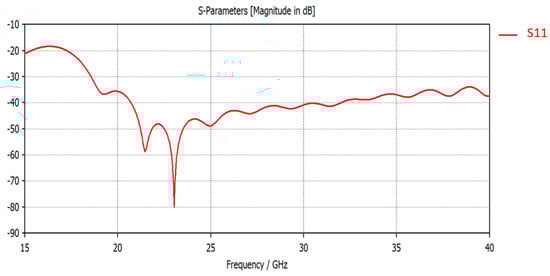
Figure 7.
Return loss (s11) of antenna at 15–40 GHz.
Figure 8 shows the impedance of the horn antenna. In this simulation, the horn antenna has an impedance in a frequency range from 20 to 40 GHz of around 50–55 Ohm. The wideband impedance of an antenna is essential in radio telescopes to reduce the loss of radio energy and to ensure the flexibility of frequency observations.
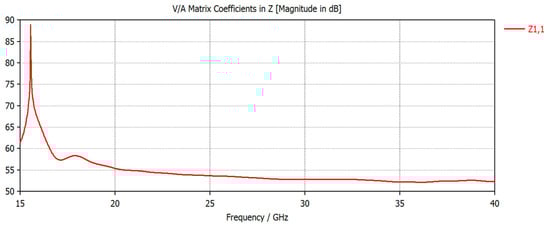
Figure 8.
Impedance of antenna at a frequency of 15–40 GHz.
3.2. Radio Survey Result and Analysis
The results of the radio measurement surveys and analysis, from frequencies of 45 MHz to 18 GHz, are presented and carried out at the National Observatory and its surroundings up to 25 km.
3.2.1. Frequency of 45–120 MHz
The 45–120 MHz range is the lowest frequency in this measurement. A significant RFI in this band originates from radio broadcasts for frequency modulation (FM) radio in the 88–118 MHz range, with amplitude varying from 20 to 30 dB above the noise floor. There are 10 radio broadcasts having the dominant amplitude. At a frequency of 72 MHz, we detect a signal with a power intensity up to 23 dBm. A frequency between 75 and 88 MHz and 105 and 120 MHz is quiet.
The details of this band are shown in Figure 9a. At frequencies 50–65 MHz, a signal is generated by electricity by a generator set. Radio signal is commonly transmitted from Kupang city at the southern side of the observatory. Figure 9b shows the radio frequency survey at a radius of 10 km in the northern side (R10N) of the National Observatory on 17 February 2022. No signal is detected, except at a frequency of 90.93 MHz with a power spectral intensity around 5 dBm. The different colors, in all figure below show the instantaneous power spectral intensity at short period, around 3–5 times in one day.
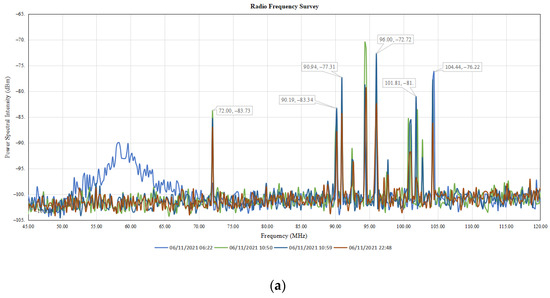
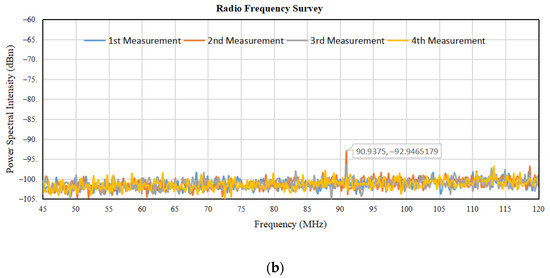
Figure 9.
(a) Radio frequency survey in a frequency range of 45–120 MHz, at the center of the National Observatory, on 6–9 November 2021. (b) Radio frequency survey in a frequency range of 45–120 MHz, in R10N, on 17 February 2022.
3.2.2. Frequency of 120–200 MHz
Figure 10a shows the radio frequency survey at the observatory site on 6 November 2022. Four (4) signals are detected, at frequencies of 144 MHz, 150 MHz, 168 MHz, and 192 MHz, with a power spectral intensity varying around 5–10 dBm. Figure 10b shows the radio frequency survey at a radius of 10 km in northern (R10N) on 17 February 2022. There is no signal detected in this frequency interval.
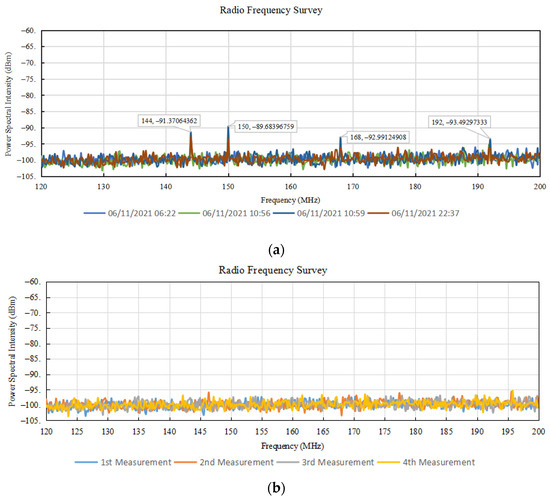
Figure 10.
(a) Radio frequency survey in a frequency range of 120–200 MHz, at the observatory site, on 6 November 2021. (b) Radio frequency survey in a frequency range of 120–200 MHz, in R10N, on 17 February 2022.
3.2.3. Frequency of 200–350 MHz
Figure 11a shows the radio frequency survey at the observatory site on 6 November 2022 at a 200–350 MHz frequency. Two (2) short signals are detected, at a frequency of 215 MHz and 300 MHz, in an amplitude varying around 8–14 dB. This frequency is commonly used for radio navigation for flight and maritime applications [19]. Figure 11b shows the radio frequency survey at a radius of 10 km in northern (R10N) on 17 February 2022. There is no signal detected in this frequency interval.
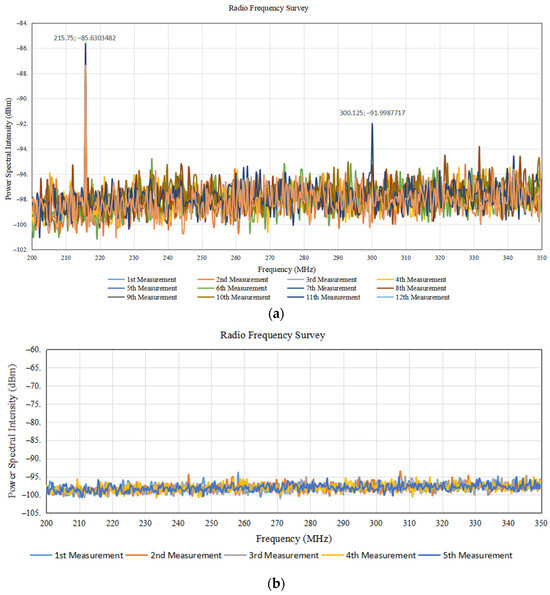
Figure 11.
(a) Radio frequency survey in a frequency range of 200–350 MHz, at the observatory site, on 6 November 2021. (b) Radio frequency survey in a frequency range of 200–350 MHz, in R10N, on 17 February 2022.
3.2.4. Frequency of 350–680 MHz
Figure 12a shows the radio frequency survey at the observatory site on 6 November 2022 at a 200–350 MHz frequency. There are no signals detected in this frequency interval. Figure 12b shows the radio frequency survey at a radius of 10 km in northern (R10N) on 17 February 2022. There is no signal detected in this frequency interval.
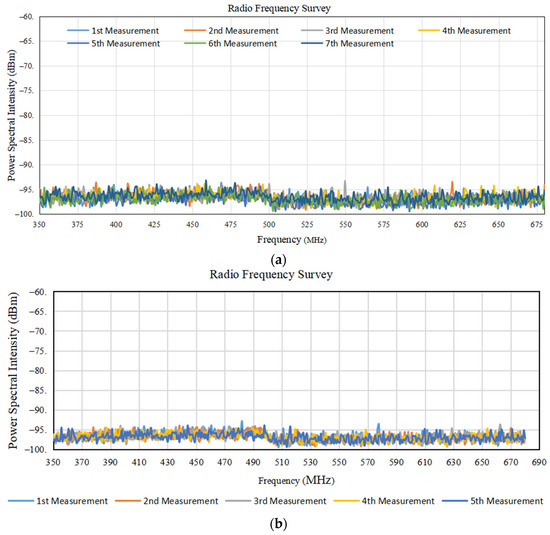
Figure 12.
(a) Radio frequency survey in a frequency range of 350–680 MHz, at the observatory site, on 6 November 2022. (b) Radio frequency survey in a frequency range of 350–680 MHz, at R10N, on 17 February 2022.
3.2.5. Frequency of 680–800 MHz
Figure 13a shows the radio frequency survey in the 680–800 MHz frequency range. In this interval frequency, there is no radio wave detected. Figure 13b shows the radio frequency survey in the 680–800 MHz frequency range. In this interval frequency, there is no radio wave detected.
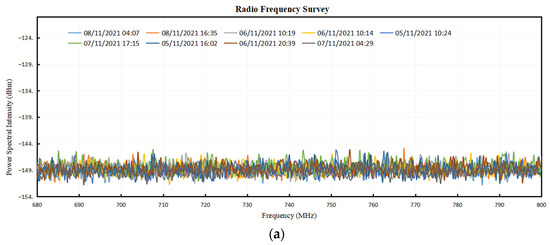
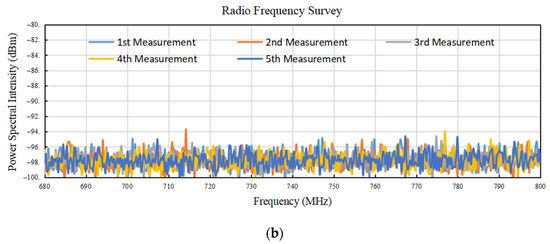
Figure 13.
(a) Radio frequency survey in a frequency range of 680–800 MHz, at the observatory site, on 5–9 November 2021. (b) Radio frequency survey in a frequency range of 680–800 MHz, on 19 February 2022.
3.2.6. Frequency of 800–960 MHz
In this interval frequency of 800–960 MHz, this band is used to observe the redshifted lines emitted by extragalactic sources. The spectrum analyzer was set for a resolution bandwidth (RBW) of 30 KHz and a noise floor of −100 dBm. The frequency allocations in this band are mainly for mobile communication and fixed wireless. The signal is detected at a frequency of 881 MHz, with a power spectral intensity of around 26 dBm at a frequency of 888 MHz, and 893 MHz has a power spectral intensity of around 50 dBm and 14 dBm above the noise floor, respectively, as shown in Figure 14a.
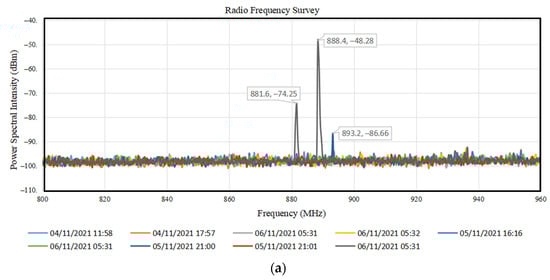
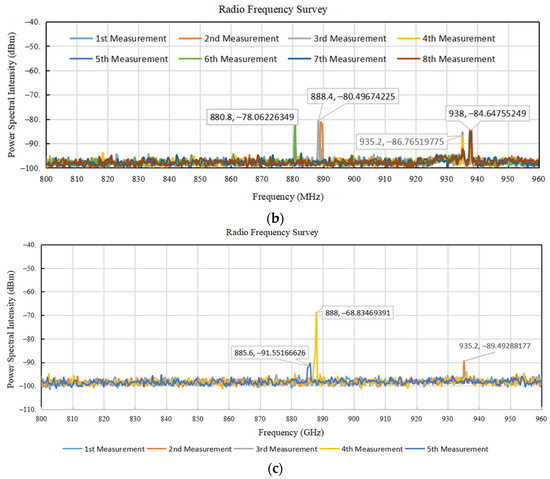
Figure 14.
(a) Radio frequency survey in a frequency range of 800–960 MHz. (b) Radio frequency survey in a frequency range of 800–960 MHz, R1W, on 20 February 2022. (c) Radio frequency survey in a frequency range of 800–960 MHz, R10E, on 19 February 2022.
Frequencies in the range of 800–960 MHz, at a location 1 km to the west (R1W) of the center of the National Observatory, are shown in Figure 14a. In this band, we detect the signal at 885 MHz and 888 MHz, with a power spectral intensity of 9 dBm and 32 dBm, respectively. We also detect a signal at frequency 935 MHz with a power spectral intensity of 11 dBm above the noise floor.
Frequencies in the range of 800–960 MHz, at a location 10 km to the east (R10E) of the center of the National Observatory, are shown in Figure 14c. In this band, we detect the signal in 880 MHz and 888 MHz, with a power spectral intensity of 22 dBm and 19.5 dBm, respectively. We also detect signals at frequency 935.2 MHz and 938 MHz with a power spectral intensity of 11 dBm and 16 dBm above the noise floor, respectively.
3.2.7. Frequency of 0.96–1.4 GHz
Frequencies in the 0.96–1.4 GHz range are relatively quiet, as shown in Figure 15a. In this frequency interval, there is no allocation frequency for astronomy, except in a frequency at 1.4 GHz for a spectral line of hydrogen. Figure 15b,c show the radio frequency survey in the range of 0.96–1.4 GHz at a location radius of 10 km to northern (R10N) and a location radius of 25 km to northern (R25N). The radio signal at this location is quiet.
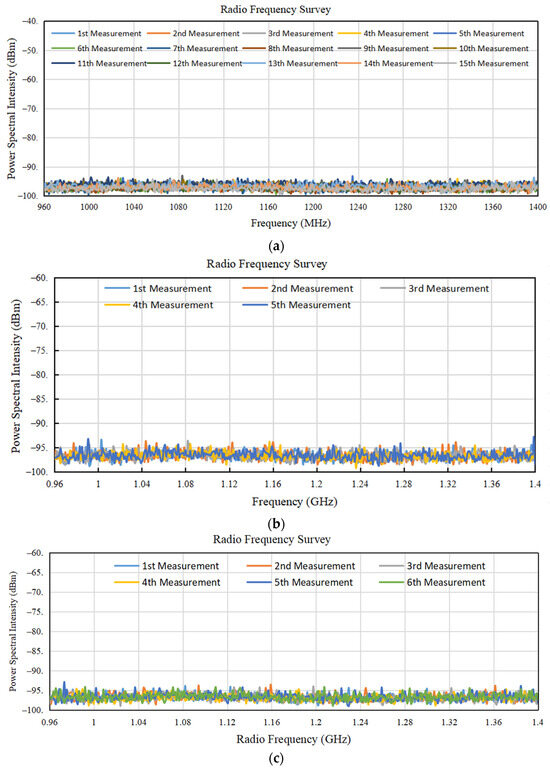
Figure 15.
(a) Radio frequency survey in a frequency range of 0.96–1.4 GHz. (b) Radio frequency survey in a frequency range of 0.96–1.4 GHz, at R10N, on 17 February 2022. (c) Radio frequency survey in a frequency range of 0.96–1.4 GHz, at R25N, on 16 February 2022.
3.2.8. Frequency of 1.4–3 GHz
Frequencies in the range of 1.4–3 GHz are relatively quiet at the observatory site, as shown in Figure 16a, and at a radius of 10 km in northern (R10N), as shown in Figure 16b. In this frequency interval, there is no allocation frequency for astronomy, except in a frequency at 1400 MHz for a spectral hydrogen line.
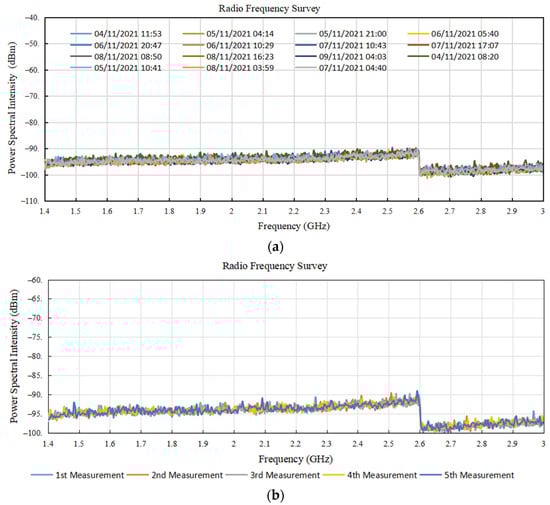
Figure 16.
(a) Radio frequency survey in a frequency range of 1.4–3 GHz, at the observatory site, on 19 November 2022. (b) Radio frequency survey in a frequency range of 1.4–3 GHz, at R10N, on 17 February 2022.
3.2.9. Frequency of 3–8 GHz
The 3–8 GHz frequency range is relatively quiet, as shown in Figure 17a,b. We can see that this frequency band is relatively quiet, both at the observatory location, as shown in Figure 17a, and within a 10 km radius of the observatory (R10N), as shown in Figure 17b. This result was confirmed at a radius of 10 km to the east (R10E), as shown in Figure 17c, at a radius of 25 km to the east (R25E), as shown in Figure 17d, and at a radius of 25 km to the north (R25N), as shown in Figure 17e. In this frequency interval, there is an allocation frequency for astronomy, at a frequency of 6.668.5 GHz for a spectral line of methanol (CH3OH), as shown by the green bar line in Figure 17a,e.
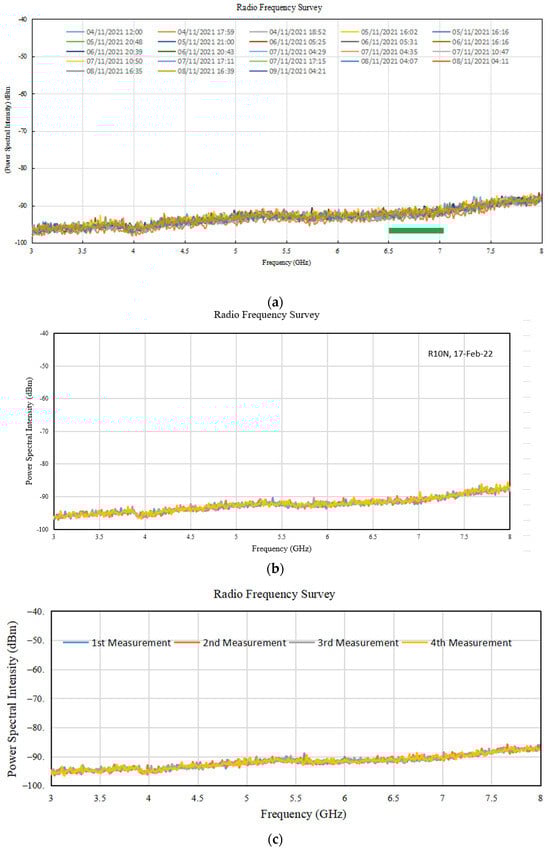
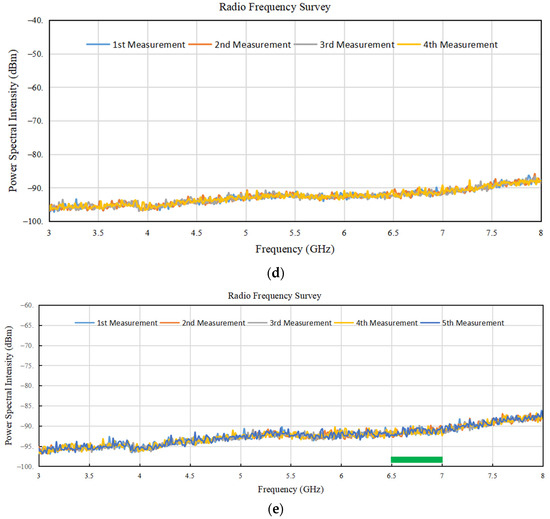
Figure 17.
(a) Radio frequency survey in a frequency range of 3–8 GHz, at the observatory site, on 17 November 2021. (b) Radio frequency survey in a frequency range of 3–8 GHz, at R10N, on 17 February 2022. (c) Radio frequency survey in a frequency range of 3–8 GHz, at R10E, on 19 February 2022. (d) Radio frequency survey in a frequency range of 3–8 GHz, at R25E, on 18 February 2022. (e) Radio frequency survey in a frequency range of 8–13 GHz, at R25N, on 16 February 2022.
3.2.10. Frequency of 8–13 GHz
Frequencies in the range of 8–13 GHz are shown in Figure 18a–d. This result was also confirmed at a radius of 10 km to the east (R10E), as shown in Figure 18c, and at a radius of 25 km to the east (R25E), as shown in Figure 18d. There is an allocation frequency for astronomy in this interval, at a frequency center of 8.665 GHz for a spectral line of helium (3He+), as shown by the bar line in Figure 18a,b. In this frequency interval, there is no radio signal detected.
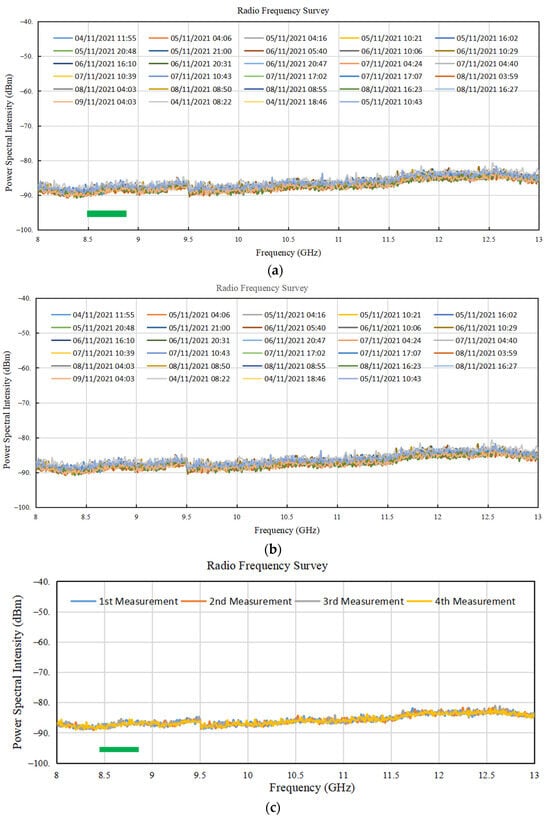
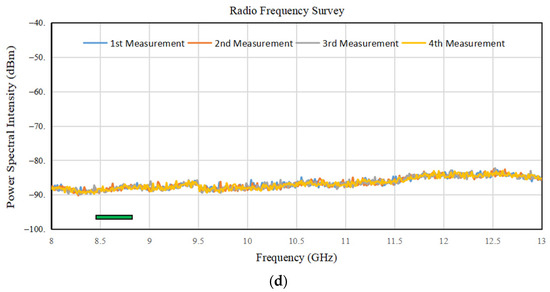
Figure 18.
(a) Radio frequency survey in a frequency range of 8–13 GHz. (b) Radio frequency survey in a frequency range of 8–13 GHz. (c) Radio frequency survey in a frequency range of 8–13 GHz, at R10E, on 19 February 2022. (d) Radio frequency survey in a frequency range of 8–13 GHz, at R25E, on 18 February 2022.
3.2.11. Frequency of 13–18 GHz
Frequencies in the range of 13–18 GHz are shown in Figure 19a,b. Figure 19a shows the radio frequency survey at the observatory site on 17 November 2021. Figure 16b shows the radio frequency survey at a radius of 10 km to the north (R10N) on 17 February 2022. There is no allocation frequency for astronomy in this interval. In this frequency band, the occupancy is quiet.
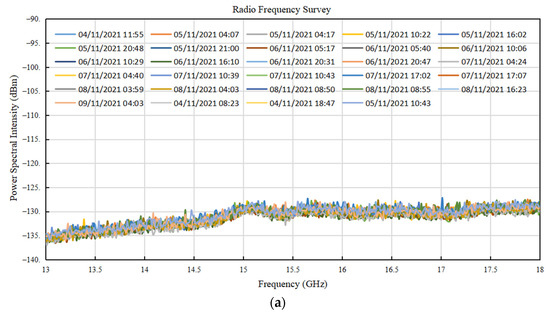
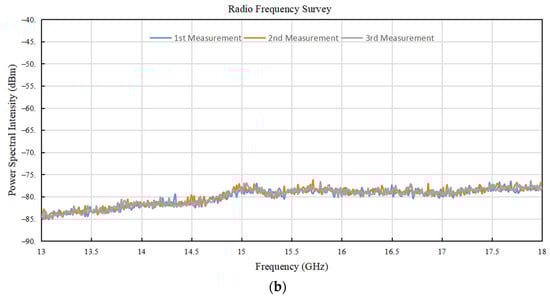
Figure 19.
(a) Radio frequency survey in a frequency range of 13–18 MHz, at the observatory site, on 17 November 2021. (b) Radio frequency survey in a frequency range of 13–18 MHz, at R10N, on 17 February 2022.
4. Conclusions
The horn antenna commonly has a high antenna gain and a low side lobe that is very suitable for parabolic radio telescope antennas. We proposed a horn antenna design for the radio telescope for a National Observatory with a small size of 114 mm and a diameter of 40 mm for a working frequency of 22 GHz. The simulation result of the horn antenna is that the antenna gain is around 18 dB, antenna impedance is around 50 ohms, and return loss is lower than −30 dB at 22–25 GHz.
The site for the radio telescope observatory needs a quiet zone to detect weak signals from space objects. In this measurement, in intervals of high and very high frequencies of 45–85 MHz and 120–360 MHz, it is still relatively quiet and suitable for developing a radio telescope. The selected higher frequency of 1.4 GHz for a neutral hydrogen (HI) spectral line, 6.6 GHz for a methanol (CH3OH) spectral line, and 8.6 GHz for a helium (3 He+) spectral line is still relatively quiet and suitable for the development of a radio telescope.
Author Contributions
Conceptualization, P.P.S., M.B., T.M., M.L., T.H., F.M., R.S., P.R. and I.N.H.; methodology, P.P.S., T.M., M.B. and M.L.; software, P.P.S., M.B., R.S. and F.S.; validation, P.P.S., T.M., M.B., M.L. and T.H.; formal analysis, P.P.S., T.M., M.B. and M.L.; investigation, P.P.S., T.M., M.B. and M.L.; resources, P.P.S., T.M., M.B., Y.T. and M.L.; data curation, P.P.S., T.M., M.B. and M.L.; writing—original draft preparation, P.P.S., T.M., M.B. and M.L.; writing—review and editing, P.P.S., T.M., M.B., M., T.H., P.R., R.S., F.S., Y.T. and M.L.; visualization, P.P.S. and M.B.; supervision, P.R. and T.H.; project administration, P.P.S., T.M., M.B. and M.L.; funding acquisition, P.R., P.P.S., T.M., M.B., M.L. and Y.T. All authors have read and agreed to the published version of the manuscript.
Funding
This research was funded by the National Research and Innovation Agency and the Faculty of Mathematics and Natural Sciences, Universitas Negeri Padang and the authors.
Data Availability Statement
Data are unavailable due to privacy or ethical restrictions.
Acknowledgments
Thanks to all National Research and Innovation Agency (BRIN) staff at Timau Field Station, Research Center for Space, Technology Center for Aeronautics, and Research Center for Telecommunication.
Conflicts of Interest
The authors declare no conflicts of interest.
References
- Hidayat, T.; Mahasena, P.; Dermawan, B.; Hadi, T.; Premadi, P.; Herdiwijaya, D. Clear sky fraction above Indonesia: An analysis for astronomical site selection. Mon. Not. R. Astron. Soc. 2012, 427, 1903–1917. [Google Scholar] [CrossRef][Green Version]
- Hidayat, T.; Munir, A.; Dermawan, B.; Jaelani, A.T.; Léon, S.; Nugroho, D.H.; Suksmono, A.B.; Mahasena, P.; Premadi, P.W.; Herdiwijaya, D.; et al. Radio frequency interference measurements in Indonesia. Exp. Astron. 2014, 37, 85–108. [Google Scholar] [CrossRef]
- Sitompul, P.P.; Manik, T.; Batubara, M.; Suhandi, B. Radio Frequency Interference Measurements for a Radio Astronomy Observatory Site in Indonesia. Aerospace 2021, 8, 51. [Google Scholar] [CrossRef]
- Huda, I.N.; Hidayat, T.; Dermawan, B.; Lambert, S.; Liu, N.; Leon, S.; Fujisawa, K.; Yonekura, Y.; Sugiyama, K.; Hirota, T.; et al. Measuring the impact of Indonesian antennas on global geodetic VLBI network. Exp. Astron. 2021, 52, 141–155. [Google Scholar] [CrossRef]
- Mumtahana, F.; Huda, I.N.; Husna, M.; Manik, T.; Sitompul, P.; Batubara, M.; Lathief, M.; Hidayat, T. The Potential Use of the 20-Meter Radio Telescope Planned at The Timau National Observatory. Rom. Astron. J. 2023, 33, 3–14. [Google Scholar]
- Krásná, H.; Tierno Ros, C.; Pavetich, P.; Böhm, J.; Nilsson, T.; Schuh, H. Investigation of crustal motion in Europe by analysing the European VLBI sessions. Acta Geod. et Geophys. 2013, 48, 389. [Google Scholar] [CrossRef]
- Rahmani, M.; Nafisi, V.; Böhm, S.; Asgari, J. Evaluation of the GSRM2. 1 and the NUVEL1-A values in Europe using S.L.R. and VLBI based geodetic velocity fields. Surv. Rev. 2022, 54, 349–362. [Google Scholar] [CrossRef]
- Nurul Huda, I.; Lambert, S.; Bizouard, C.; Ziegler, Y. Nutation terms adjustment to VLBI and implication for the Earth rotation resonance parameters. Geophys. J. Int. 2020, 220, 759–767. [Google Scholar] [CrossRef]
- Malki, Z. On comparison of the Earth orientation parameters obtained from different VLBI networks and observing programs. J. Geod. 2009, 83, 547–556. [Google Scholar] [CrossRef]
- Pacione, R.; Fionda, E.; Ferrara, R.; Lanotte, R.; Sciarretta, C.; Vespe, F. Comparison of atmospheric parameters derived from G.P.S., VLBI and a ground-based microwave radiometer in Italy. Phys. Chem. Earth Parts A/B/C 2002, 27, 309–316. [Google Scholar] [CrossRef]
- VanDam, T.M.; Herring, T.A. Detection of atmospheric pressure loading using very long baseline interferometry measurements. J. Geophys. Res. Solid Earth 1994, 99, 4505–4517. [Google Scholar] [CrossRef]
- Titov, O.; Girdiuk, A.; Lambert, S.B.; Lovell, J.; McCallum, J.; Shabala, S.; McCallum, L.; Mayer, D.; Schartner, M.; De Witt, A.; et al. Testing general relativity with geodetic VLBI-What a single, specially designed experiment can teach us. Astron. Astrophys. 2018, 618, A8. [Google Scholar] [CrossRef]
- Lambert, S.B.; Le Poncin-Lafitte, C. Improved determination of γ by VLBI. Astron. Astrophys. 2011, 529, A70. [Google Scholar] [CrossRef]
- Bissa, S.; Huda, I.N.; Saputra, M.; Rizal, S.; Wibowo, R.; Mumtahana, F.; Sitompul, P.; Batubara, M.; Lathief, M.; Manik, T.; et al. Development of Artificial Earth Satellite Simulation Software for Future Radio Telescopes in Indonesia. Rom. Astron. J. 2023, 33, 57–65. [Google Scholar]
- Mumpuni, E.S.; Admiranto, A.G.; Priyatikanto, R.; Puspitarini, L.; Nurzaman, M.Z.; Mumtahana, F.; Yatini, C.Y.; Tanesib, J.L. Selayang Pandang Observatorium Nasional Timau; LAPAN, Pusat Sains Antariksa: Jakarta, Indonesia, 2017. (In Indonesia) [Google Scholar]
- Flygare, J.; Pantaleev, M.; Olvhammar, S. BRAND: Ultra-Wideband Feed Development for the European VLBI Network—A Dielectrically Loaded Decade Bandwidth Quad-Ridge Flared Horn. In Proceedings of the 12th European Conference on Antennas and Propagation (EuCAP 2018), London, UK, 9–13 April 2018. [Google Scholar]
- EVN Biennial Report 2019–2020. 2021. Available online: https://www.evlbi.org/sites/default/files/reports/EVN-biennial-report-2019-2020-web.pdf (accessed on 14 December 2023).
- Report ITU-R RA.2259. Characteristics of Radio Quiet Zones. 2012. Available online: https://www.itu.int/dms_pub/itu-r/opb/rep/R-REP-RA.2259-1-2021-PDF-E.pdf (accessed on 14 December 2023).
- Keputusan Menteri Perhubungan nomor: KM.5. Penyempurnaan Tabel Alokasi Spektrum Frekuensi Radio Indonesia. 2001. Available online: https://www.postel.go.id/downloads/39/20120120093052-KM_5_Tahun_2001.pdf (accessed on 15 January 2022). (In Indonesia).
Disclaimer/Publisher’s Note: The statements, opinions and data contained in all publications are solely those of the individual author(s) and contributor(s) and not of MDPI and/or the editor(s). MDPI and/or the editor(s) disclaim responsibility for any injury to people or property resulting from any ideas, methods, instructions or products referred to in the content. |
© 2024 by the authors. Licensee MDPI, Basel, Switzerland. This article is an open access article distributed under the terms and conditions of the Creative Commons Attribution (CC BY) license (https://creativecommons.org/licenses/by/4.0/).