Article

Coupled Aerodynamics–Structure Analysis and Wind Tunnel Experiments on Passive Hinge Oscillation of Wing-Tip-Chained Airplanes

Department of Advanced Energy, Graduate School of Frontier Sciences, The University of Tokyo, 5-1-5 Kashiwanoha, Kashiwa-shi, Chiba 277-8561, Japan
*
Author to whom correspondence should be addressed.
Aerospace 2024, 11(1), 53; https://doi.org/10.3390/aerospace11010053
Submission received: 6 December 2023 / Revised: 30 December 2023 / Accepted: 3 January 2024 / Published: 4 January 2024

Abstract

:
This study examines the wing hinge oscillations in an aircraft concept that employs multiple wings, or small aircraft, chained at the wing tips through freely rotatable hinges with minimal structural damping and no mechanical position-locking system. This creates a single pseudo long-span aircraft that resembles a flying chain oriented perpendicular to the flight direction. Numerical calculations were conducted using the vortex lattice method and modified equations for a multi-link rigid body pendulum. The calculations demonstrated good agreement with small-scale wind tunnel experiments, where the motion of the chained wings was tracked through color tracking, and the forces were measured using six-axis force sensors. The total C L / C D increased for the chained wings, even in the presence of hinge joint oscillations. Furthermore, numerical simulations assuming an unmanned airplane size corroborated the theoretical attainment of passive stability with high chained numbers ( 9 wings), without any structural damping and relying solely on aerodynamic forces. Guidelines for appropriate hinge axis angle δ and angle-of-attack regions for different chained wing numbers to maximize passive oscillation stability were obtained. The results showed that wing-tip-chained airplanes could successfully provide substantially large wing spans while retaining flexibility, light weight and C L / C D , without requiring active hinge rotation control.

1. Introduction

One of the most simple and effective ways to increase a fixed airplane’s efficiency and flight range is by increasing the wing span or, in other words, increasing the aspect ratio. This can be confirmed by the equation by Breguet [1].
Numerous studies have been conducted regarding aircrafts with high-aspect ratios in the past [2,3,4]. However, for certain cases, it could be difficult to increase the wing span over a certain length. Typical cases could include when an unmanned airplane needs to be fit into a tight confined space. For example, Mars explorers have a high demand for efficiency due to Mars’s thin atmosphere while they are required to fit into the atmosphere entry capsule [5,6]. Another example is search-and-rescue drones for disasters, where fixed-wing unmanned aircrafts with a longer range than typical multirotors are useful [7], but compactness will be important for rapid transportation and handling by rescuers.
A solution to these situations could be to utilize the chaining of multiple small-spanned aircrafts at their wing tips using highly flexible, detachable hinges [8,9]. For these chaining hinges, a non-rigid solution such as a freely rotating hinge, even in flight, is expected to be effective.
One merit would be that it will allow for the simplification of structure by omitting the position-locking system [10] and load support structures seen in conventional folding-wing designed airplanes [5]. Another merit for a freely rotating hinge, compared to a semi-rigid or completely rigid connection, would be that the unexpected local sharp aerial load propagation would be alleviated across the wing, allowing for a lighter total structure for the wing span. The load alleviation effect due to freely rotating hinges showed promising results when utilized for wing tips in previous research [11,12].
Preliminary wind tunnel demonstration tests by the authors, utilizing several model airplanes chained via freely rotating hinges at the wing tips [13,14], implied that this configuration may be able to withstand large complicated deformations in attitude around the hinges, which would have led to a breakage of the wing for typical elastic- or rigid-spanned airplanes of the same total span. However, no detailed quantitative data were obtained in these prior experiments by the author, and it remained at the stage of very preliminary concept validation.
An example image of this configuration, where a pseudo single, large, long-span fixed-wing aircraft is formed by connecting multiple smaller individual fixed-wing aircraft side by side at their wingtips through a free-rotating hinge, is shown in Figure 1. The whole configuration resembles a flexible flying chain or multi-link pendulum perpendicular to the flight direction and is expected to show characteristics uniquely different from typical long-span elastic wing airplanes, as introduced in the beginning.
One unavoidable disadvantage of the wing-tip-chained airplane configurations is that, due to the presence of freely rotatable hinges throughout the structure, oscillations around these joints are inevitable to some degree during flight. The highly flexible hinges with low rigidity are expected to pose challenges in flight controls since large deformations in shape during flights may lead to a constantly shifting center of mass, and inappropriate controls in the individual chained airplanes may lead to collisions between the adjoined airplanes and wings. The design of the freely rotating hinges also poses a difficult challenge since frequent rotations are expected to wear out the materials, but the wing tip hinge structure must be light enough to maximize the advantages discussed above. The mechanism and controlling procedure to detach and rechain with the adjoint airplanes also require careful design to balance robustness and simplicity.
The focus of this research is on the aerodynamical aspect, and for this phase of research, detailed engineering and mechanical challenges for the structural design of the hinges is neglected. The ultimate goal is to achieve general insight into the characteristics and trend of oscillation with different hinge configurations and various parameters, aiming to achieve maximum passive stability of the inevitable hinge oscillation, even with multiple chaining of wings via freely rotating hinges.
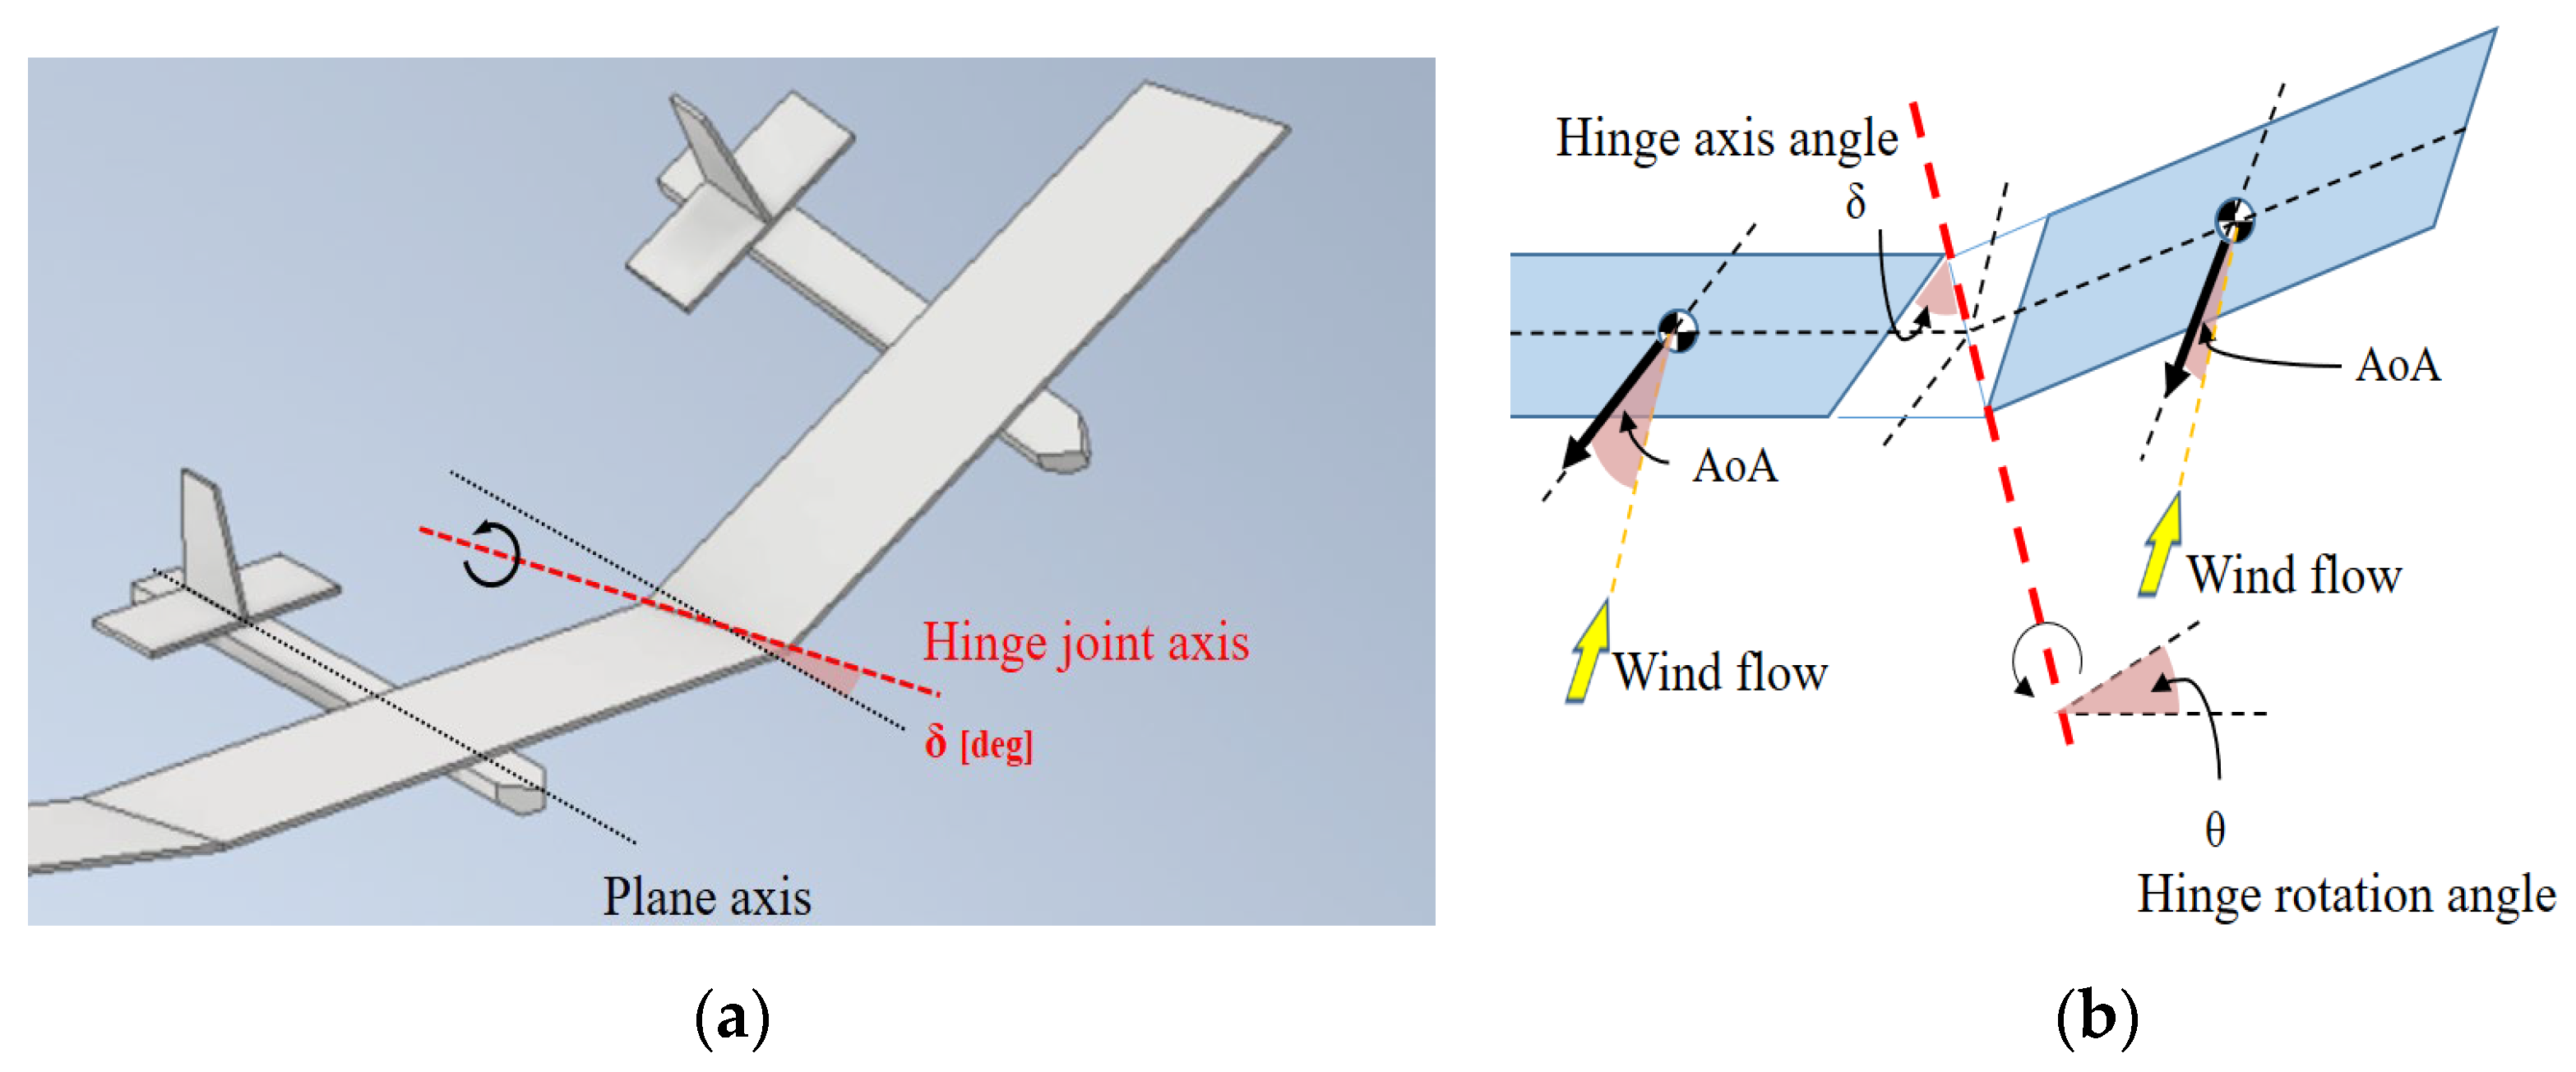
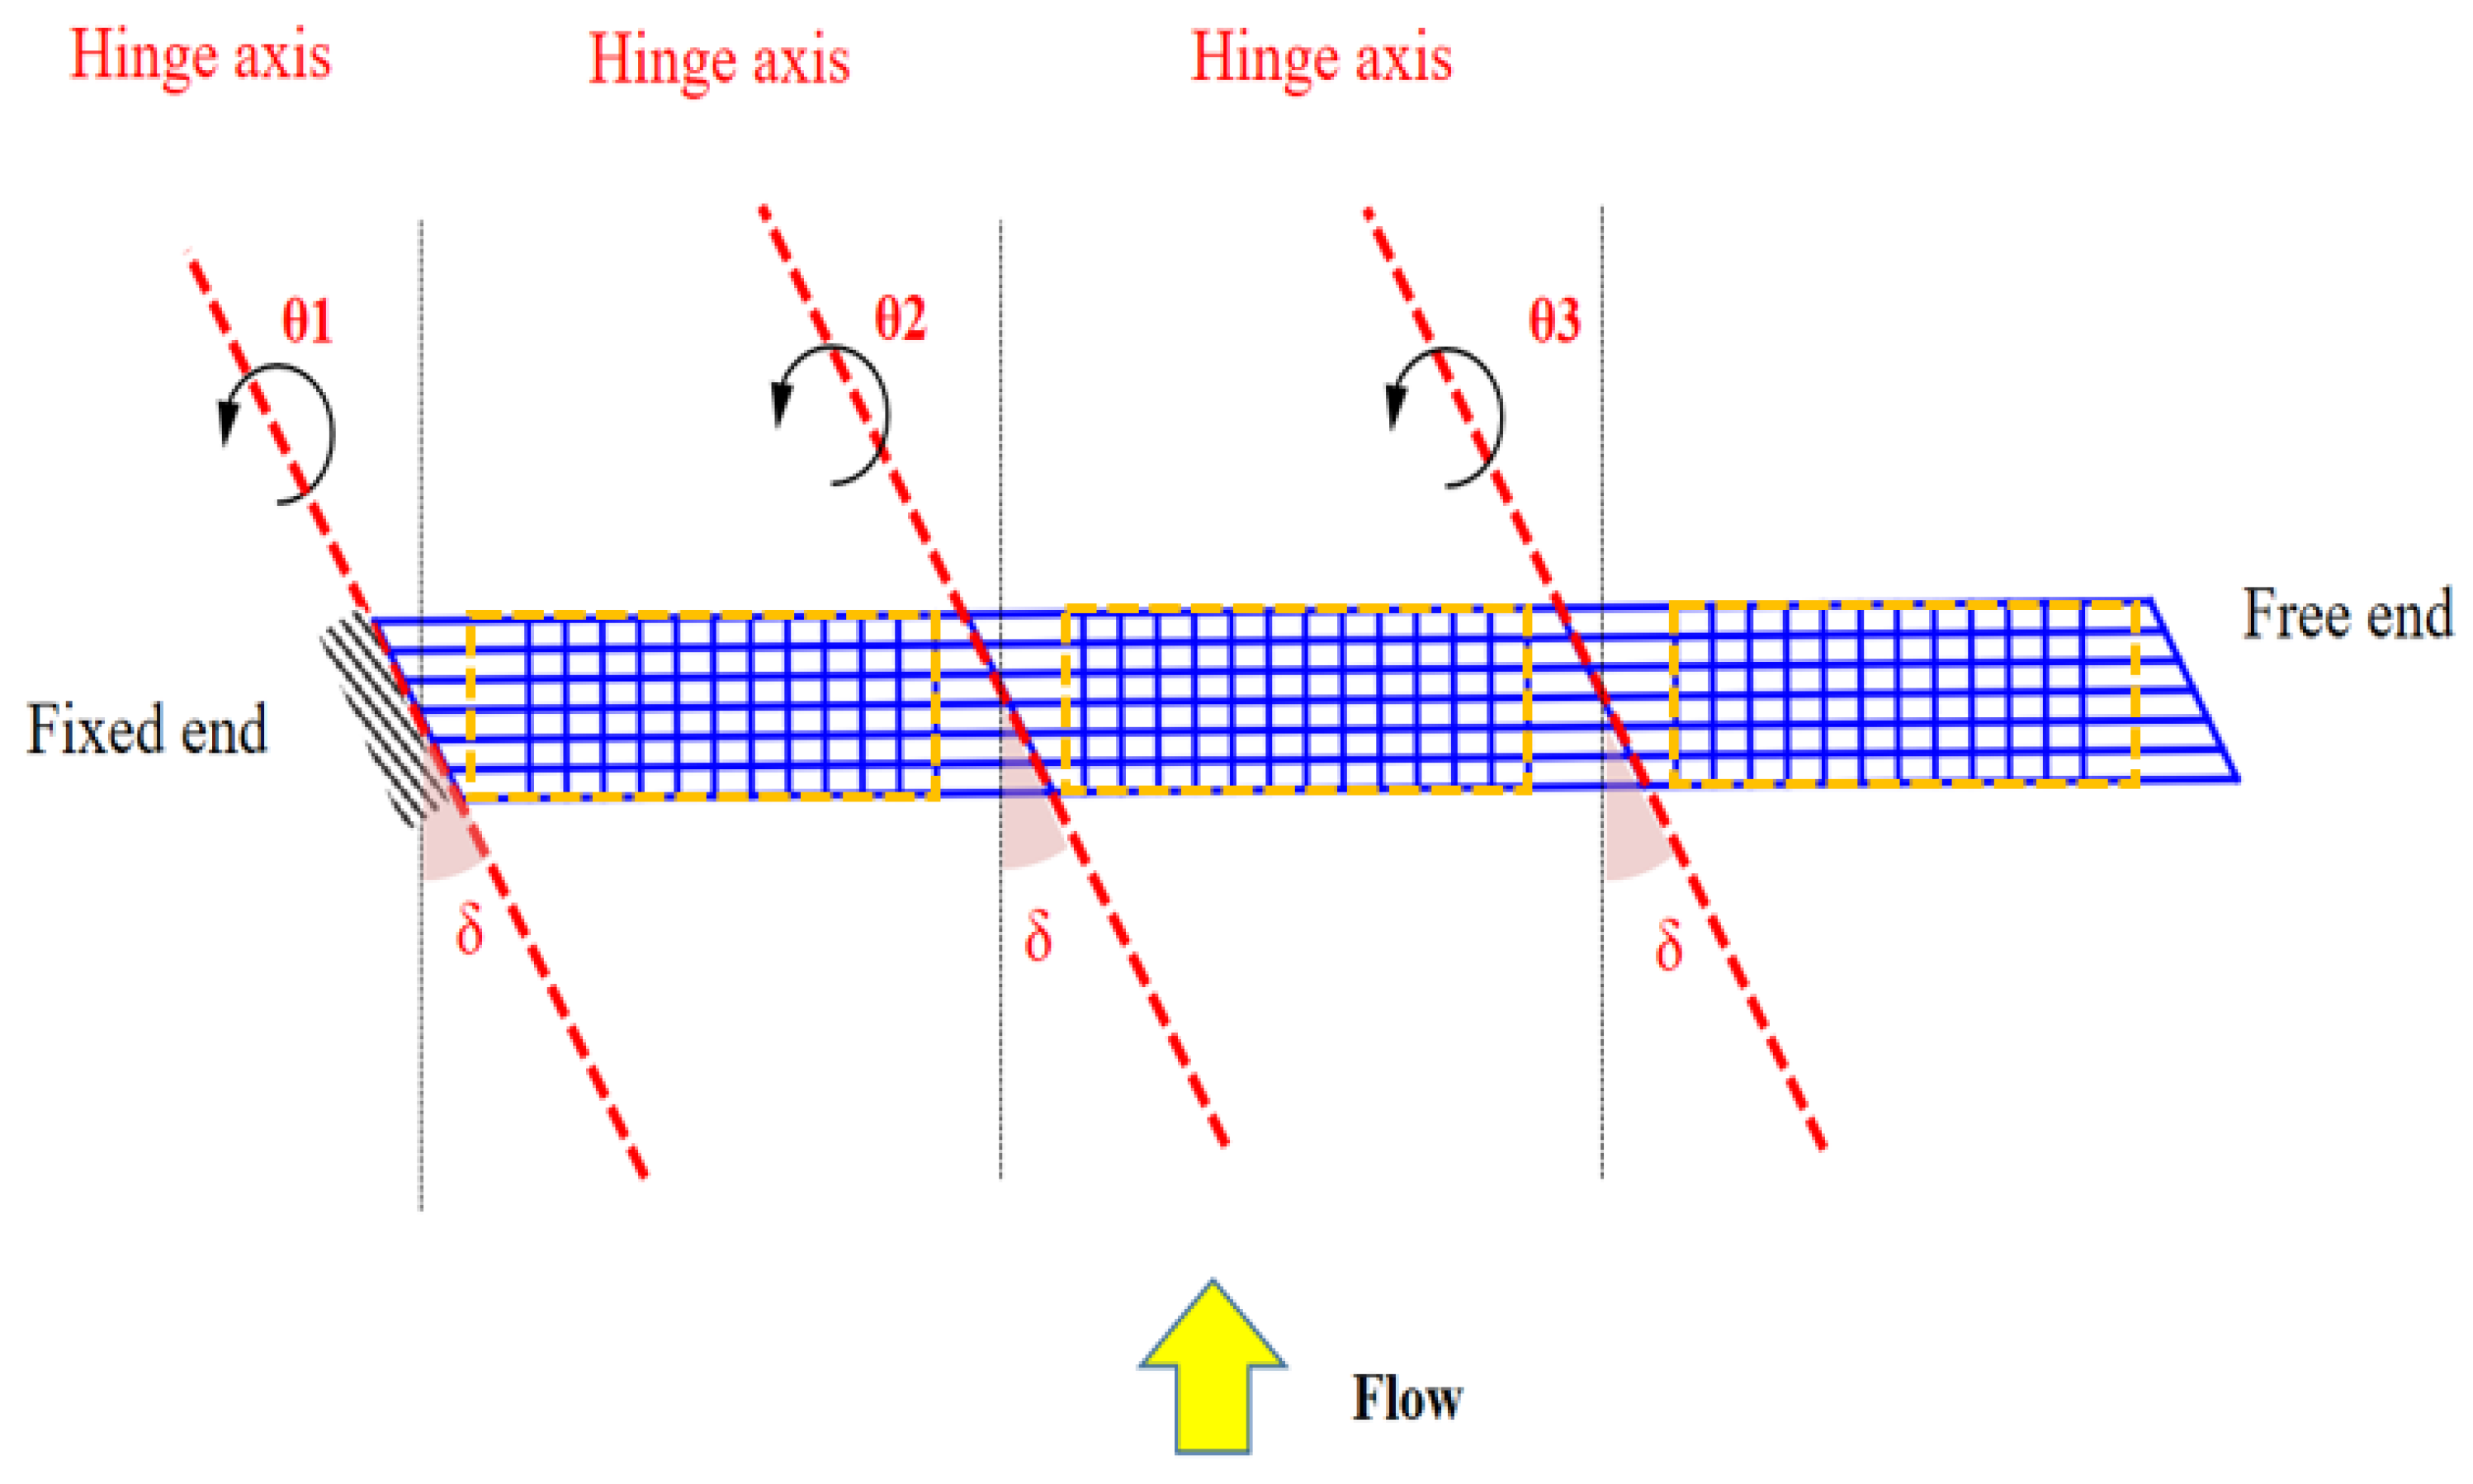
Understanding and suppressing unwanted hinge oscillation will be critical for stable flight, and incorporating efficient aerodynamical designs to achieve this without or with minimal active mechanical control will be ideal. It is known from previous research, as will be introduced in the following, that tilting the freely rotating hinge axis to the flow direction allows the angle of attack (AoA) of the rotated airfoil to change in the direction to alleviate the rotation and aid in passively achieving stability aerodynamically without the need for mechanical springs or damping elements, as shown in Figure 2.
Tilting the hinge axis has long been employed in rotor blade and hub connections in helicopters, particularly in tail rotors, using what is referred to as “delta three ( δ 3 ) hinge” [15]. Lots of research has been conducted on understanding and analyzing the flapping motion of the helicopter rotors, utilizing methods such as blade element theory (BET) [16,17] and commercial software such as VehicleSim (Version 1.0) [18] and CAMRAD II [19], and the tilted hinge has been proven to be effective. However, these research and analysis methods are intended for use in rotary blades and not wings for a fixed-wing airplane.
The utilization of tilted flapping-hinge axes, traditionally associated with rotary blades, has been explored in several studies for applications extending to fixed-wing systems. Fujita et al. in 2016 [20,21] investigated the utilization of tilted-hinge axes designs on folded wings near the wing root to facilitate the deployment of Mars exploration aircrafts from the Martian atmosphere entry capsule. However, the tilted hinges here were not designed for free rotation and incorporated deployment springs, which subsequently locked into positions once fully deployed.
The utilization of freely rotating or low-stiffness tilted hinges for fixed-wing aircrafts has been researched recently for wing tips, as in the following. In 2004, Pitt at Boeing examined the impact of tilted (referred to as “swept” or “flared” in subsequent research) hinges situated at the mid-span of a tapered wing on a flutter [22]. In recent years, a series of studies were conducted by Wilson et al. on Airbus, focusing on hinged wingtips. These studies involved flight tests with the Albatross One aircraft [23]. In 2016 [24], the concept of a freely rotating hinge was investigated using the doublet lattice method (DLM) with aerial force calculations and finite element analysis (FEM) for structural assessments. The findings indicated that using free-rotating or zero-stiffness hinged wingtips reduced the wing loads when subjected to disturbances. In a 2018 study [11], numerical calculations were performed for hinge angles of 0°, 6°, 15°, and 22°. Aerodynamic forces were computed based on the strip theory and Theodorsen’s theory, revealing the occurrence of limit cycle oscillations (LCO). Balatti et al. [25] conducted wind tunnel experiments to examine the gust responses under various mass settings and hinge stiffness conditions. Here, numerical calculations were performed by employing the DLM for aerial force predictions and a beam-based assumption for structural considerations.
The studies above showed promising load alleviation results and calculation methods for the utilization of freely rotating tilted hinges for the case of wing tips. However, these previous studies have not provided comprehensive analysis, experimental methods, or results for understanding the characteristics and performance of designs that involve chaining multiple entire wing sections together, beyond just a single wing tip section.
Recent studies on the use of free hinges to join multiple fixed wings are limited, but an example of this concept can be observed in the flying model known as the “Flex-Plane X-9”, which is a hobby RC plane constructed by Clair and can be accessed online [26]. The aircraft featured in the video incorporates a tilted-hinge axis [27]. However, detailed studies on the hinge dimensions and oscillations were not conducted in this example.
The authors had previously conducted preliminary numerical research on the aerodynamic aspects of the chained airplane wings, focusing mainly on hinge oscillation during stable flight due to hinge dimensions and attitude, as in the following. In order to achieve maximum results and general characteristic trends for this type of aircraft, the vortex lattice method (VLM) was chosen for its ability to be much faster than a full CFD analysis, especially for deformation-related cases [28]. Initially VLM was combined with thin membrane equations to assess the behavior of multiple-chained wings [8,29], confirming limit cycle oscillations and examining basic hinge angle effects. Subsequently, further investigations into additional parameters and chained-wing configurations were conducted [30], utilizing the equations of motion for multi-link rigid pendulums in order to achieve faster calculation time while focusing mainly on the characteristics unique to freely rotating hinge connection. Nevertheless, all previous studies by the author remained in their preliminary stages, employing coarse grids for VLM calculations, approximations prioritizing computational speed over accuracy, and lacking quantitative experimental validations. Consequently, in this research endeavor, the author delved more comprehensively and accurately into the characteristics of chained wings by employing improved numerical methods and validation through experimentation.
Due to the presence of freely rotatable hinges throughout the structure of chained airplanes, oscillations around these joints are inevitable to some degree during flight. Gaining insight into the characteristics and developing the capability to simulate these oscillations are paramount for effective design, particularly when aiming to attain a high level of passive stability while minimizing the need for active control to mitigate undesired hinge movements in flight. This study focuses primarily on the following key topics:
  • The possibility of attaining passive attitude resilience, namely oscillation stability around the hinge joints, with three or more wings chained.
  • Investigation of the effects of the angle of attack (AoA) and chained-hinge axis angle (δ) on the passive oscillation stability around multiple chained wings in wind flow and the assessment of these values.
  • Feasibility of increased lift to drag (L/D or C L / C D ) with multiple wings chained via freely rotating hinges.
To examine the aforementioned aspects, in this study:
  • The authors designed a novel general calculation model for the aerial force and performed a body movement analysis of a chained wing with a sufficient balance between accuracy and calculation cost, while accounting for the relative aerodynamic effect and the hinge axis angle of each wing section using robust analytical derivations and a numerical aerodynamic calculation method, for a high number of chained wings.
  • The authors compared and validated the calculation model utilizing small-scale wind tunnel tests.
Numerical calculations were conducted by coupling the vortex lattice method with an equation of motion for a multi-link rigid pendulum [13,31]. Experiments were conducted using a small-scale low-speed wind tunnel with a wind flow cross-section of 60 cm × 60 cm and a maximum wind speed of 5 m/s.

2. Mathematical Modeling of Chained Aircraft

2.1. Equation of Motion for a Multi-Link Rigid Pendulum

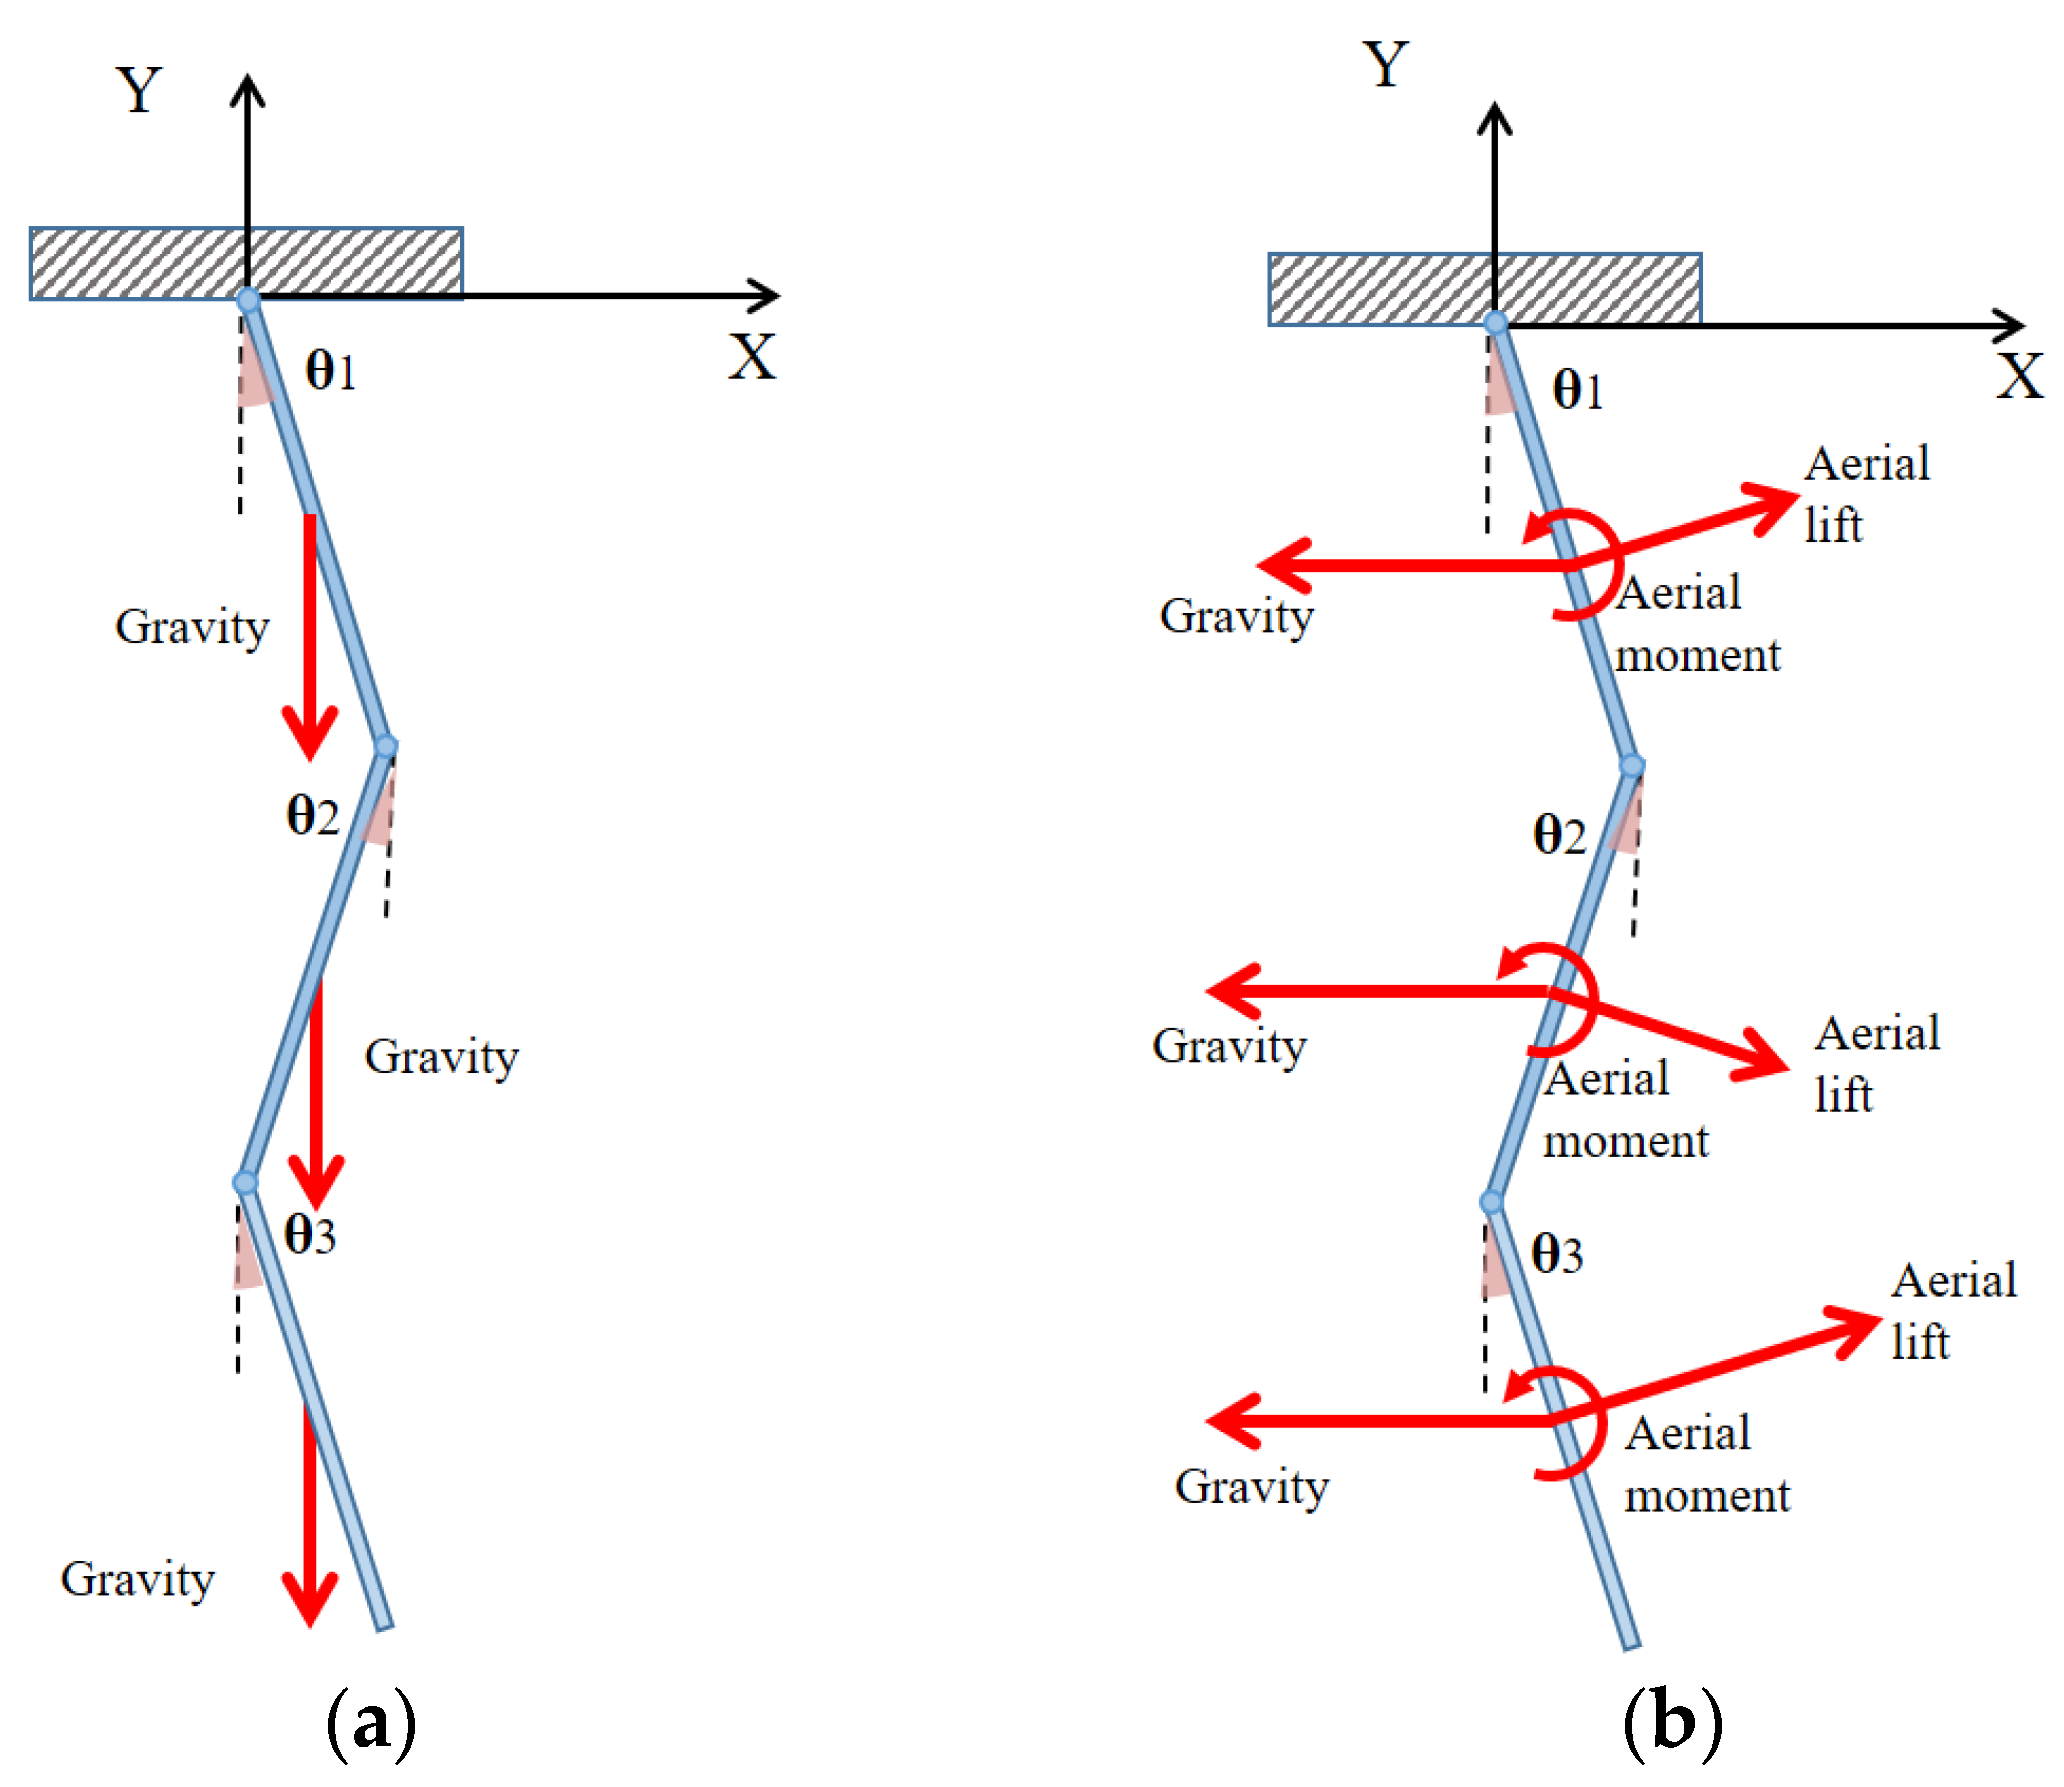
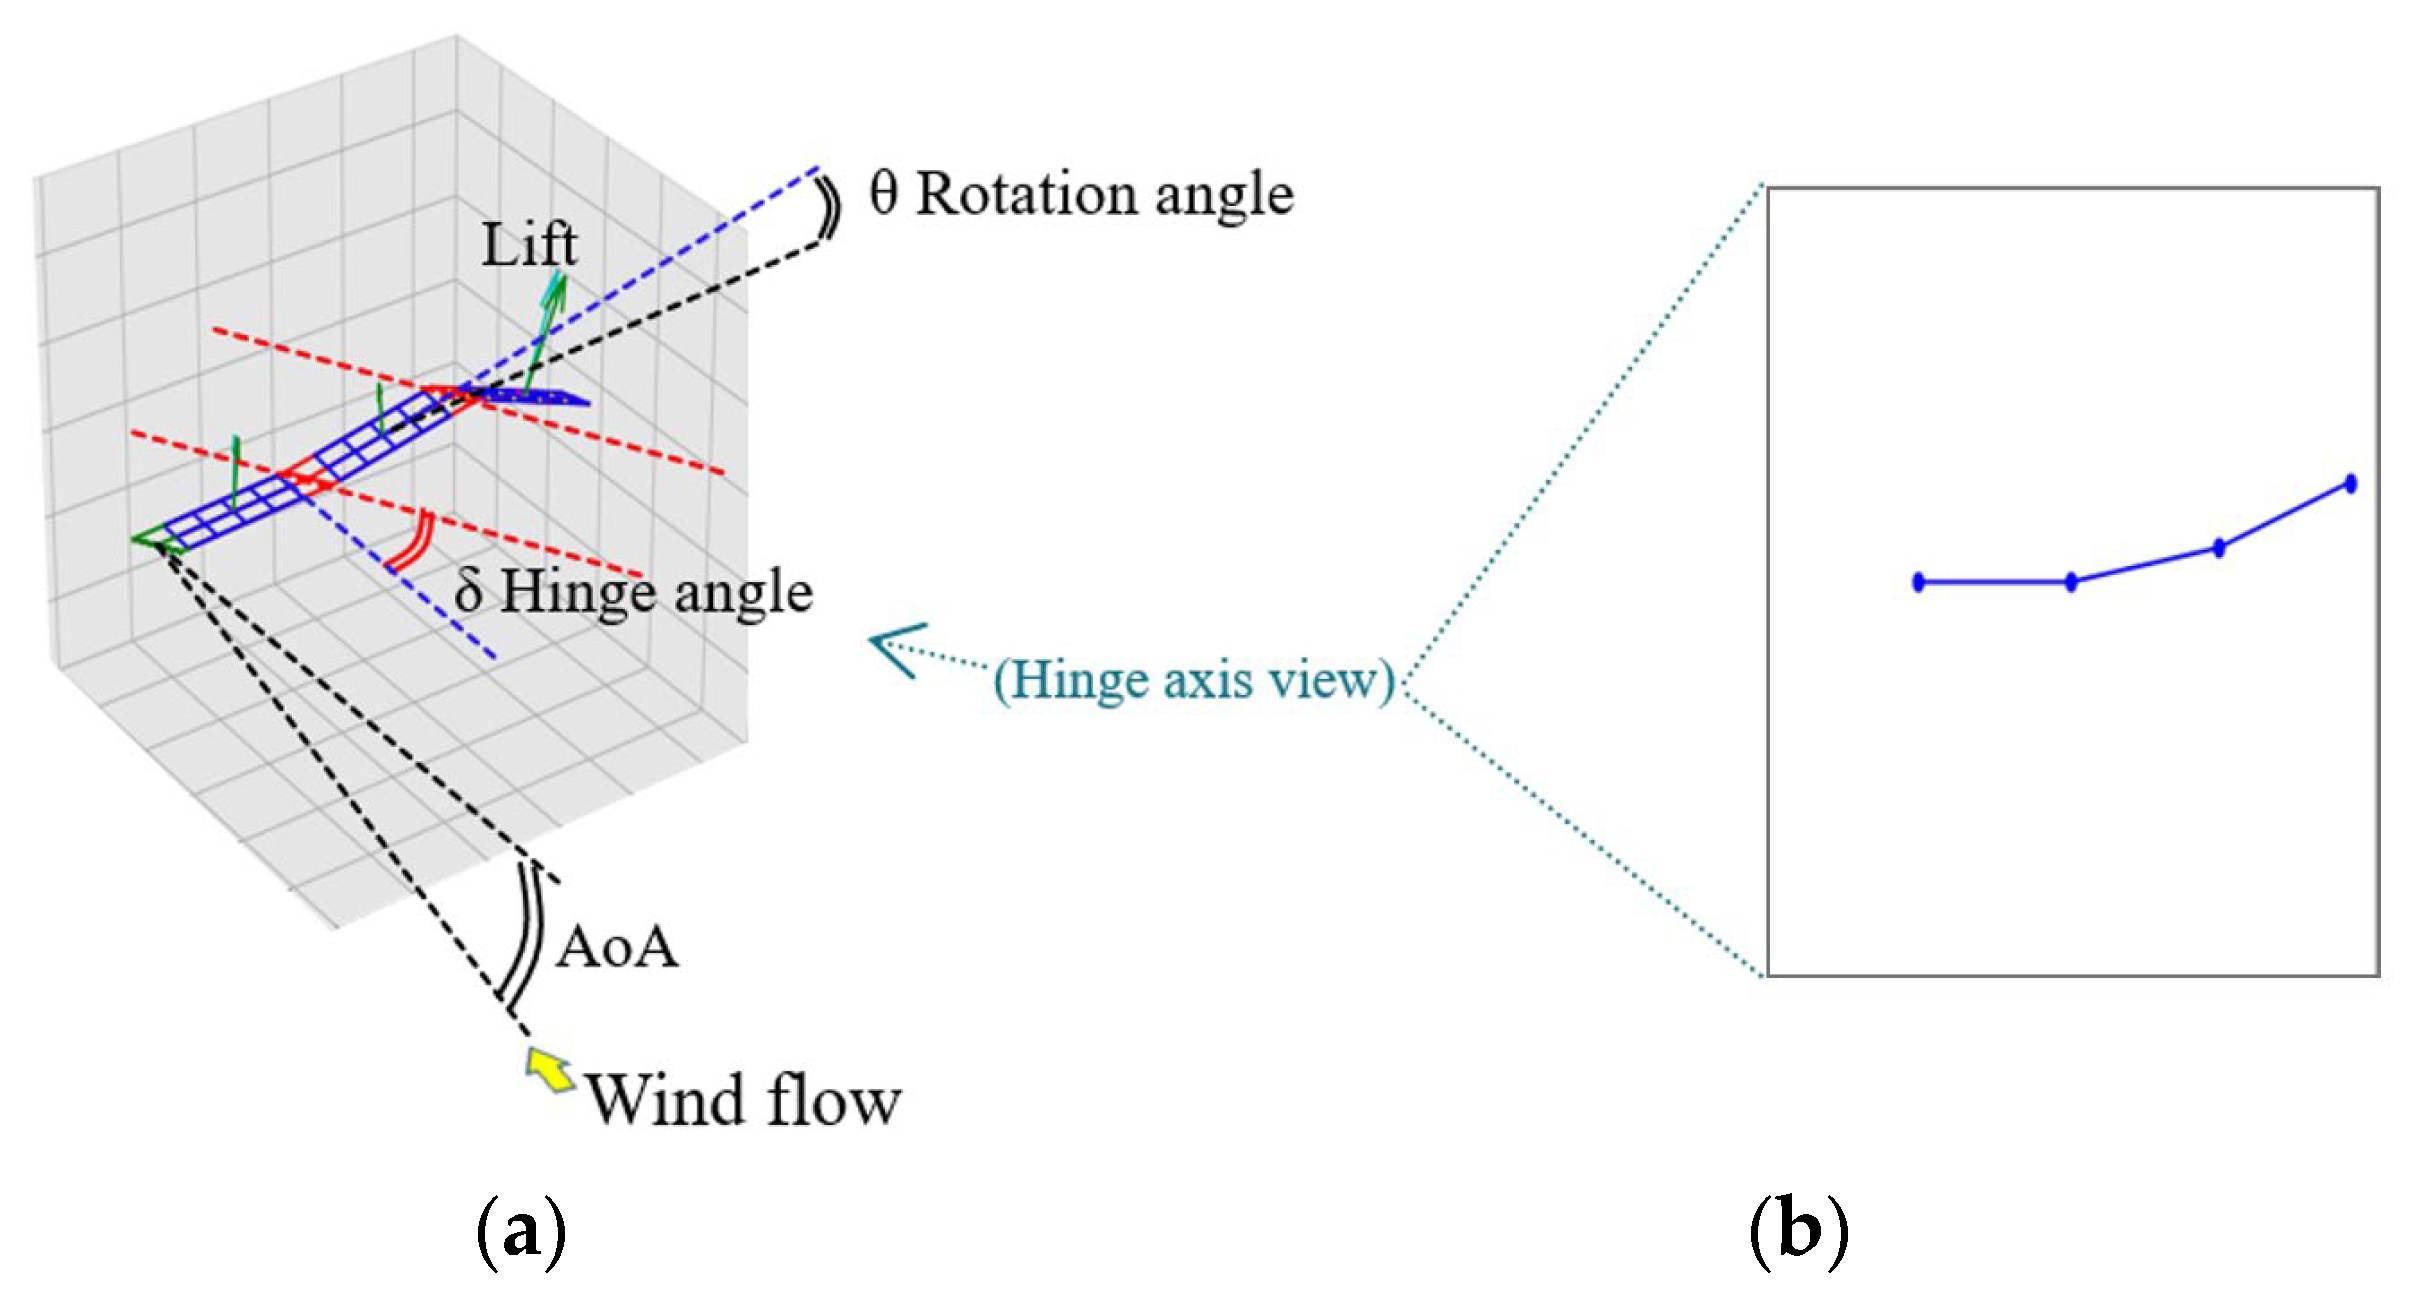
The wing, which consists of rectangular plates connected through wing-tip hinge joints, can be considered as a modified version of a multi-link rigid pendulum when viewed from an angle parallel to the hinge axis. This resemblance is particularly noticeable in wind tunnel conditions, where one edge remains free while the other is fixed, as depicted in Figure 3a,b, Figure 4 and Figure 5. Notably, when the hinge rotates in the direction leading to positive lift or opposite to the gravitational force, this motion is regarded as an increase in the positive θ direction.
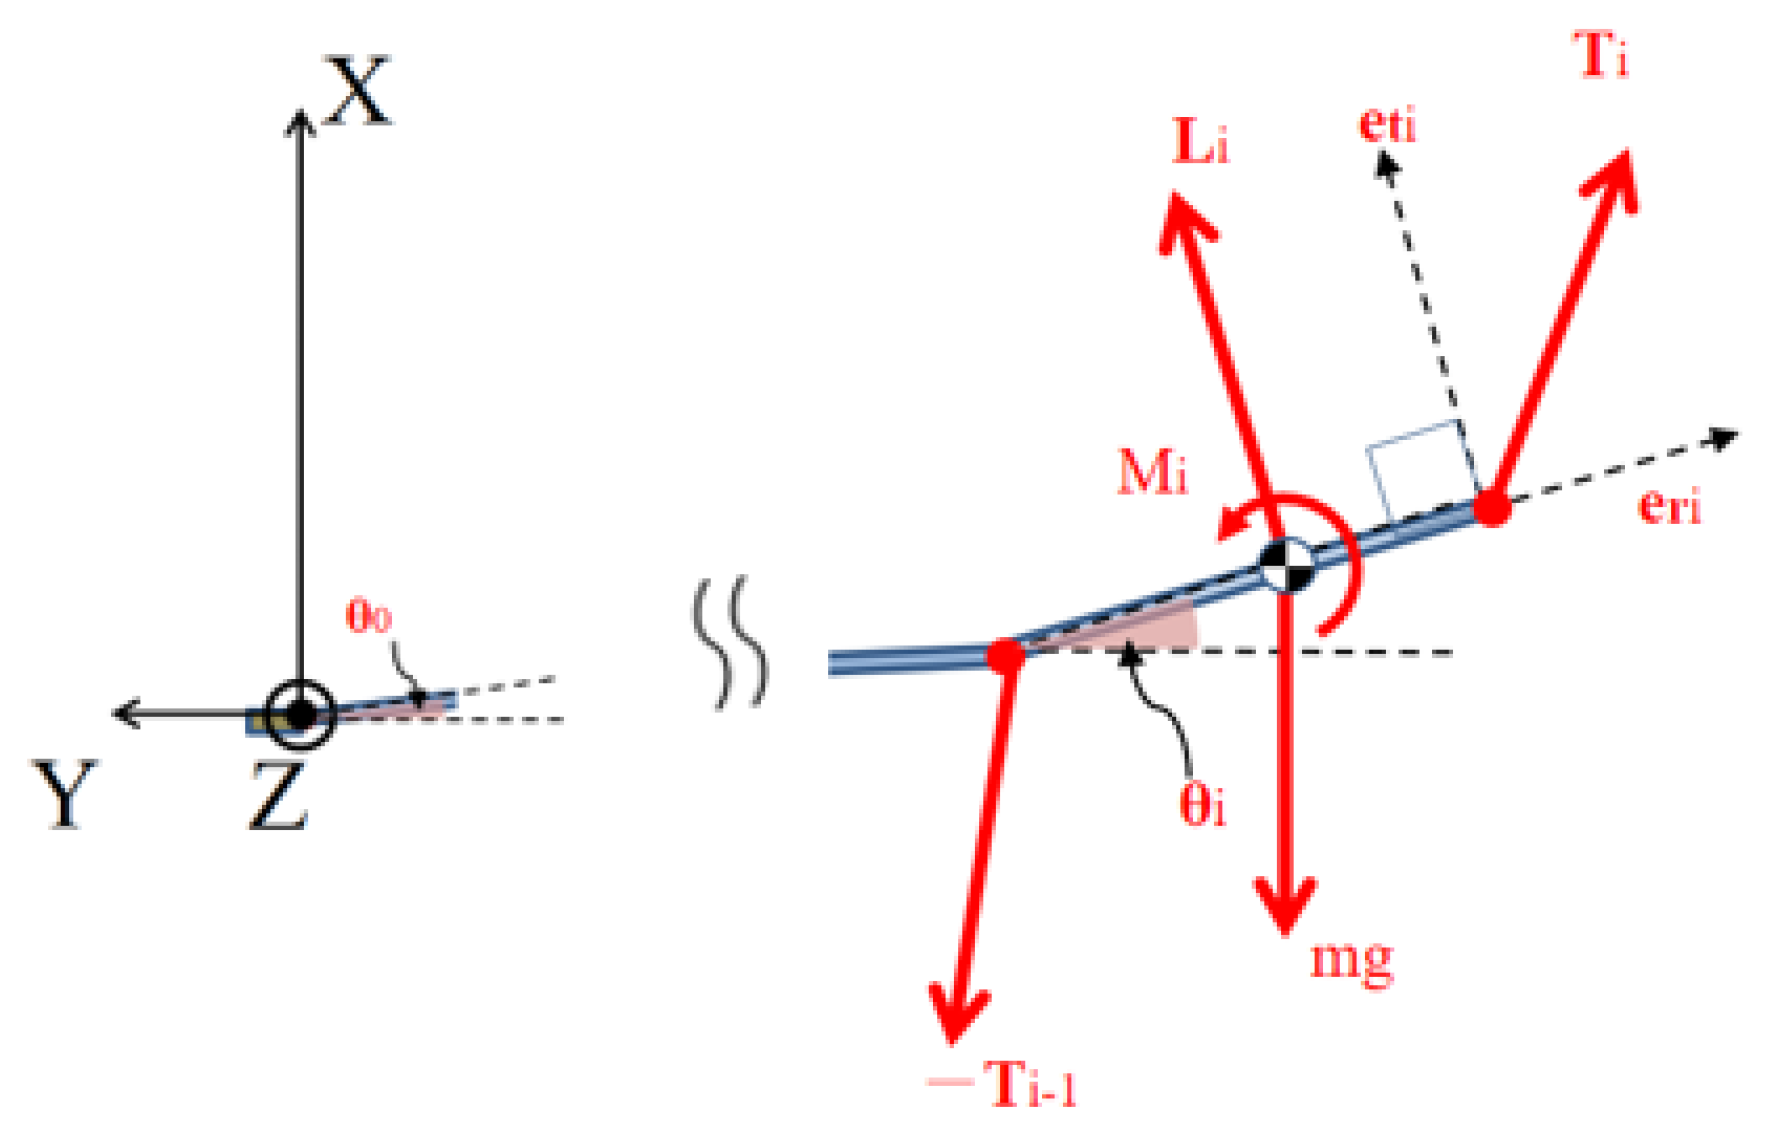
In this context, the equations of motion are typically described using the Lagrangian formalism of a standard multi-link rigid pendulum. However, when there is a need to incorporate additional forces such as the lift force and moment, the Newtonian formalism is more convenient. The Newtonian formulation for a traditional multi-link rigid pendulum with n rigid beams is expressed by Equation (1) for the translation, Equation (2) for the rotational equation of the method for a singular section, and Equation (3) to obtain the final equation described by Takeno [31]. Here, g ,   m j ,   l j , and I j , represent the gravitational acceleration mass, length, and moment of inertia, respectively, around the center point in the rotation plane perpendicular to the hinge axis. r j represents the coordinates of the center of mass of each joint beam, that is, the wing section. T j represents the translational force from the adjoining beam, and e t represents the unit vector perpendicular to the beam.
m j r j ¨ = T j T j 1 m j g   · 0 1
I j θ j ¨ = l j 2 T j + T j 1 · e t θ j
By transforming the aforementioned equations, we obtain Equation (3):
k = 1 n b j k l j 6 δ j k l k θ k ¨ cos θ j θ k + θ k ˙ 2 sin θ j θ k + b i g s i n θ j = 0
where
b j = l j 2 + i = j + 1 n l i j k = m a x j , k , δ j k = 0 j k 1 j = k , e t θ j = cos θ j sin θ j
Equations (1) and (2) can be modified into Equations (5) and (6), as explained in [13]. Note that the aerial force and moment for each section working on the center point of each beam (or wings) derived later are also added as L j and M j , respectively, which is the key difference.
m j r j ¨ = T j T j 1 m j g · 1 0 + L j ,
I j θ j ¨ = l j 2 T j + T j 1 · e t θ j + M j .
By transforming these equations and adding the term ζ , which represents the structural damping coefficient, Equation (7) can be obtained as
k = 1 n b j k l j 6 δ j k l k θ k ¨ cos θ j θ k + θ k ˙ 2 sin θ j θ k + b j g c o s θ j 1 2 ρ ( L j + 2 i = j + 1 n L i ) e t θ j M j ρ l j + ζ θ j ˙ = 0 ,
where m j = ρ l j is satisfied, and ρ is assumed to be the same for all the beams, namely the wing section. In this study, the damping coefficients for the models used in the validation experiment and calculations were determined in advance using a separate experiment, as explained in Section 3.2.
The basic derivations of Equation (7) are similar to those of the processes described in previous studies [13,31], and the outline is as follows:
The center position coordinates of each beam are written as in Equation (8)
r j = k = 1 n a j k e r ( θ j ) ,
where a j k represents a calculation consisting of l k in Equation (9). e r represents the unit vector parallel to the beam and e t represents the unit vector perpendicular to the beam.
a j k = l k   ( k < j ) l j 2   ( k = j ) 0   ( k > j ) , e r θ j = sin θ j cos θ j , e t θ j = cos θ j sin θ j .
From Equation (5), adding all the ( T j T j 1 ) from j = k + 1   to   j = n and using the fact that T n = 0 at the free edge, Equation (10) can be derived as follows:
T k = j = k + 1 n m j r j ¨ + g · 1 0 + j = k + 1 n L j 1 k n 1 .
Equation (10) can be transformed as Equation (11)
T j + T j 1 = d 2 d t 2 m j r j + 2 i = j + 1 n m i r i m j + 2 i = j + 1 n m i g · 1 0 + L j + 2 i = j + 1 n L i
The second term of Equation (11) can be rewritten as Equation (12).
m j + 2 i = j + 1 n m i = 2 ρ b j ,
and the first term of Equation (11) can be rewritten as Equation (13).
d 2 d t 2 m j r j + 2 i = j + 1 n m i r i = d 2 d t 2 k = 1 n c j k e r θ k ,
where c j k is a coefficient shown in Equation (14)
c j k = 2 ρ b j l k   ( k < j ) 2 ρ b j l j 4 l j   ( k = j ) 2 ρ b k l k ( k > j ) .
As Equation (15) exists,
e r ¨ θ k = d d t e r θ k θ k ˙ = e r θ k θ k ˙ 2 + e t ( θ k ) θ k ¨ .
From Equations (11)–(13) and (15), the moment of equation for rotation in Equation (6) can be rewritten as Equation (16):
I j θ j ¨ l j = m j l j 12 θ j ¨ = ρ k = 1 n b j k l j 4 δ j k l k θ k ˙ 2 sin θ j θ k + θ k ¨ cos θ j θ k ρ b j g c o s θ j + 1 2 L j + 2 i = j + 1 n L i e t θ j + M j l j ,
The transformation of Equation (16) and the addition of the term ζ θ j ˙ representing mechanical damping around the hinges, will lead to the main equation of Equation (7) introduced prior.

2.2. Vortex Lattice Method

In all the referenced studies in the prior section and for most studies on aeroelasticity and simulations including large movements, a full-scale computational fluid dynamics (CFD) analysis is often too time consuming and complex. Hence, other aerial force calculation methods, such as BET, DLM, VLM, or pre-acquired experimental results, are used. Although employing premeasured experimental results or precalculated data for individual joint sections can significantly reduce the computational time for wing motion analysis, different wing surfaces or shapes require prior wind tunnel testing. In addition, by accounting for the effect of varying relative wind flows at different points within individual wing sections, the motion and aerodynamic interactions between these sections can be challenging. Blade element theory (or strip stream theory) and blade element momentum theory [15] offer the advantage of faster calculations compared to full CFD analysis. However, they do not calculate interactions between different elements or sections on the airfoil [15]. In contrast, the DLM and VLM address these interactions while remaining substancially faster than a full CFD analysis for some cases [28]. Although the VLM requires supplementary modeling of drag forces, it is a simpler method and can be 10-times faster in order of magnitude compared to DLM [32]. Consequently, the VLM was selected as the preferred approach in this study to achieve the fastest calculation speed while still accounting for interactions between different nodes or grids. The VLM is a widely adopted technique for calculating aerial forces on various wings and aircraft, excelling at calculating aerodynamic forces under laminar conditions before major stalling on the wing surfaces. For a flat plate, it is known that the C L linearly increases with the AoA to approximately 7°–10°, depending on the aspect ratio and Re number [33].
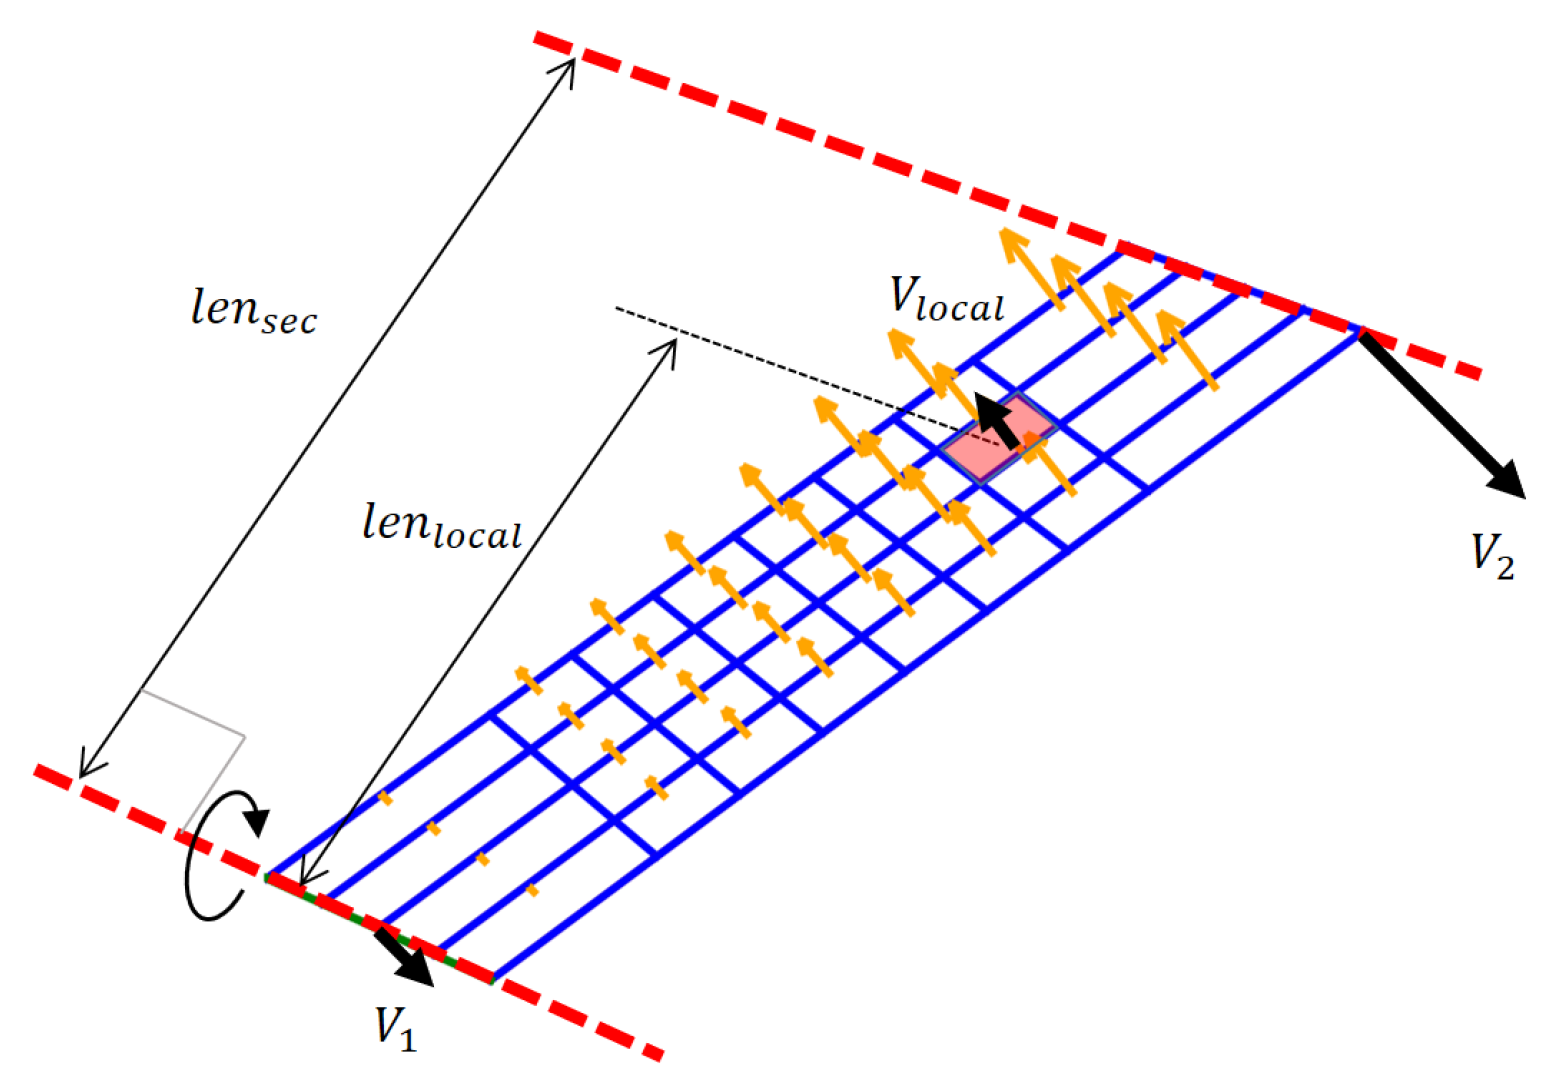
The VLM divides surfaces experiencing aerodynamic forces into several panels and assigns a horseshoe vortex with an unknown vortex strength Γ to each panel. The panel layout is shown with blue grids in Figure 6.
The orange dotted line represents the main wing of a single aircraft, which is simplified as an ideal flat rectangular wing with the outer sections of the hinge part. The red dotted line in this section is the hinge axis angled at the hinge angle δ to the main flow angle (when AoA = 0°). When aerodynamical and gravitational forces are applied, the wing accordingly rotates around the hinge axis by the rotation angle θ. The calculation assumes that the wing is also a symmetrical flat foil and neglects the thickness and effect of the boundary layer or viscosity. By assuming that the sum of the flow speeds induced by all other panels onto a particular panel is zero in the direction perpendicular to the panel surface, the vortex strength of all panels can be solved implicitly. The total velocity V j induced in panel (j) by the vortices of the other panels can be derived using Equation (17) [1,34], where C vlm ij stands for the sum of the coefficients on the vortex density Γ i of the horseshoe vortex to achieve this equation.
V j = 1 4 π i = 1 n C vlm ij Γ i .
The velocity perpendicular to the surface of the panel (j) can be derived using a unit vector perpendicular to the surface n j by Equation (18).
V j · n j .
Similarly, the component of the general wind flow velocity V that is perpendicular to panel (j) can be written as:
V · n j .
By accounting for the additional relative wind velocity perpendicular to panel (j), written as V l o c a l owing to the movement, the boundary condition on the panel surface where the surface normal velocity of each plane must be zero can be written as follows:
V j · n j V · n j V l o c a l · n j = 0 .
The V l o c a l was geometrically calculated for each panel, as shown in Figure 7, from the moving velocity of each axis ( V 1 and V 2 ) using the equation for the moment of the modified pendulum, as discussed previously.
Figure 7. Geometrical calculation for relative local velocity on each panel.
Aerospace 11 00053 g007
V l o c a l = l e n l o c a l V 2 + ( l e n s e c l e n l o c a l ) V 1 l e n s e c .
Thus,
1 4 π i = 1 n C vlm ij · n j Γ i = V · n j + V l o c a l · n j .
By solving Γ i using the total n numbers of the equation above for each plane (j), the vortex strength Γ i can be derived for each plane (j). Finally, using the Kutta–Joukowski theorem, the total lift is calculated as follows:
L = 2 ρ i = 1 n Γ i l i × ( V + V l o c a l )
where l i represents the section of the horseshoe vortex without trailing vortices in the flow, as shown in panel (j), and ρ represents the air density.
The induced drag can be derived similarly using the downwash W i , calculated by utilizing the induced velocity from the trailing vortices (induced velocity from the horseshoe vortices but without the l i section) as follows:
D i n d = 2 ρ i = 1 n Γ i l i × ( W i ) .
Nonetheless, regarding profile drag, the VLM does not offer a theoretical solution. Consequently, a coefficient with linear characteristics concerning the angle of attack was derived from the wind tunnel experiments, as discussed in Section 3.2.
After the total lift and moment from the aerial force for each chained-wing section were derived, the three-dimensional aerial force data were appropriately transformed to values under the pendulum coordinate system X p e n d , Y p e n d ,     and   Z p e n d . Subsequently, the Z p e n d directional force can be ignored, and the motion of the chained wings can be calculated using two-dimensional equations. The coordinate system of the pendulum should be defined such that one of its axes is aligned parallel to the hinge rotation axis, as illustrated in Figure 8.

2.3. Coupled Calculation Setup and Waviness

The coupling of the aerodynamical force calculated by VLM and the modified equation of motion for the multi-rigid pendulum was realized in an open-loop calculation. Firstly, forces acting on the center of mass of each rigid beam on the multi-link rigid pendulum were calculated by the VLM, and the translational aerial force and moment force were assigned into the variables L j and M j of Equation (7), which is then calculated via the 4th order Runge–Kutta method. This will give the movement and the next hinge coordinates, where the VLM will be conducted again to acquire the new aerial force for the next iteration. Note that the beams on the multi-link rigid pendulum are assumed as completely rigid for simplicity and rapid computation.
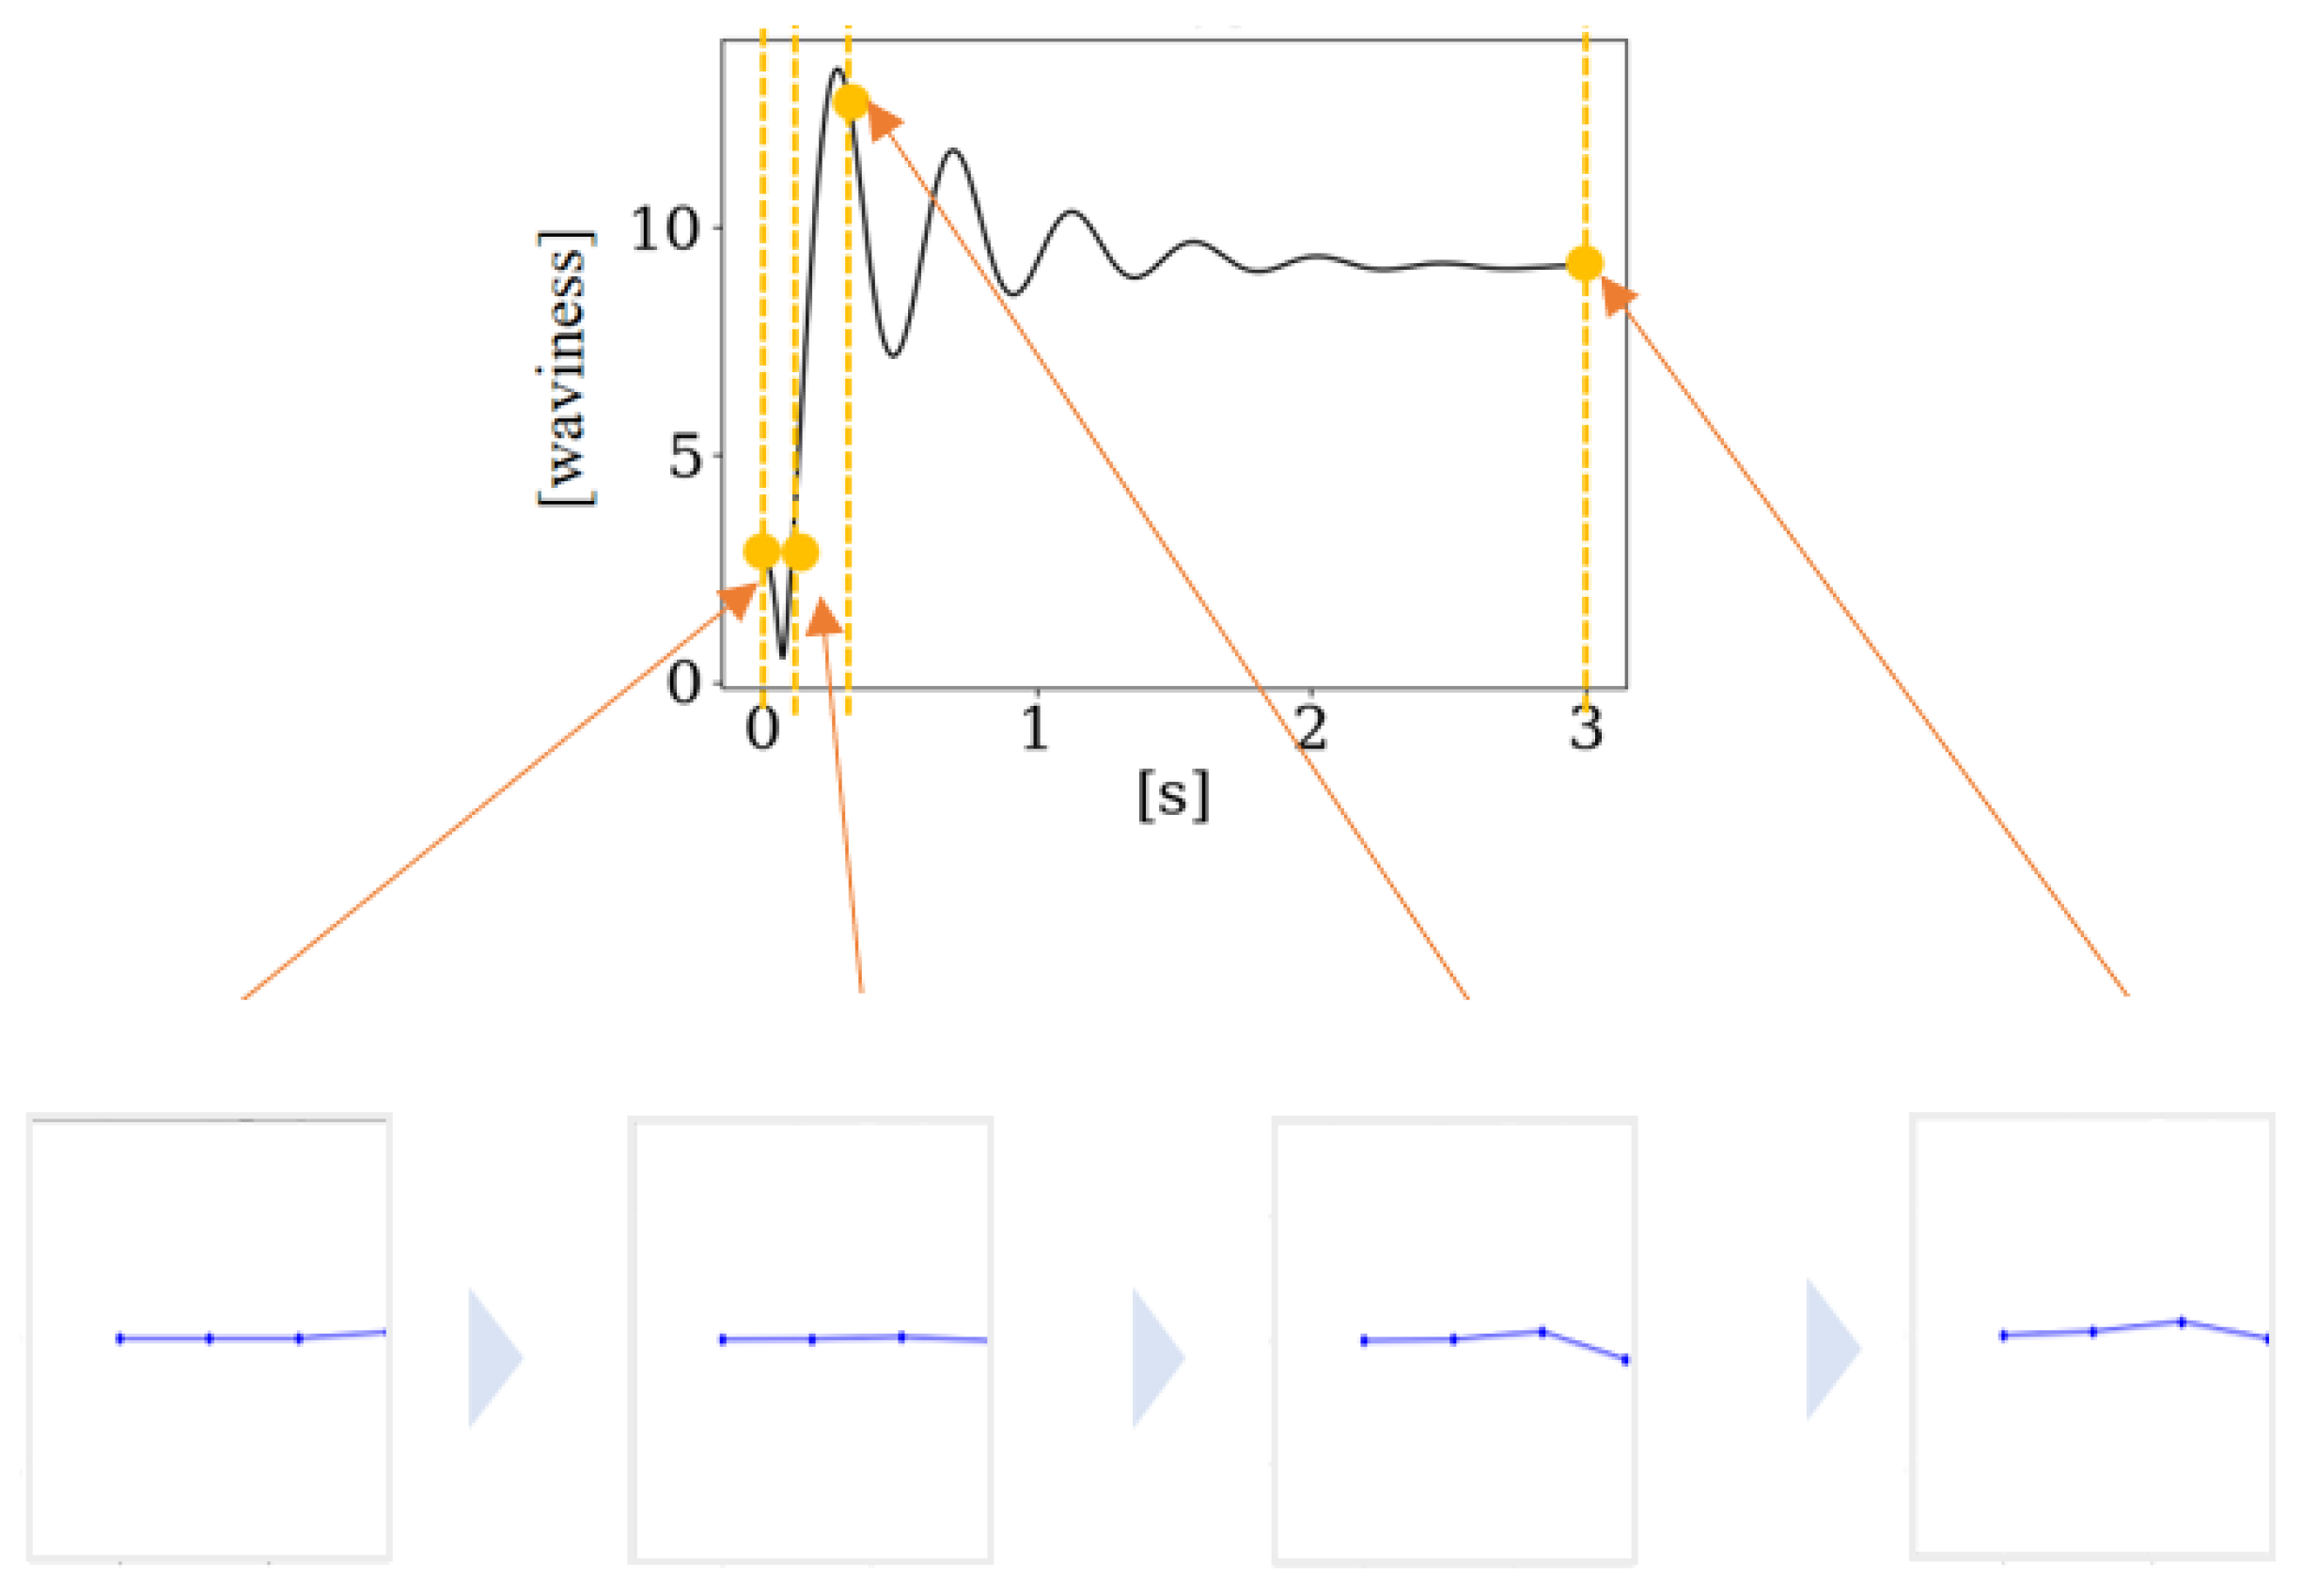
The numerical simulation was performed assuming a wind tunnel situation, where one edge of the chained airplanes was fixed and the other was free to move with the wind flow. Various conditions were tested in this study, all of which began in a stationary state with a certain initial hinge rotation angle of the joint wings. The time record of the hinge rotation angle θ k and the deviation from “full straight condition”, in other words, deviation from “all the rotation angles match θ k = 0 ( k = 1 n ) ”, was examined to determine the time-lapse of the overall oscillations around the hinges. The deviations were calculated using Equation (25) and defined as waviness = σ.
σ = 1 n i = 1 n ( θ j ) 2 .
Figure 9 presents a 3D overview of the calculation setup, while Figure 10 offers examples of the “waviness” history and snapshots of its view from the hinge axis.
The flow speed for each calculation was either fixed at a specific airspeed or adjusted to achieve a condition in which the lift calculated by the VLM equaled the gravitational force when the three small wings were connected, ensuring stability throughout each calculation scenario. Notably, as the lift calculated by VLM results in an uneven distribution along the wing span though the mass of each joint wing is uniform, the final stable state of the chained airplane after the oscillation has converged may not always be a perfectly “straight line”. This means that the θ k across the chained wings in its final stable attitude may not be the same, indicating that the final “waviness = σ” may not always be 0 or have a finite value. The oscillation was assumed to have converged and stability attained when the “waviness” σ became sufficiently stable.

2.4. Grid Convergence

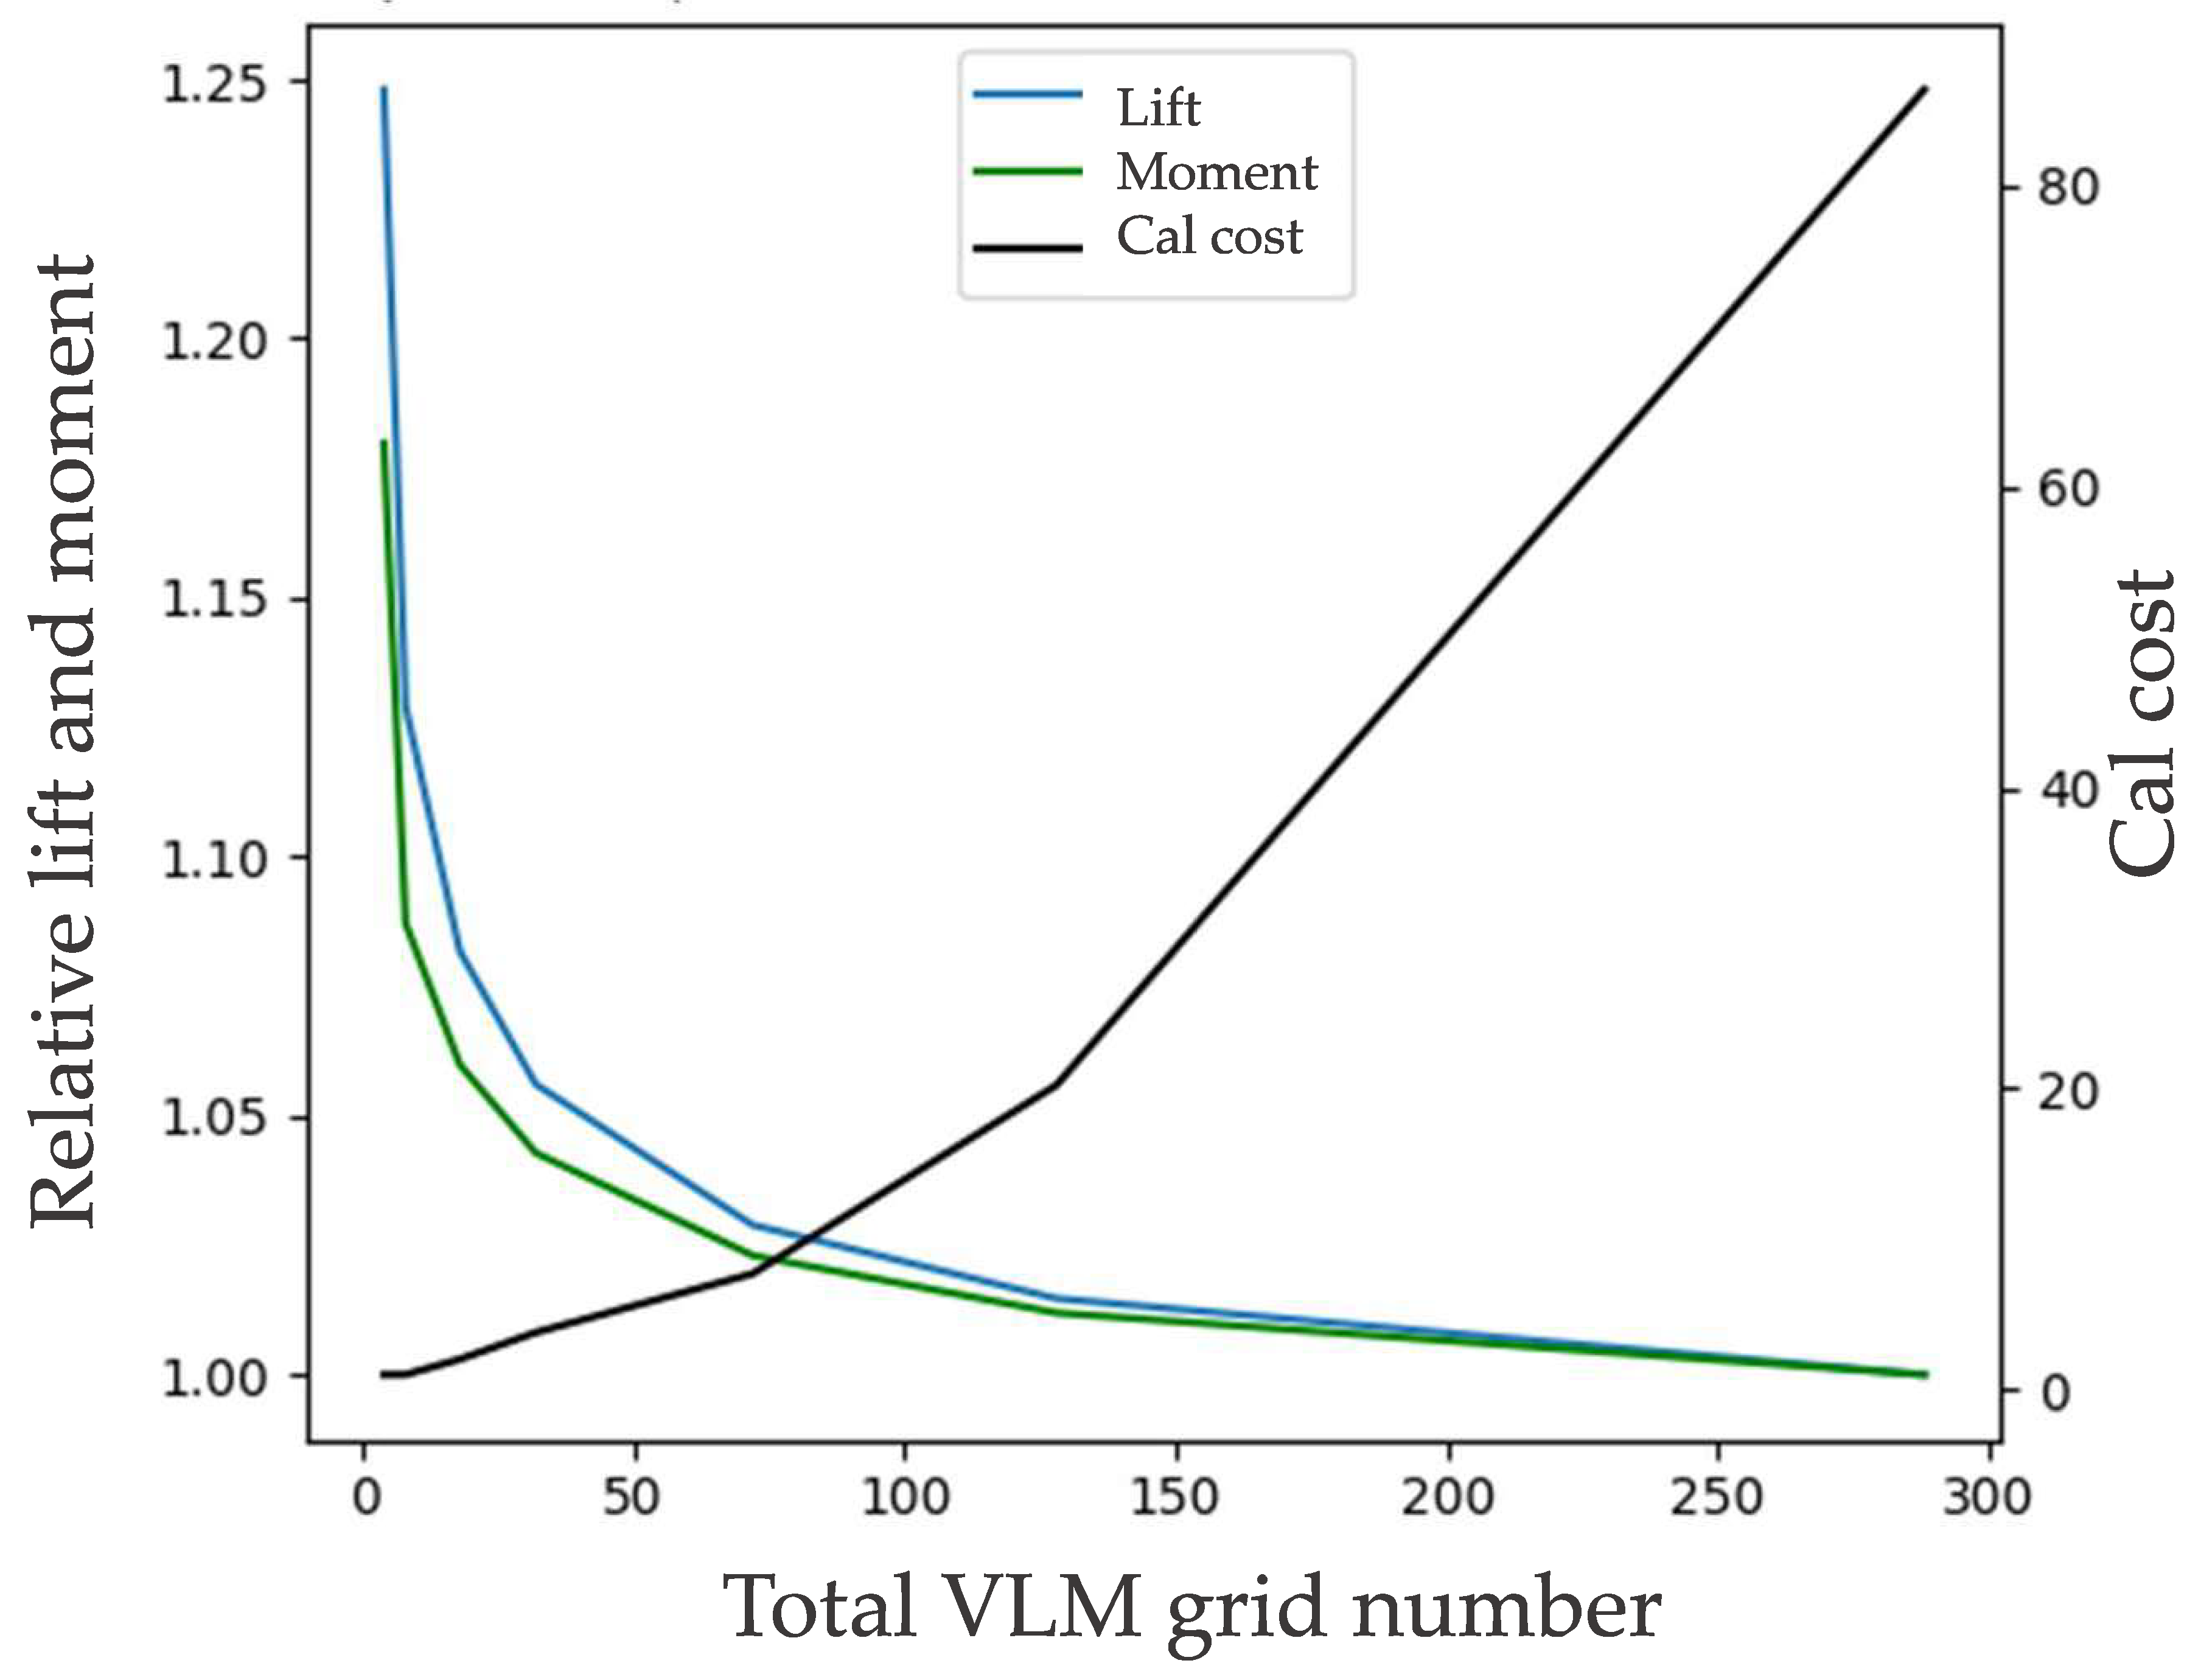
The convergence of the aerial lift and moment working on each wing were compared with different grid number settings for each chained wing section to determine the total number of grids used in the VLM. A sample calculation case, where the hinge angle was set to δ = 15° and rotation around the hinge set to θ = 5°, was analyzed. The general AoA was 5°, wind speed was 5 m/s, and span of the wing was set to 9 cm, corresponding to 3 cm. The tested grids were 2 × 2 (=4), 4 × 2 (=8), 6 × 3 (18), 8 × 4 (32), 12 × 6 (=72), 16 × 8 (108), and 24 × 12 (288) for the rectangular wing. Figure 11 shows the grid views for 4, 72, and 288 grids. Figure 12 shows the relative total lift force, aerial moment, and calculation cost for a single wing with different grid configurations, that is, total grid numbers. The time required for the VLM simulation without parallelization techniques and utilizing only a single core of a desktop computer using Python (Version 3.11) was calculated. For the aerial forces, the vertical axis represents the relative value, with the value at 288 grids normalized to 1. For the calculation cost, the vertical axis represents the total cost, with the value of 2 × 2 grids normalized to 1. As depicted in the graphs, the aerial values converged and the computational cost increased with the number of grid points per wing. In this study, the 72-grid (=12 × 6) configuration was chosen for the best balance of accuracy and calculation time based on the crossing point of the relative aerial force and calculation cost, as shown in Figure 12.

3. Experiments

3.1. Small-Scale Low-Speed Wind Tunnel

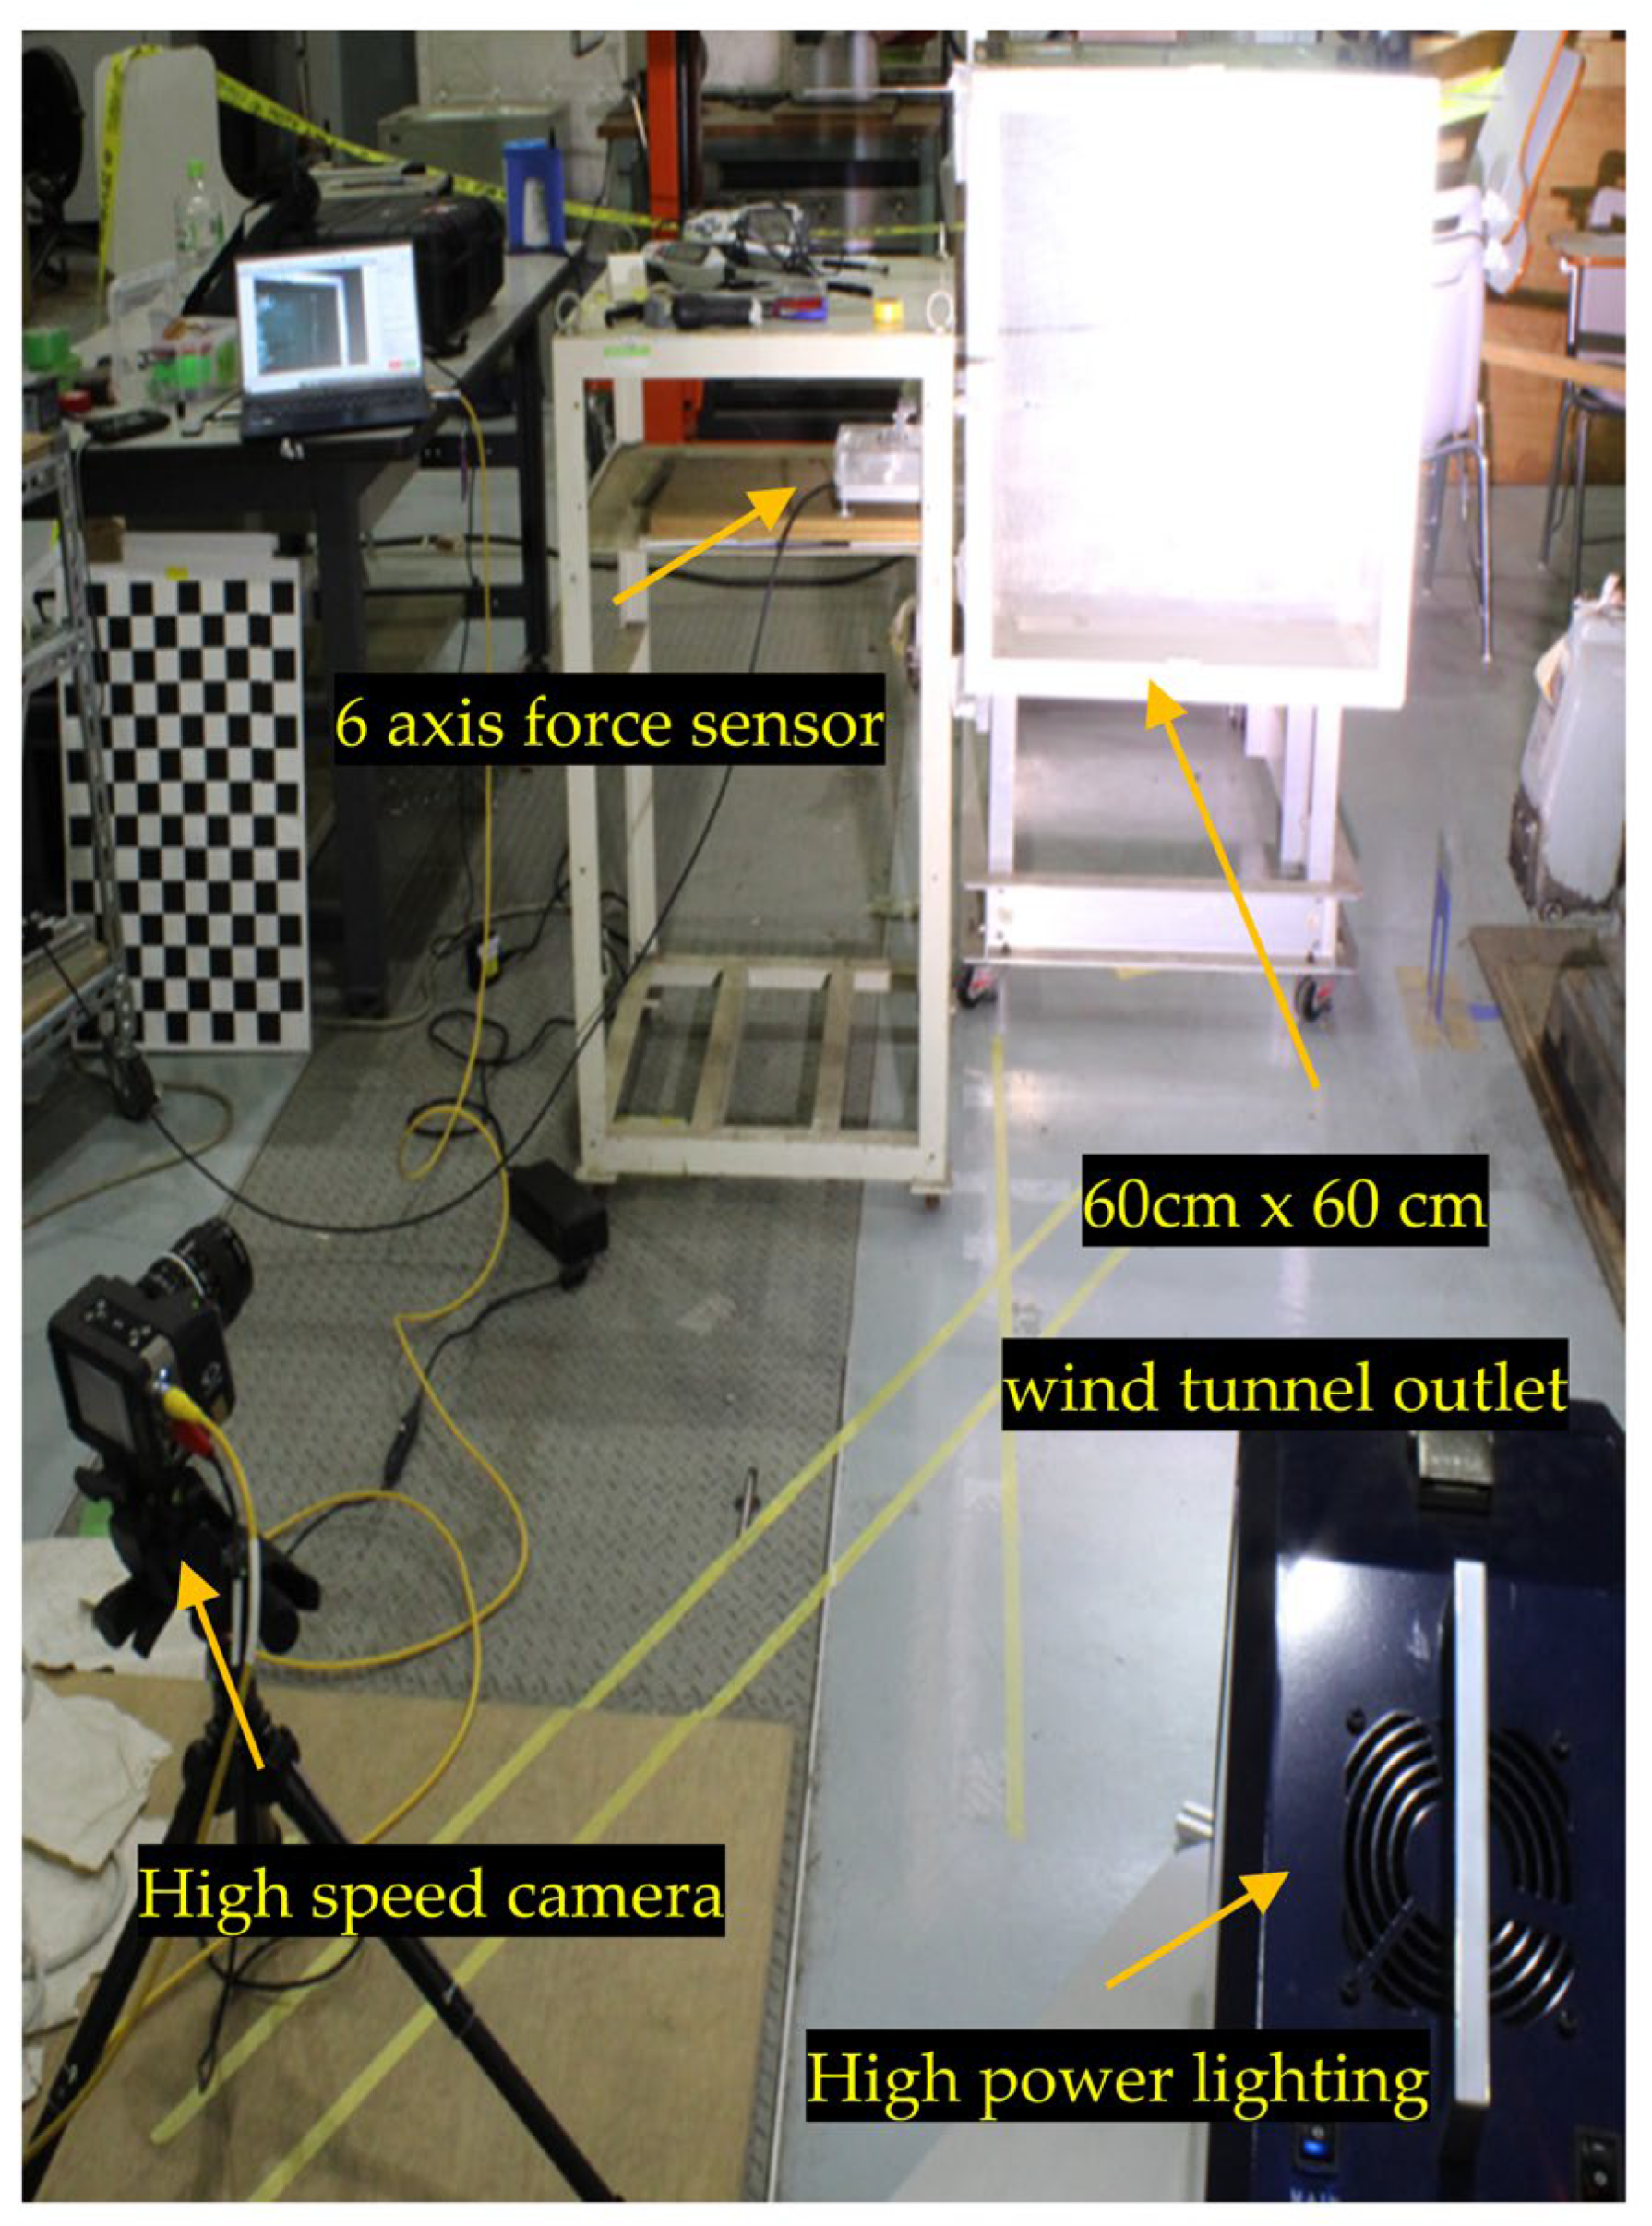
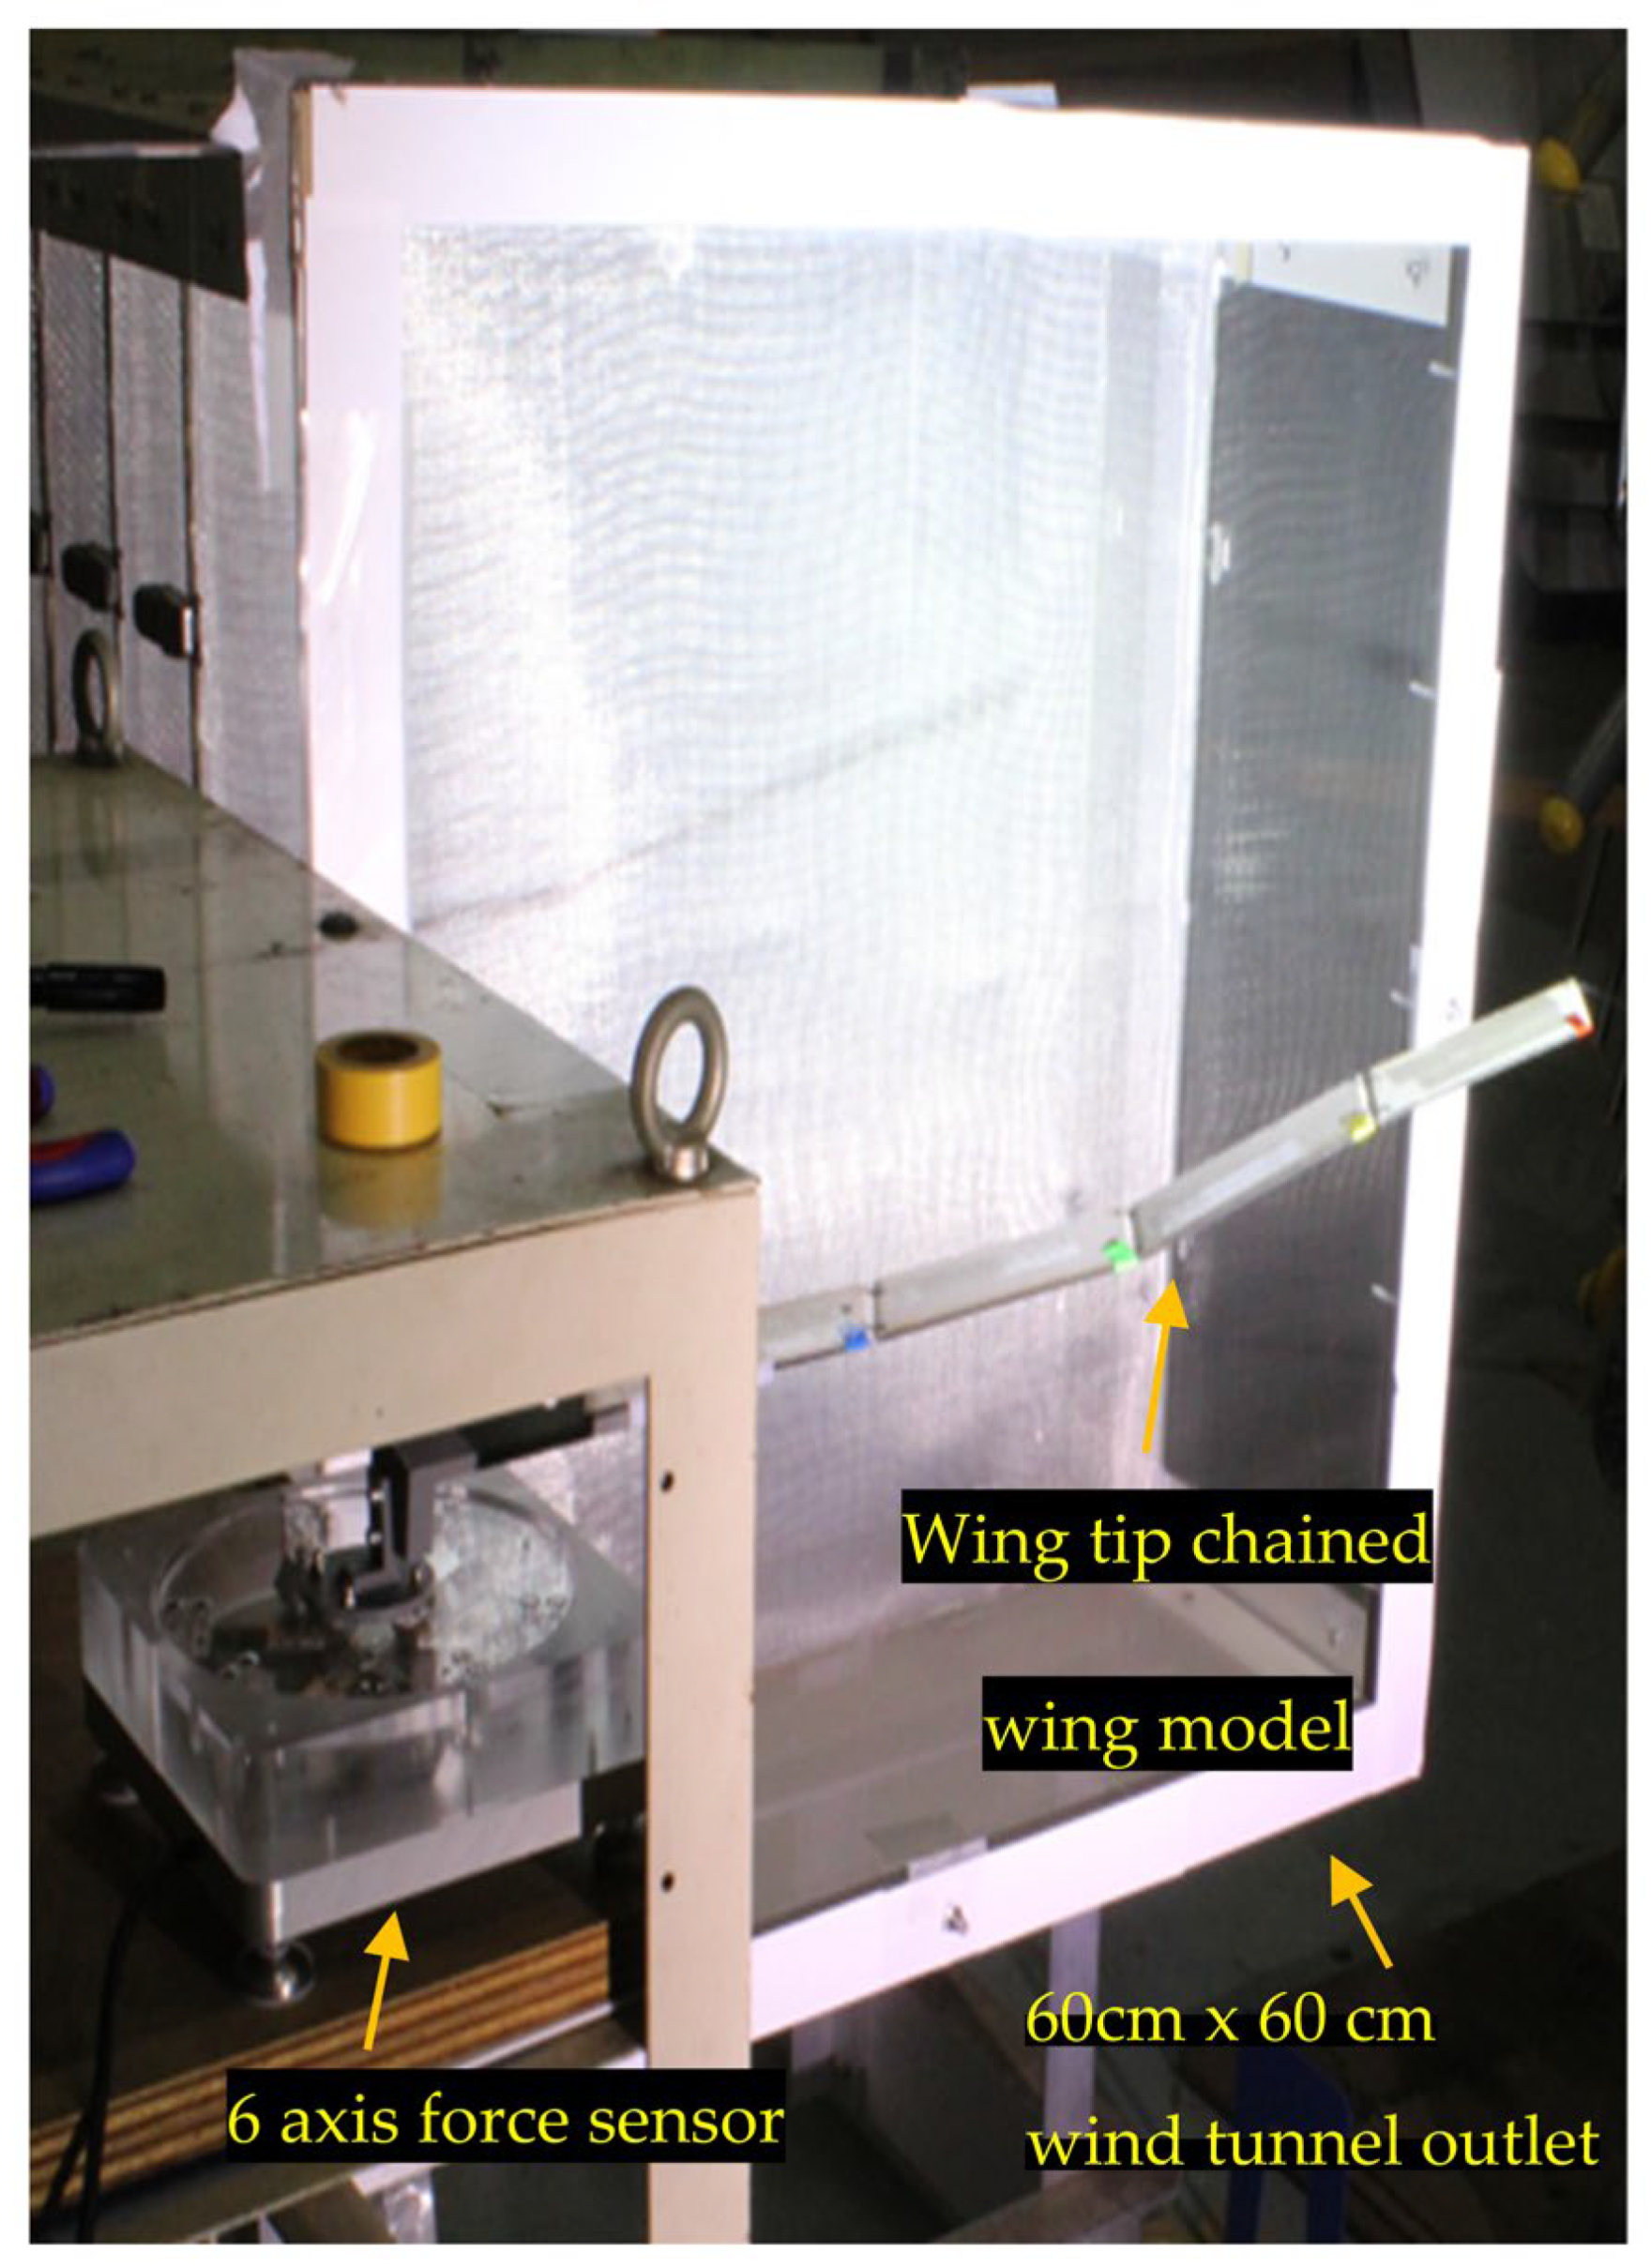
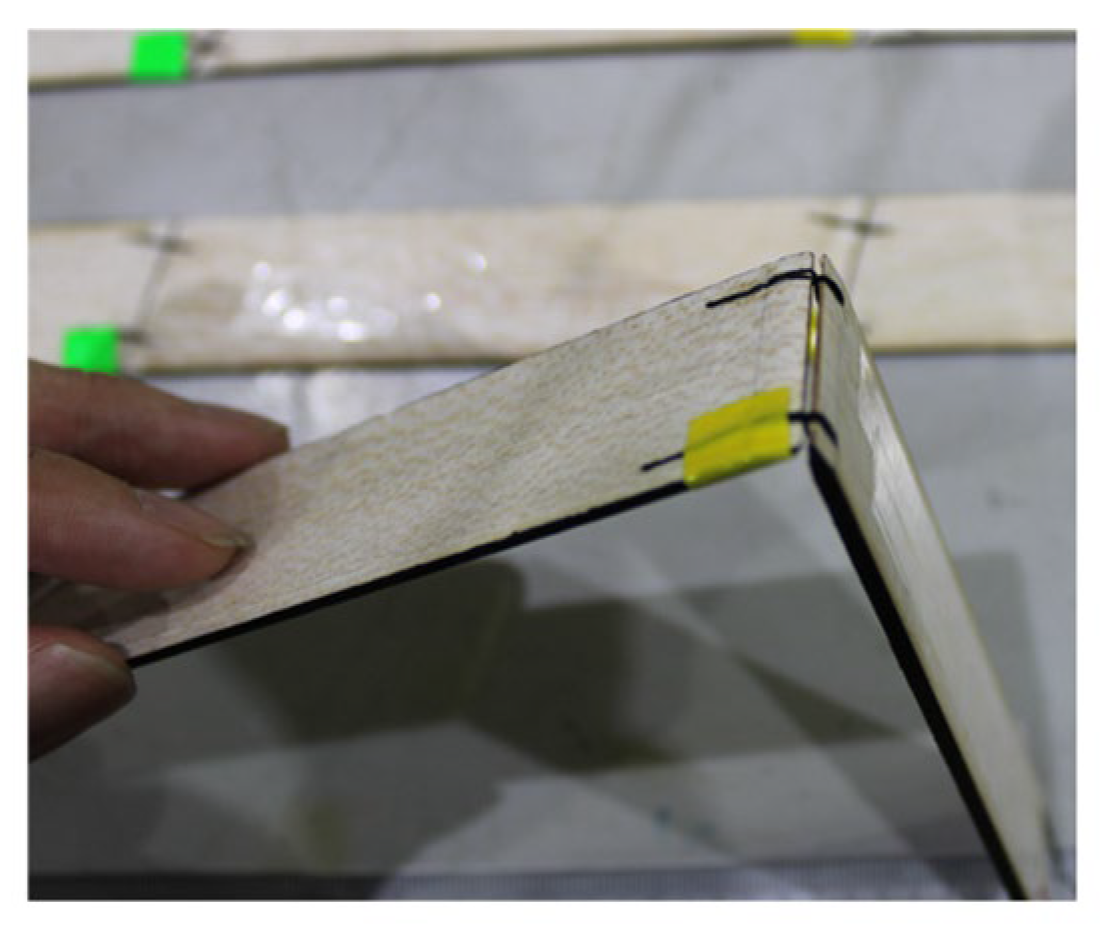
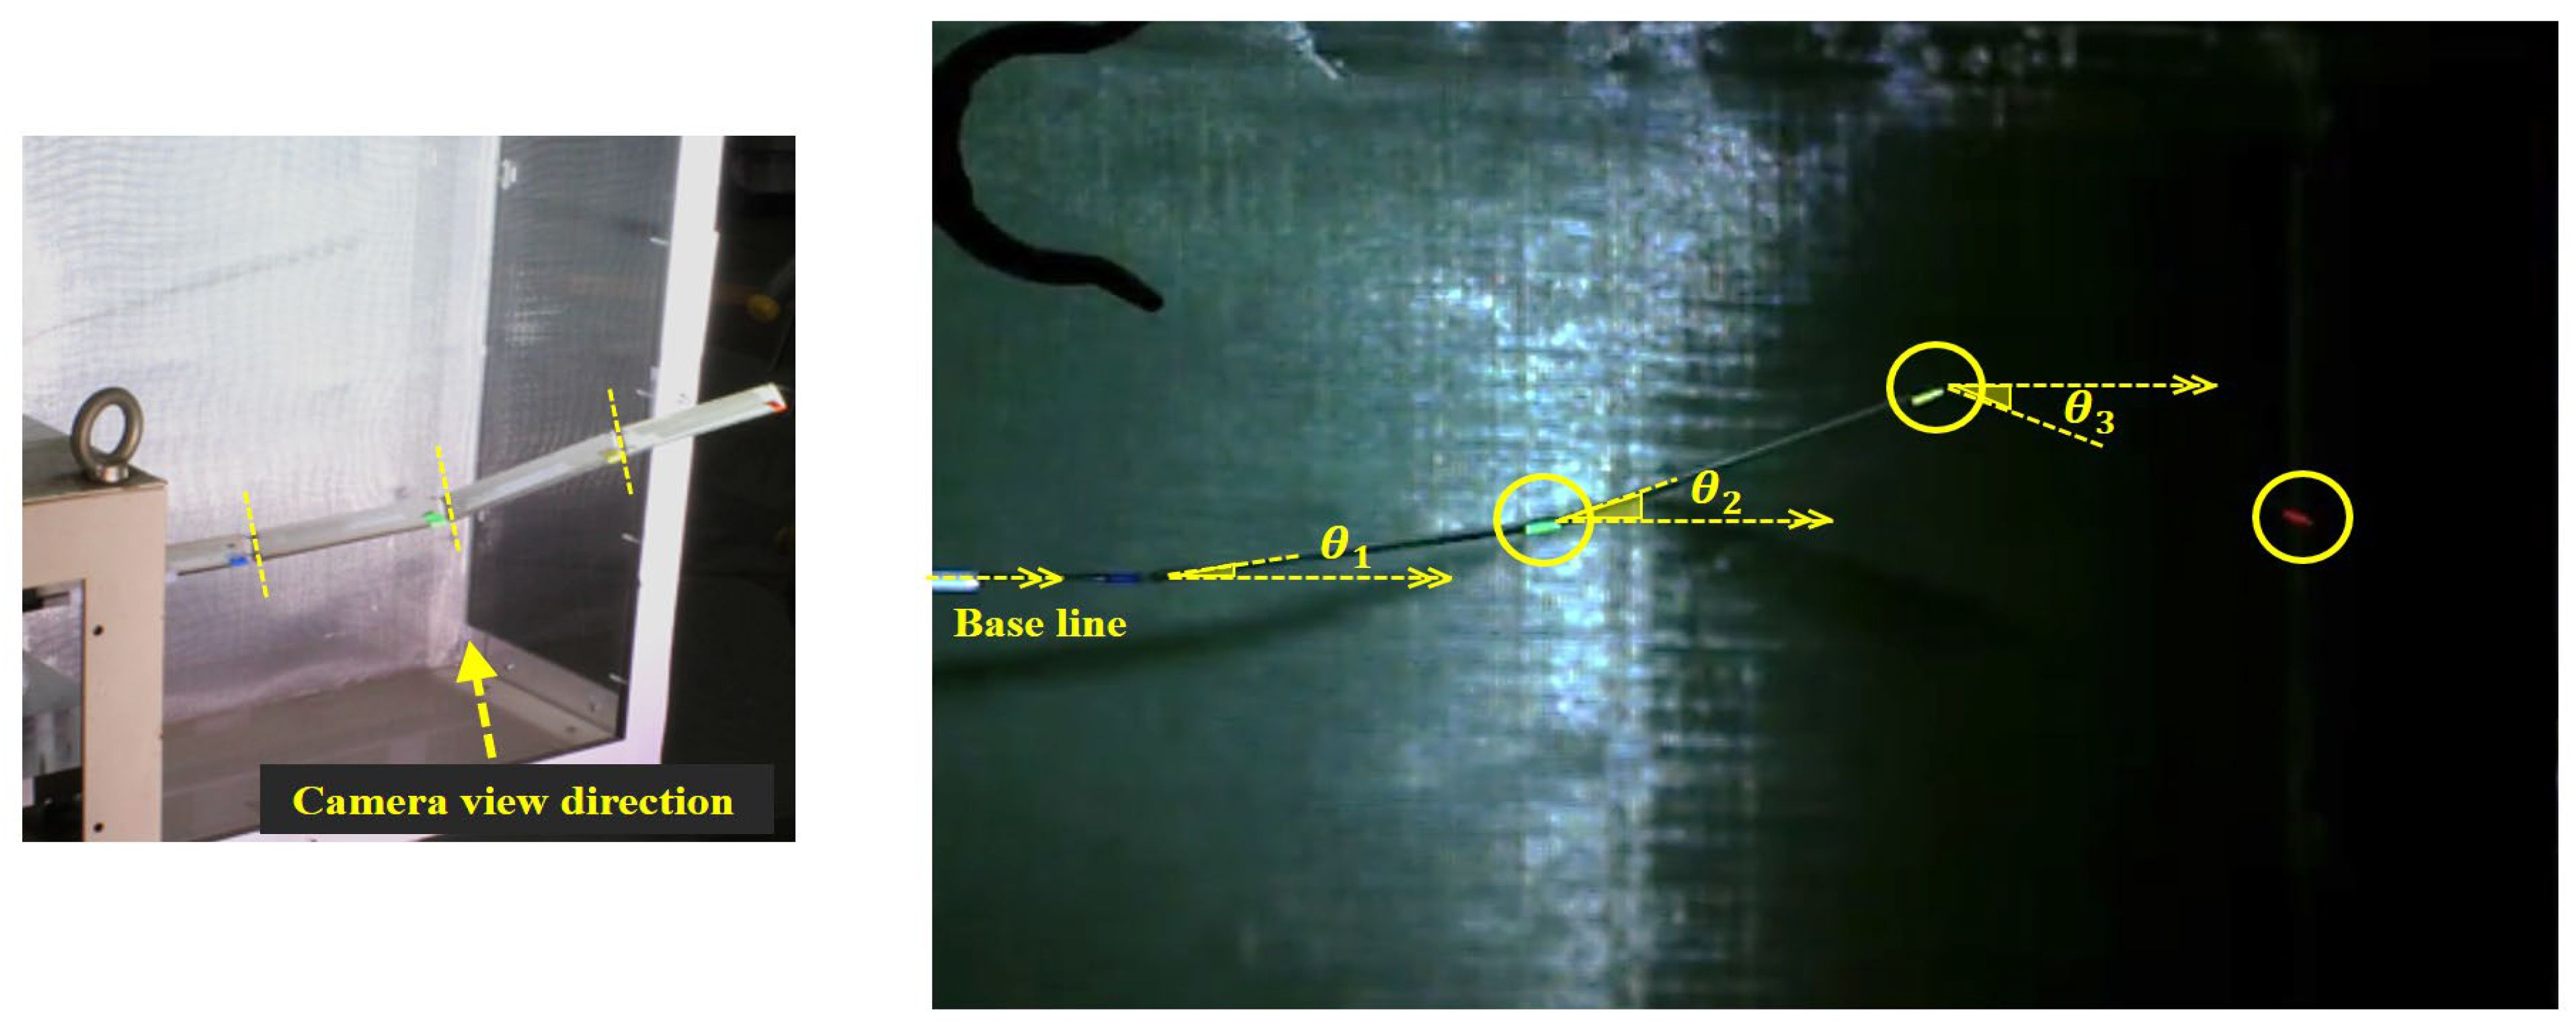
Low-speed wind tunnel experiments were conducted at the Kashiwa Campus of the University of Tokyo using a 60 cm × 60 cm low-speed wind tunnel. Small-scale wing models resembling connected airplanes were constructed using balsawood and strings. Each wing section weighed 1.5 g, and the size of each rectangular wing was set to 9 × 3 cm, with the hinge section set to 3 cm × 3 cm for a single pair. Two different values of hinge angles, hinge angle δ = 15° and hinge angle δ = 30°, were tested under several wind conditions. A hinge angle δ = 0° model was also used for reference testing purposes. The wind velocity was set to the maximum capability of the wind tunnel (5 m/s). Under these conditions, no signs of stalling were observed in the experimental models. The experiments were conducted at this velocity, as it was anticipated that the aerodynamic force would exert the greatest influence among all the forces acting on the model. The model was set with one edge fixed to the side and the other free to the stream, just as the calculations were conducted, and the AoA of the base of the fixed-wing section fixed to one side was changed between −1°, 4°, and 9°. A general overview of the experimental setup is shown in Figure 13 and Figure 14. Figure 15 and Figure 16 show the models used in the experiments. Figure 17 shows an example of a snapshot from the high-speed camera from which each hinge rotation angle θ was derived. The hinge rotation angles θ for each hinge are defined as the angles from the base line formed by the stationary rod with a blue marker at its tip, to which the wing sections are chained. A maximum of 2° of error in the acquired θ is expected in this method, due to the centers of the green, yellow, and red markers not being exactly on the hinge point of the wing sections, and also due to the detected center of the color marker itself shifting slightly from the true position because of lighting, reflection, camera setting, etc. Owing to spatial constraints within the wind tunnel, the connected wing model was constructed as a mirrored version of the wings in a previously described numerical calculation setup. In this model, the fixed edge is positioned to the left when viewed from the receiving end of the wind flow, resulting in the tilting of the hinge axis in the opposite direction. Similar to the numerical calculations, hinge rotation in the direction of positive lift, or opposite to gravitational force, is defined as a positive θ increase, which would remain invariant, even when all the calculations are performed with mirrored dimensions. The camera lens employed in this experiment was sufficiently large and free from distortion, enabling us to disregard the lens distortion effects within the recorded camera area. The motion of the chained-wing model in the wind was recorded using a high-speed color camera positioned parallel to the hinge axis, which enabled us to track the colored tips of each wing section. The camera was operated at a speed of 900 frames per second (fps) and resolution of 640 × 480 pixels. Color-tracking analysis was performed using the Python libraries provided by OpenCV. The exposure time for each captured frame was optimized for the highest possible resolution, enabling precise color tracking of the orientation of the model, facilitated by a high-power lighting system.

3.2. Structural Hinge Damping Coefficient

To determine the average structural hinge damping coefficient ζ for Equation (7), relevant to these wind tunnel models, a swing test was conducted using the model with the hinge axis angle δ = 0°. This was aimed at capturing the damping effects arising from factors such as nonideal hinges and intrinsic material properties.
The model was hung vertically, given an initial start angle with the ground, and released as a simple multi-link rigid pendulum without any wind flow from the wind tunnel to capture its free-swinging movement, as shown in Figure 18. Two swing tests with the average initial θ n = 30° and θ n = −30° were conducted.
Because there was no wind flow from the wind tunnel in this test and only minimal air drag from the swinging movement working at AoA = 90° to the hung chained wings, unlike in the other wind tunnel experiments, the aerial force to be used in Equation (7) derived in the previous section was estimated by Equation (26), below, for this specific swing test.
L j = C d s w i n g · ρ U 2 S 2 ( C d s w i n g = 1.19 ) M j = 0 ( 1     j     3 ) ,
where C d s w i n g is the typical drag coefficient for rectangular surfaces at an aspect ratio of 4 and perpendicular to the flow [35]. U and S denote relative air speed and the surface area of each wing section, respectively.
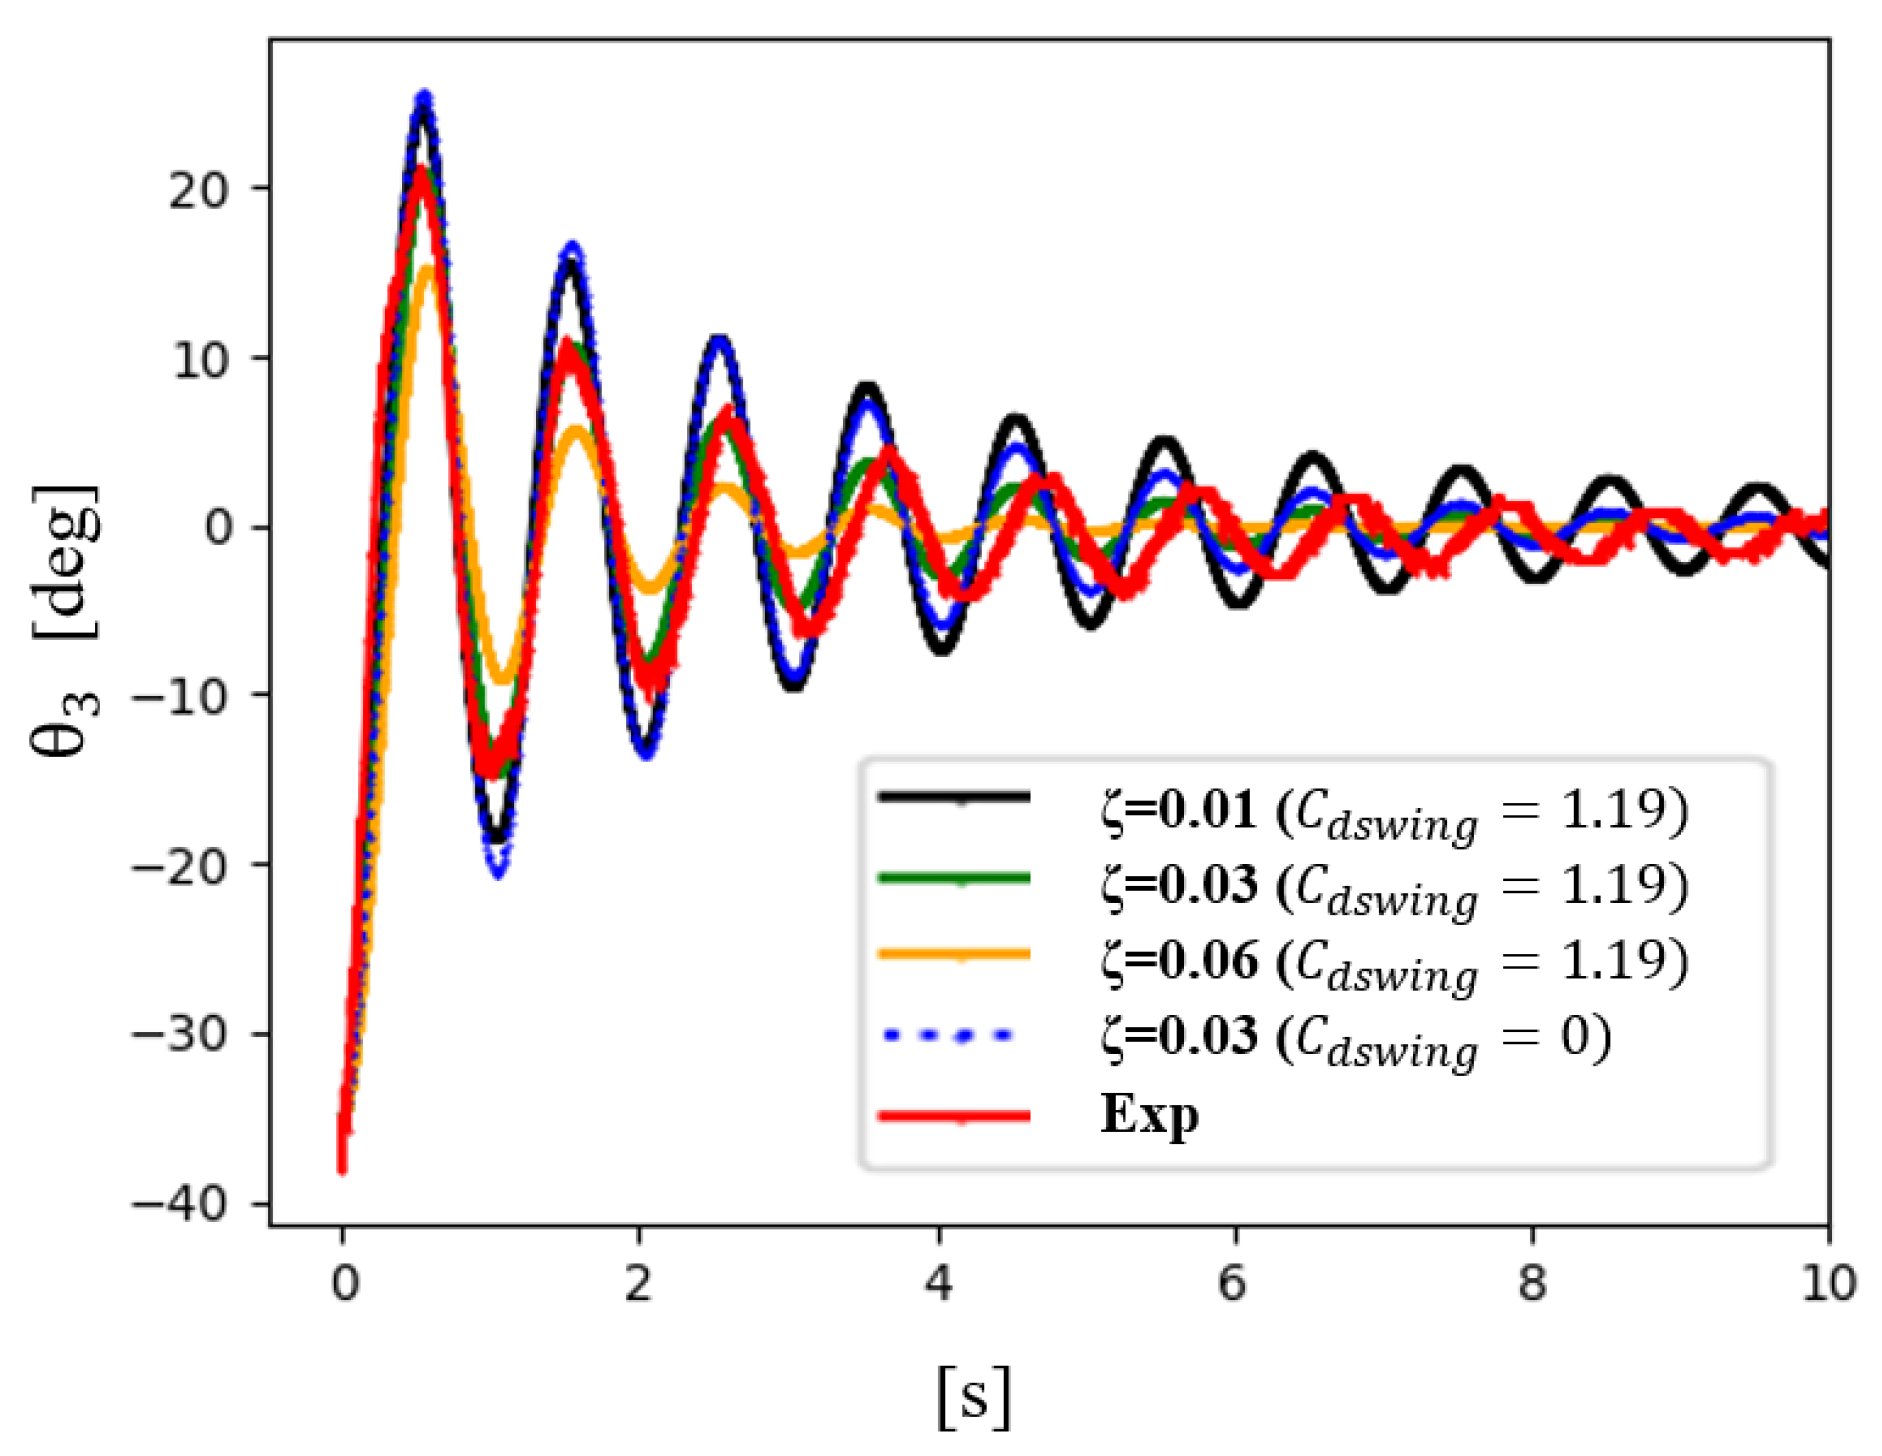
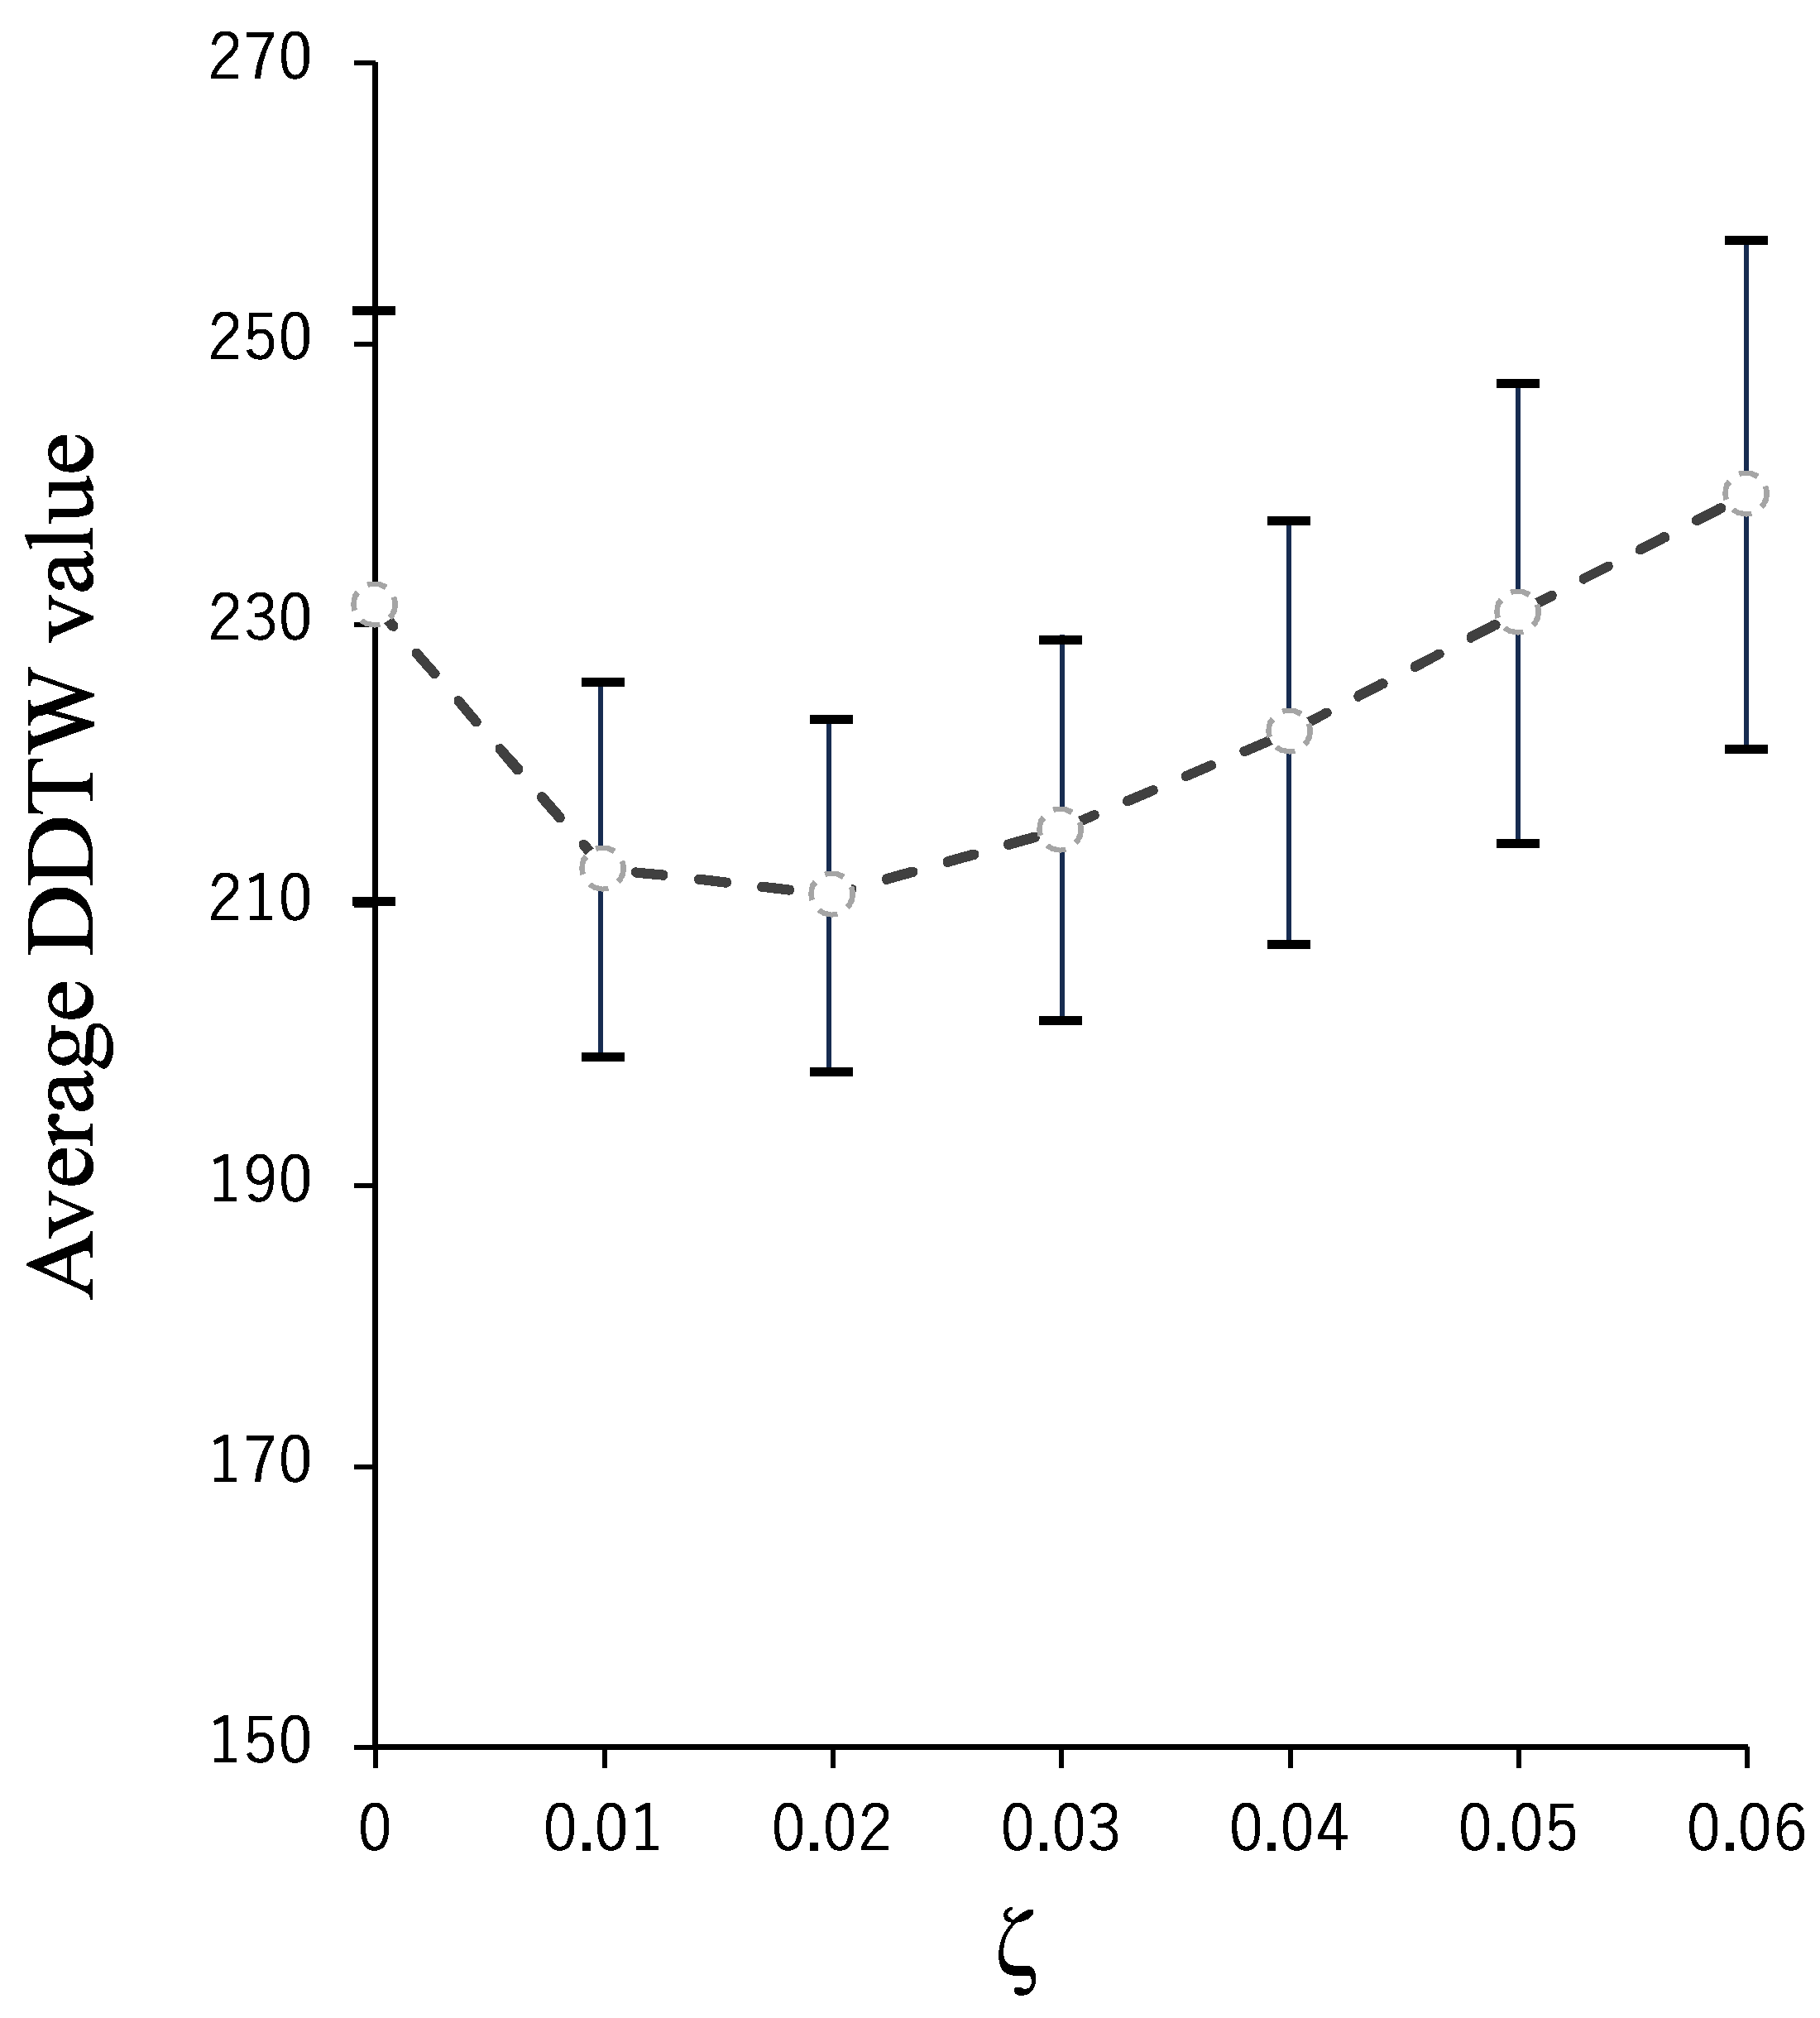
Several calculations of the swinging moment were performed from the same initial set θ 1 ~ θ 3 angles in this swinging experiment, using different ζ values. By comparing the calculated history results of the hinge rotation angle θ 3 with the actual experiment data via derivative dynamic time warping (DDTW) [36] method, the optimal ζ was obtained.
The DDTW is a method for assessing the similarity between two waves. This approach involves comparing the derivatives of the two waves at various points and calculating the sum of the squared differences. When acquiring this sum, the optimal pair of points from each wave is selected to minimize the total difference, providing a quantified result value for similarity. Similarity is considered high when this value is small and should be zero if the two waves are identical.
Figure 19 shows and compares several θ 3 histories calculated with different ζ values, the acquired experimental result, and a θ 3 history calculated ignoring aerial drag. It can be seen that the structural damping for this wing model is of the same order as that of aerial drag force induced at its natural swinging speed. DDTW values were derived between the acquired experimental θ 3 data and calculated θ 3 data with different ζ values in increments of 0.01 from 0.01 to 0.06. The average result of this DDTW comparison is shown in Figure 20, from which ζ = 0.02 was selected as the structural damping coefficient for the three chained-wing wind tunnel models, where the DDTW value was the lowest.

3.3. Derivation of Parasite Drag Coefficient C D 0 to Use with VLM

The total drag of a wing in a wind flow is the sum of the parasitic and induced drags. The coefficients for the total, parasitic, and induced drags are represented as C D , C D 0 , C D i n d , respectively, and can be expressed as follows:
C D = C D 0 + C D i n d .
Parasitic drag is caused mainly by air resistance against the wing’s overall shape and skin friction drag resulting from air viscosity. The induced drag, on the other hand, is a byproduct of lift generation and arises owing to the creation of wing-tip vortices and pressure differences over the wing surface.
The VLM allows for the calculation of lift and induced drag forces; however, it does not calculate parasitic drag and requires separate modeling.
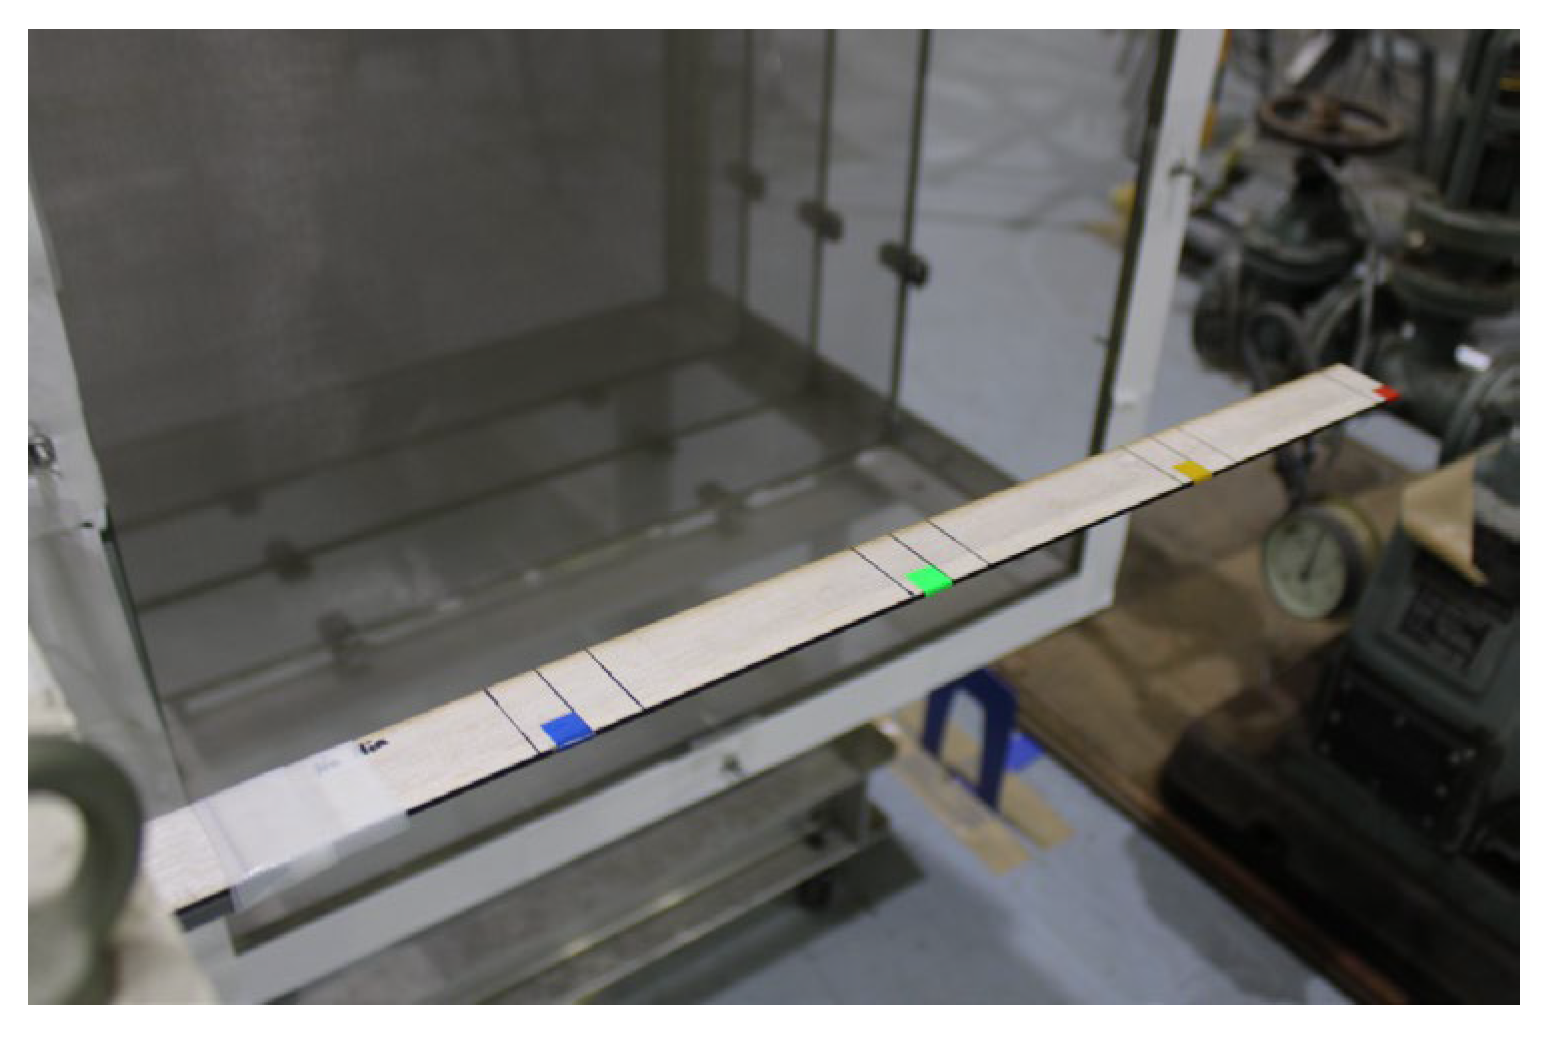
To estimate the parasitic drag within the desired angle-of-attack (AoA) range, a fixed-hinge wing model identical in dimension to the extended three-chained wing configuration was prepared for wind tunnel testing, as shown in Figure 21. This allowed for the direct force measurement experiments to determine the actual drag coefficients.
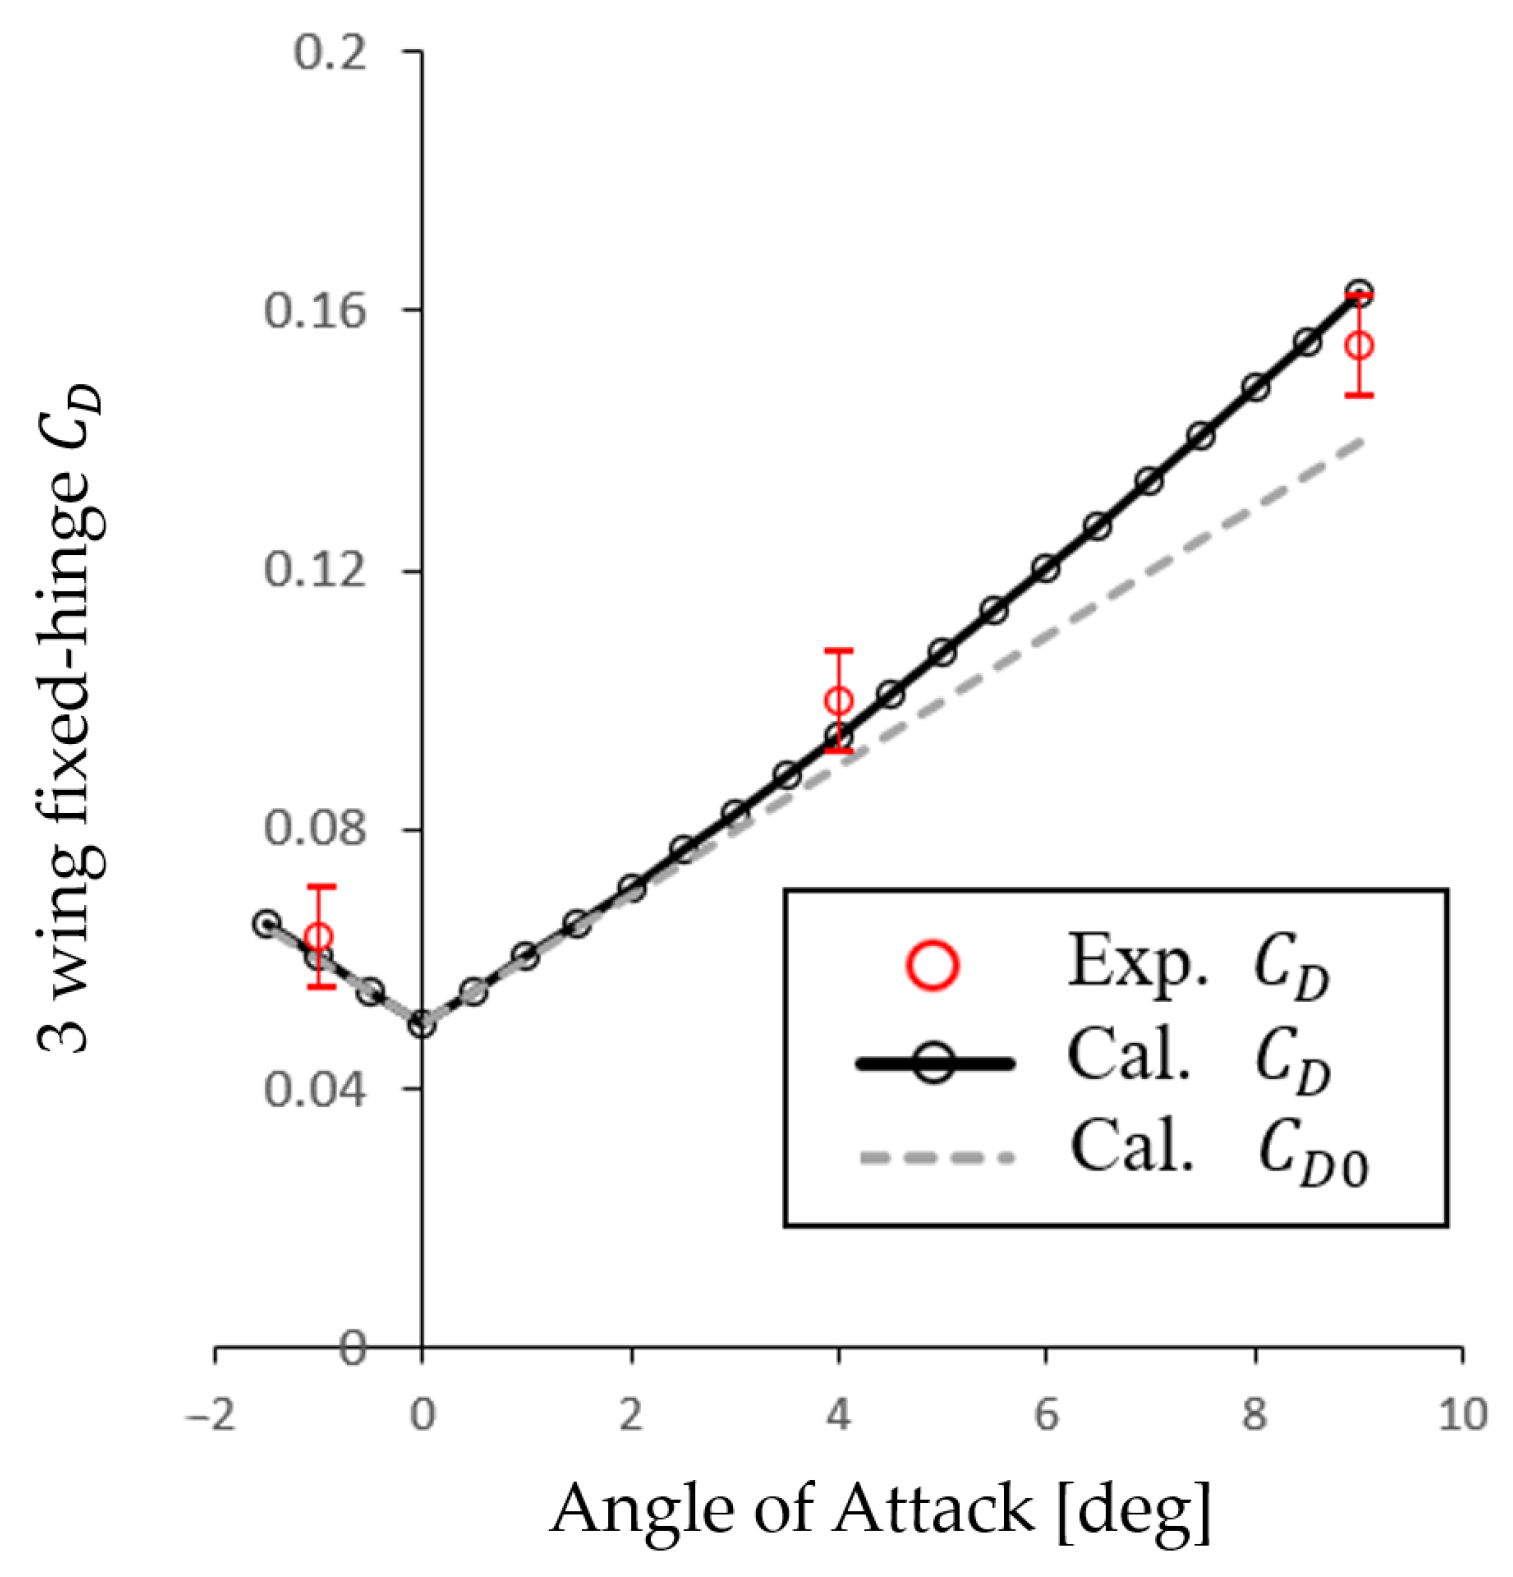
The parasitic drag ( C D 0 ) coeficient was linearly approximated to the absolute value of AoA, where the value at AoA = 0° was predicted from the experimental data. The slope value for the linear curve was fitted so that a sufficiently good match to the total drag ( C D ) coefficient could be determined from the experiment when the VLM-derived induced drag ( C D i n d ) coefficient for the AoA was added.
Figure 22 shows the final C D values calculated using the estimated parasitic drag for the fixed-hinge wing in the small-scale wind tunnel experiment. Figure 23 shows a comparison of the C L / C D calculations. Due to the measured force becoming extremely small in the case of the 1-chained case, the measured standard deviation became larger due to the minimum error range expected from the force measurement device. The deviation was largest for the experimental value for AoA = −1°, not matching with the computational value; however, the calculated value was judged as the more truthful in this case.
However, it should be noted that due to the direction of the drag force being close to the hinge-axis direction, the exact C D value does not affect the oscillation movement calculation results to a high degree, compared to the C L value. Despite drag not typically being a major concern for most aeroelastic applications, inaccurate estimations of drag may still lead to unpredicted unsteady phenomena; thus, experimental validation was carefully conducted in this study to not miss large unexpectedness.

3.4. Reference Experiment with Hinge-Axis Angle δ = 0°

First, several wind tunnel tests were conducted with the hinge angle δ = 0° model. In all cases, the chained-wing models failed to maintain a stable attitude or oscillation towards the wind flow and diverged, as shown in Figure 24. This confirms that a joint rotation hinge parallel to the wind (or δ = 0°) does not provide sufficient passive ability to stabilize the hinge rotation angle θ in free stream.

3.5. Hinge Oscillation Comparison of Experimental Results for Stable Flight Condition

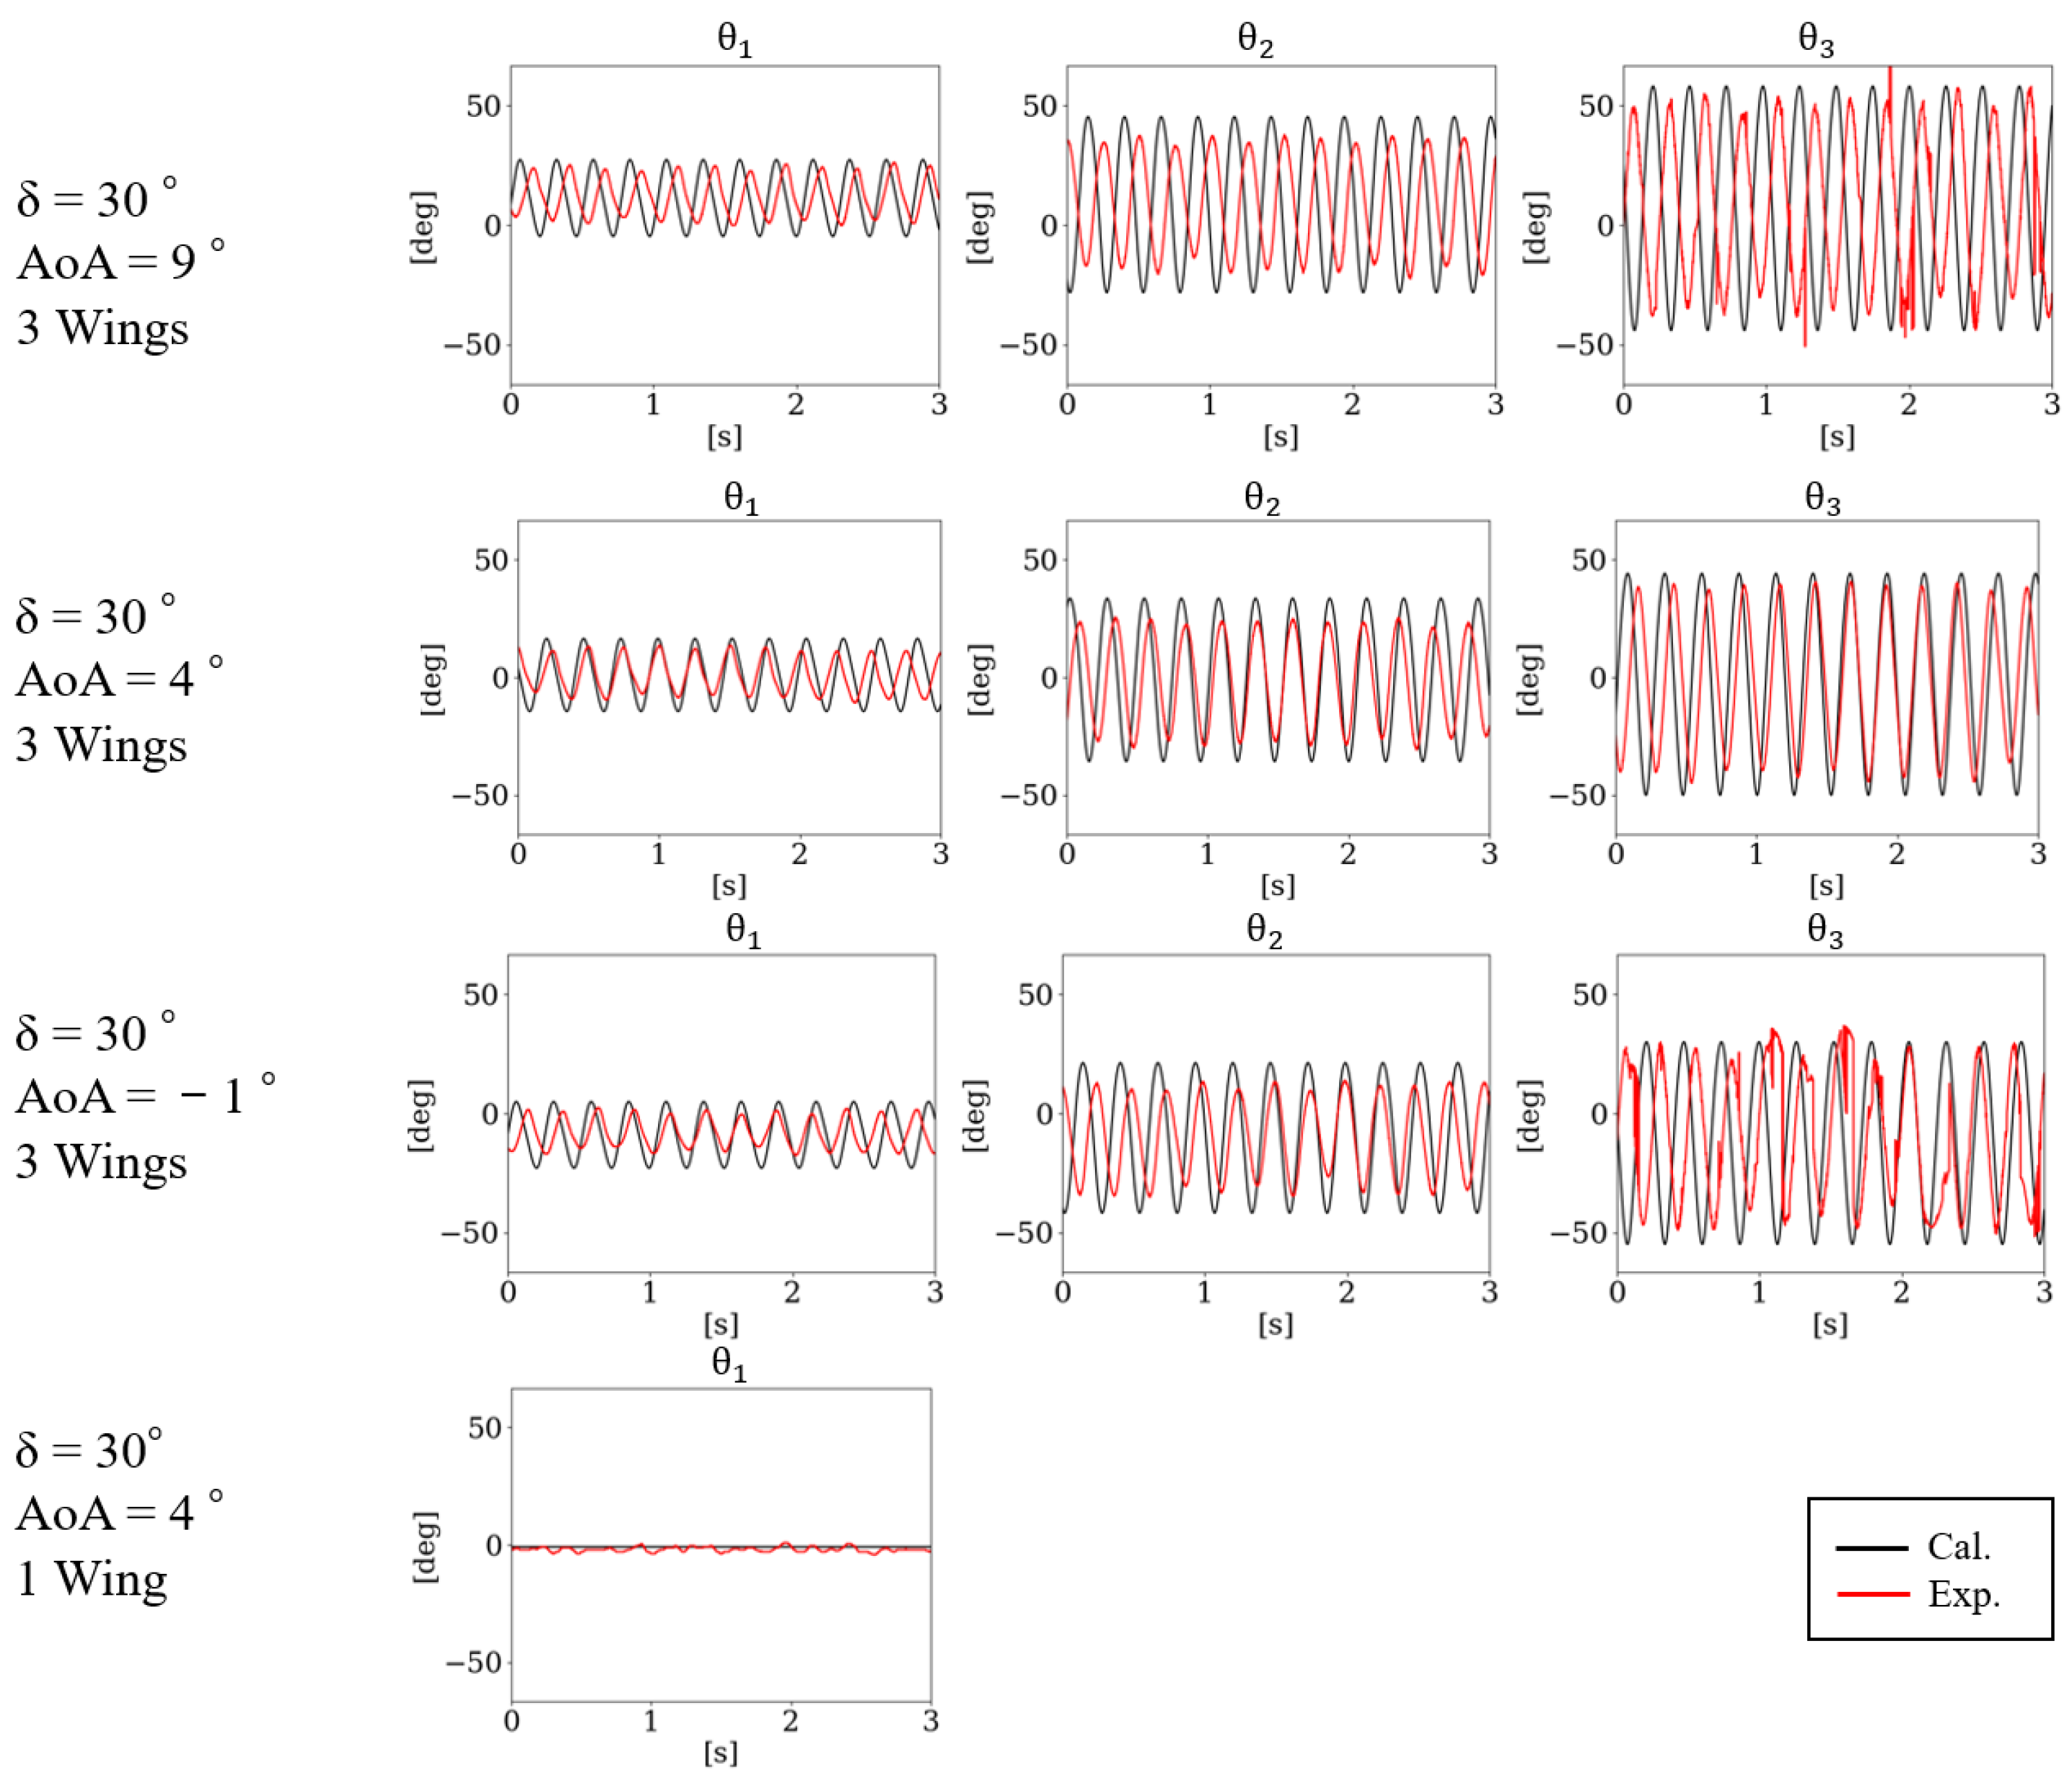
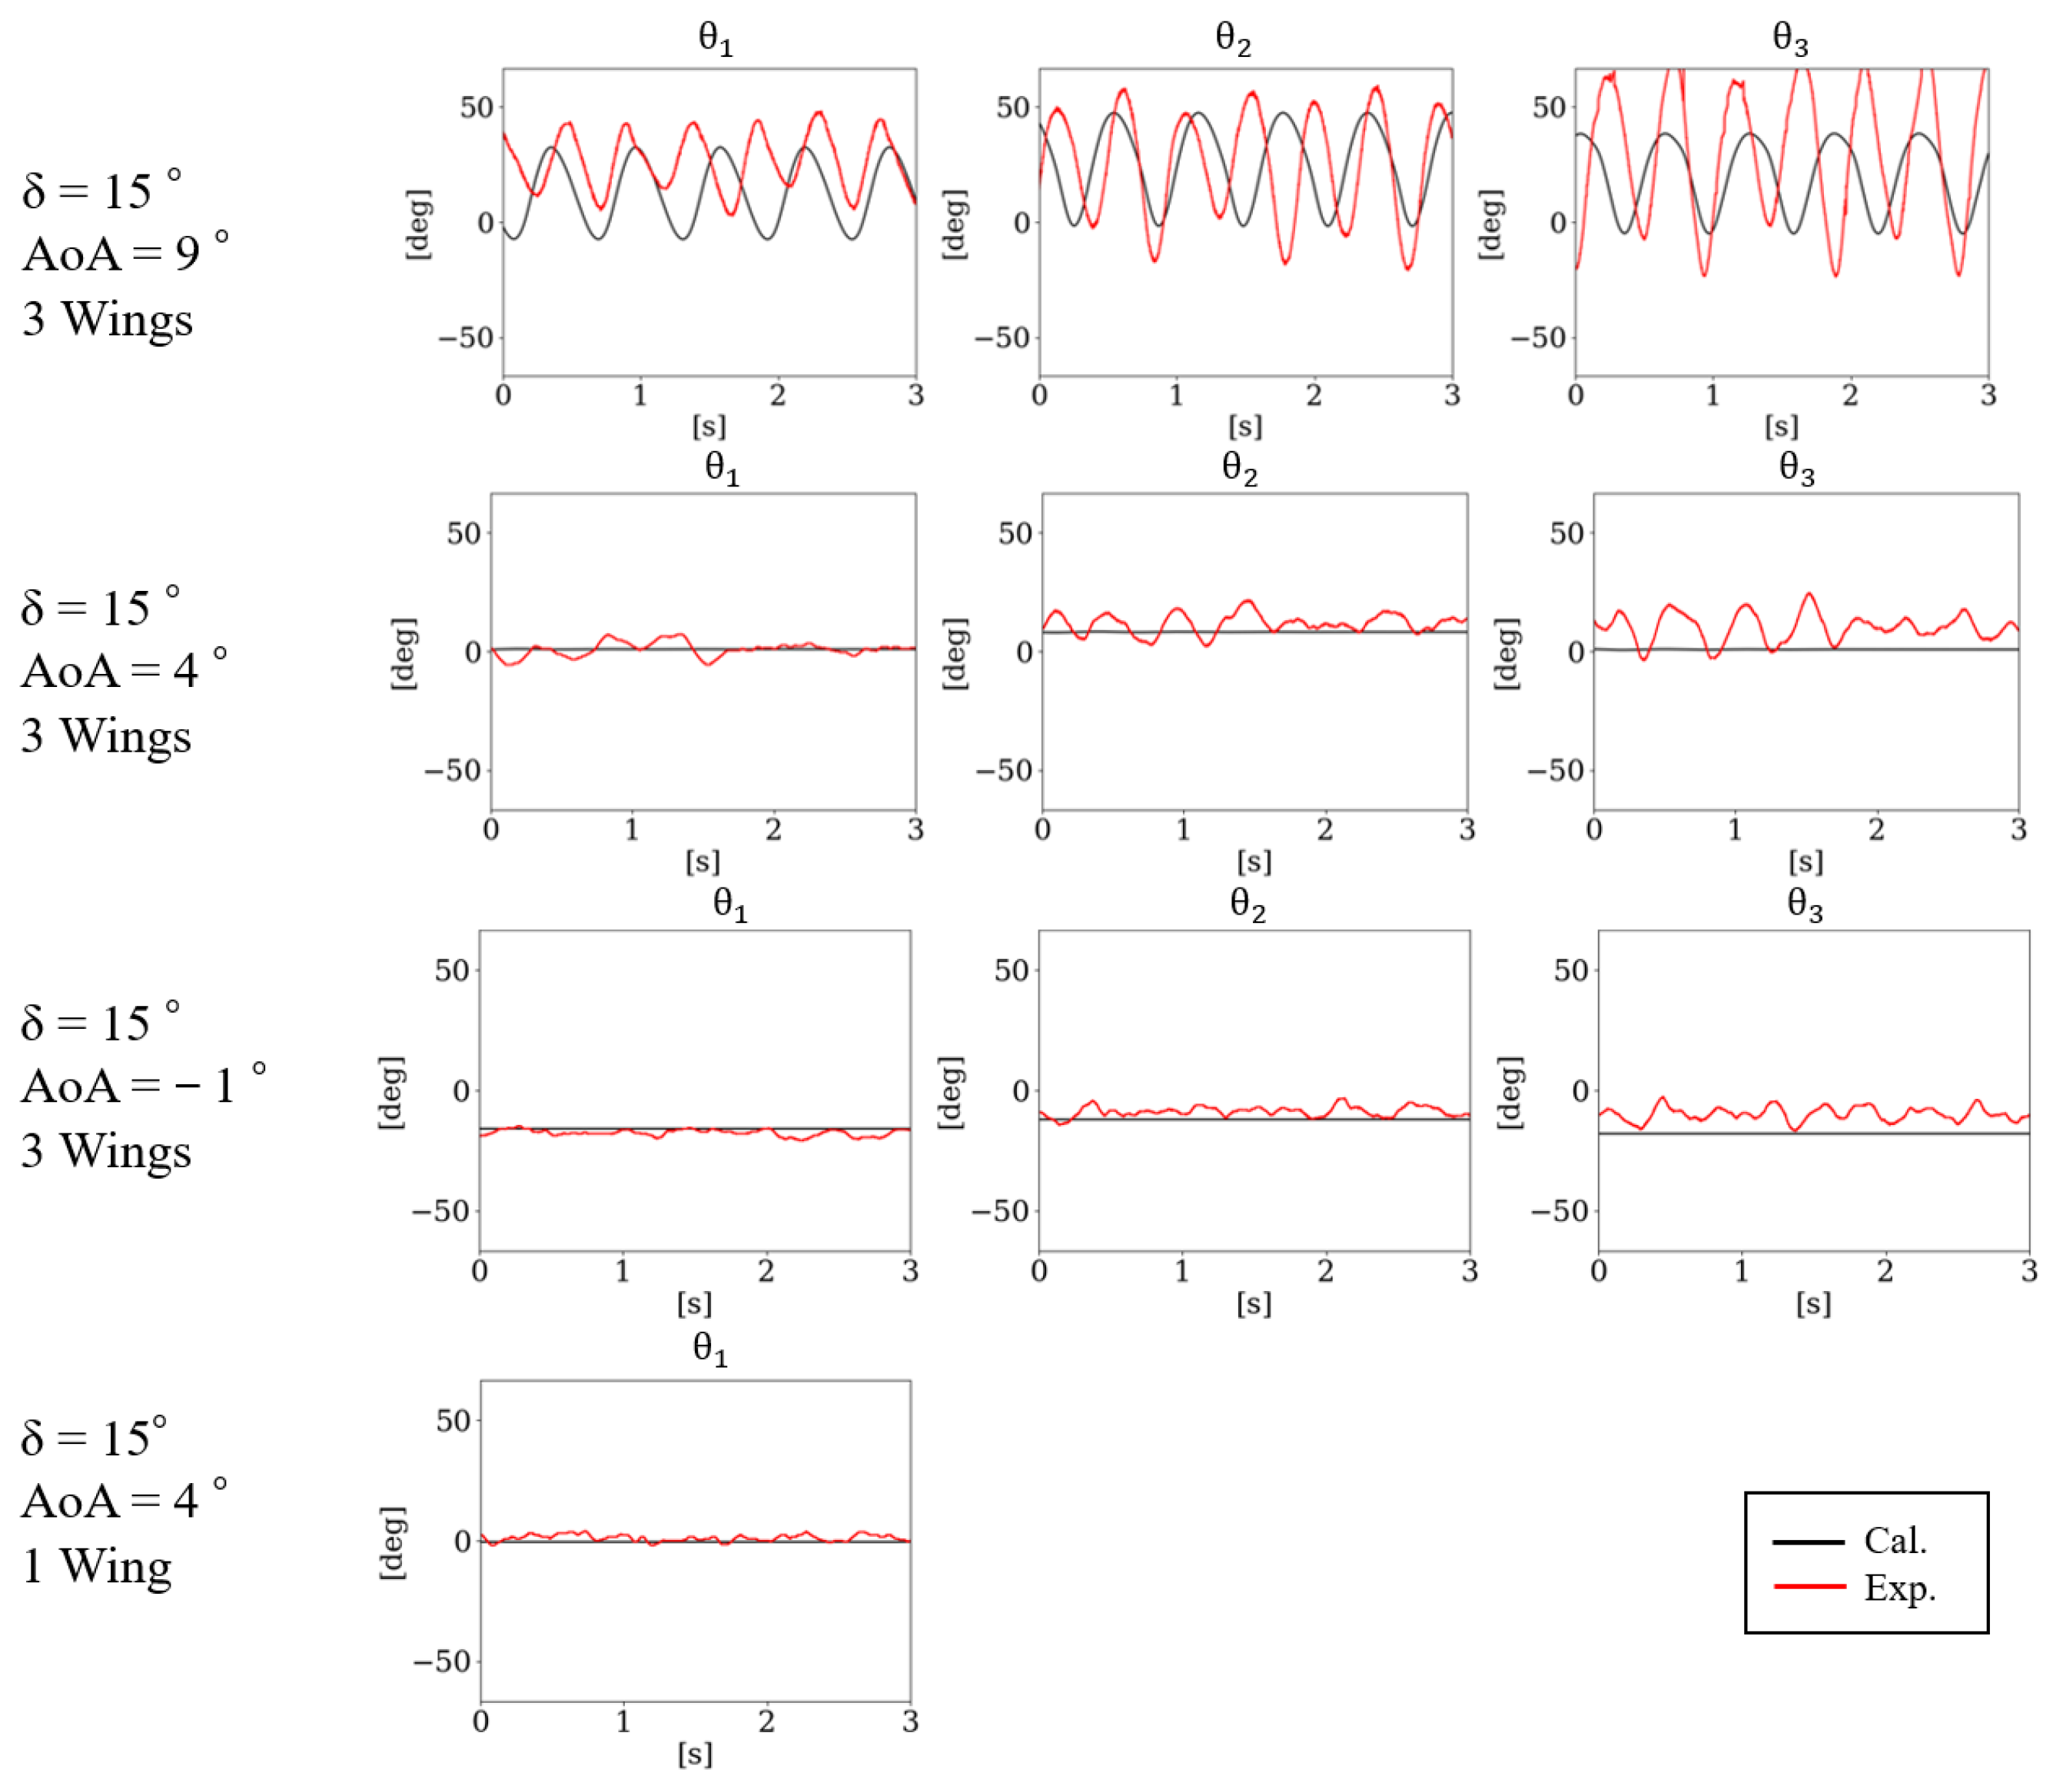
The models with hinge-axis angles δ = 15° and δ = 30° were tested in the small-scale low-speed wind tunnel under stable wind flow of 5 m/s at different AoA of −1°, 4°, and 9°. Color tracking and 6-axis force measurements were commenced after the oscillation of the model stabilized. Each experiment was conducted three times to achieve higher accuracy in data acquisition. Figure 25 and Figure 26 illustrate a comparison between experimental data (in red) and calculated data (in black) for the three oscillation time histories, corresponding to each θ of the chained-wing sections. Figure 25 shows the results for the hinge-axis angle δ = 30°. Figure 26 shows the same for the δ = 15° model. The former exhibited a relatively good correlation between the calculated results and experimental data. However, the latter demonstrated noticeable discrepancies. Various causes could be responsible for this, firstly, and most likely, due to the characteristics of the wood and string hinges being not ideally uniform and having the exact same damping coefficient ζ value. Although the absolute values did not match completely with the experiment for the δ = 15° case, the oscillation tendency difference between δ = 30°and δ = 15° was successfully captured by the numerical calculation.
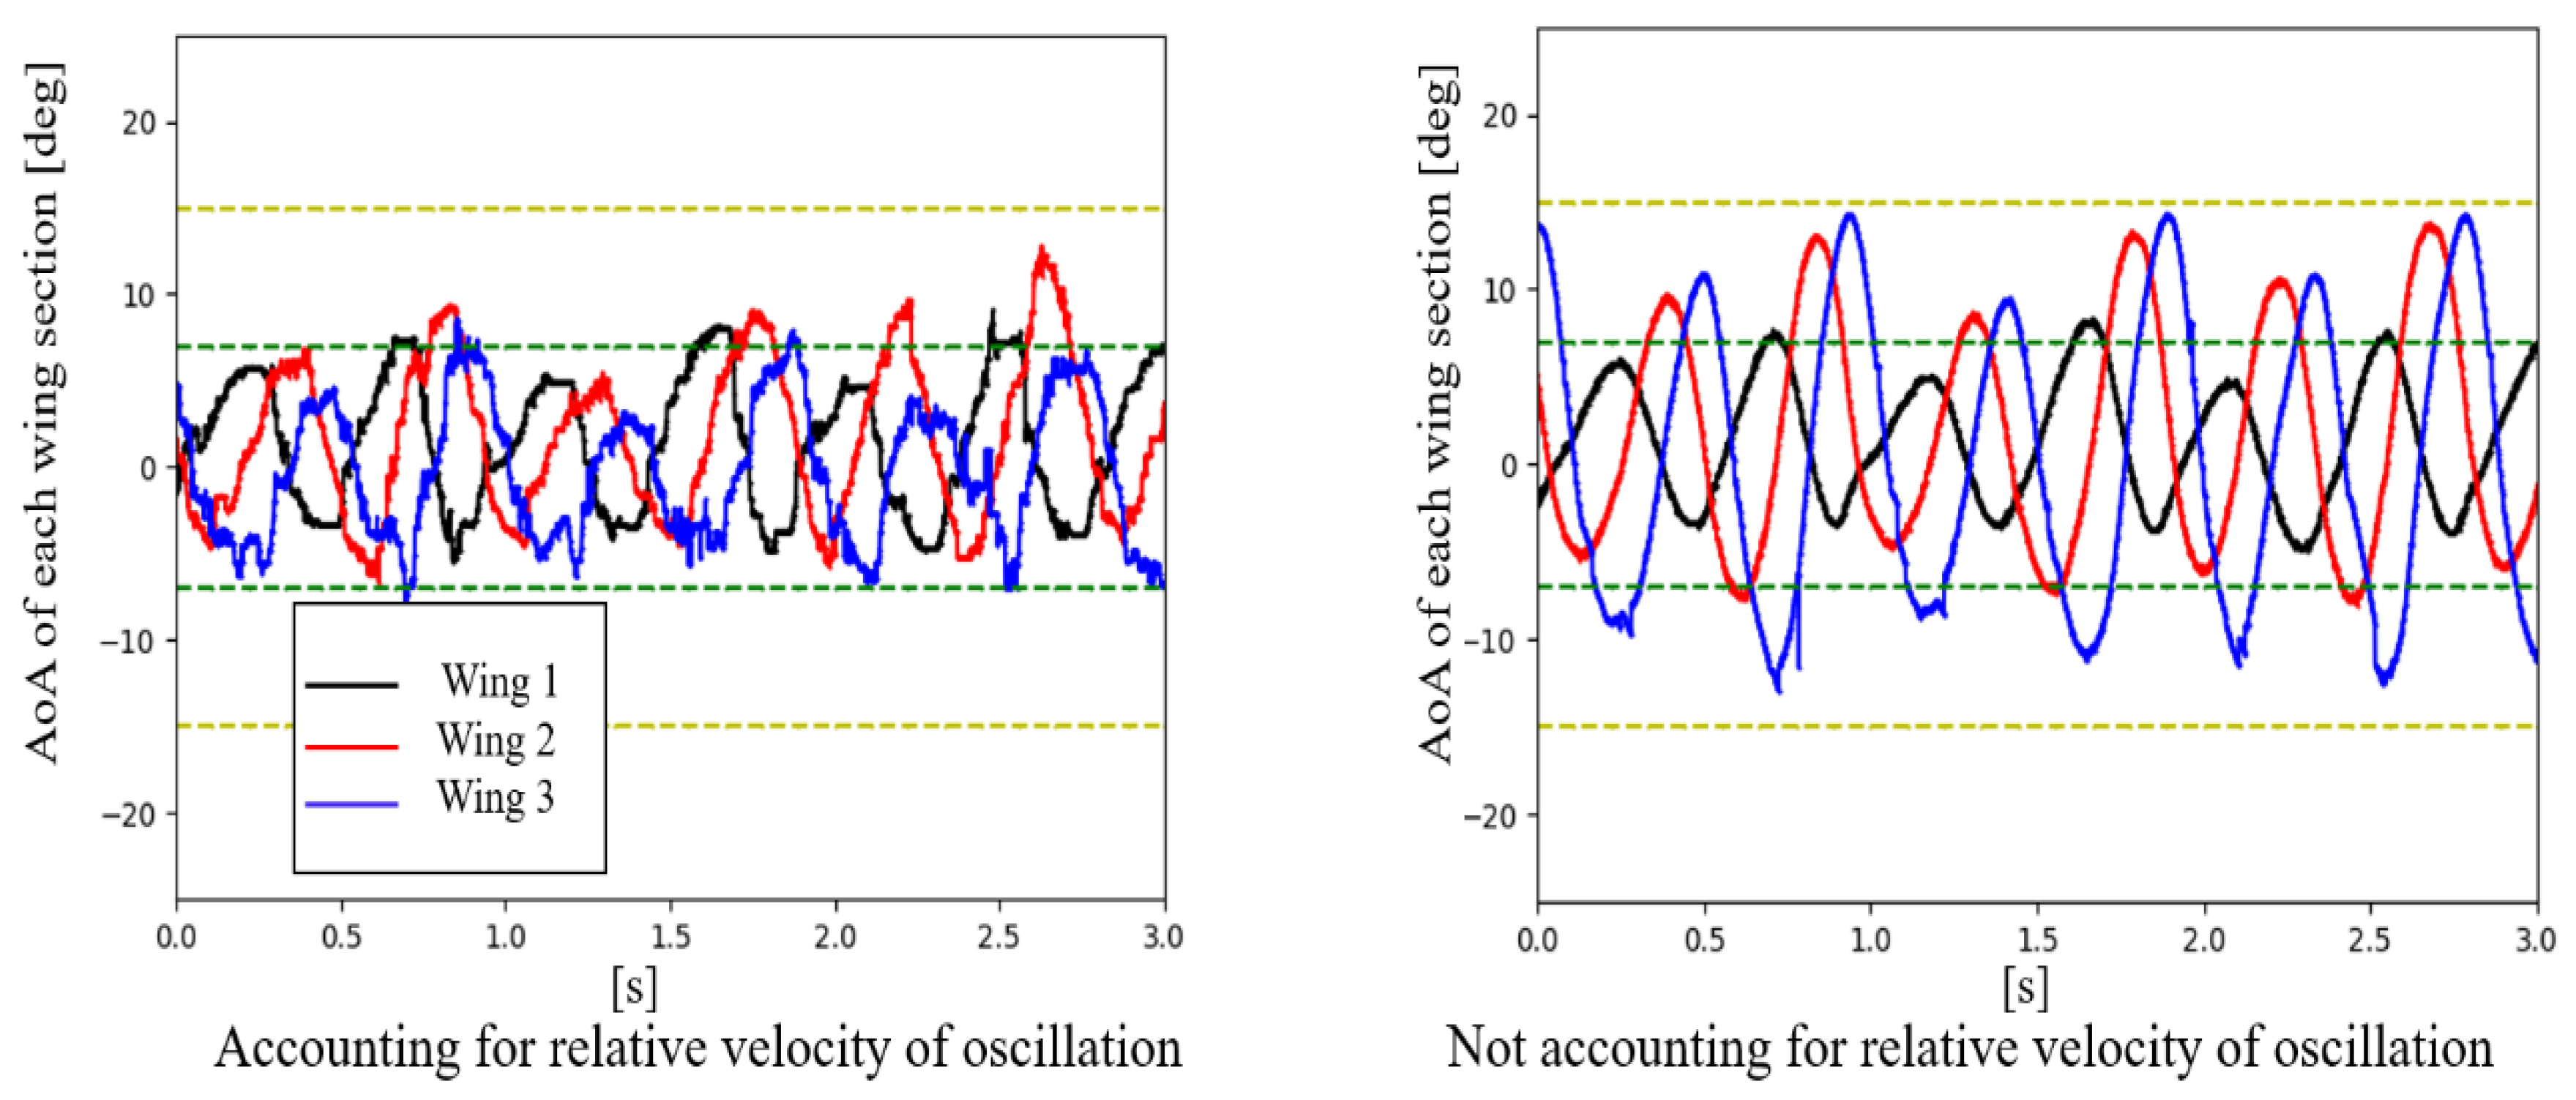
Figure 27 shows the AoA time history for each specific wing section calculated from the acquired θ data from the wind tunnel experiment for the cases of a hinge-axis angle δ = 30°, base AoA = 9°, and Figure 28 shows the same for a hinge-axis angle δ = 15° and base AoA = 9°. The AoA of each wing during the oscillation will be different from the set AoA at the base root of the wind tunnel model and can be calculated geometrically from the acquired time history data of the hinge-axis angle θ, via simple vector rotation and combination calculations. For Figure 27 and Figure 28, the right graph shows the derived AoA of each wing from the θ history, without taking into consideration the relative flow speed due to motion. The left graph shows the AoA history with this motion effect taken into account. As can be observed, the actual AoA each wing section experiences under oscillation is approximately 10° lower, especially in the wing-tip sections when the relative speed of motion is taken into account, compared to when simply judged by the value of its hinge rotation angle θ at that instance. The green dotted line represents the AoA at ±7°, within which the flat plate exhibits linear characteristics closely aligning with theoretical values calculated by methods such as the VLM. In a typical steady airflow, the values for flat plate C L start to show noticeable discrepancies between the linear theoretical values and experimental values outside this AoA region [33] under typical steady flow conditions. However, within the yellow line AoA at ±15°, the flat plate has been proven to show lower discrepancy of mean C L values from ideal calculation values under oscilations perpendicular to the flow, or “heaving” by M. Okamoto et al. [37,38], with the AoA of the peak C L increasing drastically compared to when in typical steady flow. This phenomenon is a result of the complex non-linear effects of flow seperation and reattachment but is worth noting. Although not recreated exactly in the VLM calculation, this effect is considered to have contributed to reducing the discrepancy between VLM-calculated values and experimental results to some degree in the higher AoA regions outside the typical AoA = ±7° range.
For the hinge-axis angle δ = 30° in Figure 27, it can be observed that during most of the oscilation, the AoA of the three wing sections is within this AoA = ±15° region other than the very peak of Wing 3 (the wing at the most free end). For the hinge-axis angle δ = 15° in Figure 28, during most of the oscilation, the AoA of the three wing sections is much lower and almost always within the AoA = ±7° region.
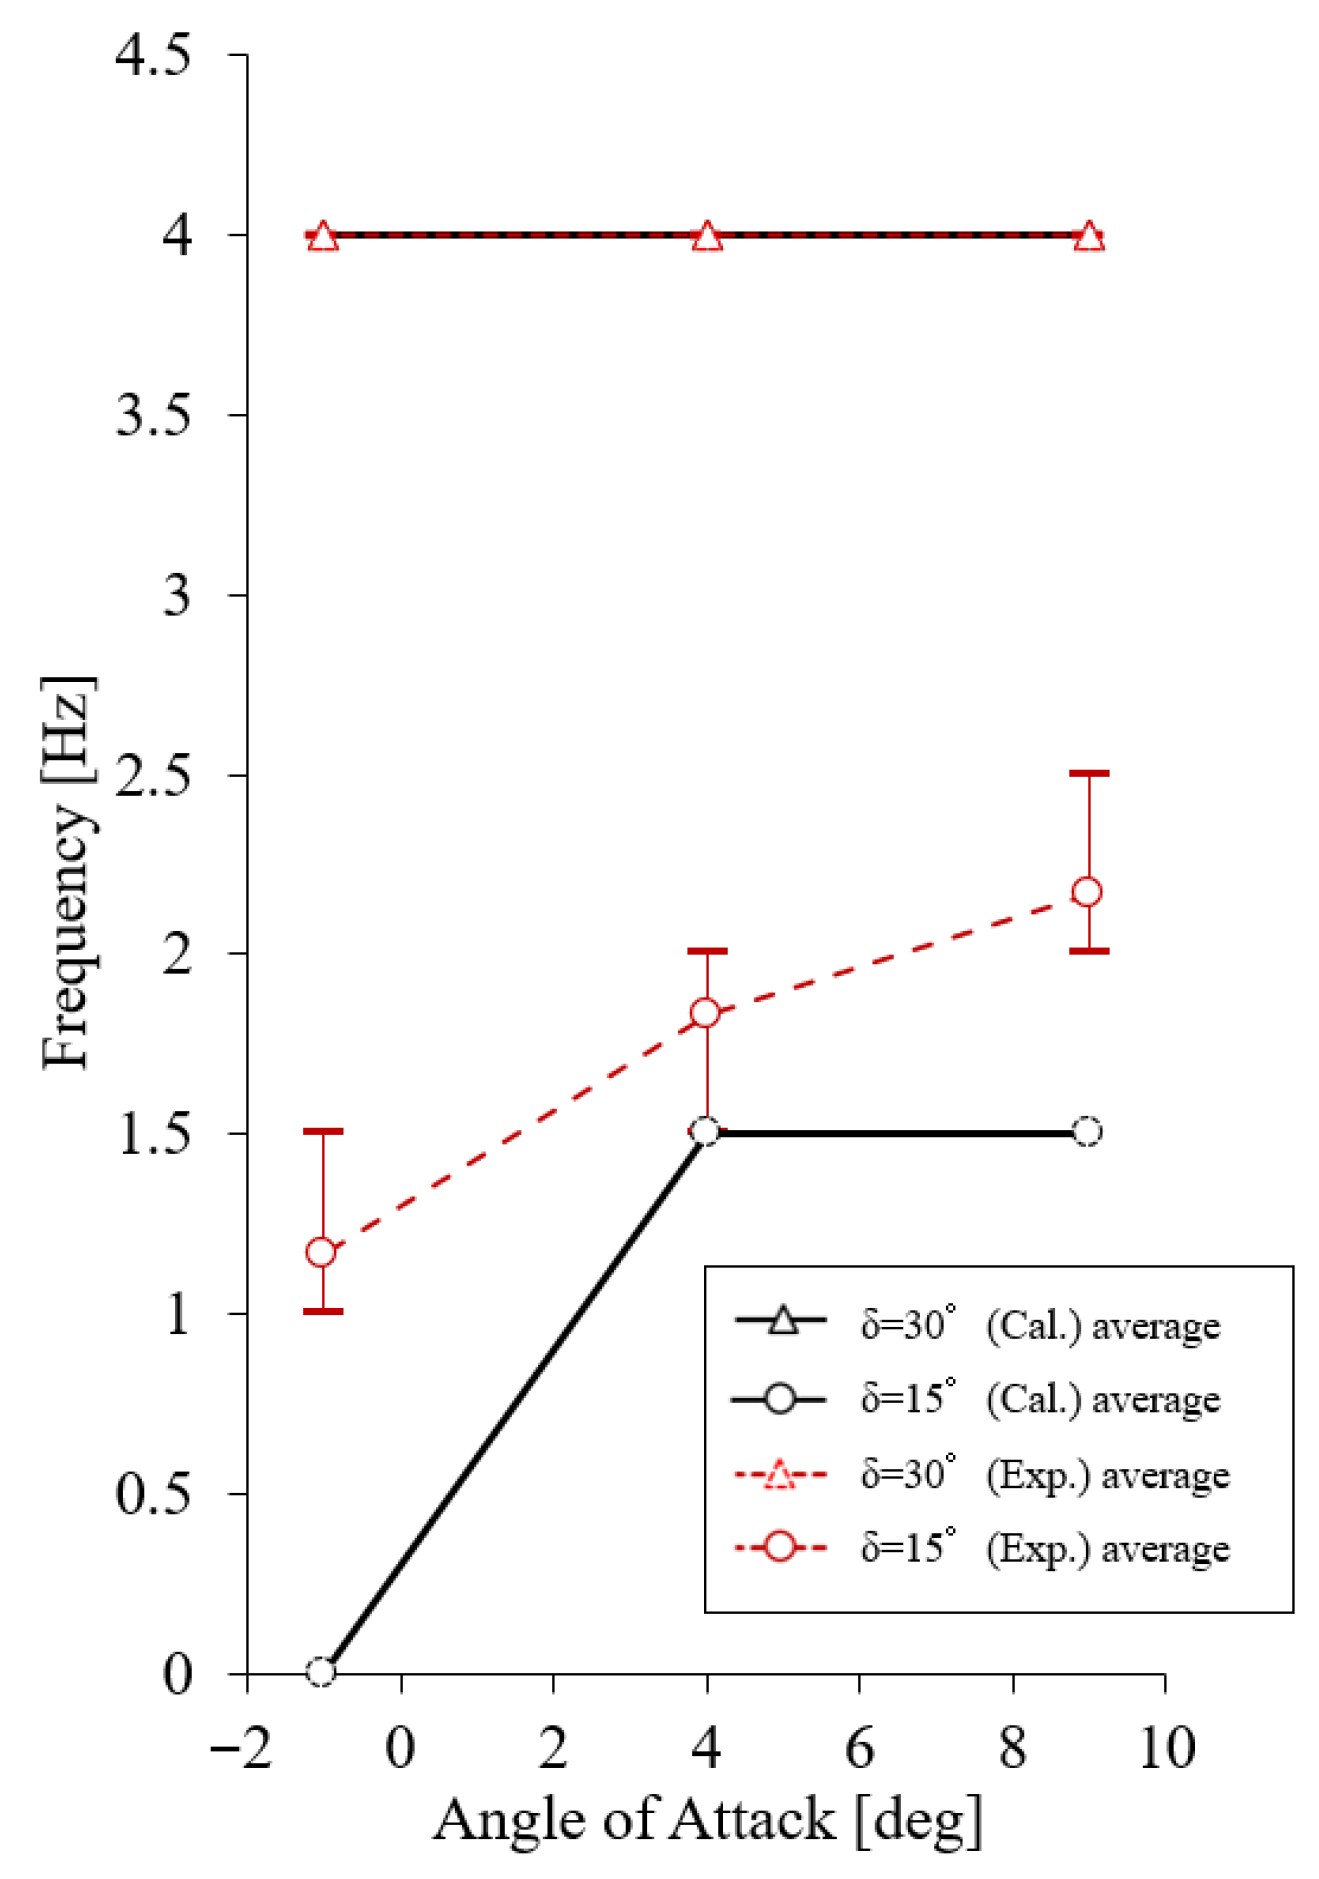
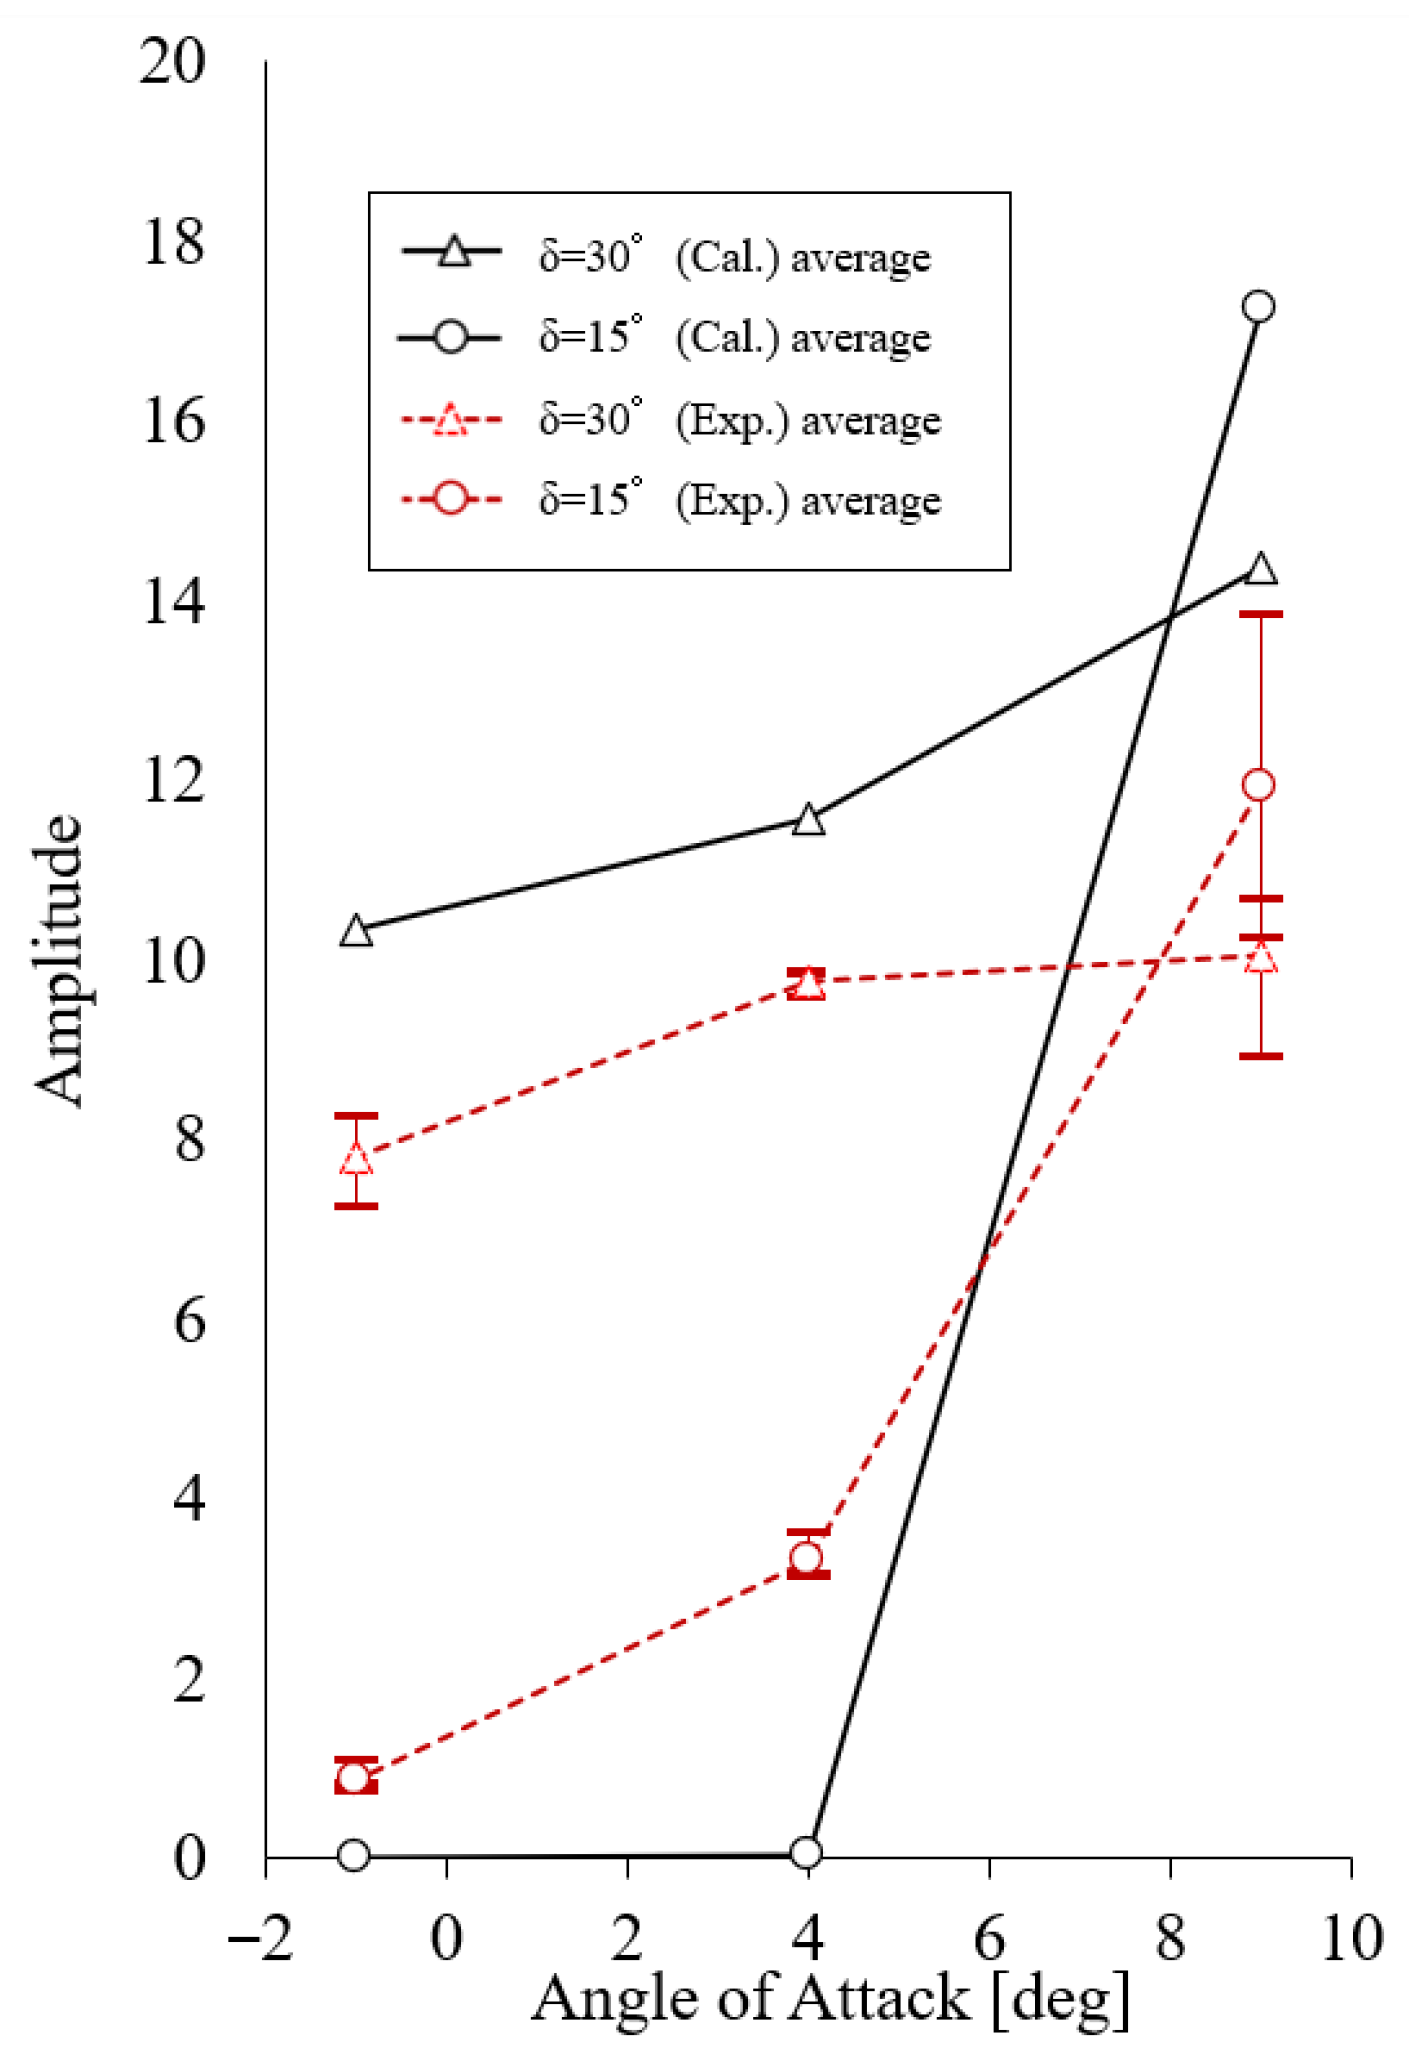
Figure 29 shows the frequency values of the most prominent amplitude, from the FFT analysis of θ 1 . Figure 30 shows the amplitude values obtained from the FFT analysis. In the FFT analysis, the highest and lowest values for each test case are shown above and below the average value, respectively, as error bars. As shown in Figure 29 and Figure 30, the general frequency and amplitude tendencies matched well. High stability was achieved for a hinge-axis angle of δ = 15° in the lower AoA regions; conversely, the oscillation remained prominent for all AoA cases for a hinge-axis angle of δ = 30°. This implies that there is a limit to the hinge angle that enables conversion to be achieved by changing the AoA. Of the tests conducted for each condition, a hinge-axis angle δ = 15° showed a wider error bar. This discrepancy could be the result of heightened sensitivity to angle-of-attack (AoA) settings and wind conditions for the hinge-axis angles, which could result in instability. Alternatively, this could be attributed to inaccuracies in the damping coefficient within the physical models owing to disparities in the handcrafted joints, as mentioned earlier for Figure 26. For a hinge-axis angle δ = 30°, although no conversion was reached in the tested condition, no divergence was observed, as in the δ = 0° case, and a stable oscillation or a “limit cycle” was reached, as shown in Figure 31. This implies that, unlike in the case of hinge-axis angle δ = 0°, with δ = 30°, although a complete convergence may not have been passively achieved, a complete divergence did not occur either, and the chained airplane in that scale and flight condition could continue its flight under stable oscillation, or in a converged stable attitude with only relatively small assistance from the control surfaces and trim.

3.6. C L / C D Comparison of Experimental Results for Stable Wind Flow

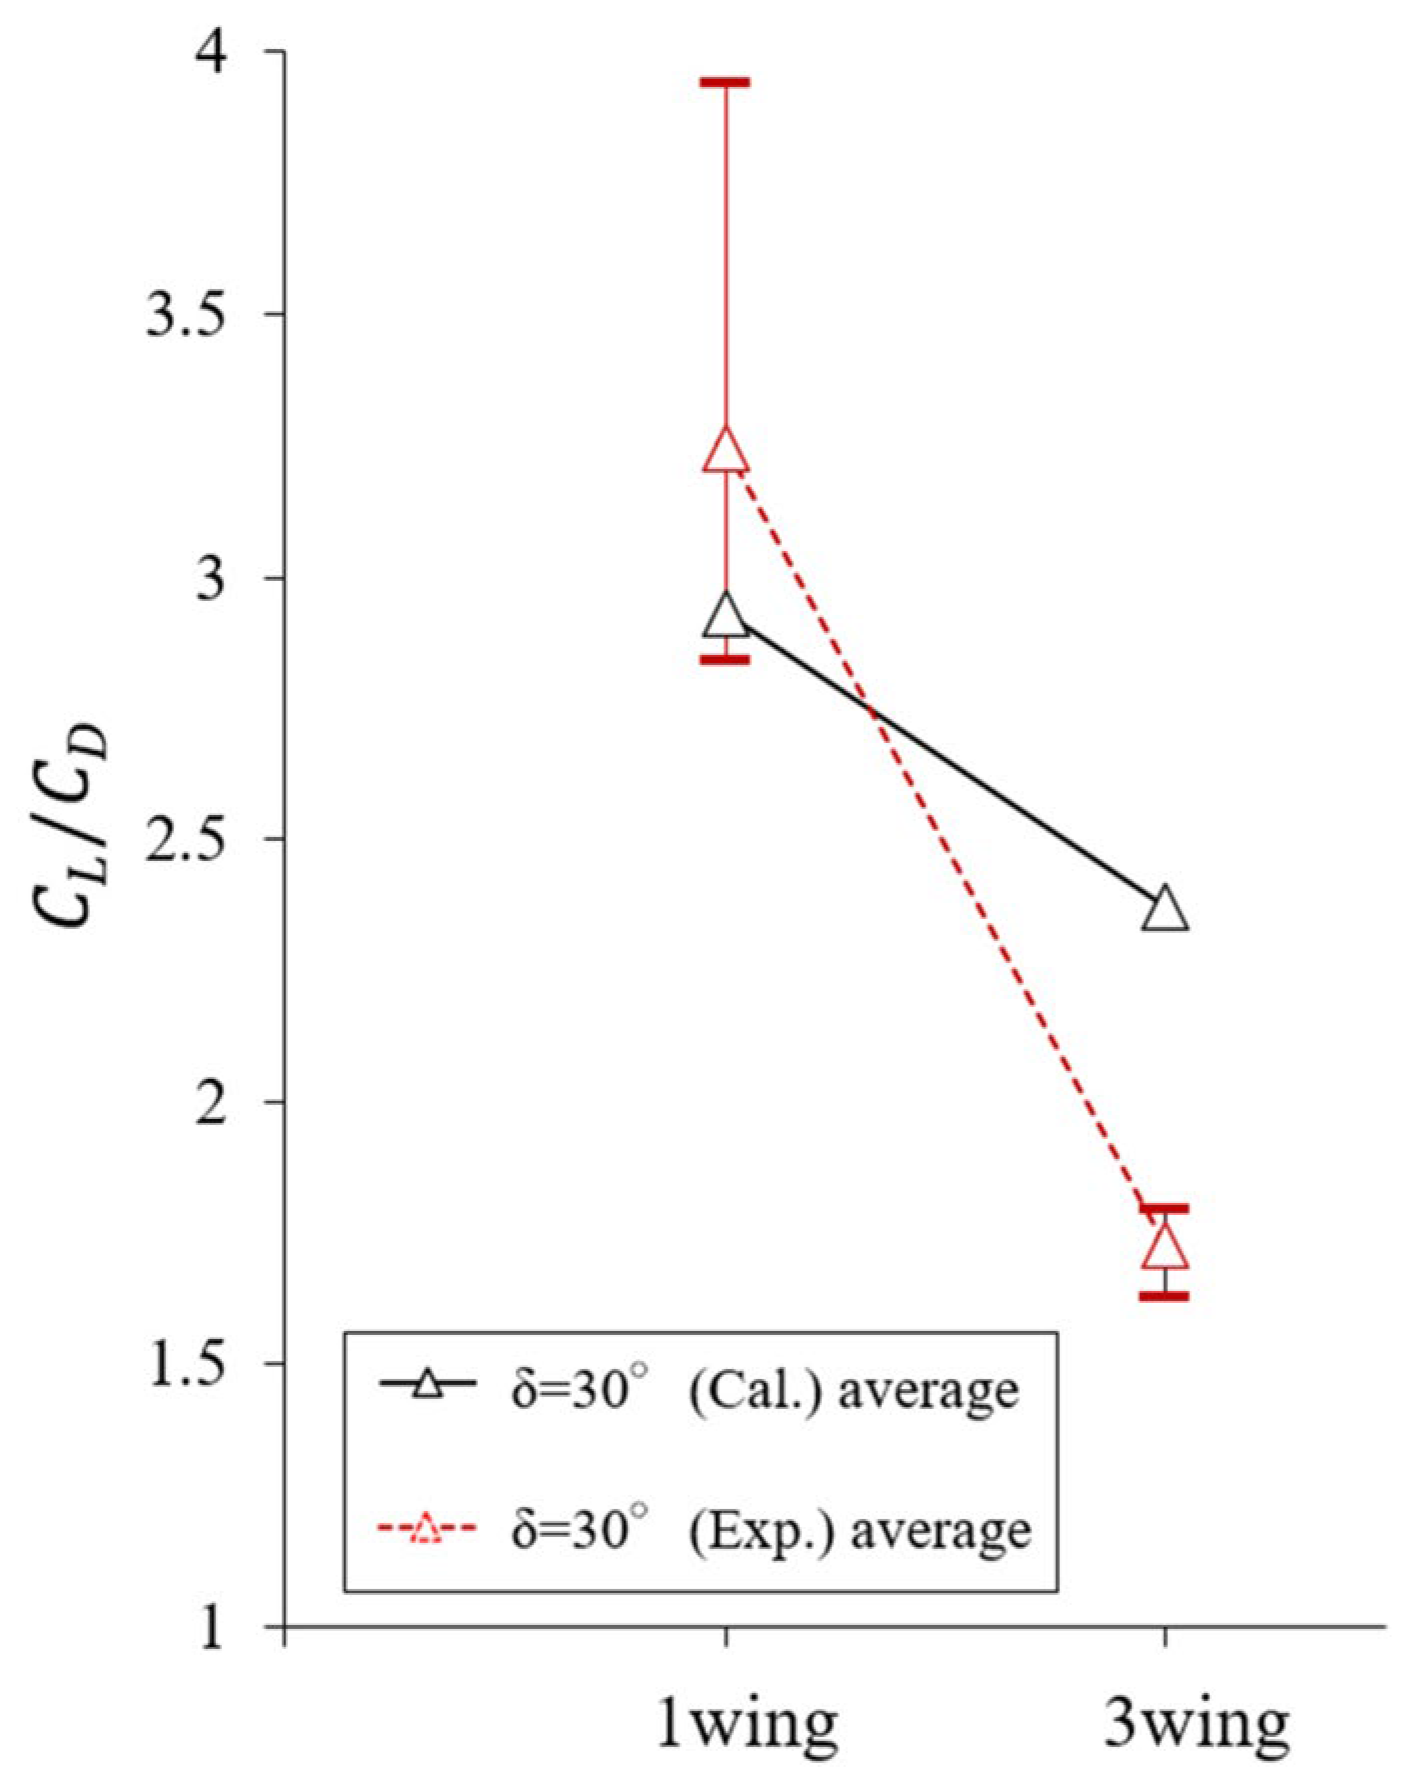
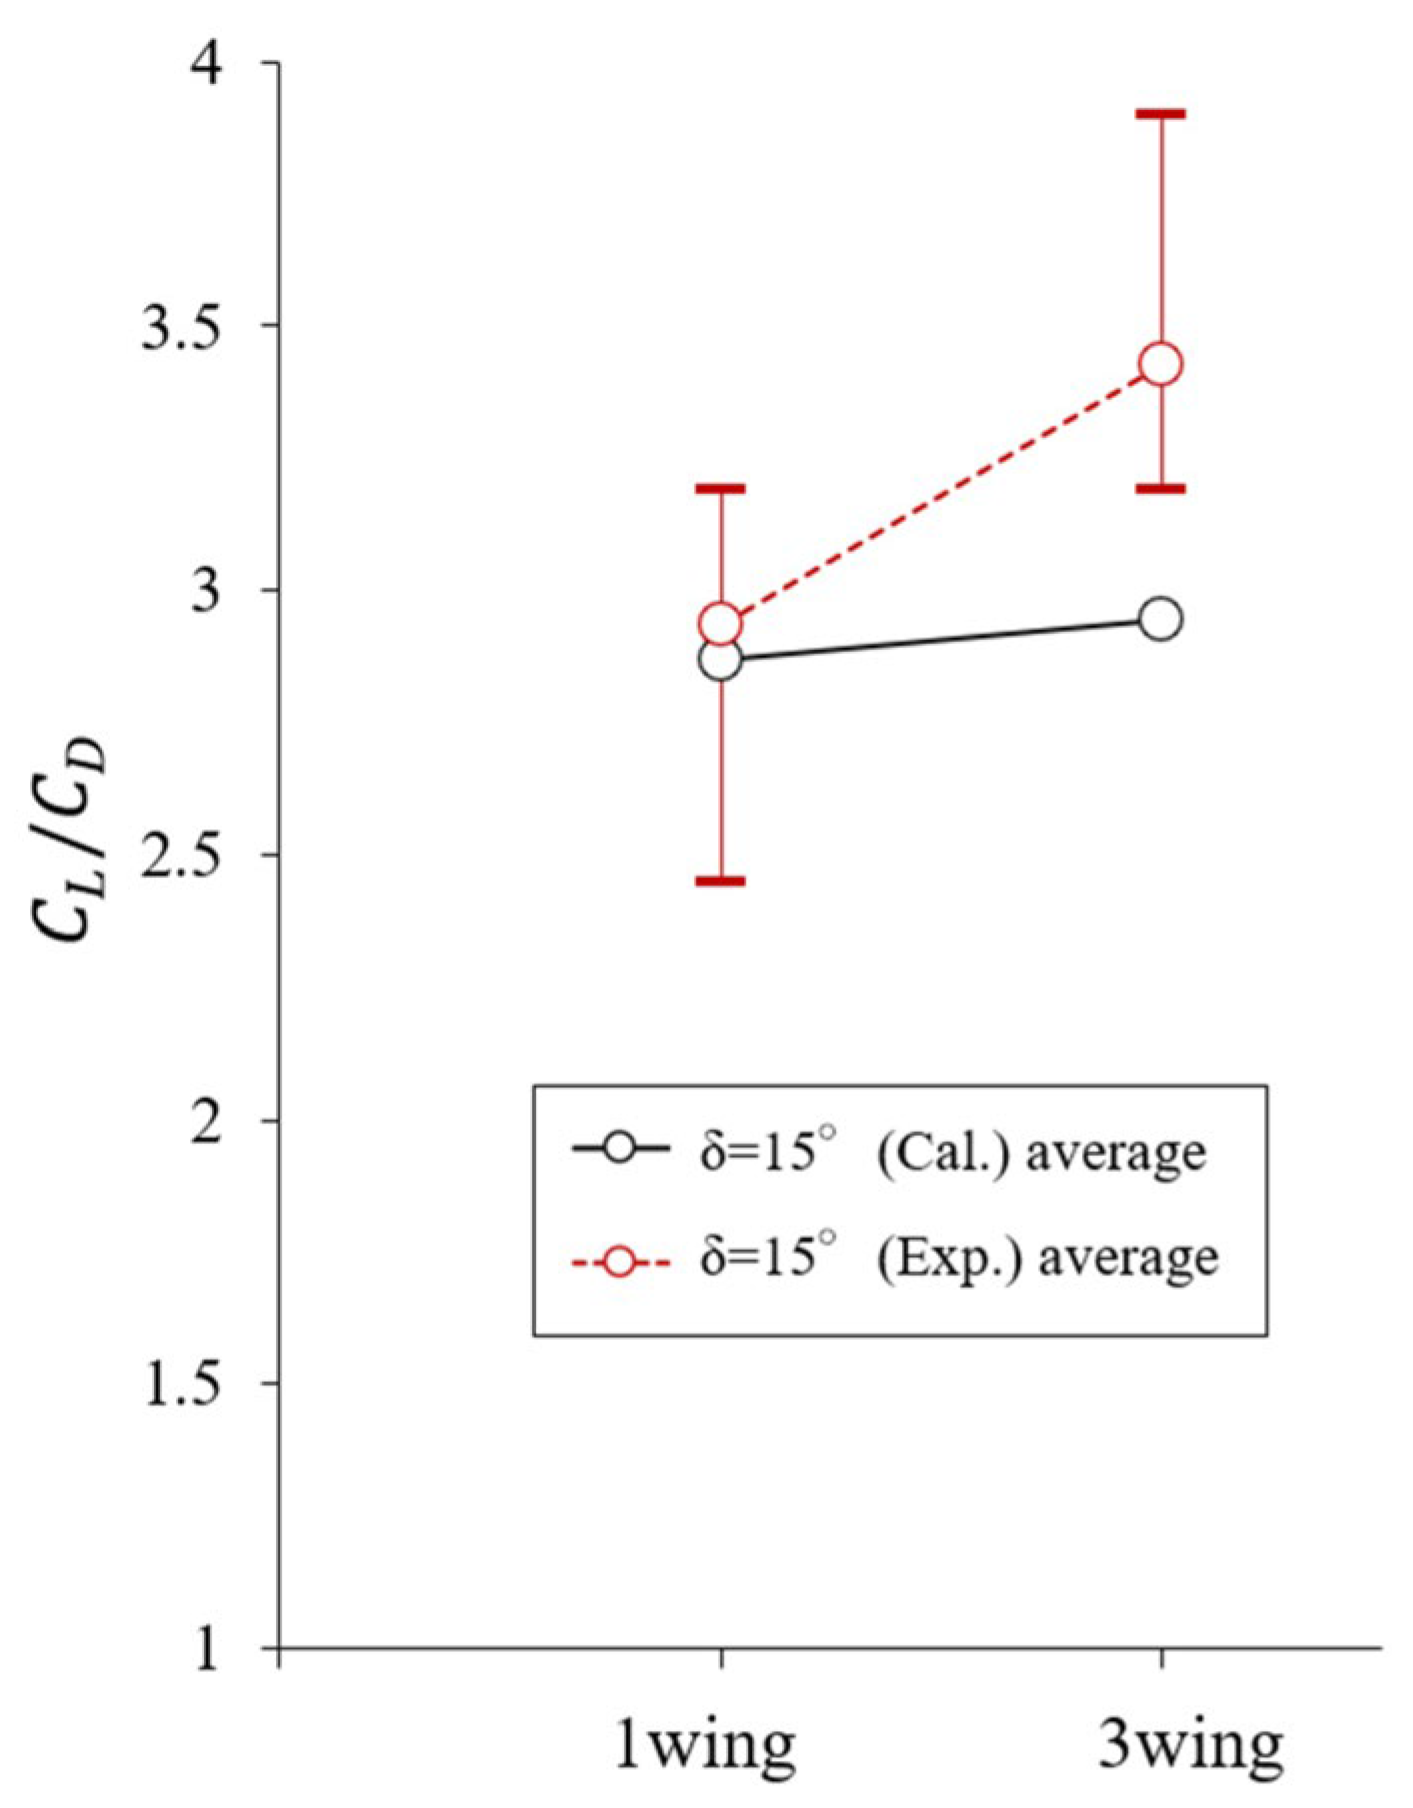
The C L / C D captured by the 6-axis force sensor was compared for the 1-wing and 3-wing chained case for the hinge-axis angle δ = 15° and δ = 30° models. Both experimental results and calculations agreed on the tendencies of the increase and decrease in the overall C L / C D , where an increase was seen for the hinge-axis angle δ = 15° case but a decrease was seen for δ = 30°, as shown in Figure 32 and Figure 33. This implies that sufficient convergence in oscillation is required to increase the efficiency owing to the extended aspect ratio from chaining but also confirms that some efficiency increase can be achieved, even with some oscillations.

4. Theoretical Calculation with No Structurally Induced Hinge Damping

4.1. Comparison of Hinge Axis Angle and AoA with no Structurally Induced Hinge Damping

The 3-wing chained case, mimicking the small-scale low-speed wind tunnel experiment with the damping coefficient set to ζ = 0 instead of ζ = 0.02 acquired from the pendulum experiment, was also calculated to investigate the effect of the damping parameter. The waviness histories for the two damping coefficients for hinge-axis angles δ = 0°, 5°, 15° and 30° are shown in Figure 34. The calculation was started at the initial state of θ = 0 for all 3-chained wings with no motion. It was exposed to no external forces other than the airflow and gravity. As shown in Figure 34, a stable oscillation of moderate intensity or convergence can be achieved at lower AoAs, even with no mechanical damping and only an aerodynamic damping force from the oscillation. However, for a hinge-axis angle δ = 0°, although the waviness seems to converge for AoA = −1°, this simply shows the state where the chained wings are all completely hanging down from the fixed edge, producing no lift, thus not serving as a viable design point.

4.2. Passive Oscillation Stability and C L / C D under 1-, 3- and 9-Chained Wing Flight Configurations

The natural convergences, or the passive stability of the oscillation due to disturbances with different set hinge-axis angles δ and AoA, for the 1-wing, 3-wing and 9-wing chained cases, were compared assuming a typical unmanned small aircraft.
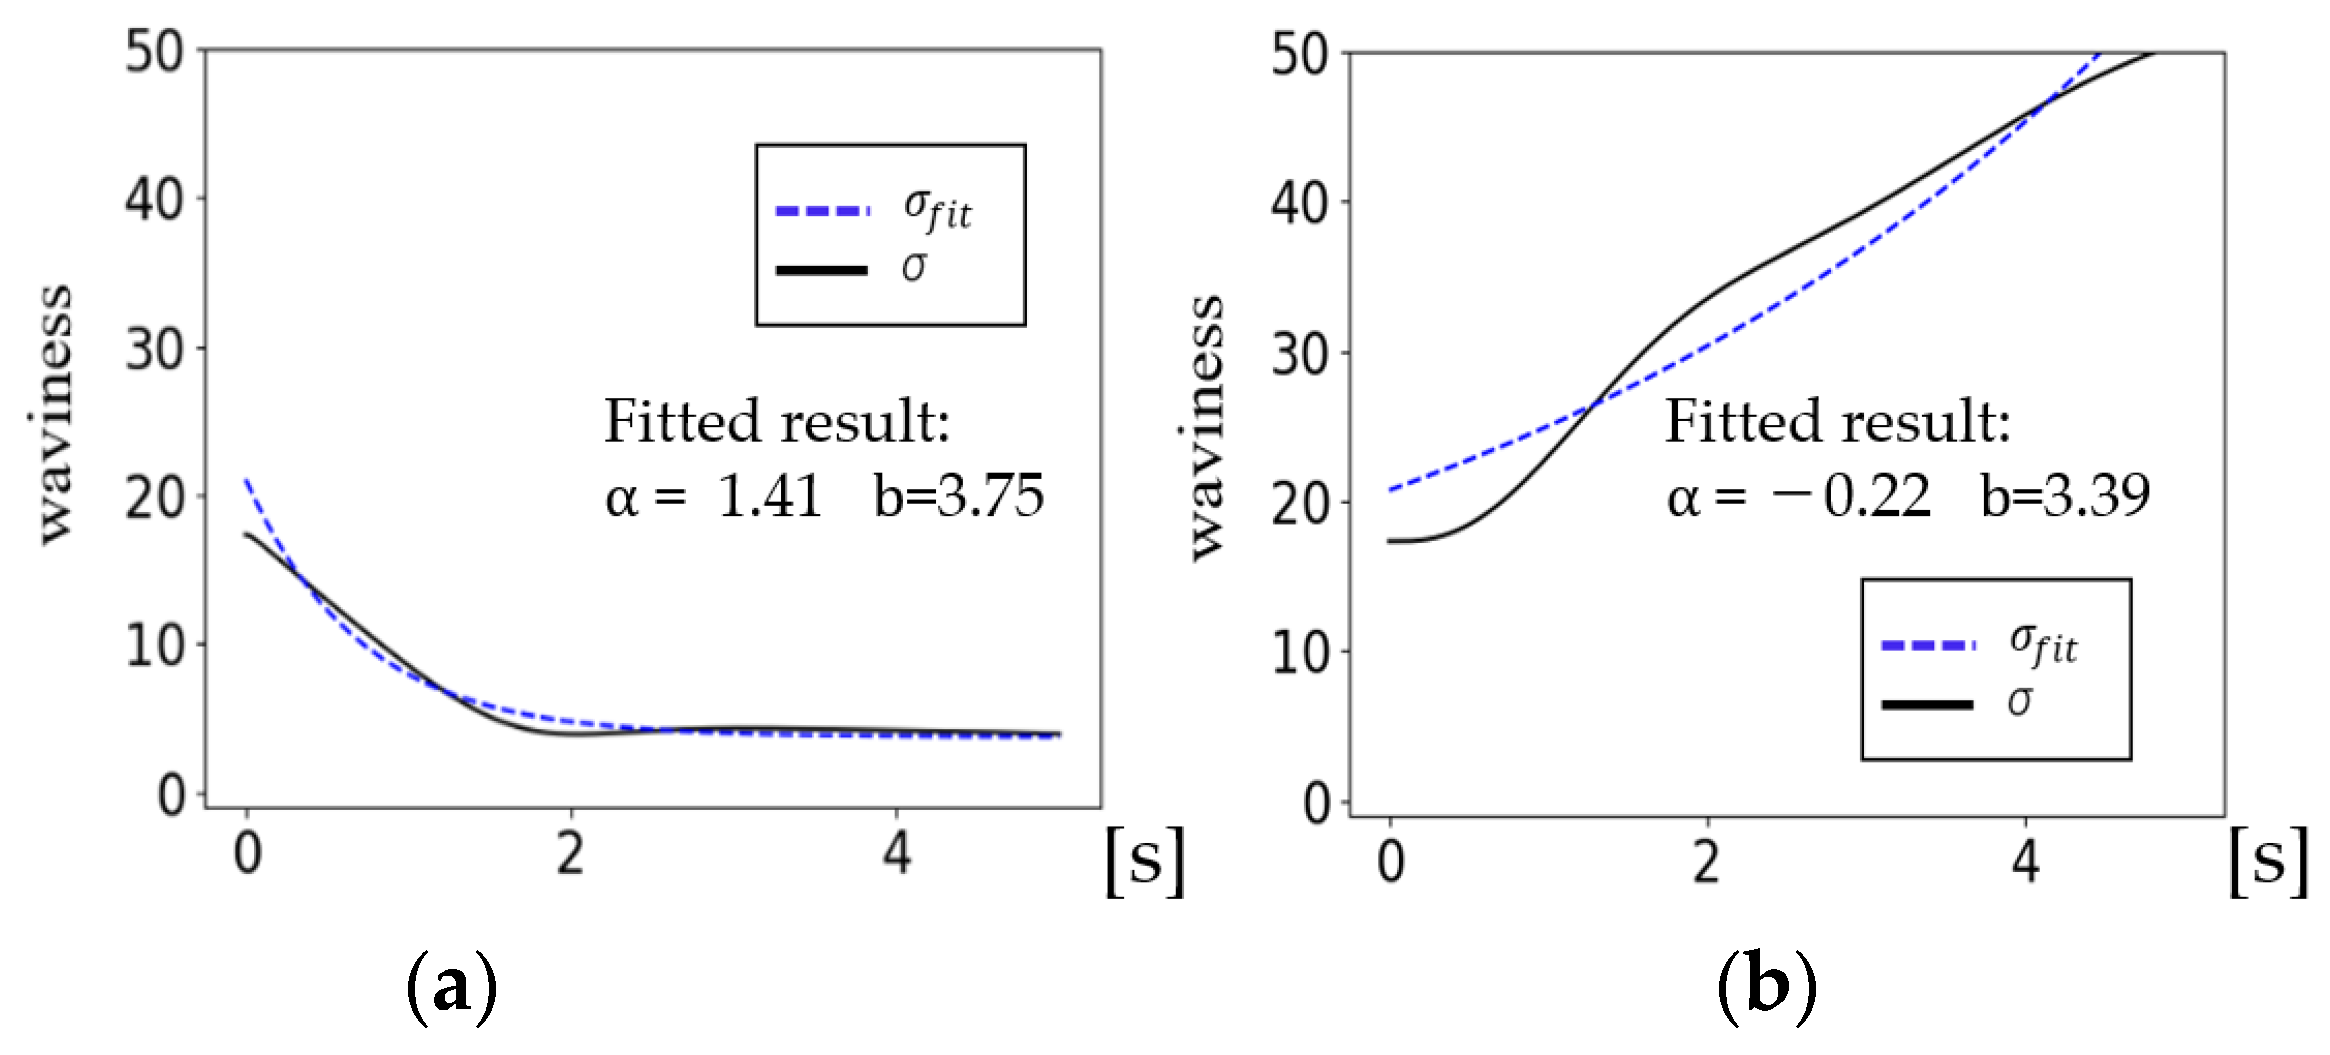
The passive stability of the chained wings was assessed by the parameter “convergence α”. This parameter was acquired by fitting the time history of waviness σ into the σ f i t curve given by Equation (28) below via the non-linear least squares method, as shown in Figure 35. σ i n i represents the initial waviness value of the calculated chained-wing oscillation.
σ f i t = σ i n i · e α t + b .
The initial θ angles were set with the most-free edge wing tip with an initial hinge rotation angle of 30° (or θ 1 ~ θ n 1 = 0 , θ n = 30 °), and the passive oscillation movement was calculated for a 5 s time span for each case. This assumes a case in which a light gust or external force disturbance, such as a rock strike, causes the wing tip to rotate during flight.
Convergence α is similar to the inverse of the typical “time constant”, although slightly different in that the minus value is also referred to as information. The convergence or, in other words, the passive stability is judged as more favorable when the α value is larger and undesirable under α = 0.
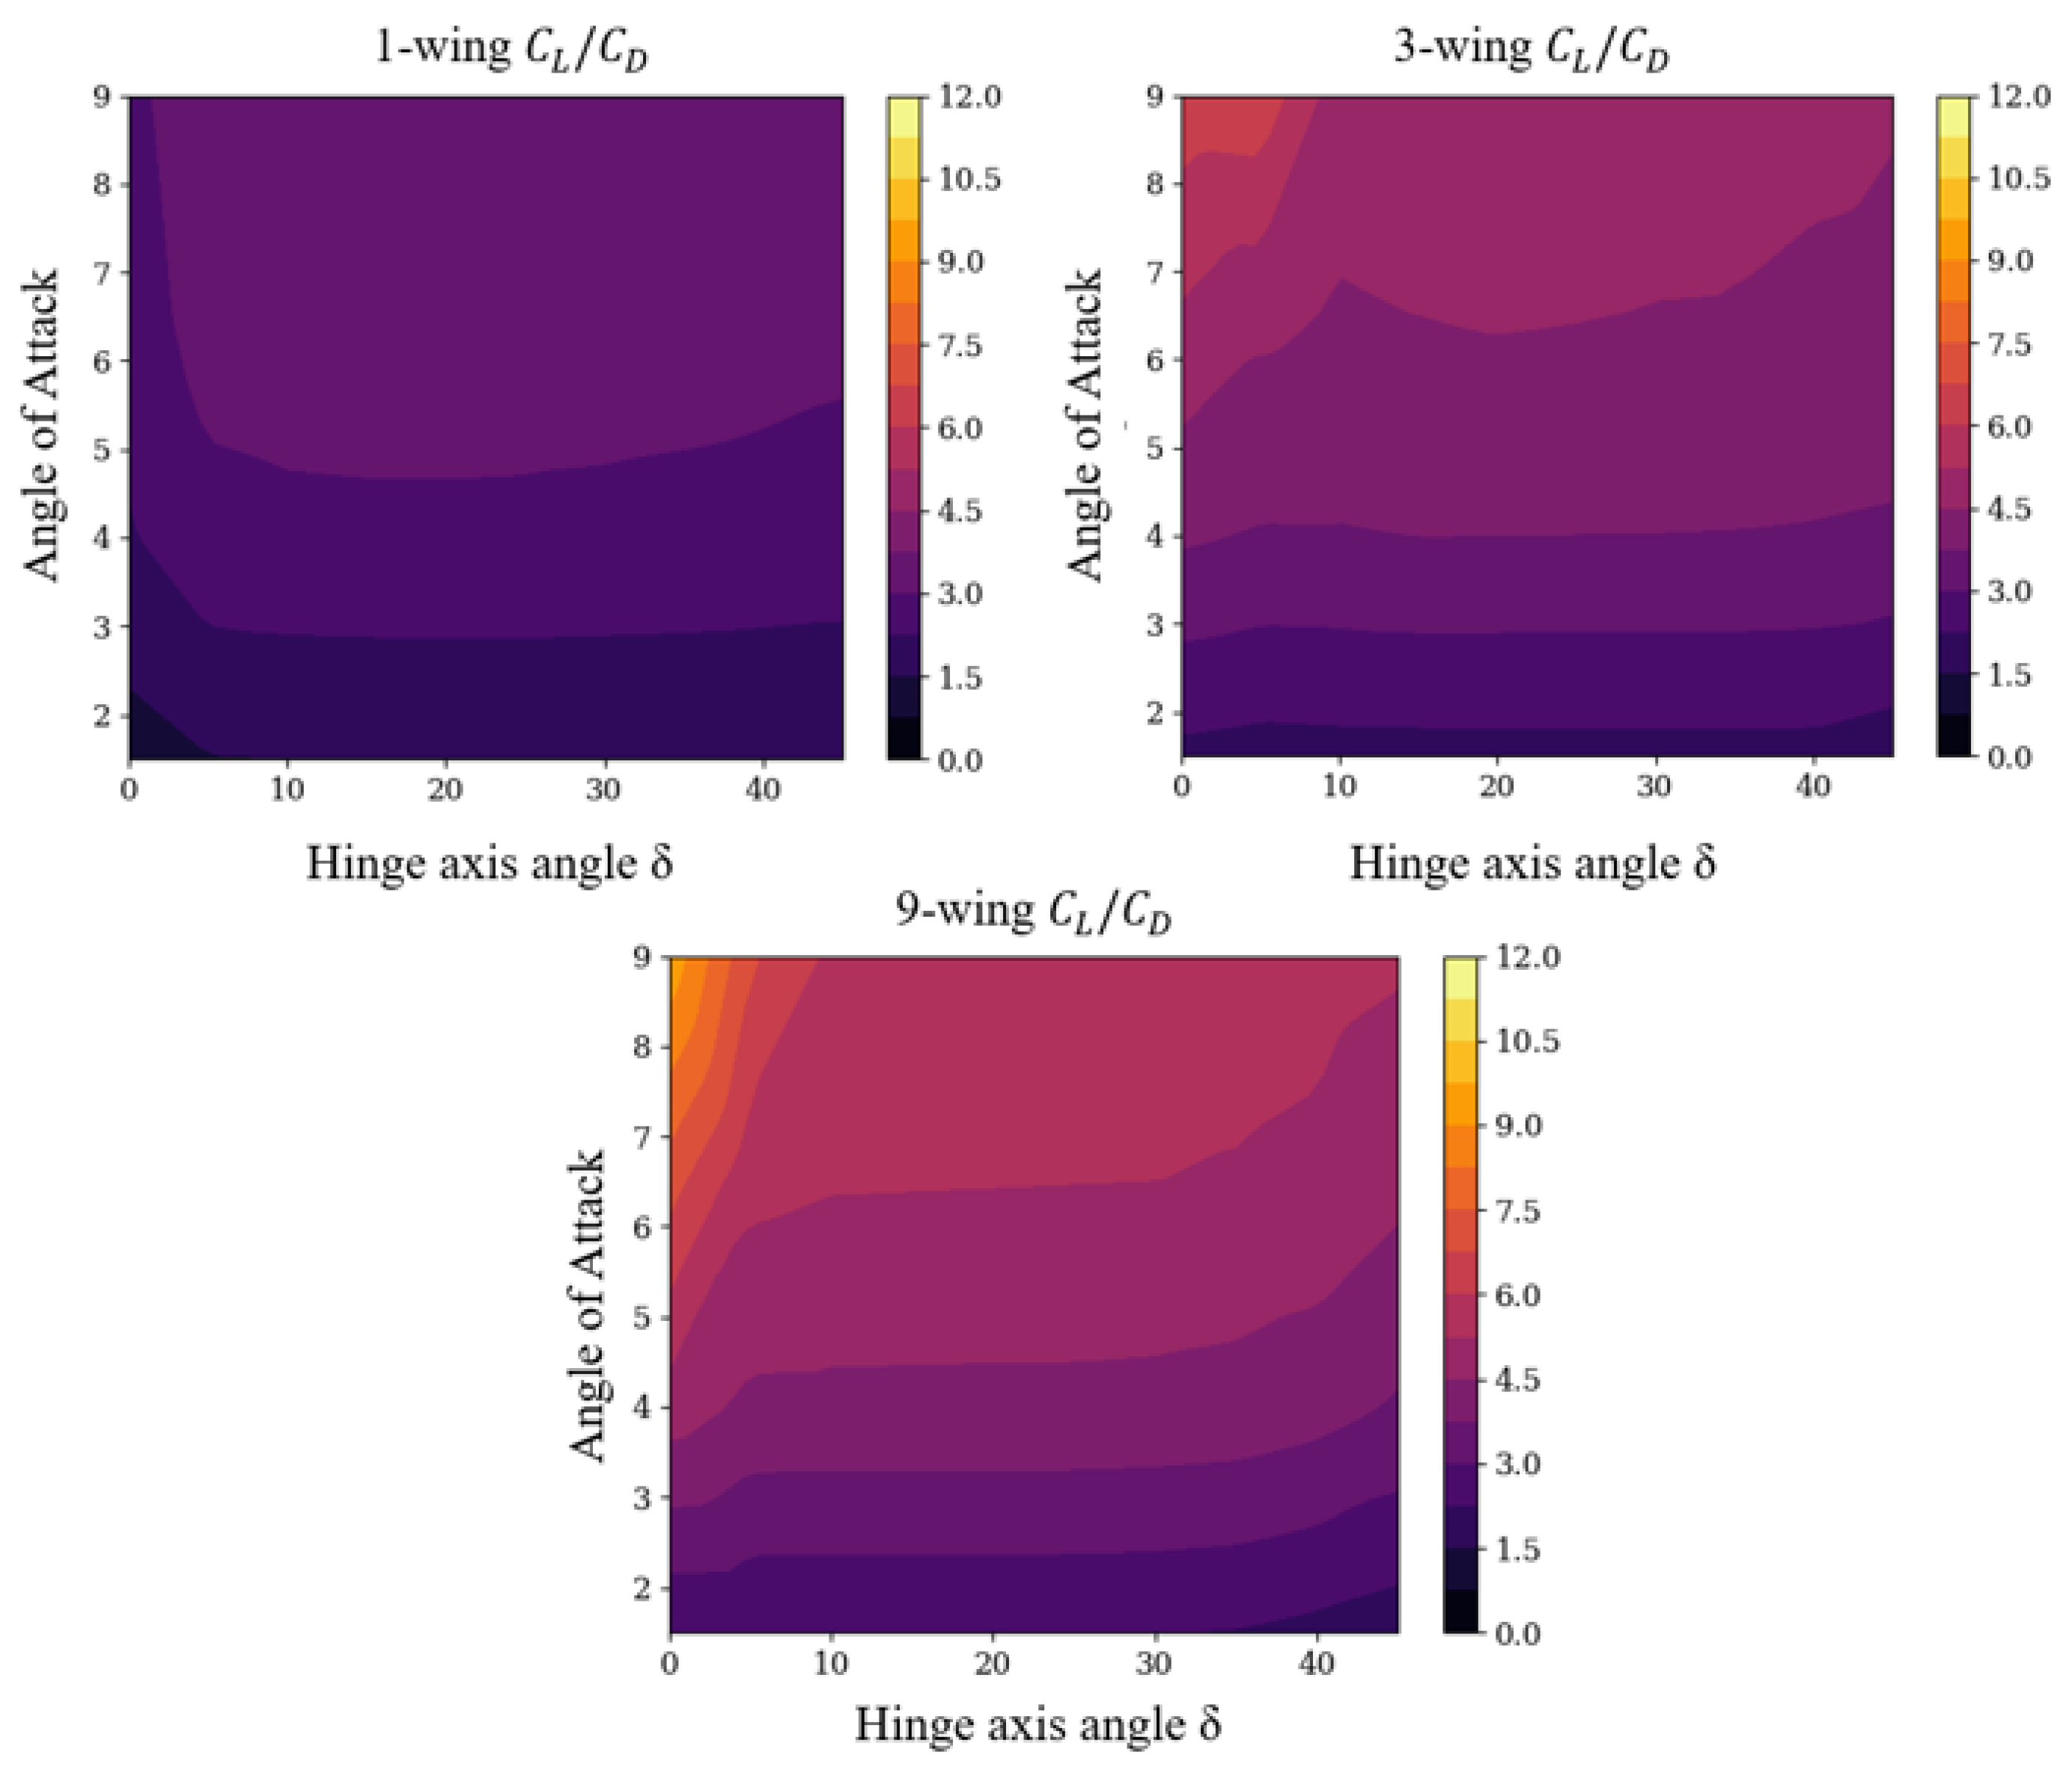
The hinge-axis angles δ and AoA were calculated at 5° and 1.5° increments, respectively, and the convergence values α for each setting were linearly interpolated to create a contour map for assessment. Each wing section, that is, a single wing section, had a span length of 1.5 m and a chord length of 0.5 m. The hinge section between these wings measured 0.5 m in the span direction for every joint. Each wing section had a constant mass of 1.5 kg. The freely rotating hinge was assumed to have an ideal smoothness, with the structural damping coefficient set to ζ = 0, to observe the pure theoretical effect of the aerial force and gravity effects working on the hinges for passive oscillation damping. The wind flow speed was set so that the lift would match the total weight of the wing when completely straight and the θ i = 0 ( 1 i 3 ) , for that given base AoA setting, assuming “flight speed” instead of a fixed-speed wind flow. The calculation results are presented in Figure 36. The red broken line represents convergence (α = 0 line) and the threshold where passive convergence could be achieved without relying on any structural damping ζ.
As can be seen from these graphs, the hinge-axis angles give the best convergence shift with different chain numbers, with the high-convergence region moving towards the lower hinge-axis angles with more wings chained together.
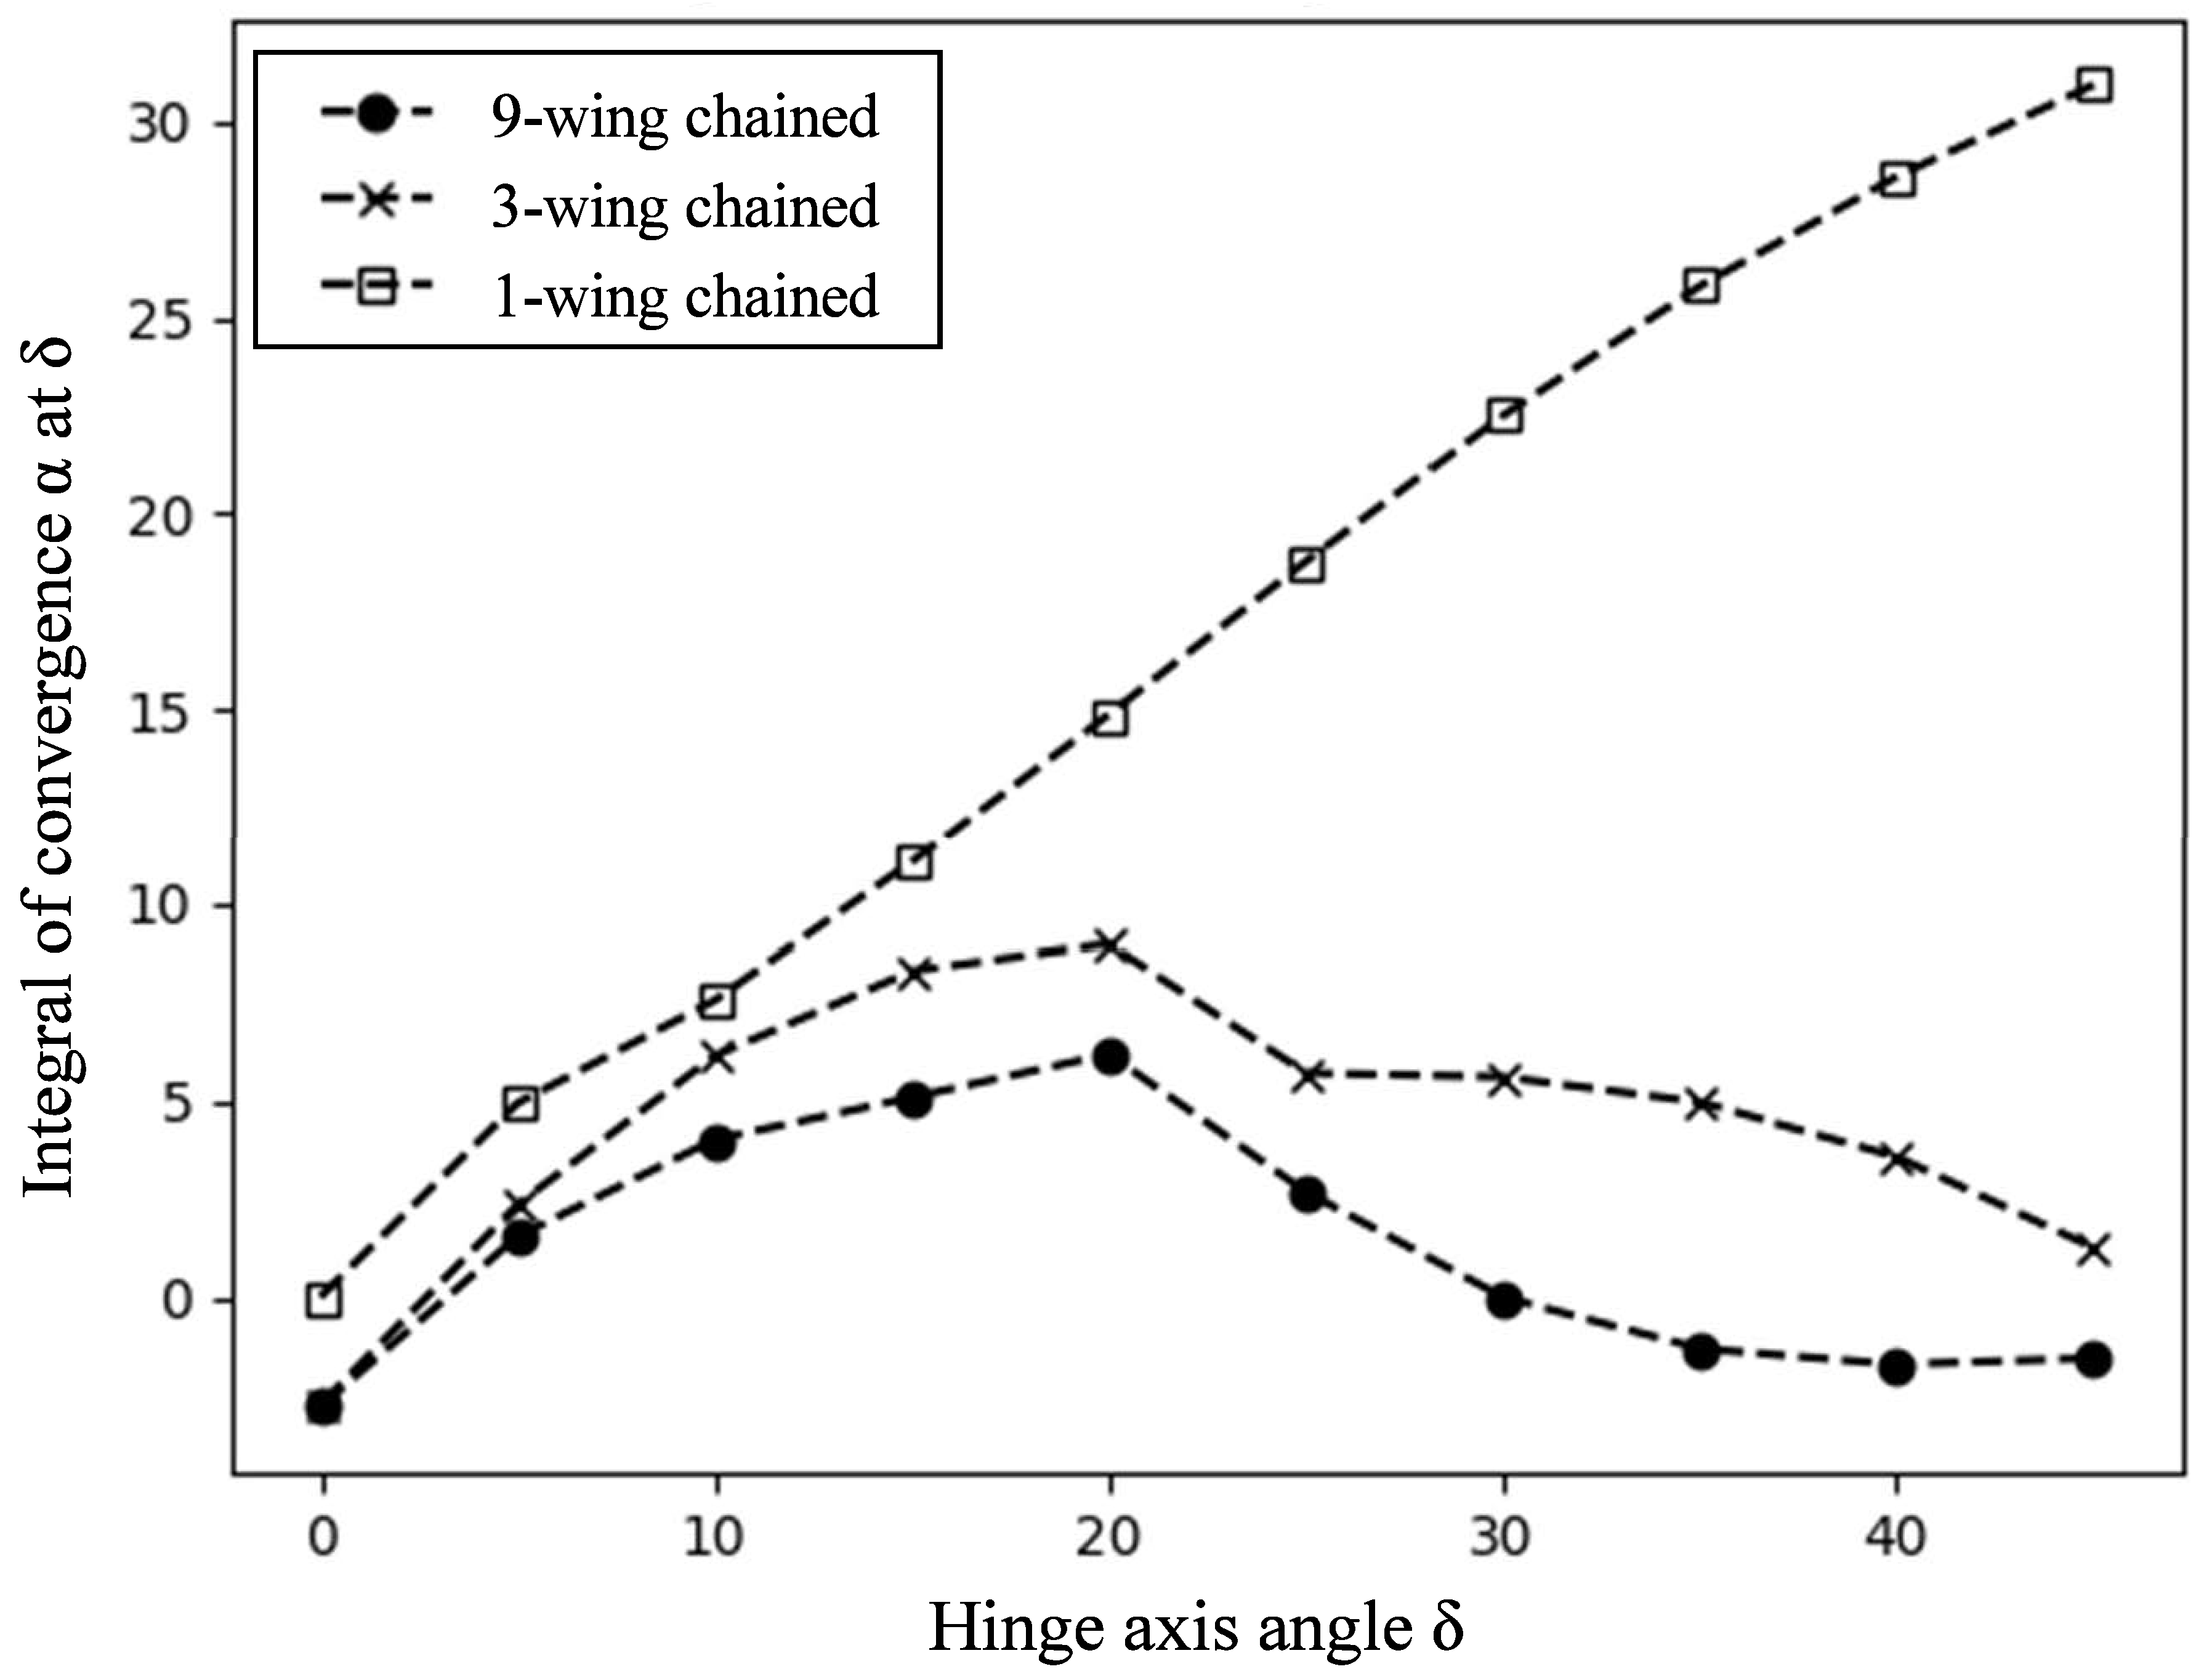
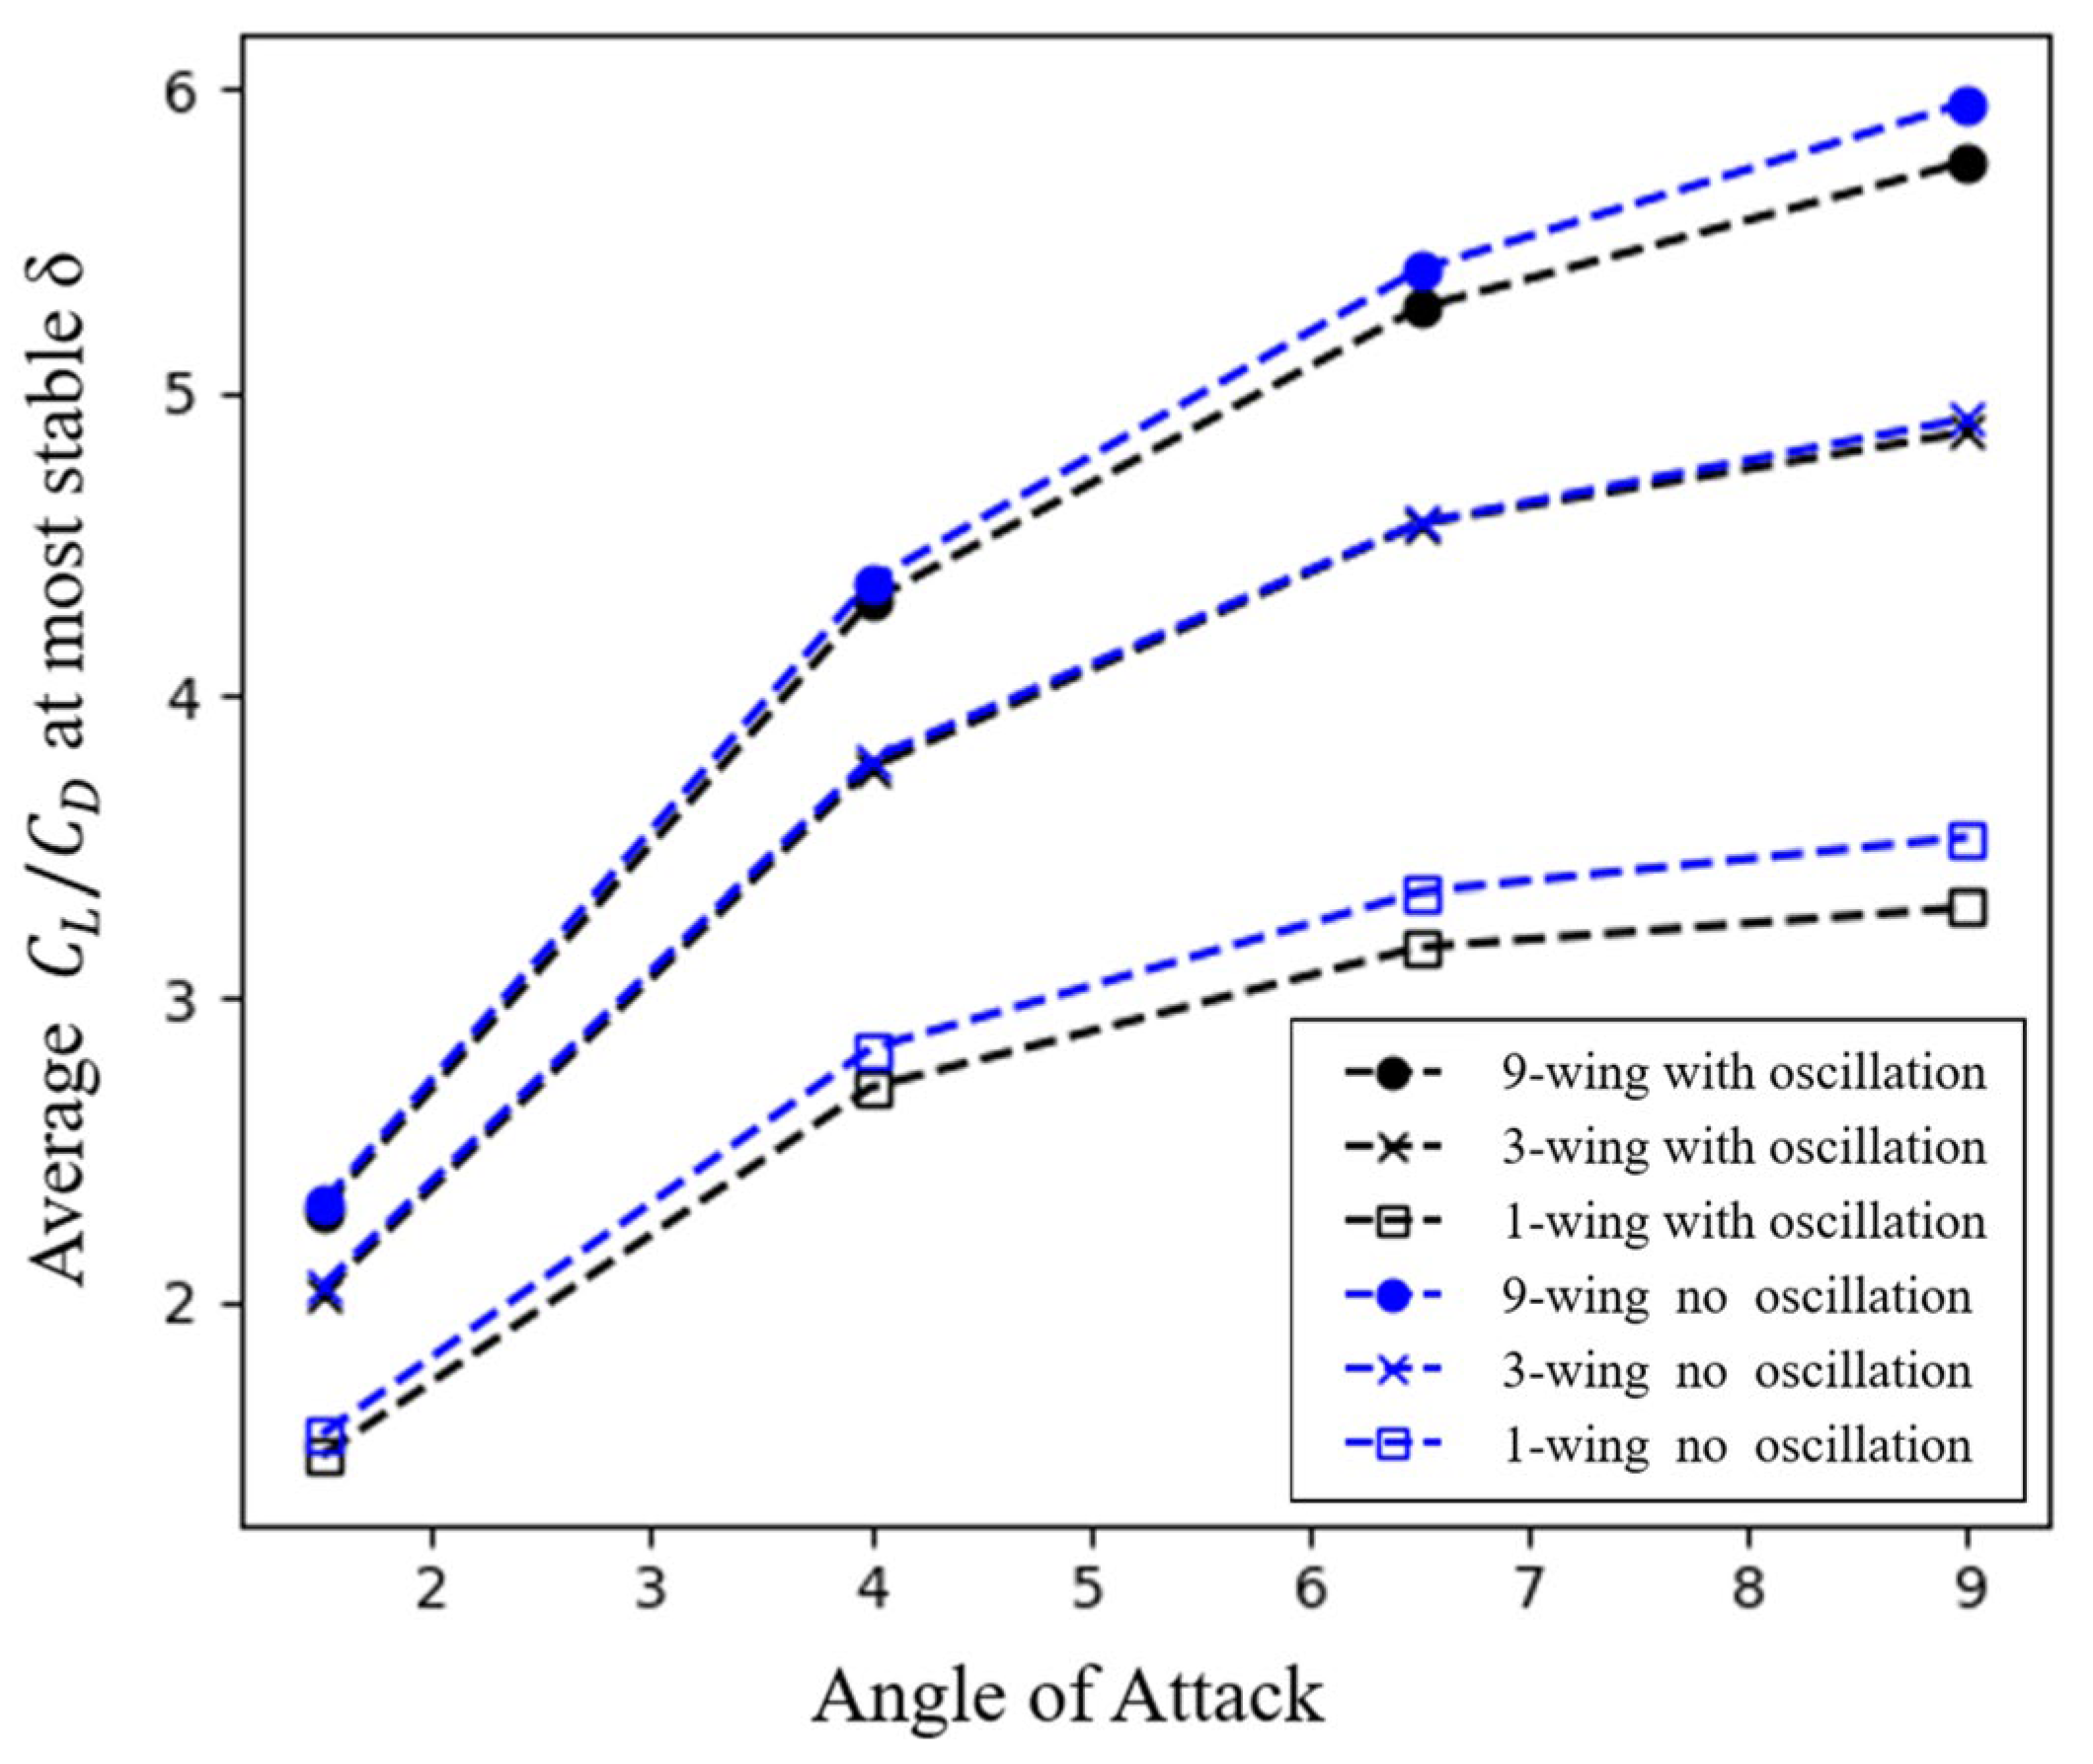
With the increase in chained-wing numbers, a convergence limit of α = 0 for the lower hinge-axis angle δ shown in the red broken line shifted only minutely towards the higher angle; however, the higher-convergence limit line for the hinge-axis angle moved drastically to the lower side. For different chained-wing numbers, the convergence was generally stronger with lower AoAs, where the airspeed was higher to achieve enough lift for flight. However, the range between the higher and lower limits of δ was slightly broader at around the medium AoA = 4°~6° range. Figure 37 shows the integral of the calculated convergence α values along the AoA axis at the hinge-axis angle δ. The highest integral values for the 1-wing chained, 3-wing chained, and 9-wing chained configurations were δ = 45°, 20°, and 20°, respectively, implying that these angles would perform best when aiming to achieve the highest passive stability across this AoA range of interest. Figure 38 shows the average total C L / C D during the oscillation for the same calculation cases. Figure 39 shows the C L / C D vs. AoA for the hinge-axis angle δ (δ = 45° for 1-wing, δ = 15° for 3-wing and 9-wing) with the highest passive stability or convergence α value and comparison with the fixed-hinge, no-oscillation case. At the calculated level of oscillation, the C L / C D increase due to chaining could still be achieved, although it was slightly lower than the ideal increase when all the hinges were fixed and there was no oscillation.

5. Conclusions

In this study, the authors focused on the passive wing oscillation characteristics of an unconventional design concept in which several fixed-wing airplanes were chained by their wing tips using freely rotating hinges to create a single pseudo large-span airplane. Numerical calculations were performed by combining the VLM with a modified equation of motion for multi-linked rigid pendulums, striking a balance between computational cost and accuracy. The proposed method using numerical calculations was validated using chained flat wings in a small-scale low-speed wind tunnel and was confirmed to capture the oscillation trend well, although the flow state, that is the relative AoA, was outside the typical scope of VLM usage during some instances in the tested cases. This is the result of the complicated mechanisms of flow separation and reattachment effect of the wing “heaving” towards the air flow and increasing the average C L in AoA areas where it would typically drop drastically in a laminar flow [37,38]. Although not exactly accounting for this phenomenon, this effect is thought to have led to a reduction in the discrepancy between the VLM-calculated results and the actual experimental wing oscillation results in relatively high AoA regions.
The following are the main insights obtained from wind tunnel experiments and numerical calculations:
  • Experiments and calculations confirmed that an increase in C L / C D could be achieved, even without complete convergence of the oscillation of the chained wings if the oscillation was sufficiently maintained passively.
  • Calculations showed that even if the rotational hinges had no structural damping ζ with an ideal smooth freely rotating hinge joint, passive oscillation convergence could still be achieved just by aerodynamic force for different numbers of chained wings with the appropriate selection of AoA and hinge-axis angle δ and without any active control.
  • There is a lower and upper limit to the hinge-axis angle δ that would enable the oscillation to converge completely passively. The lower limit changed only slightly as the chained number increased, but the upper limit changed drastically and decreased with an increase in the chained-wing number.
  • In the unmanned airplane case of each wing section span including the joints of the joint airplane being 2 m in length and 1.5 kg in weight, the hinge-axis angles δ that would provide the best passive convergence for the 1-wing, 3-wing, and 9-wing chains were δ = 45°, 20°, and 20°, respectively.
  • Under stable wind flow, if the hinge-axis angle was δ = 0°, there would be no convergence, and the oscillations of the chained wings would diverge, but with a higher hinge axis angle, in a certain range, passive convergence or a stable limit cycle oscillation (LCO) could be achieved without diversion.
  • A higher AoA leads to a higher oscillation frequency and amplitude and a lower likelihood of achieving passive oscillation convergence.
The insights above demonstrate that when parameters, such as hinge-axis angles δ, AoA, and flight speed, are chosen appropriately, wing-tip-chained airplanes can achieve a sufficiently high C L / C D compared to when they are not chained together. Good hinge designs will allow this while maintaining no or minimum oscillation around its free-rotating hinges with minimum or no active control to achieve a straightly stretched long-span wing.
Although the achieved C L / C D increase may not be exactly as high as a single rigid long span with the same total length as the chained wings, considering the other potential merits of the hinges, such as load distribution, flexibility, and operations with different chained numbers, the wing-tip-chained airplane concept is expected to be a viable option for future long-span wing aircraft.
However, it should be noted that this research focused on a wind tunnel situation, with one wing edge fixed to a wall. More detailed calculations and experiments with realistic wing shapes and flow conditions, including free flight with both wing edges free, should be conducted in future studies as the next step.

Author Contributions

Conceptualization, Y.S. and K.S.; methodology, Y.S.; software, Y.S.; validation, Y.S.; formal analysis, Y.S.; investigation, Y.S.; resources, Y.S. and K.S.; data curation, Y.S.; writing—original draft preparation, Y.S.; writing—review and editing, Y.S. and K.S.; visualization, Y.S.; supervision, K.S.; project administration, Y.S. and K.S.; funding acquisition, Y.S. All authors have read and agreed to the published version of the manuscript.

Funding

This research was funded by Japan Society for the Promotion of Science (JSPS), Doctoral Course (DC1) Research Fellowships grant number 202120691, and International Graduate Program for Excellence in Earth-Space Science, The University of Tokyo (IGPEES, UT). The APC was funded by JSPS.

Data Availability Statement

The datasets presented in this article are not readily available because the data are part of an ongoing study and due to time limitations. Requests to access the datasets should be directed to the corresponding author.

Acknowledgments

The authors wish to thank the Japan Society for the Promotion of Science, Doctoral Course (DC1) Research Fellowships and the International Graduate Program for Excellence in Earth-Space Science (IGPEES) for funding this research, providing access to many opportunities to gain knowledge, and receive advice that could not have been possible otherwise. The authors would like to express their gratitude to their families, colleagues, mentors, and others who provided them with support during the publication of this work.

Conflicts of Interest

The authors declare no conflict of interest.

Abbreviations

Nomenclature
δjoint hinge axis angle to plane direction C aerial calculation coefficients
θrotation angle of wing around hinge axis ζ structural damping coefficient
σ“waviness” calculated from all the θα“convergence” for passive oscillation stability
mmass of each joint wing or rigid beamrcoordinates for the center of rigid beam
ggravitational accelerationeunit vector
Daerial dragacoefficient defined during calculation
Laerial lift bcoefficient defined during calculation
Maerial moment Wdownwash velocity for drag calculation
Ttranslational force from adjoining beamΓvortex density of horseshoe vortex
nnumber of total panels(or: unit vector perpendicular to panel)ρair density (or: rigid beam density per length)
Vvelocity at a certain panel
Imoment of inertia of rigid beamUvelocity at wing section during swinging test
SSurface area of each wing sectionllength of distance between hinge axes
ttime
Subscripts
ijoint airplane number/panel numberrdirection parallel to the beam
jjoint airplane number/panel numbertdirection perpendicular to the beam
kjoint airplane numberLlift
localrelative flow speed due to motion Dtotal drag
pendfor motion of pendulum calculation D0parasite drag
vlmcoefficients related to VLM calculationDindinduced drag
fitfitted curvedswingdrag for flat plate perpendicular to flow
iniinitial

References

  1. Makino, M. Fundamentals of Aerodynamics, 3rd ed.; Sangyotosho: Tokyo, Japan; pp. 153 and 264. (In Japanese)
  2. Shearer, C.M.; Cesnik, C.E.S. Non-linear flight dynamics of very flexible aircraft. J. Aircr. 2007, 44, 1528–1545. [Google Scholar] [CrossRef]
  3. Hasan, J.Y.; Roeser, S.M.; Hepperle, M.; Niemann, S.; Voß, A.; Handojo, V. Flight mechanical analysis of a solar-powered high-altitude platform. CEAS Aeronaut. J. 2023, 14, 201–223. [Google Scholar] [CrossRef]
  4. Carre, D.A.; Teixeira, P.; Palacios, R.; Cesnik, C.E.S. Non-linear response of a very flexible aircraft under lateral gust. In Proceedings of the International Forum on Aeroelasticity and Structural Dynamics 2019, IFASD 2019, Savannah, GA, USA, 10–13 June 2019. [Google Scholar]
  5. Gonzales, A.A.; Corpus, C.J.; Hall, D.W.; Parks, R.W. Development of a useful mars airplane exploration concept at NASA/ames research center. In Proceedings of the 6th Mars Society Conference, League City, TX, USA, 14–17 August 2003. [Google Scholar]
  6. Karpovich, E.; Kombaev, T.; Gueraiche, D.; Evdokimova, D.; Alexandrov, K. Long-Endurance Mars Exploration Flying Vehicle: A Project Brief. Aerospace 2023, 10, 965. [Google Scholar] [CrossRef]
  7. Lyu, M.; Zhao, Y.; Huang, C.; Huang, H. Unmanned Aerial Vehicles for Search and Rescue: A Survey. Remote Sens. 2023, 15, 3266. [Google Scholar] [CrossRef]
  8. Suenaga, Y.; Suzuki, K. Study on Mars exploration utilizing many wing-tip-chained airplanes. In Proceedings of the 64th Space Sciences and Technology Conference, 3K04, Online, 27–30 October 2020. (In Japanese). [Google Scholar]
  9. Suenaga, Y.; Suzuki, K. Preliminary analysis of the aerodynamic characteristics and flight dynamics of wing-tip-chained airplanes. JAXA-Sp. 2020, 19-007, 113. (In Japanese) [Google Scholar]
  10. Otsuka, K.; Makihara, K. Parametric Studies for the Aeroelastic Analysis of Multibody Wings. Trans. Jpn. Soc. Aeronaut. Space Sci. Aerosp. Technol. Jpn. 2016, 14, Pc_33–Pc_42. [Google Scholar] [CrossRef] [PubMed]
  11. Wilson, T.; Azabal, A.; Castrichini, A.; Cooper, J.; Ajaj, R.; Herring, M. Aeroelastic behaviour of hinged wing tips. In Proceedings of the 5th Aircraft Structural Design Conference, Royal Aeronautical Society, Manchester, UK, 4–6 October 2016. 15p. [Google Scholar]
  12. Castrichini, A.; Wilson, T.; Cooper, J. On the dynamic release of the semi aeroelastic wing-tip hinge device. In Proceedings of the 6th Aircraft Structural Design Conference, Bristol, UK, 9–11 October 2018. [Google Scholar]
  13. Suenaga, Y.; Suzuki, K. Aerodynamic characteristics analysis and wind tunnel experiment of WITCH type long span airplanes. In Proceedings of the Fluid Dynamics Conference, 1B10, Online, 30 June–2 July 2021. (In Japanese). [Google Scholar]
  14. Suenaga, Y.; Suzuki, K. Preliminary study on aerodynamic design of wing-tip-chained airplanes for Mars exploration. In APISAT 2019: Asia Pacific International Symposium on Aerospace Technology, Gold Coast, Australia, 4–6 December 2019; Engineers Australia: Gold Coast, Australia, 2019; pp. 2048–2055. ISBN 978-1-925627-40-4. [Google Scholar]
  15. Padfield, D.G. Helicopter Flight Dynamics: Including a Treatment of Tiltrotor Aircraft, 3rd ed.; John Wiley & Sons: Hoboken, NJ, USA, 2018; p. 121. [Google Scholar]
  16. Wilde, E.; Bramwell, A.R.S.; Summerscales, R. The Flapping Behaviour of a Helicopter Rotor at High Tip-Speed Ratios; Aeronautical Research Council Current Papers; Ministry of Aviation: London, UK, 1966; p. 877.
  17. Chen, R.T.N. Flap-lag equations of motion of rigid, articulated rotor blades with three hinge sequences. In NASA Technical Memorandum; NASA: Moffett Field, CA, USA, 1987; p. 100023. [Google Scholar]
  18. Castillo-Rivera, S.; Tomas-Rodriguez, M. Description of a dynamical framework to analyse the helicopter tail rotor. Dynamics 2021, 1, 171–180. [Google Scholar] [CrossRef]
  19. Johnson Aeronautics. CAMRAD II Software Description. Available online: http://johnson-aeronautics.com/CAMRADII.html (accessed on 18 September 2023).
  20. Fujita, K.; Nagai, H.; Oyama, A. Effect of yaw-tilted hinge axis on deployment robustness of mars airplane. In Proceedings of the 30th Congress of the International Council of the Aeronautical Sciences, ICAS, Daejeon, Republic of Korea, 25–30 September 2016. [Google Scholar]
  21. Fujita, K.; Nagai, H.; Motoda, T. Dynamic behaviour of mars airplane with folded-wing deployment. Trans Jpn. Soc. Aeronaut. Space Sci. Aerosp. Technol. Jpn. 2014, 12, 1–6. [Google Scholar] [CrossRef] [PubMed]
  22. Pitt, D. Static and dynamic aeroelastic analysis of structural wing fold hinges that are employed as an aeroelastic tailoring tool. In Proceedings of the 45th AIAA/ASME/ASCE/AHS/ASC Structures, Structural Dynamics & Materials Conference, Palm Springs, CA, USA, 19–22 April 2004. [Google Scholar]
  23. AIRBUS. AlbatrossONE A Revolutionary Approach to Aircraft Wing Design. Available online: https://www.airbus.com/en/innovation/disruptive-concepts/biomimicry/wings/albatrossone (accessed on 18 September 2023).
  24. Wilson, T.; Castrichini, A.; Paterson, J.; Arribas Ardura, R. Non-linear aeroelastic behaviour of hinged wing tips. In Proceedings of the 6th Aircraft Structural Design Conference, We The Curious, Bristol, UK, 9–11 October 2018. [Google Scholar] [CrossRef]
  25. Balatti, D.; Khodaparast, H.H.; Friswell, M.I. Experimental and numerical investigation of an aircraft wing with hinged wingtip for gust load alleviation. J. Fluids Struct. 2023, 119, 103892. [Google Scholar] [CrossRef]
  26. Youtube. Ran D. St. Clair Flex 9 Flight. Available online: https://www.youtube.com/watch?v=mrJgoQz5wSU (accessed on 9 March 2022).
  27. Youtube. Ran D. St. Clair Flex 9 Explainer. Available online: https://www.youtube.com/watch?v=GWGqs3zqttA&t=1s (accessed on 18 September 2023).
  28. Gabor, O.Ş.; Koreaschi, A.; Botez, R.M.; Mamou, M.; Mebarki, Y. Analysis of the aerodynamic performance of a morphing wing-tip demonstrator using a novel nonlinear vortex lattice method. In Proceedings of the 34th AIAA Applied Aerodynamics Conference, Washington, DC, USA, 13–17 June 2016; American Institute of Aeronautics and Astronautics Inc., AIAA: Reston, VA, USA. [Google Scholar] [CrossRef]
  29. Suenaga, Y.; Suzuki, K. Aerodynamic characteristics of multiple wing-tip-chained airplanes (WITCH) for Mars exploration. In Proceedings of the Fluid Dynamics Conference, 3A07, Online, 28–30 September 2020. (In Japanese). [Google Scholar]
  30. Suenaga, Y.; Suzuki, K. Effect of joint angle on stability of flight configuration and aerodynamic characteristics of wing-tip-chained airplane. In Proceedings of the APISAT-2022, S43-3, Niigata, Japan, 12–13 October 2022. (In Japanese). [Google Scholar]
  31. Takeno, S. Equation of Motion for Multi-Rigid-Pendulum. Available online: http://takeno.iee.niit.ac.jp/~shige/math/lecture/misc/data/pendulum1.pdf (accessed on 9 March 2022). (In Japanese).
  32. Kier, T.M. Comparison of Unsteady Aerodynamic Modelling Methodologies with Respect to Flight Loads Analysis; American Institute of Aeronautics and Astronautics: Reston, VA, USA, 2013; pp. 1–14. [Google Scholar]
  33. Gutierrez-Castillo, P.; Aguilar-Cabello, J.; Alcalde-Morales, S.; Parras, L.; del Pino, C. On the lift curve slope for rectangular flat plate wings at moderate Reynolds number. J. Wind Eng. Ind. Aerodyn. 2021, 208, 104459. [Google Scholar] [CrossRef]
  34. Flandro, G.A.; McMahon, H.M.; Roach, R.L. Incompressible Flow about Wings of Finite Span, Basic Aerodynamics: Incompressible Flow; Cambridge Aerospace Series; Cambridge University Press: Cambridge, UK, 2011; pp. 254–260. [Google Scholar]
  35. Beitz, W.; Wei, Z.; Küttner, K.-H. DUBBEL—Handbook of Mechanical Engineering (Chinesisch): Volume 1: Fundamentals; Springer: Berlin/Heidelberg, Germany, 1992. [Google Scholar]
  36. Keogh, E.; Michael, J.; Pazzani, J. Derivative dynamic time warping. In Proceedings of the 2001 SIAM International Conference on Data Mining, Society for Industrial and Applied Mathematics, Chicago, IL, USA, 5–7 April 2001. [Google Scholar]
  37. Okamoto, M.; Fukatsu, S.; Sasaki, D. Measurement of unsteady aerodynamic characteristics of a heaving wing in a low reynolds number flow. Trans. Jpn. Soc. Aeronaut. Space Sci. 2021, 64, 147–155. [Google Scholar] [CrossRef]
  38. Okamoto, M.; Azuma, A. Experimental study on aerodynamic characteristics of unsteady wings at low Reynolds number. AIAA J. 2005, 43, 2526–2536. [Google Scholar] [CrossRef]
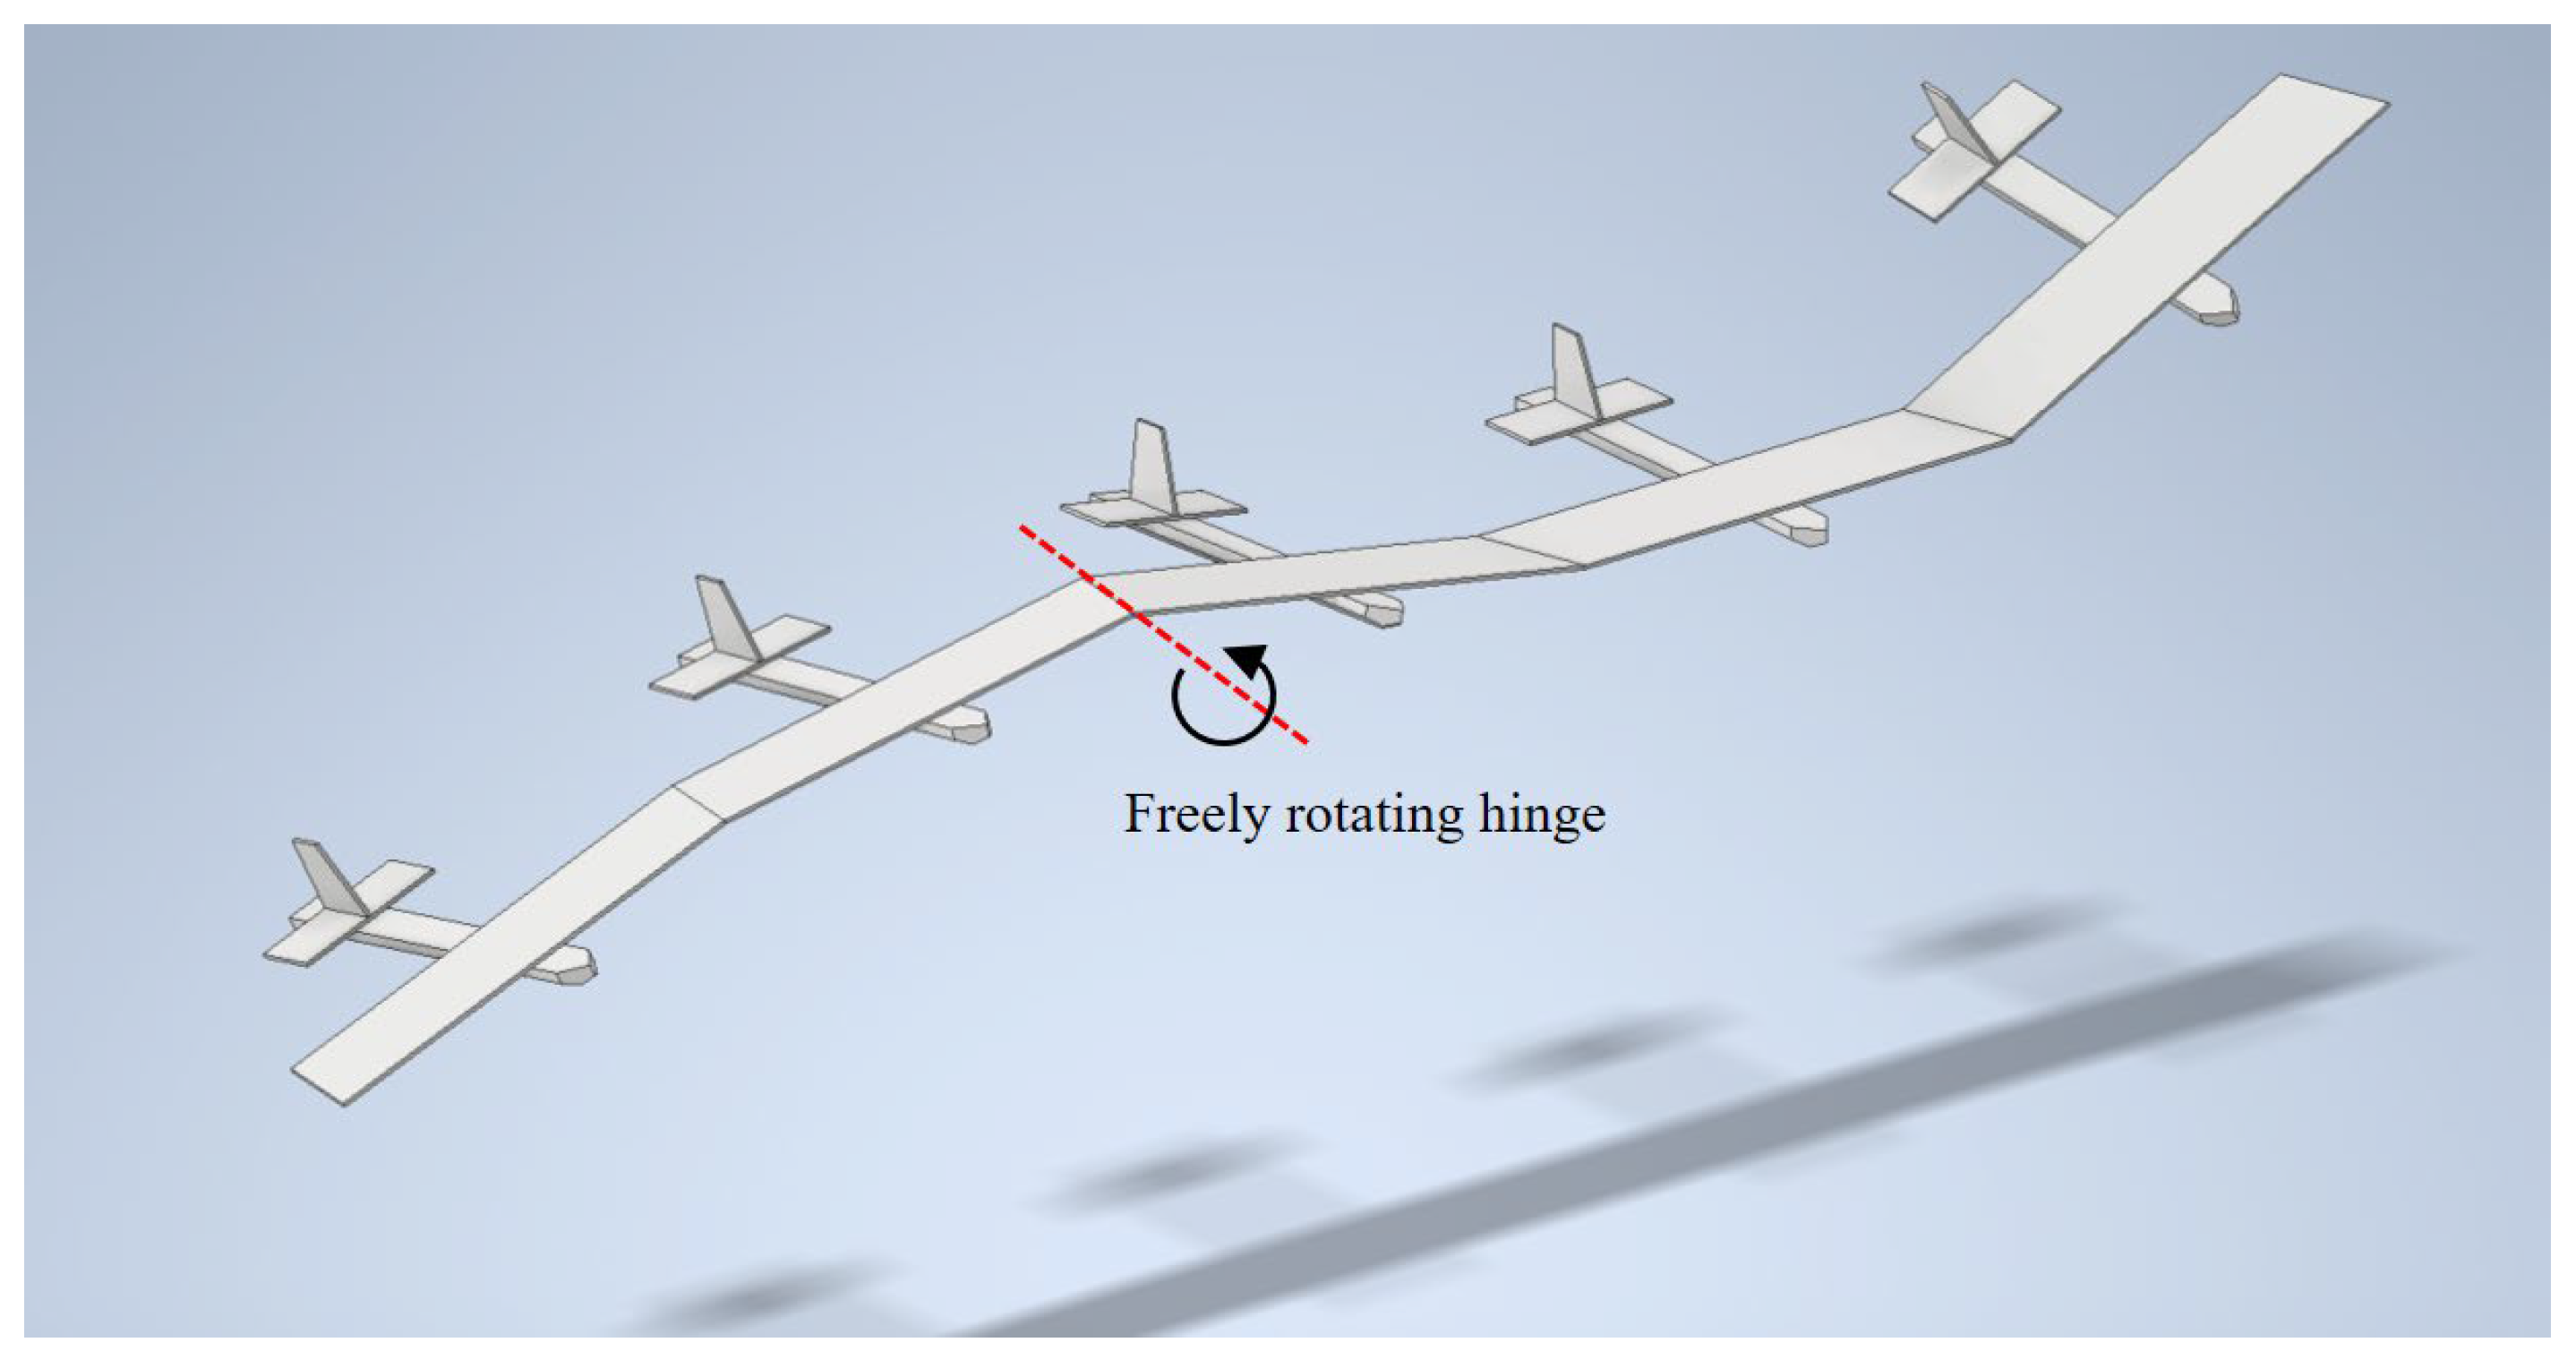
Figure 1. WITCH (wing-tip-chained) airplane concept.
Aerospace 11 00053 g001
Figure 2. Wing tip chaining with hinge axis angle δ: (a) general view; (b) detailed view.
Aerospace 11 00053 g002
Figure 3. (a) Normal multi-link rigid pendulum; (b) wing-tip-chained wings.
Aerospace 11 00053 g003
Figure 4. Bird’s eye view of forces and axis set up for pendulum calculation.
Aerospace 11 00053 g004
Figure 5. View from hinge axis direction and forces acting on a single wing section.
Aerospace 11 00053 g005
Figure 6. Top view of grid setup for VLM (three-wing case).
Aerospace 11 00053 g006
Figure 8. Coordinate systems for the: (a) VLM calculation (b) motion (pendulum) calculation.
Aerospace 11 00053 g008
Figure 9. (a) Bird’s eye view (b) hinge axis direction view of the calculation setup.
Aerospace 11 00053 g009
Figure 10. Example of a “waviness” time history.
Aerospace 11 00053 g010
Figure 11. Grid comparison for 2 × 2 (=4), 12 × 6 (=72), and 24 × 12 (=288) grids.
Aerospace 11 00053 g011
Figure 12. Grid convergence for aerial lift, moment force vs. calculation cost.
Aerospace 11 00053 g012
Figure 13. Experiment setup overview.
Aerospace 11 00053 g013
Figure 14. Close-up of the wind tunnel outlet.
Aerospace 11 00053 g014
Figure 15. Chained wing model with hinge axis.
Aerospace 11 00053 g015
Figure 16. Hinge structure.
Aerospace 11 00053 g016
Figure 17. Hinge rotation angles θ k definition.
Aerospace 11 00053 g017
Figure 18. Snapshots of free-swing test to acquire damping coefficient ζ .
Aerospace 11 00053 g018
Figure 19. θ 3 comparison for different ζ .
Aerospace 11 00053 g019
Figure 20. DDTW results for different ζ .
Aerospace 11 00053 g020
Figure 21. Three-chained wing fixed-hinge model.
Aerospace 11 00053 g021
Figure 22. C D for 3-chained wing fixed-hinge model.
Aerospace 11 00053 g022
Figure 23. C L / C D for 3-chained (a) and 1-chained (b) wing fixed-hinge model.
Aerospace 11 00053 g023
Figure 24. Snapshots (a) and tracking history (b) of hinge rotation angle at hinge δ = 0°.
Aerospace 11 00053 g024
Figure 25. Hinge rotation angle θ history for experiment and calculation at hinge axis angle δ = 30°.
Aerospace 11 00053 g025
Figure 26. Hinge rotation angle θ history for experiment and calculation at hinge axis angle δ = 15°.
Aerospace 11 00053 g026
Figure 27. AoA time history for each wing section at hinge-axis angle δ = 30°, base AoA = 9°.
Aerospace 11 00053 g027
Figure 28. AoA time history for each wing section at hinge-axis angle δ = 15°, base AoA = 9°.
Aerospace 11 00053 g028
Figure 29. Main frequency.
Aerospace 11 00053 g029
Figure 30. Maximum amplitude.
Aerospace 11 00053 g030
Figure 31. Limit cycle oscillation obtained by θ 1 , θ 2 , θ 3 for δ = 30°, AoA = 4°.
Aerospace 11 00053 g031
Figure 32. C L / C D for 1 and 3 chained wings at δ = 30°, AoA = 4°.
Aerospace 11 00053 g032
Figure 33. C L / C D for 1 and 3 chained wings at δ = 15°, AoA = 4°.
Aerospace 11 00053 g033
Figure 34. Waviness time history with structural damping coefficient ζ = 0 and 0.02.
Aerospace 11 00053 g034
Figure 35. Fitted “Convergence α” example for: (a) convergence and (b) non-convergence case.
Aerospace 11 00053 g035
Figure 36. Convergence α for 1-wing, 3-wing and 9-wing chaining with different δ and AoA. Red broken line represents Convergence α = 0 line.
Aerospace 11 00053 g036
Figure 37. Total convergence α across AoA at hinge-axis angle δ.
Aerospace 11 00053 g037
Figure 38. C L / C D for 1-wing, 3-wing and 9-wing chaining with different δ and AoA.
Aerospace 11 00053 g038
Figure 39. Average C L / C D at most stable hinge axis angle δ (δ = 45° for 1-wing, δ = 20° for 3-wing and 9-wing).
Aerospace 11 00053 g039
Disclaimer/Publisher’s Note: The statements, opinions and data contained in all publications are solely those of the individual author(s) and contributor(s) and not of MDPI and/or the editor(s). MDPI and/or the editor(s) disclaim responsibility for any injury to people or property resulting from any ideas, methods, instructions or products referred to in the content.