Abstract
The aerodynamic performances and control characteristics of vertical takeoff and landing aircraft will be significantly affected by the ground effect during takeoff and landing. The longitudinal aerodynamic characteristics and main flow features of a fixed-wing vertical takeoff and landing aircraft hovering in ground effect are investigated in this paper, using Multiple Reference Frame based numerical simulations. The aircraft is propelled by three ducted fans. Results show that the overall morphology of the flow is characterized by a fountain, ground vortex, reingestion, and recirculation. When the thrust distribution between the front and aft ducted fans changes, the flow features change as well. As the aircraft approaches the ground, the ducted fan thrust decreases, the fuselage lift increases, and the total lift first decreases and then increases. The maximum lift increases by 9.6% and the minimum lift decreases by 3.0% compared with that out-of-ground effect. The magnitude of the drag is about 1% of the lift, which has little influence on the aircraft’s performance. The pitching moment gradually changes from the equilibrium state to a significant nose-up moment. The total power consumed increases at a specific rotational speed.
1. Introduction
Vertical takeoff and landing (VTOL) aircraft have strong adaptability to takeoff and landing sites. Therefore, they have broad application scenarios and have always been a hot research topic in the aviation industry. Ducted fans are often used as the power units of VTOL aircraft because they can generate more static thrust than open propellers of the same diameter and power loading [1]. In the 1960s, research institutions such as the National Aeronautics and Space Administration (NASA) carried out systematic studies on ducted fan propelled VTOL aircraft. Several aircraft, for instance, the X-22A [2] and the Doak VZ-4 [3], were developed for research. Nowadays, within the aviation industry, there is a strong and growing interest in the development of electric VTOL (eVTOL) aircraft for various potential applications. In addition to the high static thrust, ducted fans also have the characteristics of high safety and low noise. Thus, many eVTOL aircraft, such as the Bell Nexus [4], Lilium Jet [5], and NASA reference tiltduct vehicles [6], use ducted fans as propulsion systems. Previous studies showed that the lift performance and control capability of most ducted fan propelled VTOL aircraft change significantly during takeoff and landing, due to the influence of the ground effect [7]. Therefore, it is necessary to study the aerodynamic characteristics of ducted fan propelled aircraft subjected to ground effect, so as to provide a basis for accurately predicting the performance, stability and control characteristics of the aircraft during takeoff and landing.
Most studies on the ground effect of VTOL aircraft have focused on rotors, tilt rotors, and jet-powered aircraft. Lee et al. [8] used phase-resolved particle image velocimetry (PIV) to investigate the interaction between the rotor wake and the ground. Results show that the overall morphology of the flow is characterized by embedded regions of concentrated vorticity. Kutz et al. [9] performed unsteady numerical simulations of a helicopter hovering and forward flight near the ground. It was found that, due to the presence of the ground, the tip vortex stays longer near the underside of the blade and generates a high-pressure area under the subsequent blade. Milluzzo and Leishman [10] studied the fluid dynamics of the wake sheet trailed from a rotor hovering in the ground effect by phase-resolved PIV experiments. They found that the small-scale vorticity and turbulence contained in the wake persist to the ground, which leads to large transient excursions in the near-wall flow velocities. Dekker et al. [11] conducted experimental investigations to study the aerodynamic behavior of a side-by-side rotor system in ground proximity, using Lagrangian particle tracking velocimetry. Results show that the flowfield is characterized by merged wakes, fountain, ground vortex, reingestion, and recirculation. Wolf et al. [12] investigated the main rotor wakes of two full-scale helicopters in ground effect during hover, vertical takeoff, and forward flight, using a high-speed Schlieren system and a constant temperature anemometry system. Tip vortex pairing was found to be a decisive and repeatable phenomenon in the wake of one of the helicopters. Maisel and Harris [13] carried out a series of tests to examine the effects of ground proximity of the XV-15 tilt rotor research aircraft and obtained data on performances, downwash, handling qualities, and acoustics. Test data show that the height range of the XV-15 affected by the ground is larger than that of the helicopter because of the higher disc loading of the tilt-rotor aircraft. Radhakrishnan and Schmits [14,15] measured the download, power consumption, fuselage surface pressure and downwash velocity profiles of a scaled quad tilt rotor hovering at different heights. It was observed that a high-pressure region was formed on the lower surface of the fuselage located between the front and rear wings, which is the main reason for the increase in total lift. Garofano-Soldado et al. [16] performed experimental and numerical evaluations of the aerodynamic ground effect for a small-scale tilted propeller. Results demonstrate that the thrust increment due to the ground effect decreases as the tilt angle increases when approaching the ground. Barata [17,18] presented a detailed analysis of the flowfield beneath single and multiple impinging jets through a low-velocity crossflow, providing references for the analysis of more complex flowfields of jet-powered VTOL aircraft in practical situations. Birckelbaw et al. [19], Saripalli et al. [20], Chaderjian et al. [21], and Page et al. [22] used experimental measurements and numerical simulations to study the jet-induced flowfield of the AV-8B aircraft hovering in ground effect. Related issues such as hot gas ingestion and revolution of the ground vortex were discussed. Hoggarth and Mange [23] investigated the jet effects of the F-35 aircraft in and out of ground effect. Results show that the strength of the ground effect is related to the thrust magnitude, jet angle, and height above ground, and the thrust loss caused by the ground effect is around 8%.
There are relatively few studies on the aerodynamics of ducted fan propelled VTOL aircraft in the ground effect in the literature. Savigny and Hickey [24] conducted an experimental study on the longitudinal aerodynamic characteristics in the ground effect of a large-scale VTOL aircraft model with a direct lifting fan enclosed in the fuselage. The test data show that approximately 60% of the lift loss is due to fan thrust reduction, and the remaining 40% of the lift loss is caused by the low pressure on the lower surface of the fuselage generated by the jet entrainment. Giulianetti et al. [25] measured the longitudinal aerodynamic performances of a large-scale VTOL aircraft model hovering at different heights above the ground. The model has four tilting ducted fans arranged in tandem pairs. The measurement data show that the ground effect increases the lift and reduces the power consumption, but the performance of the aircraft does not vary monotonically with the height. Schuster et al. [26] conducted several tests to establish ground effect performances of a three-fan-propelled VTOL aircraft model. The model incorporates a nose-mounted lift fan and two lift/cruise units with deflectable nozzles mounted at the wing root. A 3% to 10% loss of lift caused by the ground effect was observed in the tests. Norton [27] studied the lift variation in the ground effect of a dual tilting ducted fan propelled VTOL aircraft through momentum source based numerical simulations. It was found that the lift variation is mainly caused by the fountain effect and the suckdown effect, where the fountain effect increases the lift and the suckdown effect decreases the lift.
From the above review, it can be seen that previous studies related to the ground effect of ducted fan propelled aircraft mainly focus on the variation trend of aerodynamic performances with height, while there are few studies on the characteristics of the jet-induced flowfield near the ground. Besides, the jet-induced flowfield is highly related to the aircraft geometry and the layout of the propulsion system. The research on the aerodynamic characteristics in the ground effect of the three ducted fans-propelled VTOL aircraft, a configuration with engineering application value, has been very limited. In view of the above-mentioned considerations, the longitudinal aerodynamic characteristics and main flowfield features of three ducted-propelled fixed-wing VTOL aircraft hovering in ground effect are investigated, using numerical simulations based on the Multiple Reference Frame (MRF) method.
2. Introduction to the VTOL Aircraft
The aircraft in the present paper is designed for the concept of Advanced Air Mobility. The Advanced Air Mobility mission aims to safely develop an air transportation system that moves people and cargo between places previously not served or underserved by aviation using revolutionary new aircraft [28]. Therefore, such aircraft usually need to have the ability to take off and land vertically. The main performance parameters of the aircraft are listed in Table 1. The aircraft adopts the configuration of a high-wing and a V-tail. The main geometric dimensions are shown in Figure 1a. Its VTOL capability is achieved primarily by tilting ducted fans. After evaluating several ducted fan configurations, Olcott [29] concluded that at least three ducted fans are required to provide sufficient pitch and roll control power. Therefore, the aircraft in this paper adopts three ducted fans as power units. As shown in Figure 1, two of the ducted fans, hereafter referred to as the front ducted fans, are located in front of the wings. Another ducted fan, hereafter referred to as the aft ducted fan, is mounted at the rear fuselage. The front ducted fan is connected with the fuselage and the arm protruding from the wing through shafts and can be driven by the actuator installed inside the fuselage to realize tilting. The aft ducted fan is only used during the VTOL phase and can be fully enclosed into the fuselage during the flight phase with the door closed. Both the front and aft ducted fans have eight blades, and the distributions of the twist and dimensionless chord [30] along the radial direction of the blades are identical. The maximum thrust of a single front ducted fan is 8820 N, and the maximum thrust of the aft ducted fan is 5880 N. Such a configuration can achieve a better balance between aircraft size, structural weight, allowable center of gravity range, and available control power.

Table 1.
Main performance parameters of aircraft.
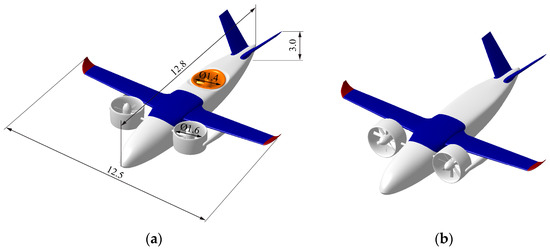
Figure 1.
Sketch of aircraft: (a) VTOL mode; (b) Cruise mode. Dimensions are in m.
3. Numerical Method and Validation
The experiment conducted by Giulianetti [25] was chosen as a reference for the validation of the numerical method. The aircraft model used in the experiment has four tilting ducted fans arranged in tandem pairs, as shown in Figure 2. The ducted fan installed on the model has eight blades. The diameter of the blades is 1.22 m, and the pitch angle at the blade tip was set to 23°. The fan operated at 3020 rpm during the test and each ducted fan could generate about 3920 N thrust. The height h refers to the vertical distance from the front duct exit to the ground plane. Lift, drag, pitching moment and power were measured at three heights, namely, h/DE = 1, 2, 3, where DE is the diameter of the ducted fan exit. The positive directions of lift L, drag D, and pitching moment M can be seen in Figure 3.
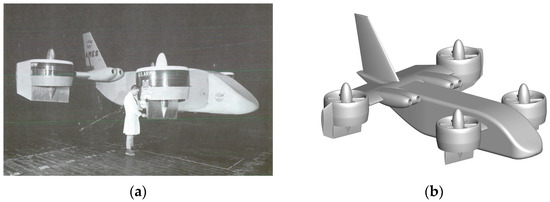
Figure 2.
Aircraft model of Giulianetti’s experiment [25]: (a) Experimental model; (b) Recreated model for simulations.
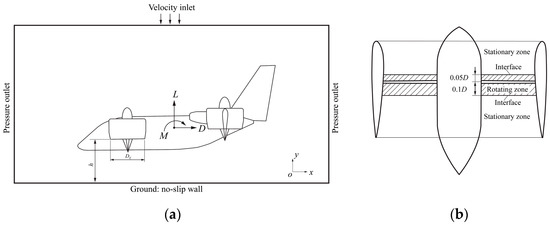
Figure 3.
Computational domain and boundary conditions: (a) Boundary conditions; (b) Cell zone divisions for a single ducted fan.
The CFD software ANSYS Fluent 2021 was adopted to perform the numerical simulations. The MRF method is used to simulate the fan rotation. The MRF model is a steady-state approximation in which individual cell zones can be assigned different rotational and/or translational speeds [31]. Consider a coordinate system that is translating with a linear velocity and rotating with angular velocity relative to a stationary reference frame, as illustrated in Figure 4. The origin of the moving system is located by a position vector . The computational domain for the CFD problem is defined with respect to the moving frame such that an arbitrary point in the CFD domain is located by a position vector from the origin of the moving frame.
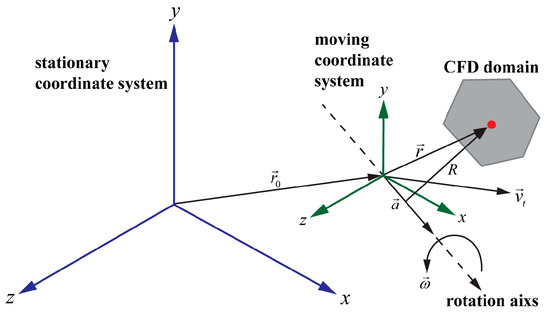
Figure 4.
Illustration of stationary and moving reference frames [31].
The fluid velocities can be transformed from the stationary frame to the moving frame using the following equations:
where is the relative velocity, is the absolute velocity, and is the velocity of the moving frame relative to the stationary reference frame. For the relative velocity formulation, the governing equations of fluid flow in a moving reference frame can be written as follows [31].
Conservation of mass:
Conservation of momentum:
where , , and is the external body forces.
Conservation of energy:
In the Equation (5), the viscous stress is defined by Equation (6); the relative internal energy is defined by Equation (7); the relative total enthalpy is defined by Equation (8); k is the thermal conductivity; T is the temperature; Sh is the source term.
where μ is molecular viscosity, I is the unit tensor and h is the static enthalpy. Ansys Fluent provides both pressure-based and density-based solvers to numerically solve the above governing equations [31].
Only half of the model was used in the simulation, considering the symmetry of both the geometry and the physics. The computational domain is a cuboid with lengths of 150DE, 75DE, and 75DE in the flow, normal, and span direction, respectively. For a single ducted fan, the MRF method requires two separate zones connected by frame interfaces inside the computational domain: the rotating zone containing the block near blades and the stationary zone containing the rest block, as shown in Figure 3b. The boundary conditions are shown in Figure 3: all surfaces of the aircraft model were set as no-slip walls; three of the four side surfaces, except for the symmetry plane, were set as pressure outlets with a value of 0 Pa relative to the standard atmospheric pressure; the top surface was set as the velocity inlet with a value of 0.5 m/s to reduce the order of residuals magnitude [30]; the bottom surface was set as the non-slip wall. The air is assumed to be the ideal gas with properties of the standard atmosphere at sea level.
The turbulence model Generalized k-ω was used in all subsequent simulations. The GEKO [32] is a two-equation model based on the k-ω model formulation. The GEKO model offers six free parameters, which the user can adjust for specific types of applications without a negative impact on the basic calibration of the model. Thus, it achieves the flexibility to tune the model over a wide range of flow scenarios. Amstad et al. [33] investigated the application of the GEKO in turbocharger flowfield simulations. They found that the free parameters optimized for specific operating conditions and geometries could be generalized to predict accurately for other operating conditions and similar geometries. And the optimized GEKO model performed better than the k-ω SST model in terms of trend predictions of the performances. In this paper, only the value of CSEP in the GEKO model was adjusted to 0.7, and the other parameters remained as their default values. The pressure-based solver was selected for the simulations, the SIMPLEC scheme was selected for the velocity-pressure coupling, and the second-order upwind scheme was selected for the spatial discretization. The other options remained the default settings of the software.
Firstly, the h/DE = 3 case was chosen to perform the grid independence study. The GEKO model adopted a y+ insensitive wall formulation [32]. The first layer height of the grid was taken to make the y+ value between 30 and 200 in the present study. The grid refinement was mainly performed on the model surfaces and the adjacent region surrounding the model. The cell number of the medium mesh is about 24 million. The calculated results with different grid densities are plotted in Figure 5. The discrepancy between the pitching moment calculated by the coarse mesh and that calculated by the medium mesh is greater than 5%. However, the discrepancies between the coefficients calculated by the medium mesh and those calculated by the fine mesh are all within 1%. Therefore, the medium mesh was considered to meet the requirements of grid independence, and the other meshes used in this study were generated according to the medium one.
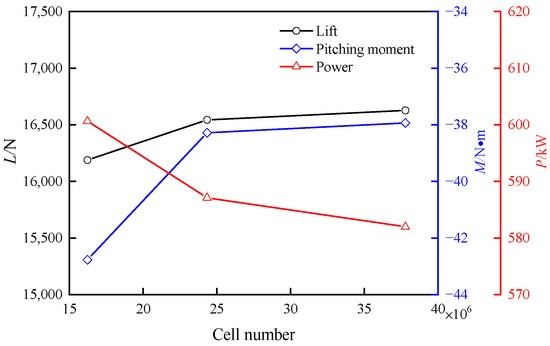
Figure 5.
Comparison of calculated results with different grid densities.
Simulations for the other two heights were then performed with the medium mesh. The comparison between the CFD results and the experimental values is shown in Figure 6, where the variables with subscript v represent the corresponding results of the h/DE = 3 case. The discrepancies between the calculated and experimental values of lift, drag and power are all within 8%. The maximum discrepancy of the pitching moment is 19%, which occurs in the h/DE = 1 case. However, this discrepancy is not misleading for the performance analysis because the absolute value of the pitching moment at this height is very small, and thus it is acceptable. As can be seen in Figure 6, the CFD results capture the key trends that the performance parameters do not vary monotonically with height, that the extremes occur at h/DE = 2, and that the direction of drag changes. From the above analysis, it can be concluded that the numerical method established in this paper can be used to simulate the flowfield of the ducted fan propelled aircraft hovering near the ground.
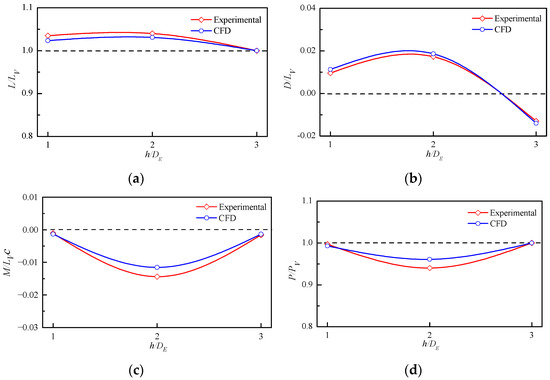
Figure 6.
Comparison between CFD results of medium mesh and experimental values: (a) Lift; (b) Drag; (c) Pitching moment; (d) Power.
4. Results and Discussion
In this section, the flowfield of the VTOL aircraft introduced in Section 2 hovering at different heights were simulated using the numerical method established above. The height h is also defined as the vertical distance from the front duct exit to the ground plane. It should be noted that the reference of h in this section is the blade diameter D of the front ducted fan. Considering the space occupied by the landing gear, the minimum h in the simulations was set to 0.75D. Other simulations were performed in the height range of 1D−4D with an interval of 0.5D. The meshes used in this section were generated according to the medium mesh in Section 3, and the cell number of the h/D = 1 case is about 23 million. The mesh on the aircraft surface and some mesh details of the ducted fan are shown in Figure 7. Except that the intersection of the aft fan rotation domain and the symmetry plane was set to periodic boundaries, as shown in Figure 8, other boundary conditions and solution settings were the same as in Section 3. At each height, two sets of fan rotational speed settings were simulated. In the first set, the fan rotational speed of the front ducted fan was 1470 rpm and that of the aft ducted fan was 1680 rpm. In the second set, the fan rotational speed of the front ducted fan was 1345 rpm and that of the aft ducted fan was 1995 rpm. These two sets of fan rotational speeds make the total lift out of ground effect close to the maximum takeoff weight of the aircraft. The first set of the fan rotational speeds makes the pitching moment with the front center of gravity (CG) as the reference point zero, hereafter referred to as the front CG case; the second set of the fan rotational speeds makes the pitching moment with the aft CG as the reference point zero, hereafter referred to as the aft CG case. The front and aft CG positions are shown in Figure 9. The performances of the front ducted fan, the aft ducted fan, and the aircraft out-of-ground effect (OGE) are shown in Table 2, Table 3, and Table 4, respectively. The variables T, P, PL, L are thrust, shaft power, power loading, and lift, respectively, where PL = T/P. Variables with the subscript OGE indicate the corresponding values obtained from simulations out of ground effect. For the OGE simulations, the bottom surface of the computational domain is a farfield boundary instead of a ground wall boundary, and the distance from the front duct exit plane to the bottom farfield boundary is about 40D.
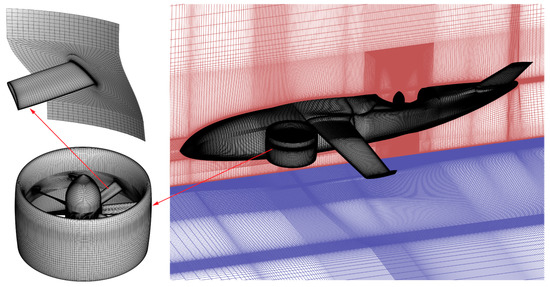
Figure 7.
Mesh used in simulations, h/D = 1 case.
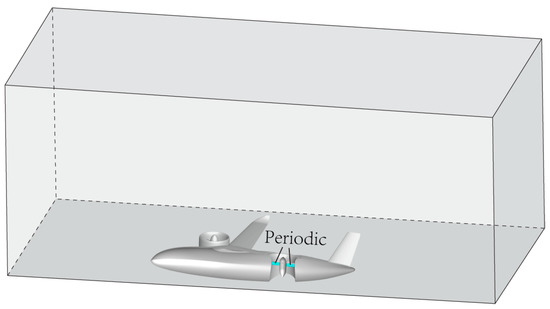
Figure 8.
Periodic boundary condition at aft duct.
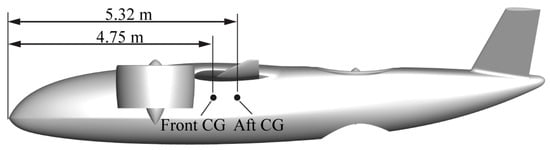
Figure 9.
Center of gravity positions.
Table 2.
Performances of front ducted fan out of ground effect.
Table 3.
Performances of aft ducted fan out of ground effect.
Table 4.
Performances of aircraft out of ground effect.
4.1. Main Flow Features
When VTOL aircraft hover close to the ground, the strong interactions between the power plant jet, the aircraft and the ground will generate a complex flowfield. Figure 10 and Figure 11 illustrate the main features of the flowfield induced by the ducted fan jets of the front CG case and the aft CG case, respectively. Figure 12 and Figure 13 show the corresponding streamlines and vertical velocity contours on the symmetrical plane.
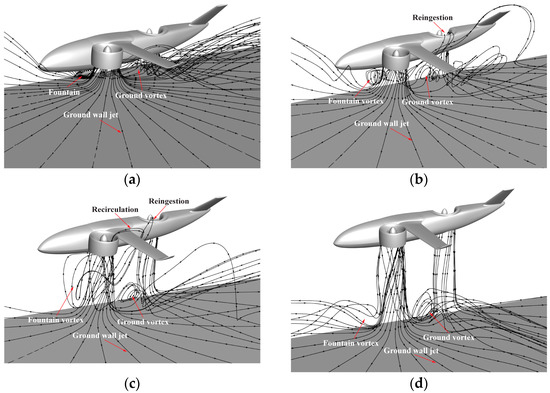
Figure 10.
Streamlines at different heights of front CG case: (a) h/D = 0.75; (b) h/D = 1.5; (c) h/D = 2.5; (d) h/D = 3.5.
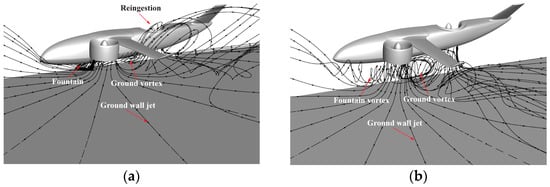
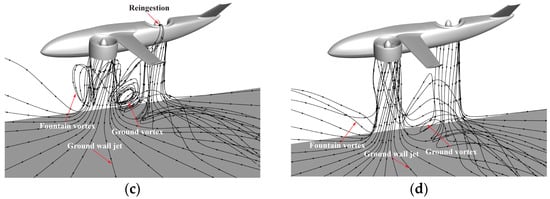
Figure 11.
Streamlines at different heights of aft CG case: (a) h/D = 0.75; (b) h/D = 1.5; (c) h/D = 2.5; (d) h/D = 3.5.
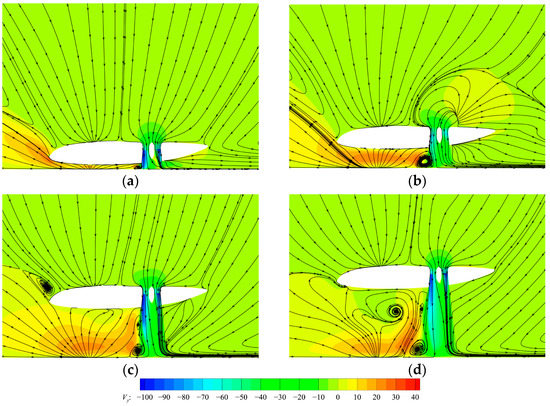
Figure 12.
Streamlines and vertical velocity contour at symmetry plane of front CG case: (a) h/D = 0.75; (b) h/D = 1.5; (c) h/D = 2.5; (d) h/D = 3.5.
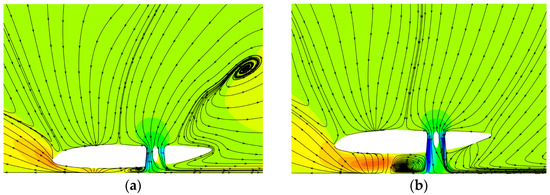
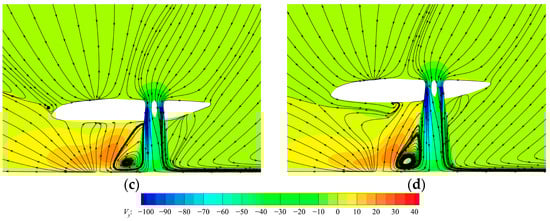
Figure 13.
Streamlines and vertical velocity contour at symmetry plane of aft CG case: (a) h/D = 0.75; (b) h/D = 1.5; (c) h/D = 2.5; (d) h/D = 3.5.
For the front CG case, in the height range of 0.75D–1D, the ducted fan jets strike the ground and move out radially forming a ground wall jet. The ground wall jets generated by the two front ducted fans collide at the symmetry plane and form a fountain moving upward along the symmetry plane. In this height range, the fountain intensity is relatively strong. Therefore, it forms a wall flow that moves along the lower surface of the fuselage and spreads out to the space after impacting the fuselage, as shown in Figure 10a. The interaction between the ground wall jets generated by the front ducted fan and the aft ducted fan causes the flow to separate and forms a ground vortex. The front ducted fan has greater thrust and is closer to the ground. Therefore, the intensity of the ground wall jet of the front ducted fan is greater than that of the aft ducted fan. As a result, the position of the ground vortex is closer to the aft ducted fan. The upwash induced by the ground vortex also impacts the fuselage. In the height range of 1D–2D, the upward fountain interacts with the rebounding airflow impacting the lower fuselage surface and then forming a fountain vortex. The fountain vortex close to the aft ducted fan is rolled up by the ground vortex and reingested into the aft duct. In the height range of 2D–3D, the rolled-up fountain vortex is reingested not only by the aft ducted fan but also by the front ducted fan, forming a local recirculation, as shown in Figure 10c. The circulation generates a low-pressure area in the aft half (+x direction) of the front duct, as shown in Figure 14. This increases the pressure difference between the fore and aft part of the duct, resulting in an obvious increase in drag. No recirculation is observed in the case of an isolated ducted fan hovering in the ground effect [30]. In the height range of 3D–4D, besides the ground vortex formed by the front and aft ducted fan jets, the ground vortex is also formed when the jets of the two front ducted fans collide and move upstream along the symmetry plane. However, these ground vortices are far away from the aircraft, and the interaction between the airflow caused by the ground vortices and the aircraft is very weak. Therefore, their influence on the aircraft performances is negligible.
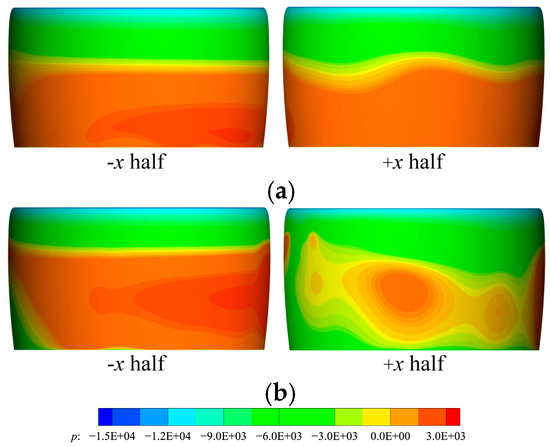
Figure 14.
Pressure contour on outer surface of front duct of front CG case: (a) OGE; (b) h/D = 2.5.
Compared with the front CG case, the jet intensity of the ducted fans changes due to the different thrust distribution of the front and aft ducted fans. Therefore, the main flow characteristics induced by the jets also show some differences. The aft ducted fan jet becomes stronger in the aft CG case, and the ground vortex formed by the interaction between the front and aft ducted fan jets expands. In the height range of 0.75D–1D, the jet flow of the front ducted fan is reingested by the aft ducted fan, as shown in Figure 11a. The reingestion phenomenon disappears in the height range of 1D–2D and reappears in the height range of 2D–3D. There is no recirculation in the aft CG case. In both cases, there is the phenomenon that the jet flow deflected by the ground is reingested by the ducted fans. Thus, measures to protect the blades from foreign object damage need to be considered in the design.
In addition to the above-mentioned main flow features, the presence of the ground also affects the flow induced by the entrainment of the ducted fans. Taking the local flow around the wing of the front CG case as an example, as shown in Figure 15, it can be seen that the streamlines flowing toward the wing are closer to the vertical direction when the aircraft approaches the ground.
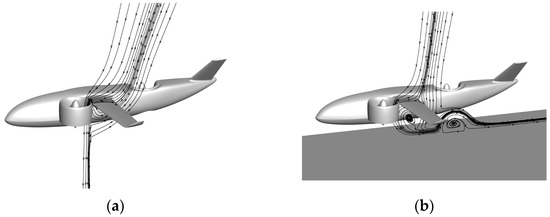
Figure 15.
Comparison of local flow around wing in and out of ground effect of front CG case: (a) OGE; (b) h/D = 0.75.
4.2. Lift Characteristics Analysis
Due to the influences of the entrainment of the ground wall jets, the entrainment of the ground vortex, and the impact of the fountain, the aerodynamic load on the aircraft in ground effect changes relative to that out of ground effect. The lift, drag and moment characteristics of the aircraft change as well. For the hovering cases, the drag magnitude is only about 1% of the corresponding lift magnitude, which has little effect on the aircraft performance, and thus the drag will not be analyzed specifically.
Figure 16 shows the variation of the lift with heights, where the lift is normalized by the LOGE. In Figure 16, Ltotal, Lfuselage, LFDF, and LADF are total lift, fuselage lift, front ducted fan lift, and aft ducted fan lift, respectively. In the hovering case, the lift of the ducted fans is identical to their thrust. The wing and V-tail lift to the total lift ratio is less than 1% and they are not plotted in the figure. The change of the total lift is mainly affected by the change of the ducted fan thrust and the change of the fuselage lift. As the height decreases, the thrust of the ducted fans decreases and the fuselage lift increases. As a result, the minimum value of the total lift of the front CG case occurs at 2.5D, which is 3.0% less than that out of ground effect; the minimum value of the total lift of the aft CG case occurs at 1.5D, which is 0.8% less than that out of ground effect. In the height range of 1D–4D, the lift variation of the aft CG case is more moderate. At 0.75D, the total lift increases significantly due to a significant increase in the fuselage lift. At this height, compared with the cases out of ground effect, the total lift of the front CG case increases by 8.9% and the total lift of the aft CG case increases by 9.6%. It is worth mentioning that when the height is less than 1.5D, the entrainment of the ground vortex under the wing, as can be seen in Figure 15, induces a download, but its magnitude is small about 0.2% LOGE.
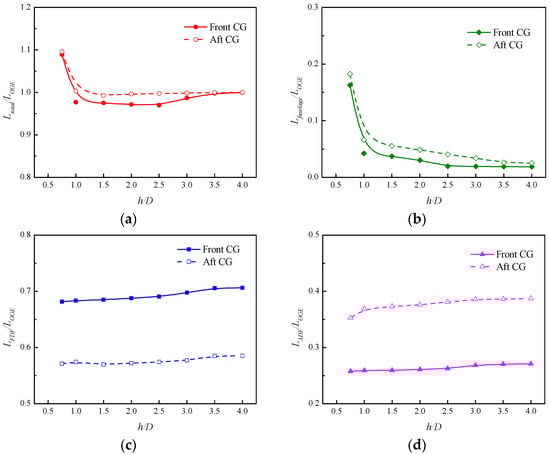
Figure 16.
Variation of aircraft lift with heights: (a) Total lift; (b) Fuselage lift; (c) Front ducted fan lift; (d) Aft ducted fan lift.
As the height decreases, the thrust of both the front and aft ducted fan decreases. At 0.75D, compared with the cases out of ground effect, for the front CG case, the thrust of the front ducted fan decreases by 2.3% LOGE, and the thrust of the aft ducted fan decreases by 1.3% LOGE; for the aft CG case, the thrust of the front ducted fan decreases by 1.4% LOGE, and the thrust of the aft ducted fan decreases by 3.5% LOGE.
Figure 17 shows the pressure distribution at the lower surface of the fuselage at different heights for the front CG case, and Figure 18 shows the pressure distribution at the symmetry plane of the lower surface of the fuselage at the corresponding height. The coordinate S refers to the dimensionless distance to the front end of the fuselage, as illustrated in Figure 18. At 0.75D, the impact of the fountain shown in Figure 10a creates a large high-pressure area on the lower surface of the fuselage, Zone A, as shown in Figure 17a. This results in a significant increase in fuselage lift, from 1.9% LOGE out of ground effect to 16.3% LOGE at 0.75D. The upwash induced by the ground vortex also provides some lift after impacting the bottom of the fuselage, as shown in Zone B in Figure 17a. As the height increases, the intensity of the fountain impact on the fuselage weakens rapidly. The magnitude and area of the high-pressure region are significantly reduced, as can be seen from Figure 17 and Figure 18. Therefore, the fuselage lift is also significantly reduced. When the height is greater than 2D, the increment of the fuselage lift due to the ground effect will be within 1% LOGE.
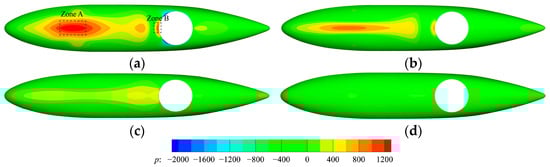
Figure 17.
Pressure contour on lower surface of fuselage at different heights of front CG case: (a) h/D = 0.75; (b) h/D = 1.0; (c) h/D = 1.5; (d) OGE.
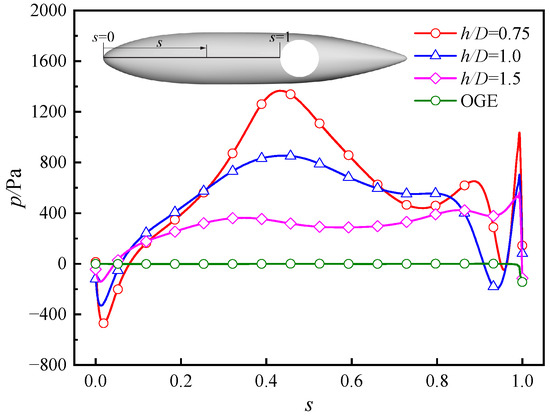
Figure 18.
Pressure distribution at symmetrical plane of lower surface of fuselage at different heights of front CG case.
The trend of the fuselage lift at different heights of the aft CG case is similar to that of the front CG case. The fuselage lift increases from 2.5% LOGE out of ground effect to 18.3% LOGE at 0.75D. In the aft CG case, the jet strength of the front ducted fan is weakened because of the thrust reduction. Consequently, the high-pressure area and the pressure peak caused by the fountain impact decreases, as can be seen in Zone A in Figure 19 and Figure 20. However, the jet strength of the aft ducted fan intensifies because of the increased thrust. The impact area of the upwash, Zone B in Figure 19, caused by the ground vortex increases. As a result, the fuselage lift increases compared with the front CG case. At 0.75D, the fuselage lift increment of the aft CG case is 8.4% larger than that of the front CG case, and the total lift increment of the aft CG case is 7.2% larger than that of the front CG case.
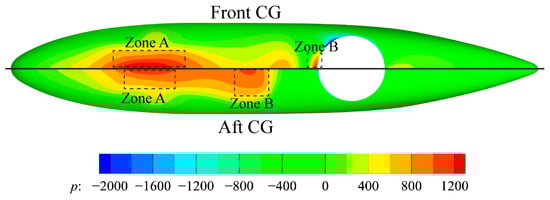
Figure 19.
Comparison of pressure on lower surface fuselage at h/D = 0.75.
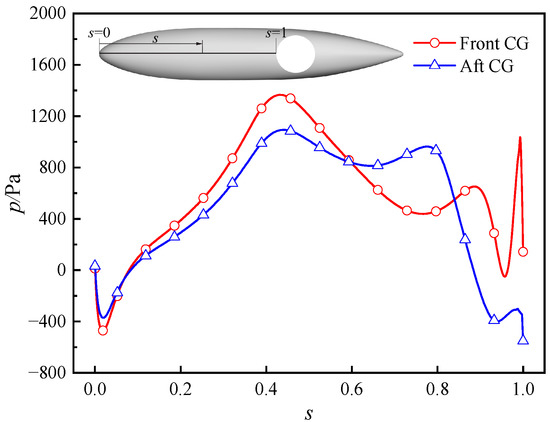
Figure 20.
Comparison of pressure distribution at symmetry plane of lower surface of fuselage at h/D = 0.75.
4.3. Pitching Moment Characteristics Analysis
Figure 21 shows the variation of the pitching moment with heights, where the pitching moment is normalized by the product of the total lift LOGE and the mean aerodynamic chord c. In Figure 21, M denotes the total moment, the resultant moment of the front and aft ducted fans, or the fuselage moment, which can be distinguished through the legend. In the cases of ground effect, the lift of the fuselage is mainly generated by the low-pressure region around the aft duct inlet caused by the suction of the aft ducted fan, as shown in Figure 22. This low-pressure region is located behind the CG, resulting in a nose-down pitching moment. Therefore, the front and aft ducted fans are required to provide a certain nose-up moment to maintain the balance of the pitching moment.
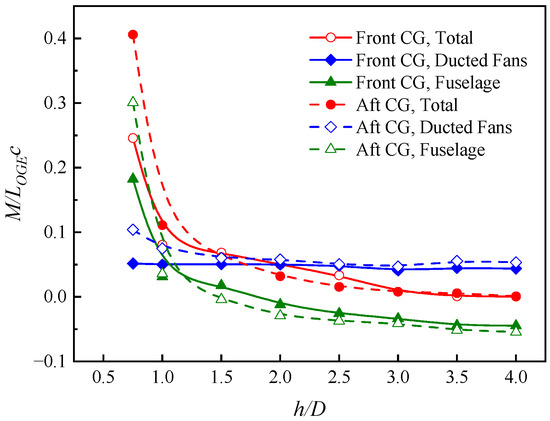
Figure 21.
Variation of aircraft pitching moment with heights.
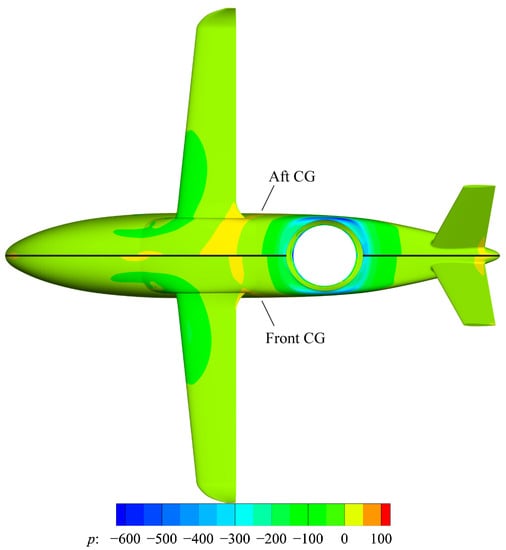
Figure 22.
Pressure contour on aircraft surface out of ground effect.
In the front CG case, as the height decreases, the thrust loss of the front and aft ducted fans is similar, and the pitching moment changes caused by thrust changes cancel each other out. Thus, the change of the resultant moment of the ducted fans is not obvious. When approaching the ground, a large nose-up moment is generated on the fuselage as the fountain impacts the fore part of the fuselage. In particular, the nose-up moment increases significantly at 0.75D, as shown in Figure 21. In the aft CG case, due to the greater thrust and stronger suction effect of the aft ducted fan, the nose-down moment of the fuselage is larger than that of the front CG case when out of ground effect. Therefore, the ducted fans are required to provide a larger resultant nose-up moment. At 0.75D, because the thrust reduction of the aft ducted fan is larger than that of the front ducted fan, the resultant nose-up moment of the ducted fans increases. This is also one of the factors contributing to the significant increase in the nose-up moment of the aft CG case. The elevators can hardly provide any control moment during hovering. Therefore, the large nose-up moment needs to be balanced by installing control vanes at the duct exit or by adjusting the thrust distribution of the front and aft ducted fans.
4.4. Ducted Fan Performance Analysis
Figure 23 and Figure 24 show the variation of the front and aft fan performances with heights, respectively, where the performances are normalized by the corresponding values out of ground effect. In Figure 23 and Figure 24, T denotes the total thrust, the thrust component of the blades or duct, which can be distinguished through the legend. It can be seen that as the height decreases, the duct thrust decreases, the blade thrust increases, and the total thrust decreases; the power consumed by the ducted fan increases and the power loading decreases. The variation trend of these performances is similar to that of an isolated ducted fan subjected to ground effect [30]. The normalized performances of an isolated ducted fan are almost constant in a large rotational speed range at a given height [34]. However, in the installed state, the normalized performances have an obvious change with the change of the rotational speed. Both the duct and blade thrust changes substantially in ground effect, but the change in total thrust becomes smaller due to the superposition of the opposite variation trends. Taking the front ducted fan as an example, the relative change in both the duct and blade thrust exceeds 20%, but the change in total thrust is within 5%.
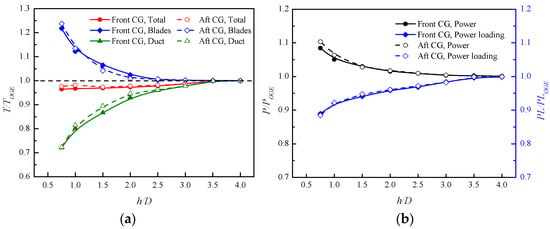
Figure 23.
Variation of front ducted fan performances with heights: (a) Thrust; (b) Power and power loading.
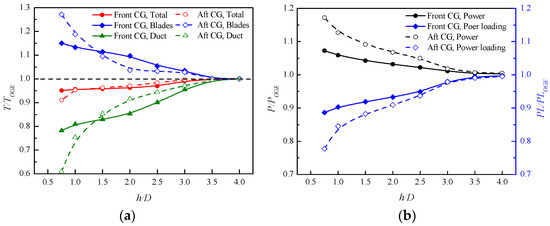
Figure 24.
Variation of aft ducted fan performances with heights: (a) Thrust; (b) Power and power loading.
Figure 25 shows the variation of the total power and power loading of the aircraft with heights. It can be seen that the power consumed by the ducted fans increases as the height decreases for both the front and aft CG case. At 0.75D, the power of the front CG case increases by 8.1% and that of the aft CG case increases by 13.5%. The total lift decreases or slightly increases in the height range of 1D~4D, and thus the power loading decreases relative to that out-of-ground effect. For the front CG case, the minimum value of the power loading appears at 2.5D, which is 3.0% lower than that out of ground effect; in the aft CG case, the minimum value of the power loading appears at 1D, which is 8.3% lower than that out of ground effect. At 0.75D, the power loading increases compared to 1D due to the substantial increase in the total lift. For the front CG case, the power loading at 0.75D is 8.9% higher than that out-of-ground effect, and this means that the hovering efficiency increases at this height. For the aft CG case, the power loading at 0.75D is still smaller than that out-of-ground effect, and the hovering efficiency decreases in the whole height range.
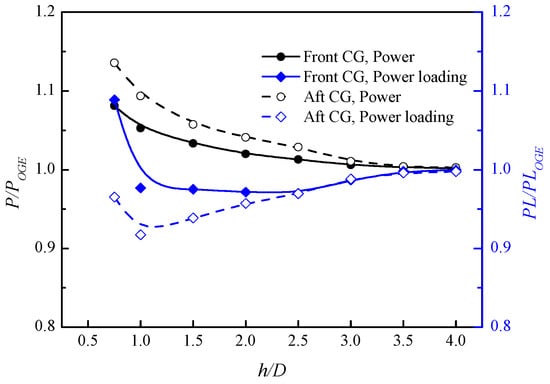
Figure 25.
Variation of aircraft power with heights.
Figure 26 presents the comparison of pressure contours and streamlines on typical sections in and out of ground effect of the front CG case. When the aircraft approaches the ground, the airflow through the duct is decelerated and the ambient pressure increases due to the blockage of the ground. The decelerated airflow through the duct increases the effective angle of attack of the blades. The jet deflected by the ground decreases the effective angle of the duct. The blade thrust increases due to the combined effect of the increase in the effective angle of attack and the increase in ambient pressure. The duct thrust decreases due to the combined effect of the decrease in the effective angle of attack and the increase in ambient pressure. A more detailed analysis can be found in another paper [30].
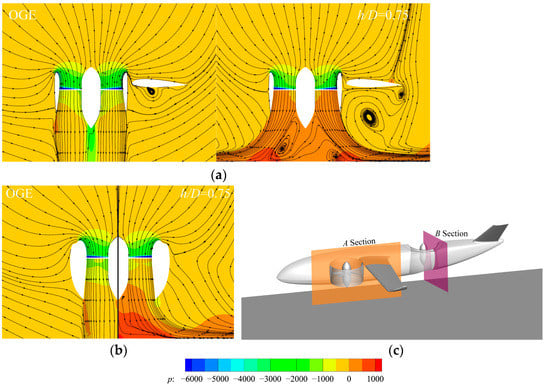
Figure 26.
Comparison of streamlines and pressure on typical sections of front CG case in and out of ground effect: (a) A section; (b) A section; (c) Section positions.
5. Conclusions
In this paper, the flowfield features and longitudinal aerodynamic performance of a fixed-wing VTOL aircraft hovering at different heights near the ground were investigated using MRF-based numerical simulations. The aircraft is propelled by two tilting front ducted fans and one fixed ducted fan. When the aircraft hovers near the ground, the strong interaction between the ducted fan jets, the ground and the aircraft generates a complex flowfield. The main flow features include the ground wall jet, fountain, ground vortex, reingestion, and recirculation. When the thrust distribution between the front and aft ducted fans changes, the main flow features change as well. Through the analysis of the aircraft performance variation trend and the influence of the flow features on the aerodynamic performances, the following main conclusions are drawn:
- When hovering near the ground, the aircraft lift is mainly affected by the change of the fuselage lift and the ducted fan thrust. As the aircraft approaches the ground, the ducted fan thrust decreases, the fuselage lift increases, and the total lift first decreases and then increases. The impact of the fountain is the main reason for the increase in the fuselage lift, and the impact of the upwash generated by the ground vortex also provides a certain amount of lift. Affected by the increase in ambient pressure, the decrease in axial flow velocity and the streamlines deflected by the ground, the blade thrust increases, the duct thrust decreases, and the total thrust of the ducted fan decreases;
- As the aircraft approaches the ground, the pitching moment of the aircraft gradually changes from an equilibrium state to a significant nose-up moment. The change in the pitching moment is mainly affected by the change of the fuselage moment and the resultant moment of the front and aft ducted fans. The nose-up moment of the fuselage is mainly caused by the impact of the fountain and the upwash flow generated by the ground vortex. In the front CG case, the thrust loss in the ground effect of the front and aft ducted fans is similar, and the resultant moment of the ducted fans is almost unchanged. In the aft CG case, the thrust reduction of the aft ducted fan is larger than that of the front ducted fan, and the resultant nose-up moment of the ducted fans increases compared with that out-of-ground effect;
- At a specific fan rotational speed, the power consumption of the front and aft ducted fans increases as the height decreases. Compared with the out-of-ground effect, the power loading of the aircraft in the ground effect generally shows a decreasing trend, and the hovering efficiency decreases. This is mainly due to the decrease in the thrust of the ducted fans in ground effect.
The three ducted fans configuration combining tilting ducted fans and the fixed lift ducted fan can achieve a better balance between aircraft size, structural weight, allowable center of gravity range, and available control power, and thus has high engineering application value. The research in this paper can provide a reference for accurately predicting the aerodynamic performance and control characteristics of such aircraft during takeoff and landing phases.
Author Contributions
Conceptualization, Y.T. and Z.W.; formal analysis, Y.Z.; investigation, Y.Z. and Y.T.; methodology, Y.Z. and Y.T.; writing—original draft, Y.Z.; writing—review and editing, Y.T. and Z.W. All authors have read and agreed to the published version of the manuscript.
Funding
This research received no external funding.
Data Availability Statement
Not applicable.
Conflicts of Interest
The authors declare no conflict of interest.
Nomenclature
| h | Distance from front duct exit to ground |
| DE | Duct exit diameter |
| c | Mean aerodynamic chord |
| L | Lift |
| D | Drag in Section 3; Blade diameter in Section 4 |
| M | Pitching moment |
| rpm | Revolutions per minute |
| T | Thrust |
| P | Shaft power |
| PL | Power loading, T/P or L/P |
| LOGE, TOGE, POGE, PLOGE | Corresponding values out of ground effect |
| Ltotal, Lfuselage, LFDF, LADF | Total lift, fuselage lift, lift provided by front ducted fan and aft ducted fan, respectively |
References
- Black, D.M.; Wainauski, H.S.; Rohrbach, C. Shrouded Propellers—A Comprehensive Performance Study. In Proceedings of the AIAA 5th Annual Meeting and Technical Display, Philadelphia, PA, USA, 21–24 October 1968. [Google Scholar] [CrossRef]
- Paxhia, V.B.; Sing, E.Y. X-22A Design Development. J. Aircr. 1965, 2, 2–8. [Google Scholar] [CrossRef]
- Kelley, H.L. Transition and Hovering Flight Characteristics of a Tilt-Duct VTOL Research Aircraft; Report No.: NASA TN D-1491; National Aeronautics and Space Administration: Washington, DC, USA, 1962. [Google Scholar]
- BELL NEXUS. Available online: https://www.bellflight.com/products/bell-nexus (accessed on 14 June 2023).
- Architectural Performance Assessment of an Electric Vertical Take-Off and Landing (e-VTOL) Aircraft Based on a Ducted Vectored Thrust Concept. Available online: https://lilium.com/files/redaktion/refresh_feb2021/investors/Lilium_7-Seater_Paper.pdf (accessed on 14 June 2023).
- Whiteside, S.; Pollard, B. Conceptual Design of a Tiltduct Reference Vehicle for Urban Air Mobility. In Proceedings of the VFS Aeromechanics for Advanced Vertical Flight Technical Meeting, San Jose, CA, USA, 25–27 January 2022. [Google Scholar]
- Anderson, S.B. Historical Overview of V/STOL Aircraft Technology; Report No.: NASA-TM-812801; National Aeronautics and Space Administration: Washington, DC, USA, 1981. [Google Scholar]
- Lee, T.E.; Leishman, J.G.; Ramasamy, M. Fluid Dynamics of Interacting Blade Tip Vortices with a Ground Plane. J. Am. Helicopter Soc. 2010, 55, 022005. [Google Scholar] [CrossRef]
- Kutz, B.; Kowarsch, U.; Kessler, M.; Kraemer, E. Numerical Investigation of Helicopter Rotors in Ground Effect. In Proceedings of the 30th AIAA Applied Aerodynamics Conference, New Orleans, LA, USA, 22–28 June 2012. [Google Scholar] [CrossRef]
- Milluzzo, J.I., III; Leishman, J.G. Vortical Sheet Behavior in The Wake of a Rotor in Ground Effect. AIAA J. 2017, 55, 24–35. [Google Scholar] [CrossRef]
- Dekker, H.N.J.; Ragni, D.; Baars, W.J.; Scarano, F.; Tuinstra, M. Aerodynamic Interactions of Side-by-Side Rotors in Ground Proximity. AIAA J. 2022, 60, 4267–4277. [Google Scholar] [CrossRef]
- Wolf, C.C.; Weiss, A.; Schwarz, C.; Braukmann, J.; Koch, S.; Raffel, M. Wake Unsteadiness and Tip Vortex System of Full-Scale Helicopters in Ground Effect. J. Am. Helicopter Soc. 2022, 67, 012010. [Google Scholar] [CrossRef]
- Maisel, M.; Harris, D. Hover Tests of the XV-15 Tilt Rotor Research Aircraft. In Proceedings of the 1st Flight Test Conference, Las Vegas, NV, USA, 11–13 November 1981. [Google Scholar] [CrossRef]
- Radhakrishnan, A.; Schmitz, F. Quad Tilt Rotor Aerodynamics in Ground Effect. In Proceedings of the 23rd AIAA Applied Aerodynamics Conference, Toronto, ON, Canada, 6–9 June 2005. [Google Scholar] [CrossRef]
- Radhakrishnan, A.; Schmitz, F. An Experimental Investigation of Ground Effect on a Quad Tilt Rotor in Hover. J. Am. Helicopter Soc. 2015, 60, 012002. [Google Scholar] [CrossRef]
- Garofano-Soldado, A.; Sanchez-Cuevas, P.J.; Heredia, G.; Ollero, A. Numerical-experimental Evaluation and Modelling of Aerodynamic Ground Effect for Small-scale Tilted Propellers at Low Reynolds Numbers. Aerosp. Sci. Technol. 2022, 126, 107635. [Google Scholar] [CrossRef]
- Barata, J.M.M. Fountain Flows Produced by Multijet Impingement on a Ground Plane. J. Aircr. 1993, 30, 50–56. [Google Scholar] [CrossRef]
- Barata, J.M.M. Multiple Jet/Wall/Cross-Wind Interaction Relevant to VSTOL Ground Effects. In Proceedings of the 2013 International Powered Lift Conference, Los Angeles, CA, USA, 12–14 August 2013. [Google Scholar] [CrossRef]
- Birckelbaw, L.; NELSON, E. Infrared Flow Visualization of V/STOL Aircraft. In Proceedings of the AIAA Aircraft Design Systems Meeting, Hilton Head, SC, USA, 24–26 August 1992. [Google Scholar] [CrossRef]
- Saripalli, K.R.; Flood, J.D.; Moss, G.M. Inlet Hot Gas ingestion (HGI) and Its Control in V/STOL Aircraft. In Proceedings of the 1997 World Aviation Congress, Anaheim, CA, USA, 13–14 October 1997. [Google Scholar] [CrossRef]
- Chaderjian, N.M.; Pandya, S.; Ahmad, J.; Murman, S. Parametric Time-Dependent Navier-Stokes Computations for a YAV-8B Harrier in Ground Effect. In Proceedings of the 40th AIAA Aerospace Sciences Meeting & Exhibit, Reno, NV, USA, 14–17 January 2002. [Google Scholar] [CrossRef][Green Version]
- Page, G.J.; Mcguirk, J.J. Large Eddy Simulation of a Complete Harrier Aircraft in Ground Effect. Aeronaut. J. 2009, 113, 99–106. [Google Scholar] [CrossRef][Green Version]
- Hoggarth, R.; Mange, R. Highlights of the Lockheed Martin F-35 STOVL Jet Effects Program. Aeronaut. J. 2009, 113, 119–127. [Google Scholar] [CrossRef]
- De Savigny, R.A.; Hickey, D.H. Aerodynamic Characteristics in Ground Effect of a Large-Scale Model with a High Disk-Loading Lifting Fan Mounted in the Fuselage; Report No.: NASA TN D-1557; National Aeronautics and Space Administration: Washington, DC, USA, 1963. [Google Scholar]
- Giullianetti, D.J.; Biggers, J.C.; Maki, R.L. Longitudinal Aerodynamic Characteristics in Ground Effect of a Large-Scale, V/STOL Model with Four Tilting Ducted Fans Arranged in a Dual Tandem Configuration; Report No.: NASA TN D-4218; National Aeronautics and Space Administration: Washington, DC, USA, 1967. [Google Scholar]
- Schuster, E.P.; Carter, T.D.; Esker, D.W. Investigation of Ground Effects on Large and Small Scale Models of a Three Fan V/STOL Aircraft Configuration; Report No.: NASA CR 152240; National Aeronautics and Space Administration: Washington, DC, USA, 1967. [Google Scholar]
- Norton, D. Influence of Ground Effects on Body Forces for Bi-Copter UAV. Master’s Thesis, University of Calgary, Calgary, AB, Canada, 2017. [Google Scholar] [CrossRef]
- Advanced Air Mobility Mission Overview. Available online: https://www.nasa.gov/aam/overview/ (accessed on 14 June 2023).
- Olcott, D.D. Conceptual Design of XTI Aircraft TriFan 600. In Proceedings of the 16th AIAA Aviation Technology, Integration, and Operations Conference, Washington, DC, USA, 13–17 June 2016. [Google Scholar] [CrossRef]
- Zhao, Y.; Tian, Y.; Wan, Z. Aerodynamic Characteristics of a Ducted Fan Hovering and Transition in Ground Effect. Aerospace 2022, 9, 572. [Google Scholar] [CrossRef]
- Ansys, Inc. Ansys Fluent Theory Guide, Version 2021.1; Ansys, Inc.: Canonsburg, PA, USA, 2021. [Google Scholar]
- Menter, F.R.; Lechner, R.; Matyushenko, A. Best Practice: Generalized k-ω (GEKO) Two-Equation Turbulence Model in Ansys CFD; Technical Report ANSYS. 2019. Available online: https://fluidcodes.com/wp-content/uploads/2020/06/geko-tp-1.pdf (accessed on 14 June 2023).
- Amstad, P.; So, K.K.; Fischer, M. Machine-Learning Assisted Optimization of Generalized K-Omega (GEKO) Turbulence Model Parameters for Turbocharger Radial Compressor. In Proceedings of the ASME Turbo Expo 2022: Turbomachinery Technical Conference and Exposition, Rotterdam, The Netherlands, 13–17 June 2022. [Google Scholar] [CrossRef]
- Han, H.; Xiang, C.; Xu, B.; Yu, Y. Experimental and Computational Investigation on Comparison of Micro-Scale Open Rotor and Shrouded Rotor Hovering in Ground Effect. Proc. Inst. Mech. Eng. Part G J. Aerosp. Eng. 2021, 235, 553–565. [Google Scholar] [CrossRef]
Disclaimer/Publisher’s Note: The statements, opinions and data contained in all publications are solely those of the individual author(s) and contributor(s) and not of MDPI and/or the editor(s). MDPI and/or the editor(s) disclaim responsibility for any injury to people or property resulting from any ideas, methods, instructions or products referred to in the content. |
© 2023 by the authors. Licensee MDPI, Basel, Switzerland. This article is an open access article distributed under the terms and conditions of the Creative Commons Attribution (CC BY) license (https://creativecommons.org/licenses/by/4.0/).