Abstract
According to the big impact hypothesis, the moon should be very dry. However, more and more evidence from the remote sensing of the moon in recent years indicates that there is a lot of water in the moon’s polar regions. Researching the source and distribution of volatiles such as water can provide a key constraint on the formation and evolution of the moon. If there is a large amount of a volatile such as water ice in the polar area of the moon, it can be used as a further resource. Regrettably, there are no detectors in place to detect the amount and presence of water to date. In the new wave of lunar exploration, polar water has become one of the main tasks of NASA, ESA and RKA. The Chang’e-7 spacecraft of China’s fourth lunar exploration phase has also used the Water Molecular Analyzer and the Lunar Soil Volatile Measuring Instrument to detect water content in the lunar polar region. This paper introduces a set of methods and principles for analyzing water content via the heat flux method according to the characteristics of the Lunar Soil Volatile Measuring Instrument that was deployed on the lunar surface. According to the current design, the water content of 0.008~0.17% can be analyzed.
1. Introduction
According to the hypothesis of the origin of the lunar impact, the moon was formed via remelting at a high temperature, and the subsequent magmatic ocean stage was a degassing process, so it is generally believed that the moon lacks volatile substances [1]. As remote sensing operations of the moon have been conducted over the years, more and more evidence has emerged that there is a large amount of water in the lunar polar region. Spectral data from the Lunar Crater Observation and Sensing Satellite (LCROSS) indicated that the impact plume in the Cabeus crater contains about 5.6 wt% water ice, light hydrocarbons, sulfur-containing substances, carbon dioxide and other volatiles [2]. The lunar surface spectral data collected by the Cassini spacecraft launched by the National Aeronautics and Space Administration (NASA) and the Chandrayaan-1 spacecraft launched by India showed increased hydrogen content in the polar regions of the moon, which has the characteristics of water ice [3]. Considering the storage conditions, the low temperature in the permanently shadowed area at the lunar poles provides storage conditions for volatiles. Moreover, the material sources, the solar wind injection and the addition of comets and asteroids during great impacts (3.8~4.1 Ga) may have provided the material source for volatiles on the surface [4,5]. But these inferences are all based on theoretical analyses and remote sensing detection, and no major space agencies have conducted the in-situ detection of the content and occurrence of water ice.
For water content analysis, water quantity can be expressed as the ratio of water weight to soil weight. The most commonly used term is volumetric soil water content, which is the ratio of water volume to the total volume of the wet material. Thermogravimetry is most basic method, which is a method of obtaining the water content by measuring the weight of sample before and after heating and steaming. In addition, methods for measuring water content include neutron, capacitance, resistance, time-domain reflectometry (TDR), frequency-domain reflectometry (FDR), geophysics and remote sensing [6]. Due to the possible existence of other volatiles in lunar soil, the analytical results are ambiguous. Due to the uniqueness of mass spectrometers in the process of measuring water content, all the current implementation schemes for measuring water content in polar regions involve heated mass spectrometers. Among them, NASA has proposed to carry out Volatile Analysis by Pyrolysis of Regolith (VAPoR), heating samples with zirconia-coated platinum resistance wire, and analyzing them with a time-of-flight mass spectrometer to measure volatiles [7]. The Lunar Volatile Resources Analysis Package (L-VRAP), proposed by the Open University in the UK, can transfer lunar soil collected by other instruments from the lunar surface to heat and analyze the components of volatiles [8]. In terms of volatiles analysis, a dual mass spectrometer system (an ion trap mass spectrometer and a magnetic mass spectrometer) is adopted, which can analyze volatiles ranging from 2 to 150 amu (Anu is an abbreviation for the atomic mass unit of gas molecules analyzed). This scheme has been planned for ESA’s future lunar exploration mission [9] (Wright et al., 2012). Measuring water in the lunar polar region has become one of the main tasks of Chang’e-7. There are two devices that can detect water content in situ, one of which is the Lunar Soil Volatile Measuring Instrument mounted on a rover, which mainly relies on a quadrupole mass spectrometer and vacuum pressure prediction to measure the water content, and the measurement process is relatively simple. Another is the Water Molecular Analyzer, which has a time-of-flight mass spectrometer and laser absorption spectrum in addition. The water content measurement method of this device is not used in this paper. When water content is high, it is easy to be saturated, and water has strong adsorption on the metal material inside metallic tubes. Therefore, it is still difficult to use this method for the quantitative analysis of water content, and further systematic analysis is needed to obtain accurate water content via this method. In this paper, the process and principle of measuring the water content of lunar soil are introduced by considering measurements of volatiles of lunar soil using the Lunar Soil Volatile Measuring instrument as an example. The uncertainty of measuring the water content caused by each link is analyzed and discussed.
2. Principle of Water Content Analysis
2.1. Volatile Analysis Process
The Lunar Soil Volatile Measuring instrument on Chang’e-7 consists of a micro-sampling unit, a volatile preparation unit and the main body of the measurement unit (as shown in Figure 1). Among them, the micro-sampling unit is packaged with a sampler that can be sampled quantitatively to encapsulate the analyzed lunar soil. The micro-sampling unit, with the aid of the mechanical arm, can transfer the sample to the volatile preparation unit. After receiving the sampler containing lunar soil, the volatile preparation unit closes the cover and seals, and then heats the sample through induction heating. The volatiles of different occurrence states in lunar soil are converted into gases and released according to different temperatures. The released gas diffuses through the pipeline to the mass spectrometer. The gas is ionized by the ion source of the mass spectrometer. After passing through the quadrupole, the ions are separated into different components and in sequence bombarded on the electron multiplier according to the mass charge ratio. The electron multiplier and the signal processing circuit board can convert the ions to an electric current. The value of the current reflects the number of ions measured and further reflects the content of neutral gas before ionization.
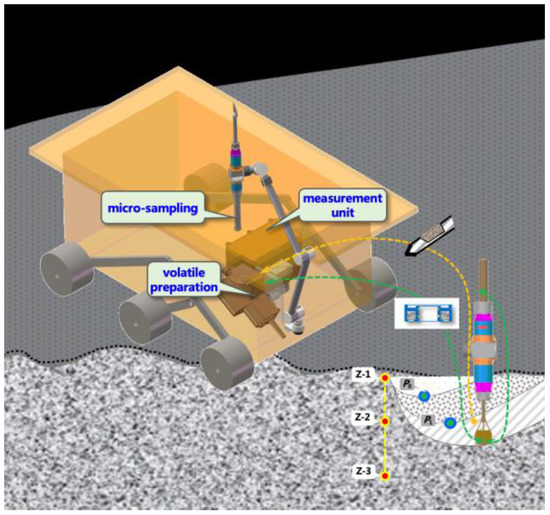
Figure 1.
Schematic diagram of lunar soil volatile component measuring instrument.
2.2. Water Analysis Process
As shown in Figure 2, after the furnace is sealed and the lunar soil is heated, water is released from the lunar soil as water vapor. Some of this water vapor is absorbed by the inside materials of the furnace chamber and pipes. The rest of the water passes through a micro-leakage hole to the mass spectrometer for analysis. At higher levels, the water vapor will reach saturation, at which point, a large amount of water will have to be expelled.
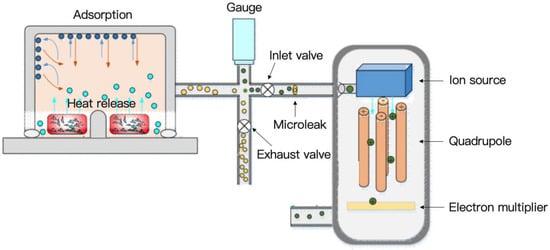
Figure 2.
Schematic diagram of water analysis process using volatile measuring instrument.
2.3. Variation Process of Water Vapor and Content in Furnace
An ideal gas is generated and released into a closed chamber. The partial pressure of the gas pressure is shown in Figure 3a, which increases slowly and then reaches equilibrium. Because water vapor has a certain adsorption property in the inside metal material of the tube, the actual partial pressure, , of the water vapor is lower than the theoretical partial pressure, P0, as shown in Figure 3b. Because the saturated vapor pressure of water is low at room temperature (based on the current thermal design of the entire Lunar Soil Volatile Measuring instrument on Chang’e-7, the on-orbit analysis temperature is close to room temperature), it is easy to reach saturation. Therefore, when the water content is high, the water needs to be analyzed after partial discharge. In order to avoid confusion between air pressure and saturated vapor pressure during measurement, the partial pressure of the water vapor under analysis needs to be much lower than the saturated vapor pressure at the current temperature. If all the water is released from the heating, after internal absorption the partial pressure of the final water vapor does not reach the saturation vapor pressure of the current temperature, but it is too high to the threshold set by the drainage; the process of the partial pressure of the water vapor from heating to measure is shown in Figure 3c. The process of the partial pressure of the water vapor from heating to measure if the partial pressure of the final water vapor does reach the saturation vapor pressure of the current temperature is shown in Figure 3d.
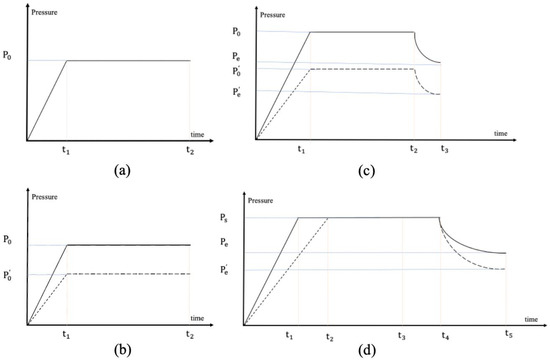
Figure 3.
Diagram of air pressure in furnace and pipe over time: (a) from 0 to t1, the ideal gas is slowly released, and the gas in the closed chamber becomes balanced from t1 to t2. P0 is finale partial pressure of the ideal gas (b) The dashed lines represent the adsorption properties of water vapor. is partial pressure after being absorbed from P0. The solid line represents the process of an ideal gas, the dashed line represents the water vapor, and so does the diagram below. (c) The water vapor is released without reaching saturation. But a certain amount of water vapor needs to be expelled to reach the range of the instrument from t2 to t1. is partial pressure of ideal gas after being excluded from P0. is partial pressure of water vapor after being excluded from P0. after being excluded from . (d) t3 to t5 represent the process of discharging water vapor, where t4 is the critical state of saturated vapor pressure and unsaturated vapor pressure. Ps is saturated vapor pressure of water. is partial pressure of water vapor after being excluded from Ps.
The amount of heated water substance in the analyzed sample can be calculated as
- n is the number of moles of water;
- P0 is the air pressure of the added water in the furnace and pipe;
- V is the furnace and pipe volume;
- R is a constant;
- T is the temperature of the furnace and pipe.
Because water vapor is easily adsorbed at room temperature, the adsorption ratio is
- α is the adsorption ratio;
- is the pressure in the adsorbed stabilized breech and line.
The water content of the analyzed sample is
- The ω stands for water content;
- m is the mass of the sample being analyzed;
- M is the mass number of water.
Water content can be obtained using Formulas (1)–(3):
When there is a process of water vapor discharge, the final water content can be expressed as
- prime is the mass of excluded water;
- is partial pressure of water vapor after being excluded.
2.4. Relationship between Mass Spectrometer Measurement and Water Content
Because there may be other volatiles in lunar soil, the value measured using the vacuum gauge in the system cannot necessarily reflect the pressure of water vapor in the furnace and pipeline. Therefore, it is necessary to analyze the chemical composition of the volatiles using a mass spectrometer to derive the partial pressure of the water vapor in the furnace and pipeline. However, the mass spectrometer needs to work in a high-vacuum environment (where the pressure is better than 1 10−5 Pa), and a large amount of water will be released after the lunar soil is heated. Therefore, a micro-leakage hole is needed to form a certain pressure difference between the furnace and the mass spectrometer chamber (as shown in Figure 4). According to the gas flow formula, the following balance relationship can be established.
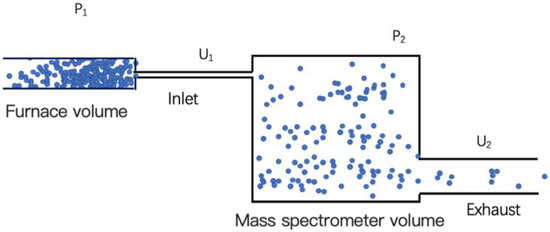
Figure 4.
Schematic diagram of air inlet and outlet of mass spectrometer cavity.
The following is a detailed description of the volatile measurement process. Because the partial pressure of the water vapor released via heating is too high, the chemical analysis using the mass spectrometer cannot directly be conducted. A method is needed to dilute the pressure of the sample being analyzed in equal proportions. Therefore, a flow conductivity dilution method is adopted. The partial pressure of the measured gas in the furnace and pipeline is defined as P1, and these gases are introduced into the mass spectrometer through a flow-limiting hole, and the partial pressure of this gas in the mass spectrometer chamber is defined as P2, as shown in Figure 4. In addition, the inlet flow conductance of the mass spectrometer is defined as U1, and the exhaust flow conductance is U2. Moreover, the lunar surface environment is assumed to be an absolute vacuum. Because the exhaust volume is less than the inlet volume in the process of air pressure equilibrium between the two, it can be approximated that the partial pressure P1 is unchanged.
where P1 can correspond to (the pressure at which a certain amount of water vapor is expelled after adsorption) or (the instrument can measure it after adsorption) according to Figure 3, which is available through a mass spectrometer.
The gas will be ionized by the ion source of the mass spectrometer, and the ion optical system will forward the charged species to the electron multiplier detector, which generates a current I. According to the principle of mass spectrometer, the partial pressure P2 of the gas in the mass spectrometer with the current I, and the correlation coefficient between the two is defined as the sensitivity, which is represented by k here, namely:
I is the current intensity measured using the mass spectrometer according to partial pressure by I and the inlet and outlet airflow guide the pressure P1 of the volatile in the furnace cavity and pipeline can be calculated:
3. Key Points of Design
According to Formula (9), it can be determined that the variables affecting the water content include sample weight, the volume of the furnace chamber and the intake pipe, the measuring range of the mass spectrometer, the working temperature, the inlet flow, the exhaust flow and the adsorption ratio of water vapor. The working temperature is guaranteed by the platform, and the adsorption ratio of water is determined by the material properties. Therefore, the remaining five aspects are the keys to measuring water content.
3.1. Sample Weight
Mass spectrometers are sophisticated trace analysis instruments [10,11], but lunar soil is rich in volatiles [12,13,14,15,16,17,18,19,20], which seems contradictory. In view of the measurement principle of a mass spectrometer, the smaller the mass of sample is, the better the measurement of volatiles. Without sophisticated equipment and with humans, the quantitative collection of samples on the lunar surface is a very difficult task.
Since the extraction temperature of volatiles needs to reach 900 °C, the design of the sampling vessel needs to consider the regularities of distribution regarding magnetic flux to ensure that the lunar soil can obtain a high-temperature environment of 900 °C. Therefore, the overall configuration of the sampling vessel is a ring mechanism. The quantitative sampling of the sampling vessel needs to be based on a fixed volume and density. A fixed volume needs to determine the width and height of the annular section of the sampling vessel, while a fixed density requires a stable injection pressure. Considering the heating effect and the analytical capability of the mass spectrometer, the median design for each sample weight is 200 mg. Based on the average lunar soil density of 1.5 g/cm3 [20,21,22,23], the current size of the sampling vessel is 16.35 mm in inner diameter, 18 mm in outer diameter and 3 mm in height. If the filling density of the lunar soil is 0.9~1.9 g/cm3, the mass of the lunar soil in the sampling vessel is 120~253 mg, etc.
3.2. Pressure Range for Mass Spectrometer Analysis
Volatiles are measured via mass spectrometry, which consists of an ion source, mass analyzer and detector. The basic principles of mass spectrometry are to firstly ionize the neutral molecules of volatile matter within the ion source, generating charged ions with different mass-to-charge ratios (m/z). The ions gradually separate under the action of an electric or magnetic field in the mass analyzer, and the ions with the same mass to charge ratio arrive at the detector at the same time, so that the detector generates electrical signals. The mass to charge ratio of an ion can be deduced from the generation time of the electric signal, and the amplitude of the electric signal is proportional to the number of ions [24].
Based on the current device, the volatiles in lunar soil are mainly inorganic gas with a small mass number weight less than 150 amu. When the mass resolution is less than 1 amu, the volatiles of different elements can be separated. In addition, the volatile content varies greatly, so the mass spectrometer requires a low detection limit and a high dynamic range. Considering the engineering limitations such as weight and power consumption, a quadrupole mass spectrometer was selected as a measuring unit for volatiles of lunar soil.
As volatiles include He (24.6 eV) and Ne (21.5 eV) atoms with high ionization energy, electron bombardment ion sources with high ionization efficiency and stability are selected as ion sources. The electron bombardment ion source contains an electron emitter similar to a filament. After being energized, it reaches a high temperature of nearly 2000 K, so that the internal free electrons gain more heat energy than the escaped work and are emitted from the surface. These electrons are accelerated to 70 eV by the accelerating electrode and interact with volatile molecules, transferring energy to them far higher than the ionization energy of atoms and molecules. Therefore, the excess energy causes atoms to lose electrons and molecules to break up, and many ions are produced. The number of electrons emitted by the ion source, the current value, will directly determine the number of ions produced and ultimately affect the sensitivity.
A quadrupole mass analyzer is a component that screens ions according to different mass to charge ratios. The main structure consists of four identical circular rod-shaped electrodes and two insulated supports for fixing the electrodes [25].
The detector uses an electron multiplier, which has high gain, long life, low noise and mature technology. The amplitude of the electric signal produced by the electron multiplier is positively correlated with the amplitude of the high voltage. In order to improve the accuracy and sensitivity of the volatile measurement instrument, two electronic multipliers are installed. One is applied at a high voltage of about 1.5 kV, the intensity of the analog signal is proportional to the number of ions, and the gain is about 106, which is used for the detection of a high concentration of volatile. The other is applied at a high voltage close to −3 kV, with a gain of about 108. At this voltage, high abundant peaks are saturated, but trace elements can be observed, which is the reason why the dynamic range can be increased. The dynamic range of the electron multiplier in each operating mode is about 105 [26]; considering the overlap between the both, the combined dynamic range can be extended to 107~108.
Before mass spectrometry measurement, the volatiles with a mass quantity of n were all diffused into the mass spectrometer cavity, that is, the identified volume of the mass spectrometer cavity, where a specific pressure was formed according to the standard gas equation:
- is the specific pressure;
- n is the number of moles;
- R is the gas constant;
- T is the gas temperature;
- Vms is the volume of the mass spectrometer cavity; the current value is about 1.2 L.
Since the pressure Pms in the mass spectrometer cavity can be accurately measured via the vacuum gauge during the test process, the concentration detection range and sensitivity of the mass spectrometer are usually measured via the vacuum gauge pressure. After the verification of the prototype, when the electron emission current of the ion source is 500 μA, the mass resolution of the quadrupole is 1 amu and the voltage of the count mode electron multiplier is −2600 V, the quadrupole mass spectrometer can detect helium gas with the partial pressure of 5 × 10⁻¹¹ Pa in the cavity (as shown in Figure 5). The upper limit of working pressure of the mass spectrometer in the volatile measuring unit is set at 5 × 10⁻³ Pa. The main limiting factor is that high pressure will greatly shorten the life of the filament and electron multiplier, and interfere with the stable flight of ions in the quadrupole, affecting the mass resolution. Therefore, the quadrupole mass spectrometer currently in use can accurately measure the pressure range of 5 × 10⁻¹¹ Pa~5 × 10⁻³ Pa.
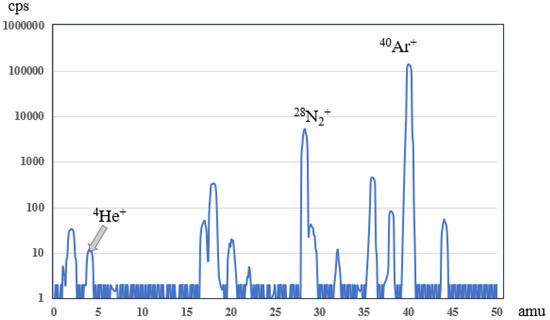
Figure 5.
Diagram of quadrupole mass spectrometer analysis when 1 × 10⁻⁵ Pa air is purified via a getter (for about 1 × 10⁻⁵ Pa air, the partial pressure of He is about 5.61 × 10⁻⁵ Pa 10−11 Pa, and the mass spectrometer can measure its weak signal. In addition, most of the nitrogen and oxygen in the air are absorbed via a getter, and argon is the main component).
3.3. Exhaust Flow
According to the present analysis, the quality of the results of volatiles measured using the mass spectrometer is related to the release of gas from the cavity itself and the residue of the last sample. In terms of performance, the more exhaust, the more accurate the sample analysis results, so the larger the exhaust flow conductance, the better the degassing. According to the calculation formula of exhaust pipe flow conductance:
- is the flow conductance;
- α is the correlation coefficient;
- d is the pipe diameter;
- L is the pipe length.
Considering that the drainage position needs a valve, according to the above formula and combined with the actual situation, the size of the design of the exhaust airflow is affected by the effective diameter of the valve, the length of the pipe, and the inner diameter of the pipe. Among them, the larger the effective diameter of the sealed space valve with high reliability, the greater the weight, and the effective diameter of the valve can be 0.04 m within the current 200 g weight budget. Considering the valve and pipe welding, the inner diameter of the pipe is also 0.04 mm. The flow can be calculated so that when air is the medium molecular flow state at 20 °C, the α value is 121. According to the current design, the length of pipe is 0.24 m. It can be calculated that the exhaust flow conductance is about 0.032 m3/s, namely 32 mL/s.
3.4. Inlet Flow
The minimum temperature of pipeline working in track is 20 °C, and the saturated vapor pressure of water at this time is 2338 Pa. When the water content is high, the air pressure released can easily reach or approach this value, and no matter how high the water content is, it cannot break through this inherent property of water. This can lead to measurement errors. So, the maximum pressure needed to be much lower than 2338 Pa, which was set at 1500 Pa for the convenience of calculation. The maximum pressure measured using the mass spectrometer was 0.005 Pa. Exhaust flow conductance was determined to be 32 mL/s. According to the measurement principle, Formula (5) can calculate that the flow conductance of the intake air needs to be less than 0.23 mL/s. Considering the design margin, this target was set at 0.2 mL/s.
3.5. Water Content Range
The partial pressure of steam in the furnace chamber and piping was kept in the range of 50~1500 Pa, which could be analyzed using the mass spectrometer. Based on previous water adsorption tests, the maximum adsorption capacity was 45% and the minimum adsorption capacity was 25%, which could be calculated and measured according to Formula (2). Considering the ideal gas, the partial pressure range of water vapor could be analyzed from 90 to 2000 Pa. According to Formula (4) and the current designed volume of furnace cavity and pipeline of 21.5 mL, it could be calculated that the corresponding water content was 0.008~0.17% under the standard state of lunar soil corresponding to 200 mg. At present, this scope covers the current remote sensing analysis of water content in the polar light region [18].
4. Conclusions
The source and magnitude of the uncertainty of the water content in the volatile measurement via the Lunar Soil Volatile Measuring Instrument installed on Chang’e-7 were analyzed. The main uncertainties were lunar soil weight, mass spectrometer analysis and cavity pipe adsorption when the water content was in the range of 0.008~1.7%. This analysis accuracy can effectively assess the lunar soil water content and can provide technical support for the assessment of surface water resources in the landing area.
Author Contributions
Conceptualization, H.H., S.J., Z.L., L.W., H.G., C.X. and G.C.; methodology, J.T. and R.L.; validation, Z.Z., J.L. and J.H.; writing—original draft preparation, Z.L.; writing—review and editing, H.H., J.L., J.H., J.T., Z.Z., S.J., G.C., R.L., L.W., H.G. and C.X.; supervision, L.W. and H.G.; project administration, C.X. All authors have read and agreed to the published version of the manuscript.
Funding
This work was supported by the National Key R&D Program of China (2020YFE0202100); the Key Research Program of the Institute of Geology & Geophysics, CAS, Grant No. IGGCAS-202203; the National Science Foundation of China (4224100145, 52105549, U2013603); the China Postdoctoral Science Foundation (No. 2021M690828); the Heilongjiang Postdoctoral Grant (No. LBH-Z20145); and the Self Planned Task (NO.SKLRS202113B) of State Key Laboratory of Robotics and System (HIT).
Data Availability Statement
Not appliacable.
Conflicts of Interest
The authors declare no conflict of interest.
References
- Lin, Y.T. Key issues of the formation and evolution of the moon. Geochimica 2010, 39, 1–10. [Google Scholar]
- Colaprete, A.; Schultz, P.; Heldmann, J. Detection of Water in the LCROSS Ejecta Plume. Science 2010, 330, 463–468. [Google Scholar] [CrossRef] [PubMed]
- Bussey, D.B.J.; Fristad, K.E.; Schenk, P.M.; Robinson, M.S.; Spudis, P.D. Planetary science: Constant illumination at the lunar north pole. Nature 2005, 434, 842. [Google Scholar] [CrossRef] [PubMed]
- Cohen, B.A. Support for the Lunar Cataclysm Hypothesis from Lunar Meteorite Impact Melt Ages. Science 2000, 290, 1754–1756. [Google Scholar] [CrossRef] [PubMed]
- Crider, D.H.; Vondrak, R.R. Hydrogen migration to the lunar poles by solar wind bombardment of the moon. Adv. Space Res. 2002, 30, 1869–1874. [Google Scholar] [CrossRef]
- Hardie, M. Review of Novel and Emerging Proximal Soil Moisture Sensors for Use in Agriculture. Sensors 2020, 20, 6934. [Google Scholar] [CrossRef] [PubMed]
- Getty, S.A.; ten Kate, I.L.; Feng, S.H.; Brinckerhoff, W.B.; Cardiff, E.H.; Holmes, V.E.; King, T.T.; Li, M.J.; Mumm, E.; Mahaffy, P.R.; et al. Development of an evolved gas-time-of-flight mass spectrometer for the Volatile Analysis by Pyrolysis of Regolith (VAPoR) instrument. Int. J. Mass. Spectrom. 2010, 295, 124–132. [Google Scholar] [CrossRef]
- Morse, A.D.; Barber, S.J.; Dewar, K.R.; Pillinger, J.M.; Sheridan, S.; Wright, I.P.; Gibson, E.K.; Merrifield, J.A.; Howe, C.J.; Waugh, L.J.; et al. Lunar Volatiles and Their Characterisation by L-VRAP (the Lunar Volatile Resources Analysis Package); European Planetary Science Congress (EPSC): Madrid, Spain, 2012. [Google Scholar]
- Wright, I.P.; Sheridan, S.; Morse, A.D.; Barber, S.J.; Merrifield, J.A.; Waugh, L.J.; Howe, C.J.; Gibson, E.K.; Pillinger, C.T. L-VRAP—A lunar volatile resources analysis package for lunar exploration. Planet Space Sci. 2012, 74, 254–263. [Google Scholar] [CrossRef]
- Johnson, J.V.; Yost, R.A. Tandem mass spectrometry for trace analysis. Anal. Chem. 1985, 57, 758A–768A. [Google Scholar] [CrossRef]
- Yost, R.A. Why tandem mass spectrometry for trace analysis: Concepts of tandem analytical techniques. Rapid Commun. Mass Spectrom. 2022, 36, e9310. [Google Scholar] [CrossRef]
- Gibson, E.K.; Johnson, S.M. Thermal analysis—inorganic gas release studies of lunar samples. In Proceedings of the Second Lunar Science Conference, Houston, TX, USA, 11–14 January 1971; Volume 2, pp. 1351–1366. [Google Scholar]
- Gibson, E.K., Jr.; Moore, G.W. Volatile-rich lunar soil: Evidence of possible cometary impact. Science 1973, 179, 69–71. [Google Scholar] [CrossRef]
- Simoneit, B.R.; Christiansen, P.C.; Burlingame, A.L. Volatile element chemistry of selected lunar, meteoritic, and terrestrial samples. In Proceedings of the Fourth Lunar Science Conference, Houston, TX, USA, 5–8 March 1973; Volume 4, pp. 1635–1650. [Google Scholar]
- Saal, A.E.; Hauri, E.H.; Cascio, M.L.; Van Orman, J.A.; Rutherford, M.C.; Cooper, R.F. Volatile content of lunar volcanic glasses and the presence of water in the Moon’s interior. Nature 2008, 454, 192–195. [Google Scholar] [CrossRef] [PubMed]
- Swindle, T.D.; Kring, D.A. Implications of small comets for the noble gas inventories of Earth and Mars. Geophys. Res. Lett. 1997, 24, 3113–3116. [Google Scholar] [CrossRef]
- Stubbs, T.; Horanyi, M.; Mahaffy, P.; Wang, Y.; Benna, M.; Elphic, R.; Sarantos, M.; Kempf, S.; Colaprete, A.; Hurley, D.; et al. The effects of meteoroid streams on the lunar environment: Observations from the LADEE mission. In Proceedings of the 40th COSPAR Scientific Assembly, Moscow, Russia, 2–10 August 2014. [Google Scholar]
- Li, S.; Milliken, R.E. Water on the surface of the Moon as seen by the Moon Mineralogy Mapper: Distribution, abundance, and origins. Sci. Adv. 2017, 3, e1701471. [Google Scholar] [CrossRef] [PubMed]
- Hofer, L.; Wurz, P.; Buch, A.; Cabane, M.; Coll, P.; Coscia, D.; Gerasimov, M.; Lasi, D.; Sapgir, A.; Szopa, C.; et al. Prototype of the gas chromatograph–mass spectrometer to investigate volatile species in the lunar soil for the Luna-Resurs mission. Planet. Space Sci. 2015, 111, 126–133. [Google Scholar] [CrossRef]
- Mitchell, J.K.; Houston, W.N.; Scott, R.F.; Costes, N.C.; Carrier, W.D., III; Bromwell, L.G. Mechanical properties of lunar soil: Density, porosity, cohesion and angle of internal friction. In Proceedings of the Lunar and Planetary Science Conference Proceedings, Houston, TX, USA, 10–13 January 1972; Volume 3, p. 3235. [Google Scholar]
- Carrier, W.D., III; Mitchell, J.K.; Mahmood, A. The relative density of lunar soil. In Proceedings of the Lunar and Planetary Science Conference, Houston, TX, USA, 5–8 March 1973; Volume 4, p. 2403. [Google Scholar]
- Papike, J.J.; Simon, S.B.; Laul, J.C. The lunar regolith: Chemistry, mineralogy, and petrology. Rev. Geophys. 1982, 20, 761–826. [Google Scholar] [CrossRef]
- Slyuta, E.N. Physical and mechanical properties of the lunar soil (a review). Sol. Syst. Res. 2014, 48, 330–353. [Google Scholar] [CrossRef]
- Beauchamp, J.; Herbig, J.; Dunkl, J.; Singer, W.; Hansel, A. On the performance of proton-transfer-reaction mass spectrometry for breath-relevant gas matrices. Meas. Sci. Technol. 2013, 24, 125003. [Google Scholar] [CrossRef]
- Kanu, A.B.; Dwivedi, P.; Tam, M.; Matz, L.; Hill, H.H., Jr. Ion mobility–mass spectrometry. J. Mass Spectrom. 2008, 43, 1–22. [Google Scholar] [CrossRef] [PubMed]
- Colson, W.B.; McPherson, J.; King, F.T. High-gain imaging electron multiplier. Rev. Sci. Instrum. 1973, 44, 1694–1696. [Google Scholar] [CrossRef]
Disclaimer/Publisher’s Note: The statements, opinions and data contained in all publications are solely those of the individual author(s) and contributor(s) and not of MDPI and/or the editor(s). MDPI and/or the editor(s) disclaim responsibility for any injury to people or property resulting from any ideas, methods, instructions or products referred to in the content. |
© 2023 by the authors. Licensee MDPI, Basel, Switzerland. This article is an open access article distributed under the terms and conditions of the Creative Commons Attribution (CC BY) license (https://creativecommons.org/licenses/by/4.0/).