Abstract
During the development stage of a space vehicle, instrumented tests are carried out on the ground to prove the operational capacity of each liquid-propellant rocket engine, which is installed in this type of vehicle. The task of elaborating a Test Bench project for a propulsion unit with this application is complex and involves several steps, one of these steps being related to the analysis of this bench capacity to meet the algorithms for the liquid-propellant rocket-engine full run of tests, which is considered fundamental for this project’s operational success. Due to the high costs involved in this project’s elaboration and execution, it is strategic to use computational resources to evaluate, by simulation, the main operational functionalities that are previously established for this bench to perform. In this context, this work presents a model proposal through Petri Nets to evaluate, by computer simulation, an architecture capacity that was designed for the Test Bench to meet an algorithm dedicated to the liquid-propellant pipelines purge during the run of hot tests with the liquid-propellant rocket engine. The method used in this work to carry out the simulation shows the operational response of each module of this architecture, in accordance with the steps contained in the purge algorithm, which allows for analyzing, for each event of the process, the Petri Nets properties, mainly those related to the conservativeness, liveliness, deadlock-type, and confusion-type conflicts. The simulation carried out with the proposed model allows for the portrayal of the physical architecture and the operational states of the purge system according to the steps foreseen in the algorithm, showing that the conservation property is met because the number of marks remains constant, the vivacity property is also met since all positions have been reached, and there is no mortal-type conflict, as the simulation is not stopped; only confusion-type conflict is identified, which was solved with the strategic insertion of resources in the model in order to fix crashes related to the competition for tokens in the transition-enabled entries. The satisfactory results obtained in these simulations suggest that the modules provided for this architecture are sufficient and appropriate for carrying out all the steps contained in the purge algorithm, which will minimize or even eliminate the disorders that may be caused by the presence of foreign elements in the propellant supply lines during the tests with the rocket engine.
1. Introduction
The current level of technological development has enabled space exploration with rockets that mainly use propulsion units based on liquid propellant during space vehicle operation [1,2]. Furthermore, historical experience supports the importance of carrying out instrumented tests on the ground to determine the effectiveness and operational efficiency of these propulsion units. Such activities have to be carried out during the stages of development, qualification, certification, and acceptance, aiming to demonstrate the acceptability of the systems that compose the rocket-engine set [3,4].
Most of these tests are carried out in facilities called Test Benches. These have to be flexible and modular, enabling tests with the aforementioned set and collecting essential performance parameters from the propulsion units [5,6]. In addition to this, elaborating projects to meet structures of this nature is considered a complex task and must be carried out in several stages. One of these steps is related to the established algorithms for the complete performance of tests with a rocket engine, which is considered fundamental for the operational success of this project [7,8].
Among these algorithms, there is a logical sequence of instructions dedicated to the command of the inert gas flow control valves used in the purge system. This procedure is carried out to perform the effective cleaning of the lines, thus avoiding the presence of foreign bodies and volatile mixtures in the ducts used in the tests [9,10,11]. Based on this, and considering the application characteristics, it is possible to use the graphical modeling method, with mathematical support, called Petri Nets. This method can visualize the dependencies of the pairs in the system to test properties, to carry out performance analysis, and to simulate discrete events, among other things [12,13].
Among the several possible applications in the segment at hand are those related to:
- A distinctive resource for assisting the algorithm analysis that is intended to be used in rocket-engine tests.
- The use of Petri Nets in the evaluation process of routines used in a Rocket-Engine Test Bench.
- The introduction of graphical modeling with a mathematical basis for the study of dynamic systems and discrete events applied in the analysis of algorithms dedicated to the purge process.
- The capacity of the simulation of a model through Petri Nets to show anomalies and/or ambiguities arising from the rocket-engine test process in a Test Bench.
- The possibility of modeling and simulating systems that encompass the three main levels of system automation.
- The capacity of evaluating the properties of a system model drafted through Petri Nets and proposing improvements that contribute to making it safer and more robust.
- The possibility of carrying out simulation analysis as well as implementing new resources and functionalities in the architecture used in order to improve the performance of liquid-propellant rocket-engine tests, among other things.
In this context, this work presents a proposal for a model through Petri Nets to evaluate, by computer simulation, the capacity of an architecture that was idealized for a Test Bench. In addition to this, the method aims to meet an algorithm dedicated to the purge of liquid propellant pipelines during the execution of hot tests with the liquid-propellant rocket engine.
2. Goals
The main goals of this work are: (i) presenting a model proposal through Petri Nets to simulate the steps established in the algorithm that perform the purge of ducts that serve the liquid-propellant supply lines for a rocket engine in a Test Bench and (ii) showing the most relevant results that were obtained with the validation tests of this algorithm.
3. Test Bench
These facilities can be segmented into three main parts: (i) the hydraulic system, (ii) the control and supervision system, and (iii) the operation and support infrastructure; this last one contains the gantry responsible for supporting the thrust force generated during the operation of propulsion units [14,15].
Typically, the Test Bench should enable the installation and testing of different models and/or rocket-engine families, in addition to providing integration with other elements of the system, such as tanks, piping, control valves, sensors, actuators, regulators, telemetry instruments, and refrigeration circuits, among others, as shown in Figure 1 [16,17].
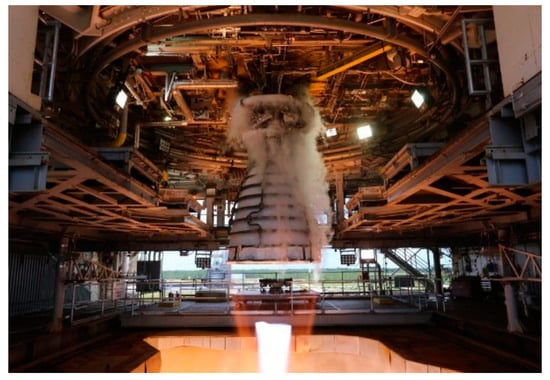
Figure 1.
Rocket engine test bench.
Among the different activities that can be carried out in these facilities, those pertinent to the development, integration, validation, and certification of new engines stand out, allowing (mainly) for the evaluation of parameters related to: (i) the thrust, (ii) the mass flow, (iii) the temperature, (iv) the vibration, (v) the stability of the set when subjected to the limit of requests, and (vi) guaranteeing that all hardware and software elements meet the requirements established for the project [18,19].
4. Purge System
In its majority, the system that purges the ducts that serve the rocket-engine liquid-propellant supply lines in the Test Bench is designed to command, monitor, and control the actuation of valves, pressure regulators, and other elements contained in the installation before the specimen ignition, aiming to expel foreign particles and volatile mixtures, effectively cleaning the last section of these ducts that serve the engine [20,21].
After the hot operation of the engine, the system is activated again to remove the residual fuel and oxidant in the supply lines, which represent potential risks of combustion and/or accidental contact due to leakage and evaporation while handling the components connected to the rocket engine [22].
5. Petri Nets
This graphical modeling method, with mathematical reasoning, was presented in the 1960s by Carl Adam Petri in his doctoral thesis Kommunikatin Mit Automaten (Communication with Automata), defended at the Faculty of Mathematics and Physics of the University of Darmstadt, Germany, which addresses the study of dynamic systems and discrete events as an alternative to avoid the existing state explosion in the graphical representation of systems modeled by automata [23].
Considering the mathematical formalism, Petri Nets can be defined as a quintuple, as represented in Equation (1), because they have directed, bipartite, and weighted graphs, containing a position node and another of transition, connected by oriented arcs in the model [24,25].
The nomenclatures contained in Equation (1) have the following meanings:
RP = Petri Nets.
P = {p1, p2, …pm}: finite set of places.
T = {t1, t2, …tn}: finite set of transitions.
A ⸦ (P × T)
∪ (T × P): finite set of arcs.
W: F → N+: function that assigns the weight of each arc.
M0: P → N: initial selection function.
6. Development
The elaboration of a model proposal through Petri Nets to represent the liquid-propellant supply-lines purge process during the rocket-engine operational evaluation in the Test Bench requires the following definitions to be established in advance: (i) physical architecture that will be used to perform the purge, (ii) algorithm containing the essential steps for the propellant purge, and (iii) computational resources—hardware and software—necessary to perform the pertinent simulations.
6.1. Physical Architecture of the Purging System
In this work, the elements established in the component diagram shown in Figure 2 are considered as an example of physical architecture for carrying out the purge of rocket-engine liquid-propellant-lines ducts in the Test Bench.
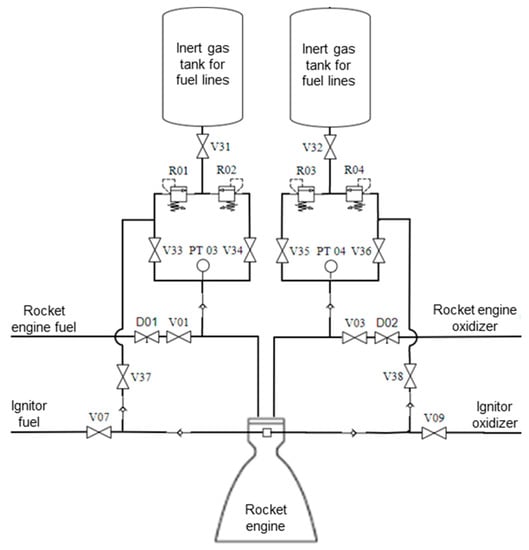
Figure 2.
Purge-system component diagram.
The acronyms defined for the elements contained in the aforementioned architecture have the meanings and characteristics shown in Table 1. These definitions are compatible with and similar to those used in rocket-engine test facilities that are used in the Brazilian space sector.

Table 1.
Architecture elements.
6.2. Purge Algorithm
The specific sequence of macro actions foreseen in the algorithm that performs the ducts purge which serve the liquid-propellant supply lines for the rocket engine in the Test Bench is contained in the synthetic flowchart shown in Figure 3.
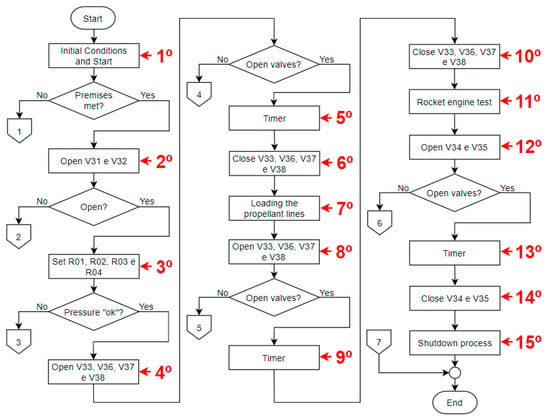
Figure 3.
Purge algorithm flowchart.
The process blocks represented in this flowchart are related to the steps of the algorithm, as shown in Table 2.

Table 2.
Description algorithm blocks.
It should be mentioned that the conditional decisions contained in the flowchart shown in Figure 3, have outlets indicating 1, 2, 3, 4, 5, and 6, which refer to subroutines containing specific processes for handling each of these events, which are not addressed in this work; however, after the possible performance of these subroutines, the main flow of actions returns to the connector with indication 7.
6.3. Model by Petri Nets
The model to be prepared must represent the Petri Nets in a distinct manner, linked with the following automation layers foreseen for the purge system: (1) HMI—Human–Machine Interface, (2) Control, and (3) Sensor Actuator. The division into levels or layers mainly aims to divide the elements that compose a system into different groups, facilitating the interpretation of the role played by each level or layer established in an automation architecture, as shown in Figure 4.
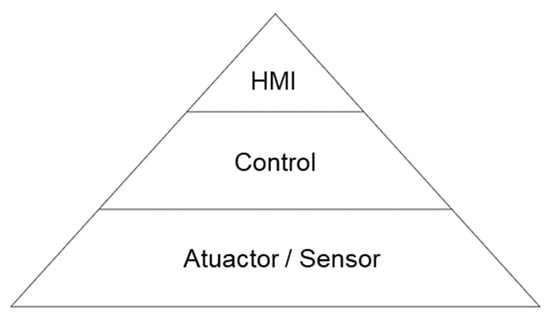
Figure 4.
Established automation layers.
6.3.1. First Layer Model
The Figure 5 shows an example of a model created through Petri Nets to represent the operational states considered for the set actuator and sensor of the V31 valve, contained in the component diagram shown in Figure 2.
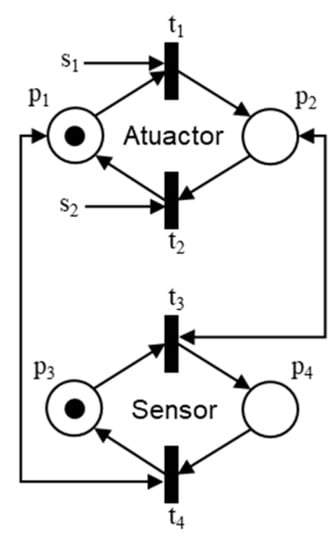
Figure 5.
Model of the actuator and valve sensor V31 for the closed state.
In this figure, position p1 is defined to represent the closed state of valve actuator V31, position p2 is defined to represent the open state of valve actuator V31, position p3 is defined to represent the closed state indicated by valve sensor V31, and position p4 is defined to represent the open state indicated by valve sensor V31. Transition t1 is set to change valve actuator V31 from a closed state to an open state; transition t2 is set to change valve actuator V31 from the open state to the closed state; transition t3 is set to perform the indication change of valve sensor V31 from a closed state to an open state; transition t4 is defined to perform the indication change of valve sensor V31 from an open state to a closed state.
6.3.2. Second Layer Model
The Figure 6 presents an example of the main parts established in the drafted model through Petri Nets (input, algorithm step, and output) to represent the process’ first (1st) step, i.e., valve V31 opening, which will be carried out by the control system, in accordance with the algorithm contained in the synthetic flowchart shown in Figure 3.
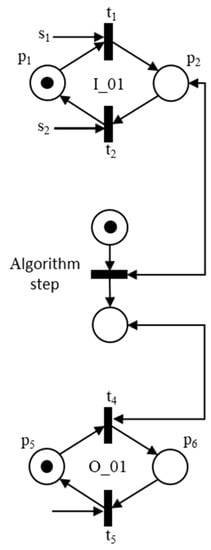
Figure 6.
Model for the second process.
In this figure, position p1 is defined to represent the input (I_01) deactivated state of the Controller; position p2 is defined to represent the input (I_01) activated state of the Controller; position p3 is defined to represent the state in which the Controller program is stopped at the beginning of the process’ first (1st) step execution; position p4 is defined to represent the state in which the Controller program is able to perform the process’ first (1st) step; position p5 is defined to represent the output (O_01) disabled state of the Controller; and position p6 is defined to represent the output (O_01) activated state of the Controller. Transition t1 is defined to carry out the change from the disabled state to the enabled state of the input (I_01) of the Controller; transition t2 is defined to carry out the change from the enabled state to the disabled state of the input (I_01) of the Controller; transition t3 is defined to carry out the change from the stopped state to be abled state, to perform the process’ first (1st) step; transition t4 is defined to carry out the change from the disabled state to the enabled state of the output (O_01) of the Controller; and transition t5 is defined to carry out the change from the enabled state to the disabled state of the output (O_01) of the Controller.
6.3.3. Third Layer Model
The Figure 7 shows an example of the model created through Petri Nets to represent the operational states considered for the virtual element of command contained in the Human–Machine Interface (HMI) layer. This virtual element is used to remotely command the automatic execution start of the algorithm programmed in the second layer Controller, in accordance with the synthetic flowchart shown in Figure 3.
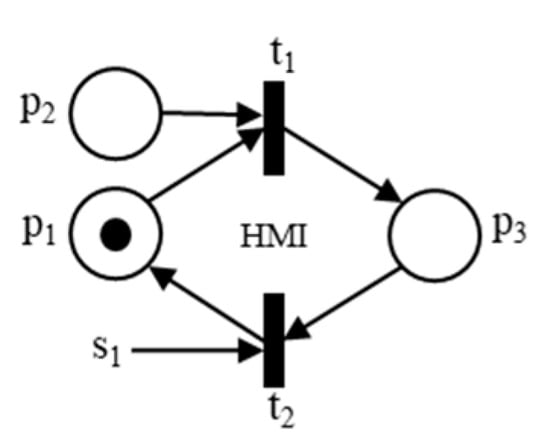
Figure 7.
Model for the virtual element of command in the HMI.
In this figure, position p1 is defined to represent the disabled state of the virtual element of command in the HMI; position p2 is defined to represent the state related to the action of the user in commanding, in the HMI, the beginning of the automatic sequence of the steps of the algorithm applied to the specimen test; and position p3 is defined to represent the enabled state of the virtual element of command in the HMI. Transition t1 is defined to perform the change from disabled to enabled state of the virtual command element on the HMI, and transition t2 is defined to carry out the change from enabled to disabled state of the virtual command element on the HMI.
6.3.4. Complete Model through Petri Nets
The complete model designed though low-level Petri Nets to represent the main operational states that can be established in the system that performs the ducts’ purge, which serve the propellant supply lines for rocket motors in the Test Bench, in accordance with the previously defined physical architecture and algorithm, is shown in Figure 8.
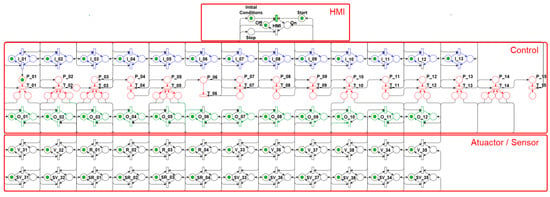
Figure 8.
Complete Petri Nets for the purge system.
In this context, it should be highlighted that this technique for system modeling is based on area-specific academic publications, which portray, in greater detail, the application real condition, the nature of systems, and the related operational dynamics [26,27].
To elaborate the model through Petri Nets and accomplish the respective analyses presented in this work, the resources of the integrated development environment called CPN Tools were used, which is a software used to model, simulate, and analyze colored Petri Nets, developed by the University of Aarhus, Denmark [28,29,30].
The distribution of positions, the transitions, the connection of arcs, and the number of tokens, shown in the Figure 8 model, comprise the proposed model presented in this work to evaluate the purge system, in which the characteristics listed below are considered.
In the Human–Machine Interface (HMI) layer, the following operating states are foreseen:
- Initial conditions: indicates that the previous stages for performing the test were met, such as installing the specimen on the gantry, the loading of tanks, the built-in self-test, etc.
- Turn On: command to start the purge process in the automatic mode.
- Turn Off: command to finish the purge algorithm sequence.
- OFF: position that shows the user that the purge system is disabled.
- ON: position that shows the user that the purge system is in operation.
In the Control layer, shown in the following resources are foreseen to control the architecture shown in Figure 2:
In the Sensor/Actuator layer, the following operating states are foreseen:
- ON: position to show that the valves are open and the pressure regulators are acting according to the previously parameterized value.
- OFF: position to show that the valves are closed and the pressure regulators are not operating.
6.4. Simulation
The token distribution, shown in the Figure 8 model, portrays a certain state of Petri Nets that is considered in this work as an initial condition to perform the simulation of the steps contained in the purge algorithm.
From this state, the “Initial Conditions” of the test are met, and the “Turn on” command is enabled by the user on the Human–Machine Interface (HMI); this net evolves to a new state, which is shown in Figure 9. In this new state, the “ON” position of the HMI layer is enabled to show the user that the purge algorithm is being simulated in the integrated development environment, with the activation of input I_01 in the Control layer, an action referring to the algorithm’s first step (1st), shown in Figure 3.
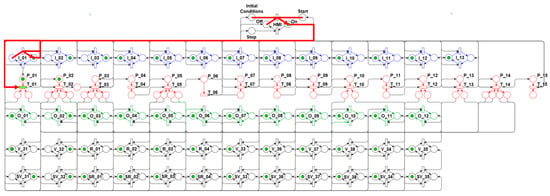
Figure 9.
Algorithm’s first step—Start simulation.
To meet the algorithm’s second step (2nd), the net evolves to the state shown in Figure 10. In this state, outputs O_01 and O_02 in the Control layer are enabled, which activate valves V31 and V32, changing from the closed (OFF) to the open (ON) condition, and their respective sensors SV31 and SV32, changing from disabled (OFF) to enabled (ON), with the simultaneous sending of feedback signals to the I_02 and I_03 inputs, which belong to the Control layer. These valves opening releases the inert gas flow, which is under positive pressure in the respective tanks, filling the purge-system pipes of the propellant lines up to the inlets of valves V33, V34, V35, V36, V37, and V38.
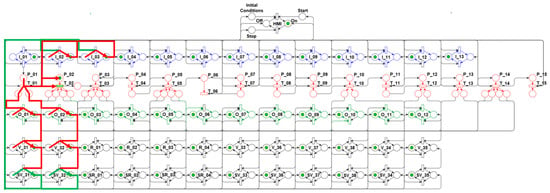
Figure 10.
Algorithm’s second step—Open valves.
The algorithm’s second step, portrayed within the component diagram scope of the first automation layer, is shown in Figure 11.
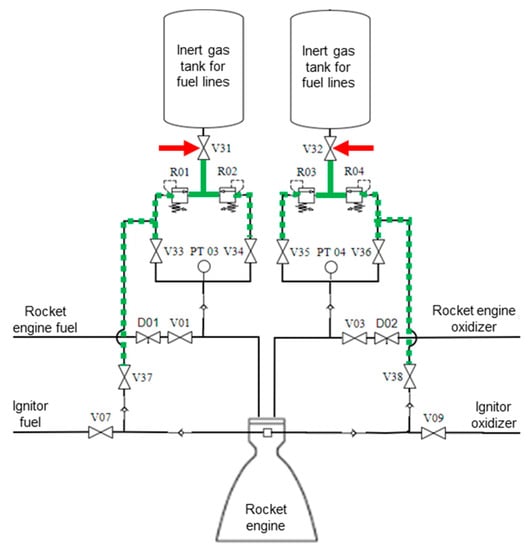
Figure 11.
Algorithm’s second step diagram.
To meet the algorithm’s third step (3rd), the net evolves to the state shown in Figure 12. In this state, the outputs O_03, O_04, O_05, and O_06 are activated in the Control layer, which trigger the pressure regulators R01, R02, R03, and R04, according to the parameterized values in the “Initial Conditions”, which change from the closed condition (OFF) to the open condition (ON), and their respective sensors SR01, SR02, SR03, and SR04, which change from disabled (OFF) to enabled (ON), with the simultaneous sending of feedback signals to inputs I_04, I_05, I_06, and I_07, which belong to the Control layer. The activation of the regulators R_01 and R_04 sets low inert gas pressure to the propellant lines, which supply the rocket-engine initialization subsystem, while the regulators R_02 and R_03 set high inert gas pressure to the main propellant lines, which supply the rocket engine during its operation.
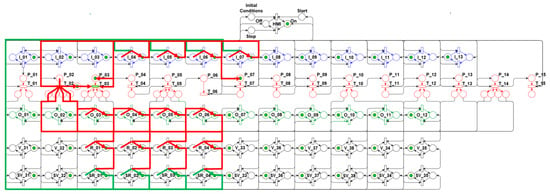
Figure 12.
Algorithm’s third step—Activate regulators.
The algorithm’s third step, portrayed within the component diagram scope of the first automation layer, is shown in Figure 13.
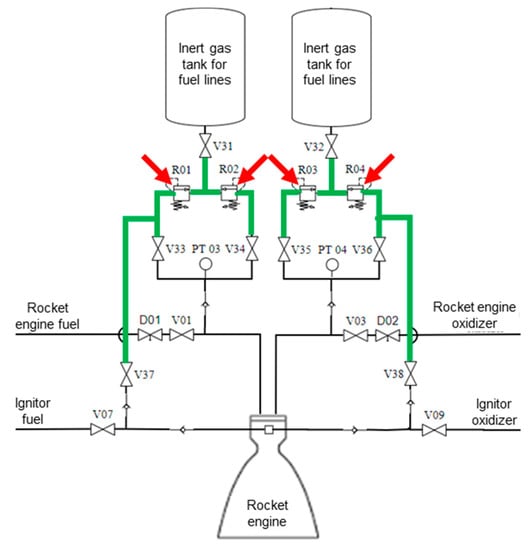
Figure 13.
Algorithm’s third step diagram.
To meet the algorithm’s fourth step (4th), the net evolves to the state shown in Figure 14. In this state, outputs O_07, O_08, O_09, and O_10 are activated in the Control layer, which trigger the valves V33, V36, V37, and V38, changing from the closed condition (OFF) to the open condition (ON), and their respective sensors SV33, SV36, SV37, and SV38, changing from disabled (OFF) to enabled (ON), with the simultaneous sending of feedback signals to the inputs I_08, I_09, I_10, and I_11, which belong to the Control layer.
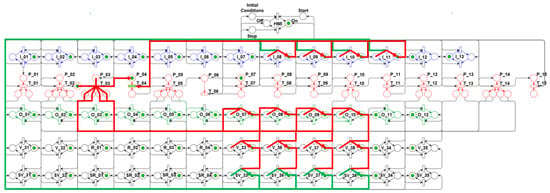
Figure 14.
Algorithm’s fourth step—Open valves.
These valves opening promotes the purge of the initialization-subsystem propellant lines and the main lines, which serve the rocket motor, aiming to effectively clean these lines, thus eliminating the presence of foreign bodies and volatile mixtures.
The algorithm’s fourth step, portrayed within the component diagram scope of the first automation layer, is shown in Figure 15.
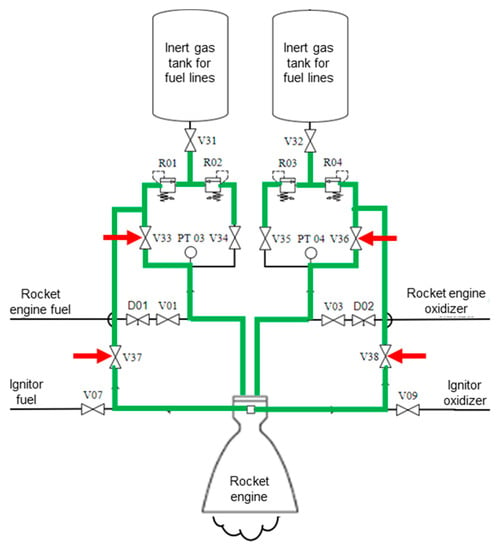
Figure 15.
Algorithm’s fourth step diagram.
To meet the algorithm’s fifth step (5th), the net evolves to the state shown in Figure 16. This state corresponds to maintaining the state represented in the fourth step (4th) for a period of time parameterized in the “Initial Conditions”.
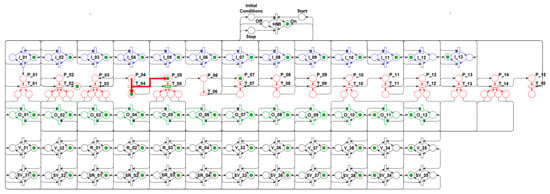
Figure 16.
Algorithm’s fifth step—Timer.
The algorithm’s fifth step, portrayed within the component diagram scope of the first automation layer, is shown in Figure 17.
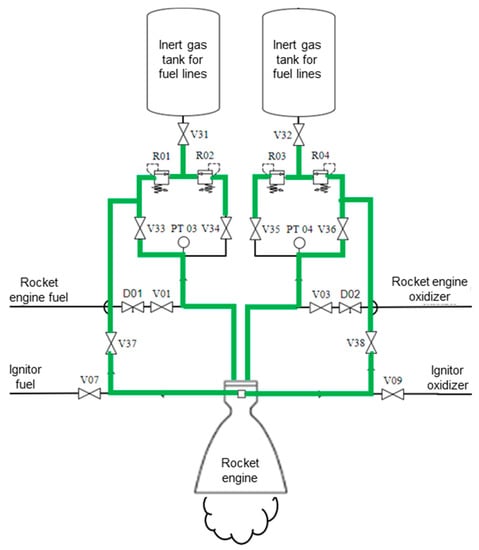
Figure 17.
Algorithm’s fifth step diagram.
To meet the algorithm’s sixth step (6th), the net evolves to the state shown in Figure 18. In this state, outputs O_07, O_08, O_09, and O_10 are activated in the Control layer, which deactivate valves V33, V36, V37, and V38, changing from the open (ON) to the closed (OFF) condition, and their respective sensors SV33, SV36, SV37, and SV38, changing from enabled (ON) to disabled (OFF), with the simultaneous sending of feedback signals to the inputs I_08, I_09, I_10, and I_11, which belong to the Control layer.
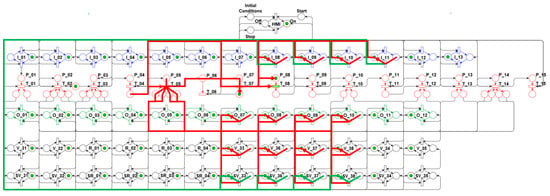
Figure 18.
Algorithm’s sixth step—Close valves.
These valves closing defines the purge-stage end of the initialization-subsystem propellant lines and the main lines which serve the rocket engine.
The algorithm’s sixth step, portrayed within the component diagram scope of the first automation layer, is shown in Figure 19.
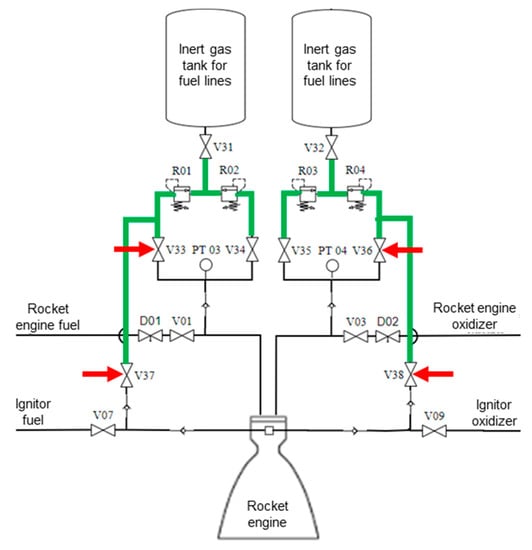
Figure 19.
Algorithm’s sixth step diagram.
To meet the algorithm’s seventh step (7th), the net evolves to the state shown in Figure 20. This state corresponds to the propellant-supply-lines loading procedure, which is not addressed in this work.
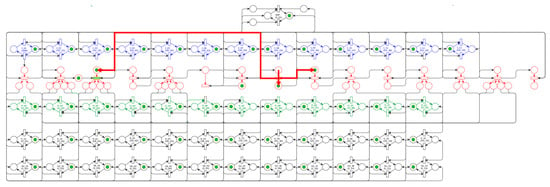
Figure 20.
Algorithm’s seventh step—Load propellant lines.
The algorithm’s seventh step, portrayed within the component diagram scope of the first automation layer, is shown in Figure 21.
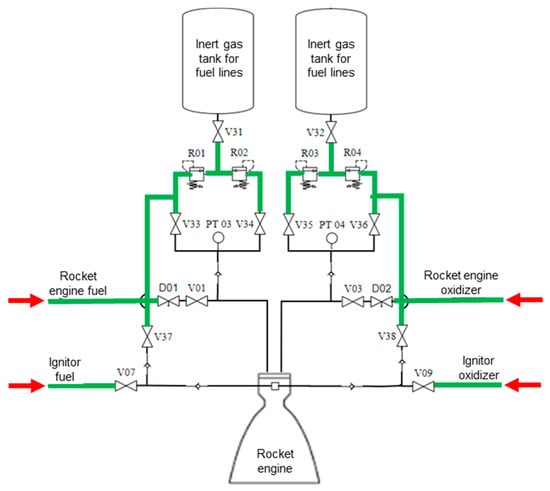
Figure 21.
Algorithm’s seventh step diagram.
To meet the algorithm’s eighth step (8th), the net evolves to the state shown in Figure 22. In this state, outputs O_07, O_08, O_09, and O_10 are activated again in the Control layer, which trigger the valves V33, V36, V37, and V38, changing from the closed (OFF) to the open (ON) condition, and their respective sensors SV33, SV36, SV37, and SV38, changing from disabled (OFF) to enabled (ON), with the simultaneous sending of feedback signals to inputs I_08, I_09, I_10, and I_11, which belong to the Control layer.
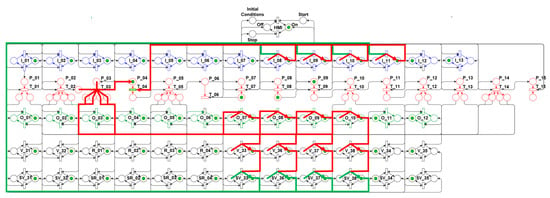
Figure 22.
Algorithm’s eighth step—Open valves.
These valves opening promotes the last purge of the initialization-subsystem propellant lines and the main lines that serve the rocket motor before the hot test in the Test Bench.
The algorithm’s eighth step, portrayed within the component diagram scope of the first automation layer, is shown in Figure 23.
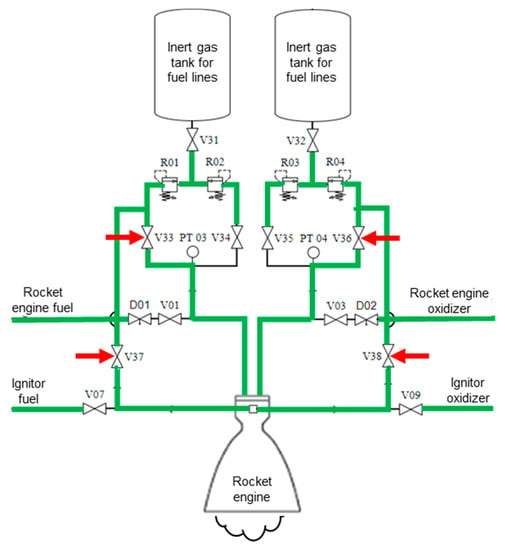
Figure 23.
Algorithm’s eighth step diagram.
To meet the algorithm’s ninth step (9th), the net evolves to the state shown in Figure 24. This state corresponds to maintaining the state represented in the eighth step (8th) for a period of time parameterized in the “Initial Conditions”.
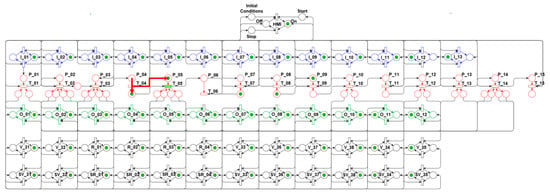
Figure 24.
Algorithm’s ninth step—Timer.
The algorithm’s ninth step, portrayed within the component diagram scope of the first automation layer, is shown in Figure 25.
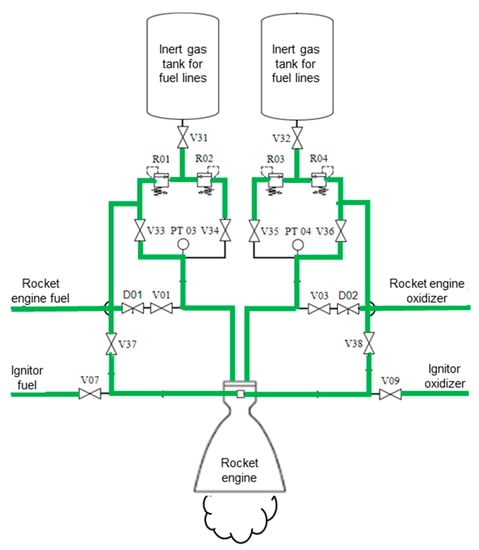
Figure 25.
Algorithm’s ninth step diagram.
To meet the algorithm’s tenth step (10th), the net evolves to the state shown in Figure 26. In this state, the outputs O_07, O_08, O_09, and O_10 are activated again in the Control layer, which deactivate valves V33, V36, V37, and V38, changing from the open (ON) to the closed (OFF) condition, and their respective sensors SV33, SV36, SV37, and SV38, changing from enabled (ON) to disabled (OFF), with the simultaneous sending of feedback signals to inputs I_08, I_09, I_10, and I_11, which belong to the Control layer.
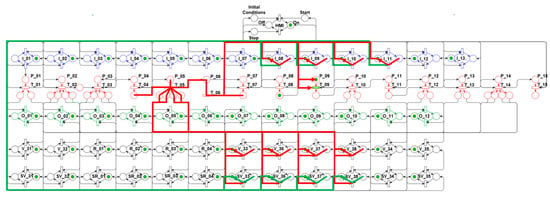
Figure 26.
Algorithm’s 10th step—Close valves.
These valves closing defines the purge-stage end of the initialization-subsystem propellant lines and the main lines which serve the rocket engine before the hot test in the Test Bench.
The algorithm’s 10th step, portrayed within the component diagram scope of the first automation layer, is shown in Figure 27.
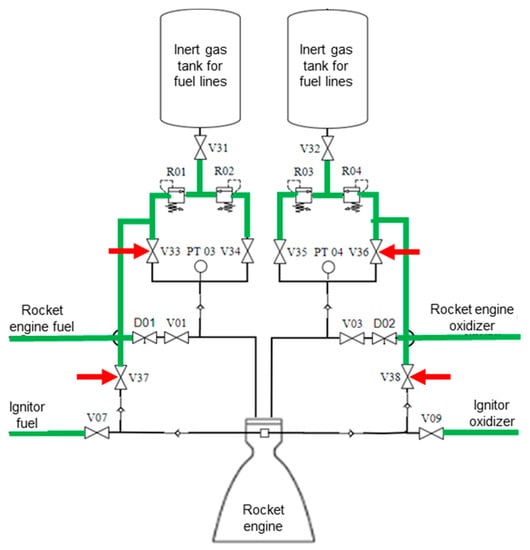
Figure 27.
Algorithm’s 10th step diagram.
To meet the algorithm’s eleventh step (11th), the net evolves to the state shown in Figure 28. This state corresponds to the procedure for the rocket-engine complete operational test in the Test Bench.
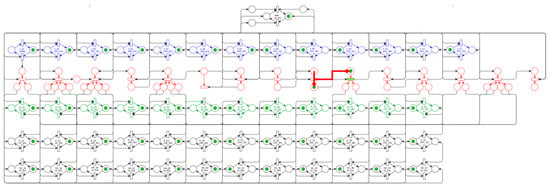
Figure 28.
Algorithm’s 11th step—Rocket engine test.
The algorithm’s 11th step, portrayed within the component diagram scope of the first automation layer, is shown in Figure 29.
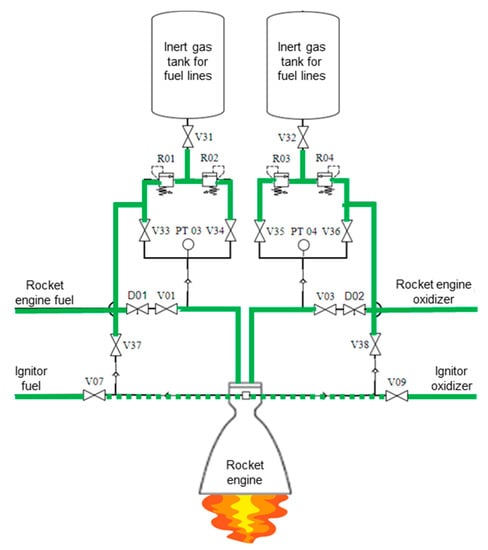
Figure 29.
Algorithm’s 11th step diagram.
To meet the algorithm’s twelfth step (12th), the net evolves to the state shown in Figure 30. In this state, outputs O_11 and O_12 are activated in the Control layer, which trigger the valves V34 and V35, changing from the closed (OFF) to the open (ON) condition, and their respective sensors SV34 and SV35, changing from disabled (OFF) to enabled (ON), with the simultaneous sending of feedback signals to inputs I_12 and I_13, which belong to the Control layer.
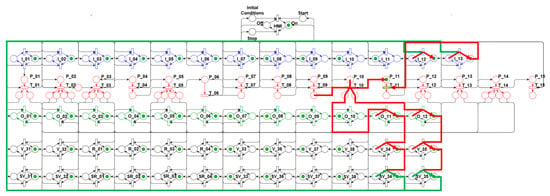
Figure 30.
Algorithm’s 12th step—Open valves.
These valves opening promotes the high-pressure purge of the propellant main lines which serve the rocket engine, aiming to remove residual fuel and oxidants in these lines resulting from the performed test.
The algorithm’s 12th step, portrayed within the component diagram scope of the first automation layer, is shown in Figure 31.
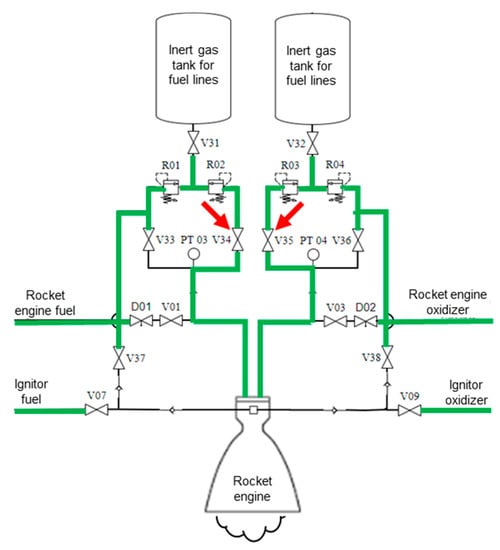
Figure 31.
Algorithm’s 12th step diagram.
To meet the algorithm’s thirteenth step (13th), the net evolves to the state shown in Figure 32. This state corresponds to maintaining the state represented in the twelfth step (12th) for a period of time parameterized in the “Initial Conditions”.
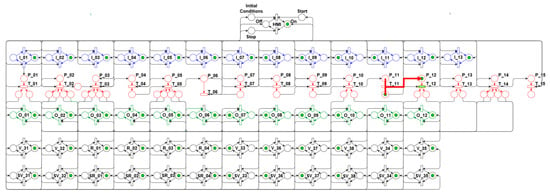
Figure 32.
Algorithm’s 13th step—Timer.
The algorithm’s 13th step, portrayed within the component diagram scope of the first automation layer, is shown in Figure 33.
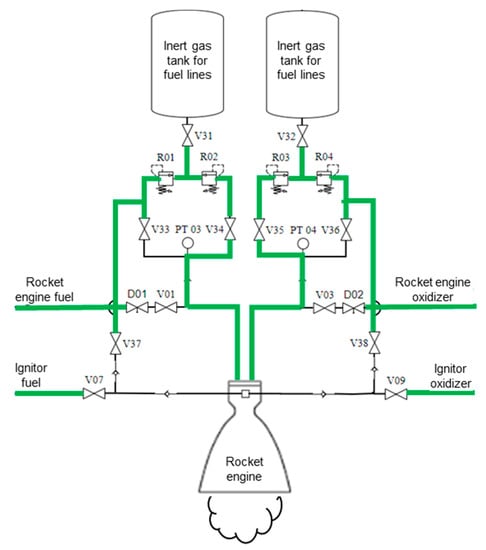
Figure 33.
Algorithm’s 13th step diagram.
To meet the algorithm’s fourteenth step (14th), the net evolves to the state shown in Figure 34. In this state, outputs O_11 and O_12 are activated in the Control layer, which deactivate valves V34 and V35, changing from the open (ON) to the closed (OFF) condition, and their respective sensors SV34 and SV35, changing from enabled (ON) to disabled (OFF), with the simultaneous sending of feedback signals to inputs I_12 and I_13, which belong to the Control layer.
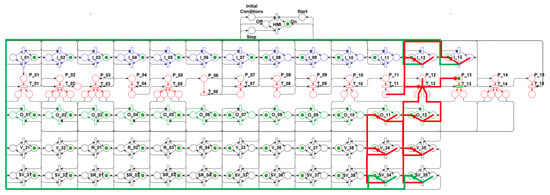
Figure 34.
Algorithm’s 14th step—Close valves.
These valves closing defines the purge-stage end of the propellant main lines which serve the rocket engine after the test has been carried out.
The algorithm’s 14th step, portrayed within the component diagram scope of the first automation layer, is shown in Figure 35.
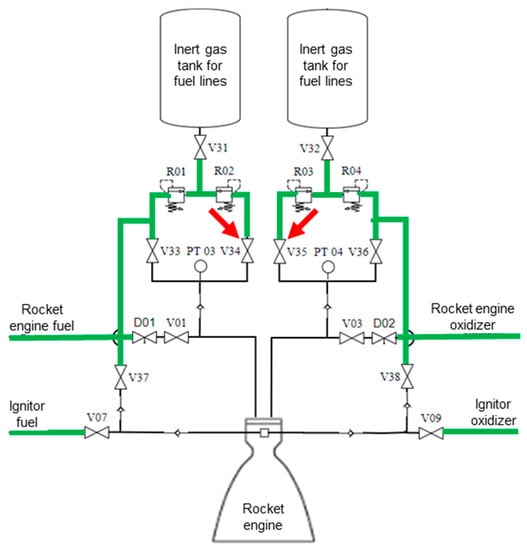
Figure 35.
Algorithm’s 14th step diagram.
To meet the algorithm’s fifteenth step (15th), the net evolves to the three subsequent states, and in the state shown in Figure 36, outputs O_01 and O_02 are activated in the Control layer, which deactivate valves V31 and V32, changing from the open (ON) to the closed (OFF) condition, and their respective sensors SV31 and SV32, changing from enabled (ON) to disabled (OFF), with the simultaneous sending of feedback signals to inputs I_02 and I_03, which belong to the Control layer.
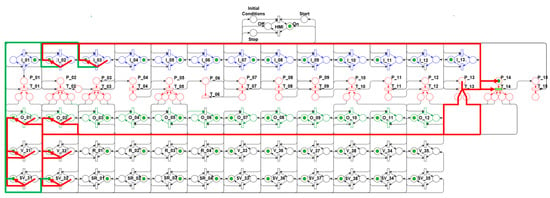
Figure 36.
Algorithm’s 15th step—Close valves.
These valves closing blocks the inert gas flow that has positive pressure in the respective tanks, which is used to serve the propellant-lines purge system up to valves V33, V34, V35, V36, V37, and V38.
The algorithm’s 15th step, portrayed within the component diagram scope of the first automation layer, is shown in Figure 37.
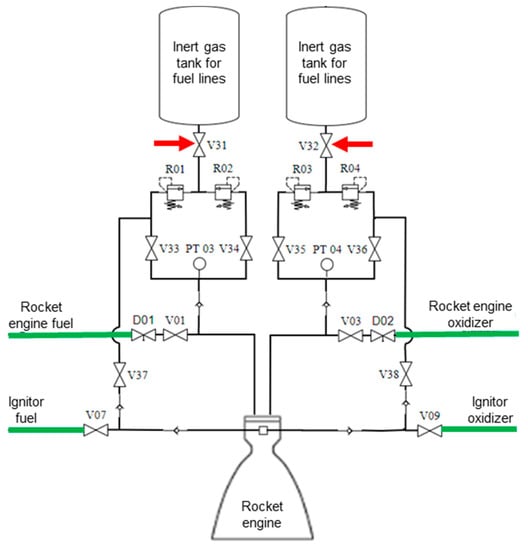
Figure 37.
Algorithm’s 15th step diagram.
In the state shown in Figure 38, the outputs O_03, O_04, O_05, and O_06 are activated in the Control layer, which deactivate the pressure regulators R01, R02, R03, and R04, which change from the open (ON) to the closed (OFF) condition, and their respective sensors SV01, SV02, SV03, and SV04, which change from enabled (ON) to disabled (OFF), with the simultaneous sending of feedback signals to inputs I_04, I_05, I_06, and I_07, which belong to the Control layer.
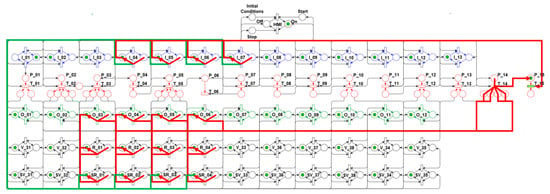
Figure 38.
Algorithm’s 15th step—Deactivate regulators.
After the deactivation of these regulators, the pressure balance occurs in the propellant lines that supply the initialization subsystem and the main lines that serve the rocket engine.
The algorithm’s 15th step, portrayed within the component diagram scope of the first automation layer, is shown in Figure 39.
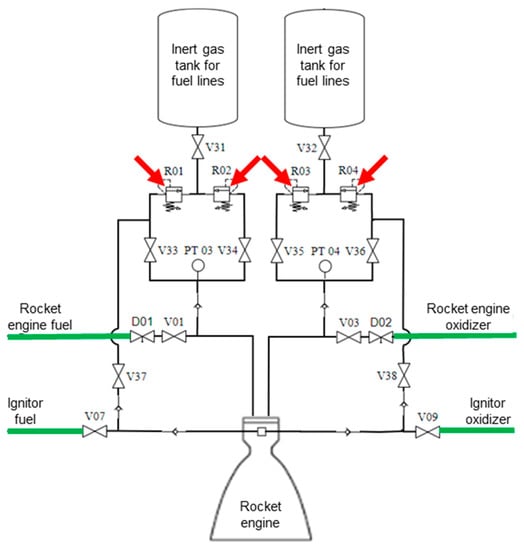
Figure 39.
Algorithm’s 15th step diagram.
From the state shown in Figure 38, after the “Turn off” command is activated by the user in the Human–Machine Interface (HMI), the network evolves to the new state shown in Figure 40, in which the HMI layer “OFF” position is enabled to show the user that the purge algorithm simulation has been finished in the integrated development environment, activating the P_01 position in the Control layer, which allows for the start of a new simulation, based on the actions regarding the algorithm’s first step (1st).
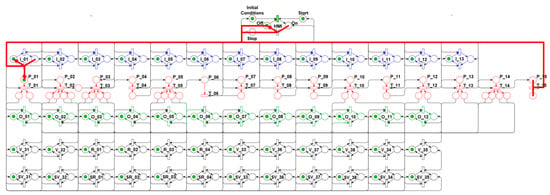
Figure 40.
Algorithm’s 15th step—End simulation.
7. Results
The computational simulation fulfilled with the model proposed in this work to represent the purge process of liquid-propellant line ducts that serve the rocket engine in the Test Bench was fully repeated several times, allowing for the evaluation of the Petri Nets properties mainly related to Liveliness, Conservativeness, Deadlock-type, and Confusion-types, as shown in Table 3.

Table 3.
Property valuation.
8. Conclusions
The positive results observed in the tests performed with the computer simulation suggest that the resources and components established in the model proposed in this work, developed through Petri Nets, are compatible with the ducts’ purge system architecture that serves the propellant supply lines for the rocket engine in the Test Bench.
The method used to elaborate the model developed through Petri Nets allows us to: (i) properly portray the purge system’s physical architecture, (ii) perform the steps contained in the previously defined algorithm, (iii) evaluate Petri Nets’ different properties, (iv) represent the system’s operational states, (v) perform individual analyses of each element, (vi) identify possible nonconformities in the structure and net execution, and (vii) mitigate undesirable events during the test routines run.
The method adopted to model the system, in which the layers of the Human–Machine Interface, Control, and Sensor/Actuator, which compose the low-level Petri Nets, are represented in a different way, allows for the clarification of the valves and the regulators operation, which are elements foreseen in the mentioned system architecture.
Among the properties evaluated in the modeled net, only the confusion-type conflict was identified in the system simulation; the solution for this issue was obtained by the strategic insertion of positions such that the algorithm was properly run.
As an essential action for preventing, minimizing, or eliminating disorders that may occur if the system reaches an undesired state, it is necessary, at least, to ensure the existence of feedback signals for the control system and, also, to initially perform a built-in self-test of the components contained in the Sensor/Actuator layer.
The main limit observed in this work’s elaboration is that, considering that the elements contained in all the automation layers are intact and adequate for the correct functioning, this condition must be preliminarily evaluated through a dedicated Built-In Self-Test system (BIST), which is not addressed in this article.
Author Contributions
Conceptualization, E.R.B., F.C.P.B. and J.W.P.B.; methodology, E.R.B., F.C.P.B. and J.W.P.B.; software, E.R.B., F.C.P.B. and J.W.P.B.; validation, E.R.B., F.C.P.B. and J.W.P.B.; formal analysis, E.R.B., F.C.P.B. and J.W.P.B.; investigation, E.R.B., F.C.P.B. and J.W.P.B.; resources, E.R.B., F.C.P.B. and J.W.P.B.; data curation, E.R.B., F.C.P.B. and J.W.P.B.; writing—original draft preparation, E.R.B., F.C.P.B. and J.W.P.B.; writing—review and editing, E.R.B., F.C.P.B. and J.W.P.B.; visualization, E.R.B., F.C.P.B. and J.W.P.B.; supervision, E.R.B., F.C.P.B. and J.W.P.B.; project administration, E.R.B., F.C.P.B. and J.W.P.B.; funding acquisition, E.R.B., F.C.P.B. and J.W.P.B. All authors have read and agreed to the published version of the manuscript.
Funding
This research was funded by Coordination for the Improvement of Higher Education Personnel—Brazil (CAPES) grant number Financing Code 001.
Data Availability Statement
The data presented in this study are available on request from the corresponding author.
Conflicts of Interest
The authors declare no conflict of interest.
References
- Almeida, D.S. Projeto motor foguete a propelente líquido L75. In Proceedings of the 7th Seminário de Projeto de Pesquisa e Desenvolvimento em Veículos Espaciais e Tecnologia Associadas, São José dos Campos, SP, Brazil, 11–13 September 2013; p. 50. [Google Scholar]
- Nosseir, A.E.S.; Cervone, A.; Pasini, A. Review of State-of-the-Art Green Monopropellants: For Propulsion Systems Analysts and Designers. Aerospace 2021, 8, 20. [Google Scholar] [CrossRef]
- Rahman, S. Liquid Rocket Engines. In Proceedings of the 41st Joint Propulsion Conference, Tuscon, AZ, USA, 10–13 July 2005; p. 57. [Google Scholar]
- Deng, L.; Cheng, Y.; Shi, Y. Fault Detection and Diagnosis for Liquid Rocket Engines Based on Long Short-Term Memory and Generative Adversarial Networks. Aerospace 2022, 9, 399. [Google Scholar] [CrossRef]
- Beck, P. Payload User’s Guide; Rocket Lab: Long Beach, CA, USA, 2018; p. 53. [Google Scholar]
- Palacz, T.; Ciéslik, J. Experimental Study on the Mass Flow Rate of the Self-Pressurizing Propellants in the Rocket Injector. Aerospace 2021, 8, 317. [Google Scholar] [CrossRef]
- Iannetti, A.; Marzat, J.; Piet-Lahnier, H.; Ordonneau, G.; Vingert, L. Fault diagnosis benchmark for a rocket engine demonstrator. Elsevier 2015, 48, 895–900. [Google Scholar] [CrossRef]
- Huang, P.; Wang, T.; Ding, L.; Yu, H.; Tang, Y.; Zhou, D. Comparative Analysis of Real-Time Fault Detection Methods Based on Certain Artificial Intelligent Algorithms for a Hydrogen–Oxygen Rocket Engine. Aerospace 2022, 9, 582. [Google Scholar] [CrossRef]
- Schwabacher, M. Machine Learning for Rocket Propulsion Health Monitoring. SAE Trans. 2005, 114, 1192–1197. [Google Scholar]
- Turner, M.J.L. Rocket and Spacecraft Propulsion: Principles, Practice and New Developments, 3rd ed.; Springer: Chichester, UK, 2009. [Google Scholar]
- Cai, X.; Schild, T.; Kümpel, A.; Müller, D. MODI: A Structured Development Process of Mode-Based Control Algorithms in the Early Design Stage of Building Energy Systems. Buildings 2023, 13, 267. [Google Scholar] [CrossRef]
- Cardoso, J.; Valette, R. Redes de Petri, 1st ed.; UFSC: São Carlos, Brazil, 1997; p. 157. [Google Scholar]
- Li, A.; Li, B.; Gao, M.; Yung, K.L.; Andrew, W.H. Chapter 7— Colored Petri net modeling of the manufacturing processes of space instruments. Aerospace Engineering. In IoT and Spacecraft Informatics; Elsevier: Amsterdam, The Netherlands, 2022; pp. 219–253. [Google Scholar]
- Favaro, L.F.; Junior, P.A.A.M. Análise Pelo Método de Elementos Finitos da Estrutura do Banco de Testes de Motor de Foguete. In Proceedings of the 35th Iberian Latin-American Congress on Computational Methods in Engineering, Fortaleza, Brazil, 23–26 November 2014; p. 15. [Google Scholar]
- Santivañez, J.; Blas, O.; Saenz, C.; Espinoza, L.; Solis, W.; Cornejo, J.; Estela, J. Design of low-cost solid propellant engine test bench and electronic embedded system used for small rockets. In Proceedings of the 2021 International Conference on Electrical, Computer, Communications and Mechatronics Engineering (ICECCME), Mauritius, Mauritius, 7–8 October 2021; p. 6. [Google Scholar]
- Darpa-Defense Advanced Research Projects Agency. Experimental Spaceplane Program Successfully Completes Engine Test Series. Available online: https://www.darpa.mil/news-events/2018-07-10 (accessed on 10 December 2022).
- Pauw, J.D.; Veggi, L.; Wagner, B.; Mondal, J.; Klotz, M. Design Procedure of a Turbopump Test Bench. In Proceedings of the 17th International Symposium on Transport Phenomena and Dynamics of Rotating Machinery (ISROMAC2017), Maui, HI, USA, 16–21 December 2017; p. 12. [Google Scholar]
- Sarotti, C.; Marzat, J.; Piet-Lahanier, H.; Galeotta, M. Cryogenic liquid rocket engine teste beach fault-tolerant control system: Cooling system application. Elsevier 2019, 52, 280–285. [Google Scholar]
- Schäfer, K.; Zimmermann, H. Development and Operational Conditions of VINCI Altitude Simulation Test Bench P4.1. In Proceedings of the 42nd AIAA/ASME/SAE/ASEE Joint Propulsion Conference & Exhibit, Sacramento, CA, USA, 9–12 July 2006. [Google Scholar]
- Murata, T. Petri nets: Properties, analysis and applications. IEEE 1989, 77, 541–580. [Google Scholar] [CrossRef]
- Zhang, Q.; Fan, W.; Wang, K.; Lu, W.; Chi, Y.; Wang, Y. Impact of nozzles on a valveless pulse detonation rocket engine without the purge process. Appl. Therm. Eng. 2016, 100, 1161–1168. [Google Scholar] [CrossRef]
- Deyna, A. (Instituto Nacional de Pesquisas Espaciais). Concepção e Projeto de uma Bancada de Testes Para Injetores de Fluídos Criogênicos em Condições Críticas. 2013. Available online: http://mtc-m21c.sid.inpe.br/col/sid.inpe.br/mtc-m21c/2020/07.14.18.47/doc/Arthur%20Deyna.pdf (accessed on 10 December 2022).
- Barreto, F.M. Uma abordagem baseada em Redes de Petri para modelagem, análise e simulação de cenários de vídeo games singlepauer e multiplayer. Doctoral Thesis, Universidade Federal de Uberlância, Uberlândia, Brazil, 2020. [Google Scholar]
- Pádua, S.I.D.; Silva, A.R.Y.; Porto, A.J.V. O potencial das Redes de Petri em modelagem e análise de processos de negócio. Rev. De Gestão Produção 2004, 11, 109–119. [Google Scholar] [CrossRef]
- Moraes, C.C.; Castrucci, P.L. Engenharia de Automação Industrial, 2nd ed.; LTC: Rio de Janeiro, Brazil, 2018; p. 347. [Google Scholar]
- Bizarria, F.C.P.; Bizarria, J.W.P.; Villani, E.; Rangel, A.P. Redes de Petri aplicadas na análise de sistema de adição de agente oxidante no processo de fabricação de propelente sólido. In Proceedings of the 5th Congresso Nacional de Engenharia Mecânica, Salvador, BH, Brazil, 25–28 August 2008; p. 8. [Google Scholar]
- Bizarria, F.C.P.; Bizarria, J.W.P.; Rosario, J.M. Petri Nets applied to the analysis of algorithm for space vehicles integration tower self-test. Glob. J. Reserches Eng. 2011, 11, 7. [Google Scholar]
- Borges, R.; Santos, E.A.P.; Loures, E.D.F.R.; Romano, C.A. Use of technology in industrial maintenance management: Simulation framework to aid decision making. Rev. Gestão Tecnol. 2022, 22, 225–252. [Google Scholar]
- Bozek, A.; Rak, T.; Rzonca, D. Timed Colored Petri Net-Based Event Generators for Web Systems Simulation. Appl. Sci. 2022, 12, 2385. [Google Scholar] [CrossRef]
- Dechsupa, C.; Vatanawood, W.; Poolsawasdi, W.; Thongtak, A. An Applying Colored Petri Net for Computerized Accounting System and Ledger Accounts Instruction. Computers 2021, 10, 169. [Google Scholar]
Disclaimer/Publisher’s Note: The statements, opinions and data contained in all publications are solely those of the individual author(s) and contributor(s) and not of MDPI and/or the editor(s). MDPI and/or the editor(s) disclaim responsibility for any injury to people or property resulting from any ideas, methods, instructions or products referred to in the content. |
© 2023 by the authors. Licensee MDPI, Basel, Switzerland. This article is an open access article distributed under the terms and conditions of the Creative Commons Attribution (CC BY) license (https://creativecommons.org/licenses/by/4.0/).