Abstract
This paper proposes a stage flow parameter analytical model for rapid evaluation of a counter-rotating compressor’s performance for design optimization and its application in the design of a transonic counter-rotating fan. In the first part, the velocity diagram method, considering the influence of flow-path geometry variation for enhancing the accuracy, is used to correlate the aerodynamic parameter between the inlet guide vane (IGV), the upstream rotor (R1), and the downstream CR rotor (R2). A profile loss correlation based on Lieblein’s diffusion factor and a shock loss model from a high-speed fan database are incorporated for predicting the rotor efficiency. In the second part, to verify its effectiveness, the analytical model is used for aiding in the aerodynamic design of a transonic CR fan for indicating the optimized combination of design parameters for good efficiency and a high pressure ratio. According to the analytical model and the simulation results, the final selected samples have higher efficiency, with a moderate pressure ratio (0.949/2.67, 0.890/2.99, and 0.841/2.99 for R = 0.1, 0.5, and 0.9, respectively). Finally, the aerodynamic characteristics of the designed transonic CR fan at a relative rotating speed of N = 1.05~0.8 are calculated by using the CFD software Numeca. Simulations indicate that the designed transonic CR fan has a pressure ratio of 2.76, with an efficiency of 0.8405 at the design point, and the efficiency is maintained above 0.821 with a stall margin of 13.3% for N=1.0. The maximum pressure ratio of this CR fan reaches 3.08 and 3.36 for N = 1.0 and 1.05, respectively. If used to provide thrust, calculations indicate that the thrust of this transonic CR fan is 71.8, 65.9, and 35.8 kN for N = 1.05, 1.0, and 0.8 at the near-choke point for the sea-level condition.
1. Introduction
The counter-rotating compressor usually has no stator between rotors and has the advantage of reducing the axial length and component weight, which is one of the methods to enhance the thrust-to-weight ratio of an aeroengine. The early research in the 1940s by Lynam and Hawes found that the counter-rotating fan shows improvements in aerodynamic performance [1]. The research by Young also showed the potential aerodynamic performance advantage by indicating that the counter-rotor stage can provide higher pressure rise and increased through-flow capacity [2]. In 1957, Sabel and Sabatiuk reported the design of highly loaded supersonic counter-rotating compressor, consisting of impulse type inlet stage and a shock-in-rotor type second stage, with an objective of 17.7 kg/s, pressure ratio of 6.75, and an efficiency of 0.775 at the design point [3]. Experiments showed that flow blockage occurred in the first rotor and the mass-flow rate only reached 79% of the design value, with an efficiency of 0.733 [4]. In 1972, the counter-rotating concept was introduced into a multi-stage axial compressor by Millar et.al via rotating the case [5]. Measurement of its aerodynamic characteristics indicated that the stall behavior needs improvement [5]. The early studies reflected the technical challenges in aerodynamic design of counter-rotating compressors and indicated that the efficiency and stall characteristics are key points of design, requiring further research.
In the early 2000s, the MIT Gas Turbine Laboratory proposed the high-speed, highly loaded, two-stage counter-rotating compressor with boundary-layer aspiration on the second rotor (aspiration slot at 60% chord, designed to aspirate 1% of the inlet mass flow, from the hub to approximately 80% span) to suppress the flow separation around the shock-impinging point on the suction surface [6,7]. The first stage of this highly loaded counter-rotating fan has an inlet radius ratio of 0.5, work coefficient of 0.34, and a relative Mach number of 1.0~1.5 from hub to tip [8]. The second stage has a lower tip speed (350.5 m/s) and a supersonic inflow of the entire blade (, from hub to tip), but with a high work coefficient of 0.5 [8]. The experiment showed that the highly loaded counter-rotating compressor achieved a high total pressure ratio of 2.9, with an efficiency of 89.0% for the design speed [8]. Further unsteady simulations using the Numeca FINE/Turbo software with the non-linear harmonic (NLH) method on this counter-rotating compressor were carried out by Knapke and Turner, and indicated that the boundary-layer aspiration is able to move the shock downstream and reduce the entropy increment, leading to an efficiency gain of 4.2% and a 3% increase of mass flow, compared with the non-aspirated condition [9].
Another development is the research on the contra-fan system of a high bypass ratio aeroengine [10,11,12,13]. Previous related research indicated the advantage of the less swirled flow of the counter-rotating fan, resulting in fewer flow losses in the rest of the engine [13]. In 2013, ONERA collaborated with the DLR and the CIAM, beginning the High Bypass Ratio Rotary Fan Research program, with the objective of developing and integrating an efficient dual-bypass fan system for future ultra-high bypass ratio (BR > 15) aeroengines [13]. The in-house flow solver TRACE was used to calculate this contra-fan aerodynamic characteristics at six different rotating speeds (N = 1.0, 0.95, 0.90, 0.83, 0.70, 0.55) and compared with the experimental results [13].
The influences of blade sweep, inflow distortion, and tip clearance size are researched for clarifying the flow mechanism in the counter-rotating compressor to optimize design. In 2015, Vijayraj and Govardhan researched the influence of axial and tip chord direction sweeping at two sweep angles (20° and 30°) on a large-scale experimental counter-rotating compressor and found that the blade sweep is able to improve the pressure increase and the stall margin of the upstream rotor [14]. In 2016, the numerical simulation research by Liu et al. on a transonic counter-rotating compressor indicated that the circumferential total pressure inlet distortion results in a decrease of the total pressure ratio, efficiency and stall margin of the transonic counter-rotating compressor [15]. In 2017, the numerical research by Mao et al. on the effect of the tip clearance size on the unsteady flow behaviors indicated that the tip leakage flow in the front rotor (R1) will enhance with the increase of the tip clearance size and then result in a larger incidence angle near the tip region of the downstream rotor (R2) [16]. The fast Fourier transform for the static pressure near the blade tip found two other new fluctuating frequency components, caused by the tip leakage flow self-unsteadiness in R1 and R2 [16].
The low-reaction design concept, rotor speed ratio, and circumferential suction groove in the counter-rotating compressor have also been researched, providing methods for counter-rotating compressor design refinement. The low-reaction design concept was applied by Sun et al. to the counter-rotating compressor for enhancing the rotor load coefficient, obtained a significantly increased total pressure ratio [17]. In 2019, numerical calculation by Joshi et al. indicated that the ratio of the rotor speed can influence the low aspect ratio counter-rotating fan performance by affecting the interaction between the blade wake of the upstream rotor and the suction surface flow of the downstream rotor [18]. In 2020, Liang et al. researched the influence of the axial location of the circumferential suction groove on the tip leakage flow [19]. Research indicated that the optimal axial location of suction groove is at around the 20% axial chord and can obtain an 8.4% increment of the stall margin due to the decrease of blade loading below the groove, the reduction of the tip leakage flow angle and the reversed axial momentum flux injected into the main flow passage [19].
In this article, to reveal the optimized combinations of design parameters (rotor load/flow coefficient, rotating speed ratio, IGV pre-swirl angle, flow path geometry, etc.) of the counter-rotating compressor to achieve good aerodynamic characteristics, a counter-rotating (CR) stage flow parameter analytical model, based on the velocity diagram considering the flow-path variation effect, is proposed. For application, it is used to aid the aerodynamic design of a transonic CR fan to rapidly evaluate the influence of design variables for finding the optimized design with good efficiency and an increased pressure ratio. With the calculations of the proposed analytical model, a transonic counter-rotating fan is designed with numerical simulations (RANS method) used to determine its aerodynamic characteristics.
2. Analytical Model to Calculate Counter-Rotating Compressor Stage Parameters
2.1. Aim and Method
This section establishes a practical counter-rotating compressor analytical model, considering the flow-path variation effect, based on a velocity diagram to guide the selection of design variables for good aerodynamic performance. Figure 1 shows the velocity diagram used in the analytical model and Figure 2 shows the meridian view of the blade geometry and the flow path.
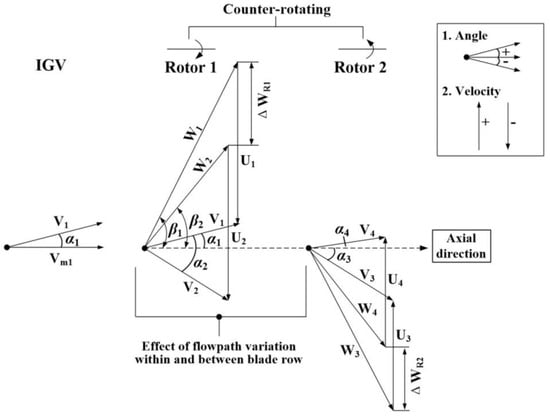
Figure 1.
Velocity diagram analysis of the counter-rotating stage, with the flow-path variation effect considered.
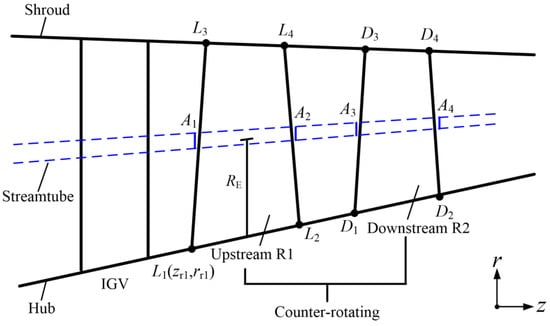
Figure 2.
Meridian view of the high-speed counter-rotating stage analytical model.
2.2. IGV + Upstream Rotor (R1)
The effect of IGV is considered by using the pre-swirl angle in this analytical model. The flow coefficient , and load coefficient , of the upstream rotor (R1) of the blade section were selected as the design variables. The flow angle is defined on the stream surface with the radial velocity considered. At the R1 inlet, the axial velocity, , is calculated by the definition of the flow coefficient . The radial velocity , is estimated by using the axial velocity and the slope of the local streamline obtained by linear interpolation using the slope at the hub and the tip :
In Equation (1), the term is the relative height of the blade section (Figure 2). Then, the tangential velocity , at the R1 inlet is calculated:
According to the velocity diagram in Figure 1, the relative inlet velocity , inflow angle , and relative Mach number , of the upstream rotor (R1) are ascertained:
According to the definition of the load factor , the velocity diagram, and Euler’s equation in turbomachinery, the upstream rotor (R1) outlet tangential velocity , is obtained:
On the other side, applying the continuity equation to the stream-tube (Figure 2), the upstream rotor (R1) outlet axial velocity is calculated:
In Equation (8), the total temperature ratio at the rotor outlet is determined according to the specified rotor load coefficient :
The blade section stream-tube area ratio is estimated by using the average flow-path area variation and the slope of the flow path at the hub and the tip (Figure 2). In the application of this analytical model, the coordinates of the rotor leading and trailing edge at the shroud and the hub (points and ) are known. Then, the average through-flow area ratio of the upstream rotor is ascertained. The blade section stream-tube area ratio through the upstream rotor is varied along the radial direction and influenced by the hub and the shroud slope. A linear distribution is used to estimate the radial distribution of the stream-tube area ratio :
It is assumed that the integration of the stream-tube area ratio along the relative blade span is equal to the overall averaged area ratio and the coefficient a in Equation (9) is ascertained:
The rotor outlet Mach number can be directly calculated with the determined rotor outlet velocity . The determination of the rotor outlet velocity relies on the ascertain of :
On the other side, with the estimated blade section loss coefficient , the total pressure ratio of the upstream rotor (R1) is able to be determined according to the method in the compressor aerodynamic design reference [20]:
The term reflects the influence of radius variation through the blade section on the ideal inlet total pressure [20], and is calculated by:
The in Equations (12) and (13) is the relative total temperature at the inlet location of the blade section. The and are the radius of blade section LE and TE, respectively. As indicated by Equation (7), the determination of the rotor outlet axial velocity , requires the value of the outlet Mach number , and the blade section total pressure ratio . According to Equation (12), the calculation of the total pressure ratio requires the estimation of the blade section total pressure loss coefficient . However, the estimation method of the blade section total pressure loss coefficient , used in this analytical model requires the value of the outlet axial velocity , itself to determine the relative outflow angle . Therefore, it needs iteration calculations to find the blade section outlet axial velocity .
2.3. Prediction of Loss Coefficient
Considering that this analytical model is used for the main flow, the blade section total pressure loss coefficient is predicted by decomposing it into the profile loss , and the shock loss :
For the profile loss coefficient , the Lieblein’s diffusion factor to loss parameter correlation, used by Wennerstrom et al. [21] in the performance prediction of high Mach number transonic rotors, was adopted (Figure 3a). For the shock loss coefficient , this analytical model adopts a polynomial fitting function based on several high-speed fan data presented in [22]. The shock loss data from high-speed transonic fans were adopted due to the high-inflow Mach number feature of the counter-rotating compressor. Considering that this analytical model is for preliminary research to determine the optimized value of important design variables, this fitting function can conveniently predict the shock loss coefficient , and it only requires one input parameter, i.e., the relative inlet Mach number .
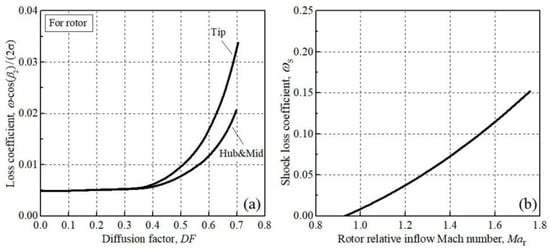
Figure 3.
Adopted loss model in the analytical model. (a) Profile loss , adapted from the Reference [21]. (b) Shock loss coefficient estimation curve, adapted from the Reference [22].
Once the profile loss coefficient and shock loss coefficient are estimated, the total pressure ratio of the upstream rotor (R1) can be determined by Equation (12). With the calculated rotor outlet axial velocity then, the blade outlet flow angle , the relative outlet velocity , and the relative outlet flow angle can be obtained.
In the iteration calculation process to determine the outlet axial velocity , an initial value is specified to and then the flow parameters at the blade section outlet location, including the absolute Mach number and the total pressure ratio are determined by using the velocity diagram in Figure 1 and Equations (7)–(13). Then, the new value of outlet axial velocity can be determined by Equation (8). Next, this new value of outlet axial velocity is taken as the initial value and the secant method is used to match the iterations to reach the correct axial velocity .
2.4. Flow-Path Variation Effect
The next stage is in the flow path from the outlet of the upstream rotor (R1) to the downstream rotor (R2). Due to the variation of the flow-path radius and area is large, the induced flow property variation is significant and needs to be considered.
For the flow in the flow path between blades, it is simplified as an isentropic and adiabatic flow process () since the viscous loss generated in the annulus wall boundary layer is negligible. According to Euler’s equation in turbomachinery, the velocity circulation of the stream-tube remains conserved in the flow path among blade rows. Therefore, the tangential velocity , at the inlet location of the downstream rotor is calculated by:
Next, to determine the inlet axial velocity of the downstream rotor (R2), the continuity equation is applied to the stream-tube:
The term is the unit direction vector of flow and is the unit normal direction vector of the cross-section of the stream-tube (Figure 2). is the ratio of the stream-tube inlet area to the outlet area, i.e.,, which is influenced by the flow-path variation. The stream-tube area ratio is usually non-uniform along the span. Rapid variation of the stream-tube area ratio is observed in the near-wall region, due to the change of the flow-path radius and the influence of boundary-layer. Considering that the prediction accuracy of the stream-tube area ratio has a remarkable influence on the calculated axial velocity , an approximation method is proposed to calculate the radial distribution of the stream-tube area ratio simply via the geometry parameter of the hub and the tip (Figure 2). The stream-tube area ratio radial distribution is approximated by:
In the above formula, the parameter is the overall cross-section area ratio of the flow path at upstream rotor outlet to the downstream rotor inlet (Figure 4a). The and are non-uniformity coefficients at the hub and the tip, respectively, defined to consider the variation relative to the averaged flow path area ratio (Figure 4a). The non-uniformity coefficients and are found to be mainly influenced by the slope of the hub and the shroud .
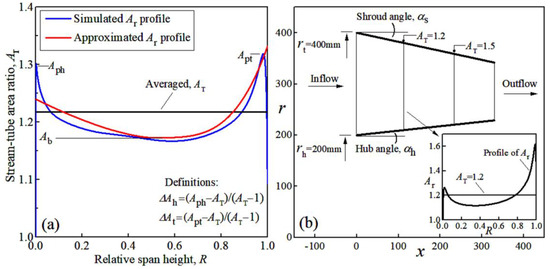
Figure 4.
Stream-tube area ratio distribution by the simulation and approximation method (a), and the hub and shroud non-uniformity coefficients ( and ) (b).
It is assumed that the integration of the stream-tube area ratio along the relative blade span is equal to the overall averaged area ratio :
Then, with the non-uniformity coefficients and determined from Figure 4b, the bottom value is determined:
To find a convenient way to calculate the non-uniformity coefficients and , the flow in the circular passage at different combinations of shroud and hub angles was simulated to form a simulation database (Figure 4b). With this simulation database, a fitting surface was established (Figure 5). The corresponding calculation formulae for and are:
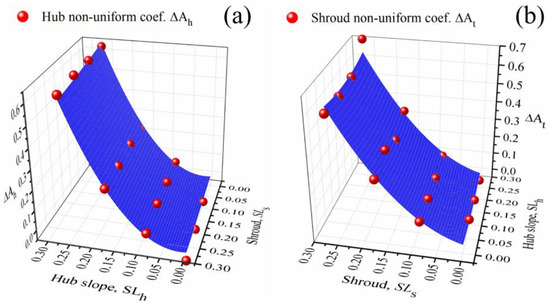
Figure 5.
Fitting surface for the averaged hub and shroud non-uniform coefficients and based on ring canal simulation results. (a) hub non-uniform coef. (b) shroud non-uniform coef. .
With the non-uniformity coefficients and estimated by Equations (20) and (21), and the overall averaged area ratio , the bottom value can be calculated by Equation (19) and the radial distribution of the stream-tube area ratio was determined.
2.5. Counter-Rotating Rotor R2
The downstream rotor (R2) is located directly after the upstream rotor and has an opposite rotating direction (Figure 1). The calculation for the flow-path variation effect has ascertained the flow property at the downstream rotor inlet (i.e., total temperature , and pressure , absolute velocity , flow direction ). Then, with the specified load coefficient , and flow coefficient , according to the velocity diagram in Figure 1, the aerodynamic parameters at the inlet location of R2 can be calculated with a method similar to that used for R1. The input and output parameters of the proposed analytical model are summarized in Table 1. This analytical model for the counter-rotating compressor stage was programmed for convenient application.

Table 1.
Input and output parameters of the counter-rotating compressor analytical model.
3. Analytical Model Aided the Aerodynamic Design of a Transonic Counter-Rotating Fan Stage
3.1. Introduction of the Design Case
Here, the analytical model proposed in Section 2 was used for aiding in the aerodynamic design of a transonic CR fan. A preliminary analysis, using the proposed analytical model and numerical simulations, has been carried out to determine the R1 rotating speed , the shroud radius of R1, , and the R1 flow coefficient , etc., of this transonic CR stage (Table 2). The corresponding blade tip tangential velocities of R1 and R2 were 450 and 381 m/s, respectively.
Table 2.
The specified parameters, design variables, and output parameters of the researched transonic CR fan.
The IGV pre-swirl angle , upstream rotor (R1) load coefficient , R2 relative rotating speed and R2 load coefficient , were selected as design variables, and the influences of these variables on the aerodynamic performance of this transonic CR fan were studied with the proposed analytical model (Table 2). The diffusion factors (DF) of rotors R1 and R2 were monitored to prevent unreasonable values. The aerodynamic performance of the fan was evaluated by an objective function, combining the total pressure ratio , and the efficiency . The meridian schematic of this transonic CR fan is shown in Figure 6.
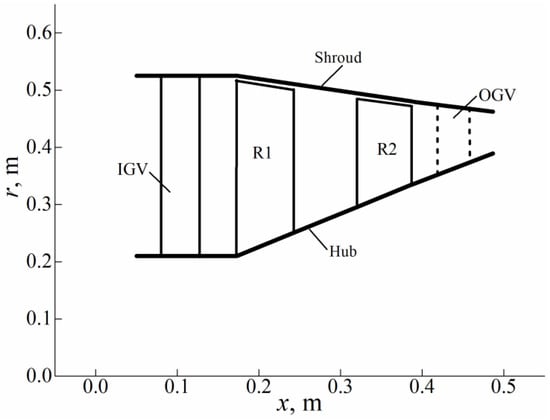
Figure 6.
The schematic of the researched transonic CR fan.
Table 3 shows the combination of IGV pre-swirl angle , R1 load coefficient , CR rotor R2 relative rotating speed , and load coefficient , of the researched samples. The variations of these parameters were set to cover the reasonable range for searching for the optimal parameter combination for good efficiency and a high-pressure ratio. The number of researched samples for each blade section was 108.
Table 3.
Parameter combination of the research samples.
3.2. Analytical Model Calculated Results
With the parameter combination of research samples in Table 3, the counter-rotating compressor stage flow parameter analytical model developed in Section 2 was used to calculate the key flow parameters (, , and DF) and aerodynamic performance (efficiency , pressure ratio ) of each research sample. Due to the requirement of a stable operation range, the diffusion factor DF of R1 and R2 of the researched samples was limited to 0.55 for the stall margin:
To comprehensively evaluate the aerodynamic performance of the samples, the objective function considered the variation of the total pressure ratio and the efficiency of each design sample relative to the reference point:
In Equation (23), the reference sample ( and ) is the valid solution with the diffusion factor (DF) of R1 and R2 closest to the typical value of 0.45, indicated by Ref. in Figure 7, Figure 8 and Figure 9. The subscripts and Min. represent the maximum and minimum values, respectively (Figure 7a). In this objective function, the coefficients and were both set to 1.0.
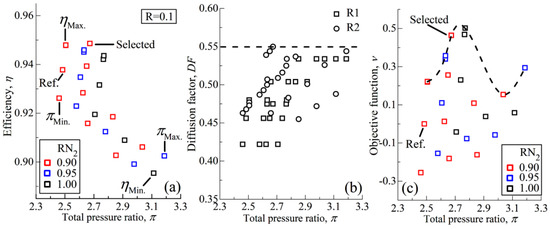
Figure 7.
The analytical model calculated (a) efficiency , (b) diffusion factor DF, and (c) objective function , versus the pressure ratio of samples, with .
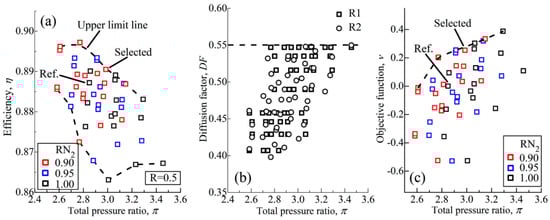
Figure 8.
The analytical model calculated (a) efficiency , (b) diffusion factor DF, and (c) objective function , versus the pressure ratio of samples, with .
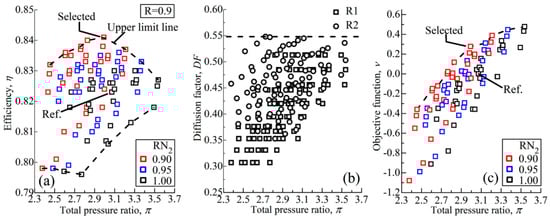
Figure 9.
The analytical model calculated (a) efficiency , (b) diffusion factor DF, and (c) objective function , versus the pressure ratio of samples, with .
Figure 7, Figure 8 and Figure 9 display the analytical model calculated efficiency , diffusion factor (DF), and objective function versus the pressure ratio of the researched samples, with for relative span R = 0.1, 0.5, and 0.9, respectively. By observing the upper and lower border line in subfigure (a) of Figure 7, Figure 8 and Figure 9, it is found that for samples with very close pressure ratios , the efficiency , can vary by more than 2.0 percentage points, and the pressure ratio also varies in a large range (for example, R = 0.5, pressure ratio from 2.6 to 3.4), indicating a large optimization space and demonstrating the effectiveness of the proposed analytical model in the counter-rotating compressor design.
The final selected samples for guiding the CR rotor blade aerodynamic design were all located on the upper limit line of efficiency and the objective function, marked in Figure 7, Figure 8 and Figure 9. The final selected samples had high efficiency and a moderate pressure ratio (0.949/2.67, 0.890/2.99, and 0.841/2.99, for R = 0.1, 0.5, and 0.9, respectively). The objective function values of the selected samples were 0.464, 0.253, and 0.277 for blade span R = 0.1, 0.5, and 0.9, respectively, which were close to the optimal value (subfigure (c), Figure 7, Figure 8 and Figure 9).
3.3. Numerical Method
The aerodynamic characteristics of the designed transonic CR fan were calculated using the CFD software Numeca. In the simulations, the steady Reynolds-Averaged Navier–Stokes method was used with the finite-volume second-order central scheme and the Spalart–Allmaras (S-A) turbulence model. The Spalart–Allmaras turbulence model was selected for the flow numerical calculation of this CR fan since it has been verified in simulations of a high-speed counter-rotating compressor and Rotor 67 [16,23], and the simulated pressure ratio and efficiency were close to the experimental results. The option Conservative Coupling by Pitchwise Row was used in the simulation. For the inlet boundary condition, the inflow had a uniform property distribution of air, with a total temperature of 288.15 K and a total pressure of 101,325 Pa in the axial direction. For the outlet boundary condition, the radial equilibrium option was used, with static pressure specified at the middle location.
The mesh of each blade had O4H topology consisting of one O-block around the blade and four H-blocks, generated by using the software Numeca AutoGrid5. To determine the suitable mesh size, a grid independency study was carried out (Figure 10). For Grid 1 to Grid 4, the wall cell height was set to 0.003–0.005 mm to yield an average value of y+ on the blade surface below 5, and the expansion ratio was set to 1.15 for increased grid density around the blade surface. The tip clearance of R1 and CR rotor R2 are both set to 0.5 mm. From Figure 10, it can be observed that the CR fan performance at the near-stall point was more sensitive to the mesh size. With the mesh density increase from Grid 1 to Grid 4, the variation of the pressure ratio , efficiency , and mass-flow rate , gradually became small. The very close aerodynamic parameters of Grid 3 and Grid 4 indicates that the grid independency was reached. Therefore, the aerodynamic characteristic of the designed counter-rotating fan in Section 4 was calculated with Grid 3 for economizing numerical computing time and resources.
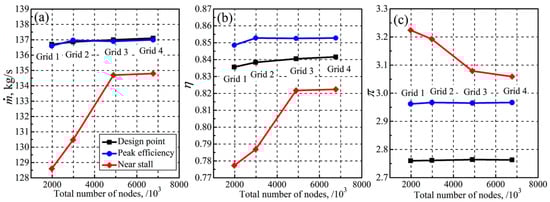
Figure 10.
The grid independency study (Grid 1 to Grid 4). (a) Mass flow rate (b) Efficiency (c) pressure ratio .
For Grid 3, the O-block around each blade had 25 to 29 nodes in the normal direction of the blade surface for capturing the boundary-layer development. The number of stream-wise nodes on the blade suction/pressure surface was in the range of 77 to 125, and the radial node number of each blade was set to 73. The grid number of the entire mesh was . Figure 11 shows Grid 3 used in the simulation at the hub location, with an enlarged view around the R1 leading and trailing edge (R = 0.1).
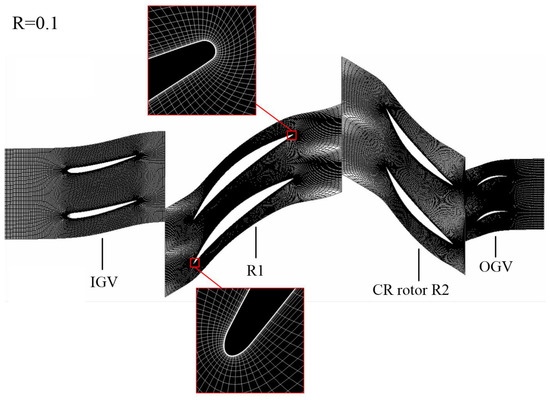
Figure 11.
The mesh for the simulation at hub location R = 0.1.
4. Aerodynamic Characteristic and Flow Analysis of the Transonic Counter-Rotating Fan
4.1. Aerodynamic Characteristic
According to the design parameter values of the selected sample for each blade section, R = 0.1, 0.5, and 0.9 (Figure 7, Figure 8 and Figure 9), the blade design of this transonic counter-rotating fan was achieved using the parametric blade design method [23], used in axial fan and compressor aerodynamic design [23,24], which is able to provide a flexible blade design capability. Figure 12 shows the three-dimensional view of the designed transonic CR fan.
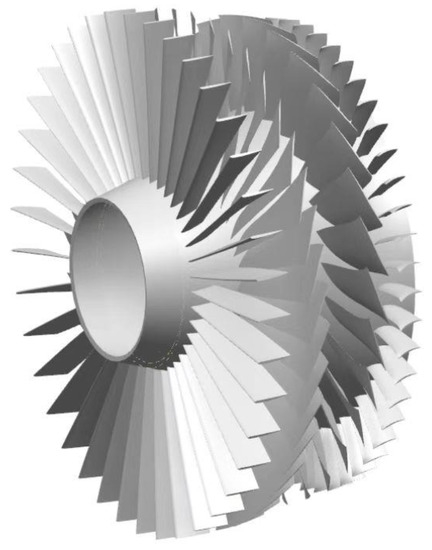
Figure 12.
Three-dimensional view of the designed transonic CR fan.
The inlet guide vane (IGV) of this transonic CR fan was fixed and adopted the dual-peak-type IGV with a wide, low-loss incidence range proposed in previous article [25]. From Figure 13, the IGV pre-swirl angle , load coefficient and flow coefficient of R1 and CR rotor R2 of the final design matched with the analytical model. However, the load coefficient , of the real designed CR rotor R2 at the near-tip section was 0.394, lower than the design value of 0.450 (R = 0.9, Figure 13c). In the design process, it was observed that a further increment of the aerodynamic load around the R2 tip will cause significant degradation of the efficiency due to the substantial increase of the shock system strength. For the outlet guide vane (OGV), due to the counter-rotating design, the absolute inflow angle , was close to the axial direction (30~10° in R = 0.058~0.993), and therefore, a low-solidity OGV was used to turn the flow to the axial direction for low weights.
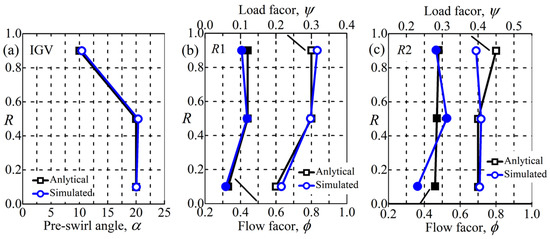
Figure 13.
The IGV pre-swirl angle (a), load and flow coefficients of R1 (b) and R2 (c) of the selected samples calculated by the analytical model and extracted from the numerical simulation at the N = 1.0, design point.
For the accuracy of this analytical model, by observing Figure 14, it was found that the relative Mach number (a), relative flow angle (b), and the pressure ratio (c) were close to the simulated result, with the relative error below 5.0% at most locations. However, a significant difference () of the inflow angle at the R2 hub location (R = 0.1) was observed, caused by the lower axial velocity–density ratio due to the strong flow diffusion around the R1 hub region observed in the numerical simulation (Figure 15a).
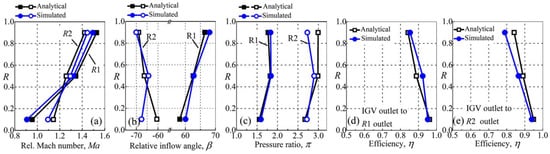
Figure 14.
The aerodynamic parameters of R1 and R2 from the analytical model and the numerical simulation. (a) Rel. Mach number Ma (b) Relative flow angle (c) Pressure ratio (d,e) Efficiency .
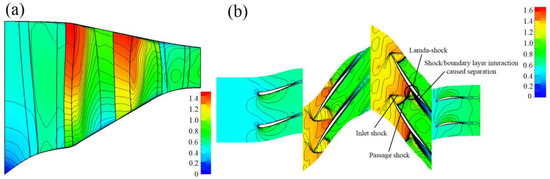
Figure 15.
The flow field meridian view (a), and blade mid-section (R = 0.5) Mach number contour (b), N = 1.0, design point.
Regarding efficiency, the analytical model-calculated and numerical simulated efficiency at the R1 outlet were close, with a maximum difference below 3.5 percentage. However, for the downstream counter-rotating rotor (R2), the analytical model overestimated the efficiency at the R2 outlet, with 2.5 percentage for the middle section and 5.1 percentage for the tip section, due to the inaccurate prediction of the CR rotor loss coefficient. Flow analysis indicated that the passage shock of the CR rotor R2 was very close to the inlet shock and at a strong level, forming an -shock at the suction surface and inducing large boundary-layer separation (Figure 15b). Therefore, the loss coefficient of the CR rotor R2 was much higher than the typical transonic cascade with the same inlet Mach number.
Figure 16 summarizes the numerical calculated aerodynamic characteristics of the CR fan. At the design point, the transonic CR fan had a mass-flow rate of 137.0 kg/s, with an efficiency of 0.8405 and a pressure ratio of 2.76. For the near-stall point, the CR fan had an efficiency of 0.821 and a pressure ratio of 3.08. The stall margin was 13.3% for the design speed (N = 1.0). The peak efficiency of this CR fan was 0.853, 0.881, and 0.876 for relative speeds N = 1.0, 0.9, and 0.8, respectively. Besides, with the increased rotating speed, the maximum pressure ratio of this CR fan reached 3.36 for N = 1.05. Figure 16c shows the mass flow per unit frontal area, , of this CR fan at typical operation points. For the near-choke point, the mass flow per unit frontal area, was 159.5, 155.1, and 116.9 kg/(m2⋅s) for , respectively.
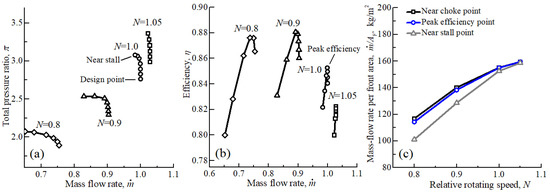
Figure 16.
The aerodynamic characteristic of the designed transonic counter-rotating fan. (a) Pressure ratio (b) Efficiency (c) Mass-flow rate per front area .
4.2. Calculation of Thrust
Considering that this transonic CR fan may be used for providing thrust, a calculation, according to the method of Saravanamuttoo et al. [26], was carried out to determine the thrust per unit mass flow and the total thrust of this transonic CR fan with a convergent nozzle (estimated efficiency of 0.950) in the sea-level condition (101,325 Pa, 288.15 K, Figure 17). Results show that the thrust per unit mass flow was 509.4, 480.9, and 346.2 (N⋅S)/kg for the near-choke points of N = 1.05, 1.0, and 0.8 (Figure 17a), respectively. With the operation point moved to the near-stall point, the thrust per unit mass flow increased by about 7.9% to 8.9%, N = 1.05~0.80.
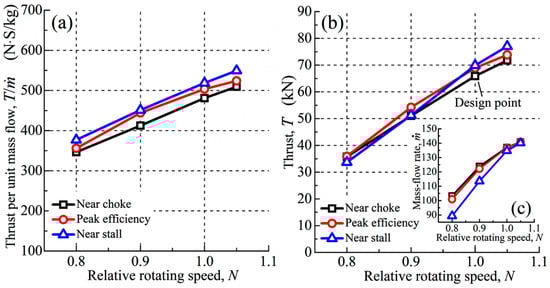
Figure 17.
The thrust per unit mass flow (a), total thrust (b), and mass-flow rate (c) of the transonic CR fan.
The total thrust was 71.8, 65.9, and 35.8 kN at the near-choke points of N = 1.05, 1.0, and 0.8 (Figure 17b), respectively. The variation of total thrust to rotating speed (in the range of N = 1.05~0.8) was approximately linear, with a slope of 1.8 kN/100 rpm. Besides, the increase of backpressure will lead to a slight enhancement (6.1~7.3%) of total thrust at N = 1.0~1.05, while its influence at partial speeds of N = 0.9 and 0.8 was not obvious due to the contrary effect of the mass-flow rate reduction and the pressure ratio increment.
5. Conclusions
This paper proposed a stage parameter analytical model based on the velocity diagram method for a transonic counter-rotating compressor design. A profile loss correlation based on Lieblein’s diffusion factor and a shock loss model from high-speed fan data was used to predict the rotor blade’s efficiency. The influence of flow-path variation on the axial velocity–density ratio was considered using an approximate model based on a numerical database of stream-tubes with various hub and shroud slopes. The proposed analytical model can rapidly calculate the influence of the IGV pre-swirl angle, the load and flow coefficients of R1, the flow-path geometry, the relative rotating speed of the CR rotor, etc., and point out the optimized sample with high efficiency and a high-pressure ratio.
For application, the proposed analytical model was used for the aerodynamic design of a transonic CR fan. A preliminary analysis, with the analytical model and numerical simulation, was carried out to determine some of the key parameters, i.e., the R1 rotating speed, the hub and shroud flow path, and the axial location of each blade. Then, different research samples with various combinations of the R1 load coefficient , IGV pre-swirl angle , relative rotating speed , and load coefficient of R2 were rapidly evaluated by the analytical model for finding the optimal combination. With the CFD software Numeca, the simulation indicated that the designed transonic CR fan had a pressure ratio of 2.76, with an efficiency of 0.8405 at the design point, and the efficiency was maintained above 0.821 with a stall margin of 13.3% for N = 1.0. The maximum pressure ratio of this CR fan reaches 3.08 and 3.36 for N = 1.0 and 1.05, respectively. If used to provide thrust, the transonic CR fan resulted in 71.8, 65.9, and 35.8 kN at the near-choke points of N = 1.05, 1.0, and 0.8, respectively.
Author Contributions
Conceptualization, H.S. and X.Y.; methodology, H.S.; software, H.S.; validation, H.S.; formal analysis, H.S.; investigation, H.S.; resources, X.Y.; writing—original draft preparation, H.S.; writing—review and editing, H.S. and X.Y.; supervision, X.Y. All authors have read and agreed to the published version of the manuscript.
Funding
The APC was funded by ZHZ Technology Company, Ltd.
Data Availability Statement
Partial geometry of the transonic CR compressor is available upon request.
Conflicts of Interest
The authors declare no conflict of interest.
Nomenclature
The following abbreviations were used in this manuscript:
| p | Static pressure (Pa) |
| Mass-flow rate (kg/s) | |
| i | Incidence angle |
| k | Specific heat ratio, k = 1.4 |
| Radius of blade section (mm) | |
| Stream-tube area ratio, | |
| C | Chord (mm) |
| Diffusion factor, for rotor | |
| Ma | Mach number |
| N | Rotating speed (rpm) |
| P | Total pressure (Pa) |
| R | Blade relative height |
| Specific gas constant for air, | |
| T | Total temperature (K) |
| Blade section tangential velocity (m/s) | |
| Absolute axial velocity (m/s) | |
| Absolute radial velocity (m/s) | |
| Absolute meridian velocity (m/s), | |
| Relative flow angle measured from axial direction (degree) | |
| Relative error | |
| Total pressure ratio, | |
| Efficiency, | |
| Solidity, | |
| Flow coefficient based on blade tip (LE side) tangential velocity, | |
| Load coefficient based on blade tip (LE side) tangential velocity, | |
| Increment of enthalpy by the rotor section | |
| CR | Counter-rotating |
| LE | Leading edge |
| TE | Trailing edge |
References
- Lynam, F.C.; Hawes, S.P. Contra Rotating Axial Flow Fans. Engineers 1946, 1–8. [Google Scholar]
- Young, R.H. Counter Rotating Fans. JHIVE 1952, 18, 187. [Google Scholar]
- Sabel, E.; Sabatiuk, A. Turbojet Engine Development: Design of Phase I Compressor; Curtiss-Wright Corporation: Davidson, NC, USA, 1957. [Google Scholar]
- Sabel, E.; Sabatiuk, A. Turbojet Engine Development: Phase I Compressor Test Results; Curtiss-Wright Corporation: Davidson, NC, USA, 1957. [Google Scholar]
- Millar, D.A.J.; Chappell, M.S.; Okelah, R. The Co-Turbo Shaft: A Novel Gas Turbine Power Plant for Heavy Equipment. In Proceedings of the ASME 1979 International Gas Turbine Conference and Exhibit and Solar Energy Conference, San Diego, CA, USA, 12–15 March 1972. [Google Scholar]
- Kirchner, J. Aerodynamic Design of an Aspirated Counter-Rotating Compressor; Massachusetts Institute of Technology: Cambridge, MA, USA, 2002. [Google Scholar]
- Merchant, A.; Kerrebrock, J.L.; Epstein, A.H. Compressors with aspirated flow control and counter-rotation. In Proceedings of the 2nd AIAA Flow Control Conference, Portland, OR, USA, 28 June–1 July 2004. [Google Scholar]
- Kerrebrock, J.L.; Epstein, A.H.; Merchant, A.; Guenette Gerald, R.; David, P. Design and test of an aspirated counter-rotating fan. ASME J. Turbomach. 2008, 130, 021004. [Google Scholar] [CrossRef]
- Knapke, R.D.; Turner, M.G. Unsteady simulations of a counter-rotating aspirated compressor. In Proceedings of the ASME Turbo Expo 2013: Turbine Technical Conference and Exposition, San Antonio, TX, USA, 3–7 June 2013. [Google Scholar]
- Talbotec, J.; Vernet, M. SNECMA Counter rotating Fan aerodynamic design logic & tests results. In Proceedings of the 27th International Congress of Aeronautical Sciences, Nice, France, 19–24 September 2010. [Google Scholar]
- Lengyel, T.; Nicke, E.; Rüd, K.-P.; Schaber, R. Optimization and examination of a counter-rotating fan stage: The possible improvement of the efficiency compared with a single rotating fan. In Proceedings of the ISABE, Gothenburg, Sweden, 12–16 September 2011. [Google Scholar]
- Schmid, T.; Lengyel-Kampmann, T.; Schmidt, T.; Nicke, E. Optimization of a carbon-fiber composite blade of a counter-rotating fan for aircraft engines. In Proceedings of the European Conference on Turbomachinery Fluid Dynamics and Thermodynamics, Lausanne, Switzerland, 8–12 April 2019. [Google Scholar]
- Ly, T.; Koc, K.; Meillard, L.; Schnell, R. Evaluation of the aerodynamic performance of the counter rotating turbo fan COBRA by means of experimental and numerical data. CEAS Aeronaut. J. 2022, 13, 385–401. [Google Scholar] [CrossRef] [PubMed]
- Vijayraj, K.; Govardhan, M. Aerodynamics of contra-rotating fans with swept blades. In Proceedings of the ASME 2015 Gas Turbine India Conference, Hyderabad, India, 2–3 December 2015. [Google Scholar]
- Liu, H.; Wang, Y.; Xian, S.; Hu, W. Effect of inlet distortion on the performance of axial transonic contra-rotating compressor. Proc. Inst. Mech. Eng. Part G J. Aerosp. Eng. 2016, 232, 42–54. [Google Scholar] [CrossRef]
- Mao, X.; Liu, B.; Zhao, H. Effects of tip clearance size on the unsteady flow behaviors and performance in a counter-rotating axial flow compressor. Proc. Inst. Mech. Eng. Part G J. Aerosp. Eng. 2017, 233, 1059–1070. [Google Scholar] [CrossRef]
- Sun, S.; Wang, S.; Chen, S. Aerodynamic Design and Analysis of a Two-Stage High-Load Low-Reaction Transonic Aspirated Counter-Rotating Compressor. In Proceedings of the ASME Turbo Expo 2017: Turbomachinery Technical Conference and Exposition, Charlotte, NC, USA, 26–30 June 2017. [Google Scholar]
- Joshi, N.; Payyappalli, M.M.; Pradeep, A.M. Performance evaluation of contra-rotating fans operating under different speed combinations. In Proceedings of the ASME 2019 Gas Turbine India Conference, Chennai, Tamil Nadu, India, 5–6 December 2019. [Google Scholar]
- Liang, T.; Liu, B.; Spence, S.; Jiao, L. Numerical analysis of the effects of circumferential groove casing suction in a counter-rotating axial flow compressor. Proc. Inst. Mech. Eng. Part A J. Power Energy 2020, 235, 944–955. [Google Scholar] [CrossRef]
- Johnsen, I.A.; Bullock, R.O. Aerodynamic Design of Axial-Flow Compressors; NASA: Washington, DC, USA, 1965. [Google Scholar]
- Wennerstrom, A.J.; Puterbaugh, S.L. A Three-Dimensional Model for the Prediction of Shock Losses in Compressor Blade Rows. ASME J. Eng. Gas Turbines Power 1984, 106, 295–299. [Google Scholar] [CrossRef]
- Koch, C.C.; Smith, L.H., Jr. Loss Sources and Magnitudes in Axial-Flow Compressors. ASME J. Eng. Power 1976, 98, 411–424. [Google Scholar] [CrossRef]
- Shi, H. A Parametric Blade Design Method for High-Speed Axial Compressor. Aerospace 2021, 8, 271. [Google Scholar] [CrossRef]
- Shi, H. Parametric Research and Aerodynamic Characteristic of a Two-Stage Transonic Compressor for a Turbine Based Combined Cycle Engine. Aerospace 2022, 9, 346. [Google Scholar] [CrossRef]
- Shi, H.; Liu, B.; Yu, X. Criteria for designing low-loss and wide operation range variable inlet guide vanes. Aerosp. Sci. Technol. 2018, 80, 177–191. [Google Scholar] [CrossRef]
- Saravanamuttoo, H.I.H.; Rogers, G.F.C.; Cohen, H.; Straznicky, P.V.; Nix, A.C. Gas Turbine Theory; Pearson: Harlow, UK, 2017. [Google Scholar]
Disclaimer/Publisher’s Note: The statements, opinions and data contained in all publications are solely those of the individual author(s) and contributor(s) and not of MDPI and/or the editor(s). MDPI and/or the editor(s) disclaim responsibility for any injury to people or property resulting from any ideas, methods, instructions or products referred to in the content. |
© 2023 by the authors. Licensee MDPI, Basel, Switzerland. This article is an open access article distributed under the terms and conditions of the Creative Commons Attribution (CC BY) license (https://creativecommons.org/licenses/by/4.0/).