
Environmental Impact Assessment of Agricultural Production Using LCA: A Review


Abstract
:1. Introduction
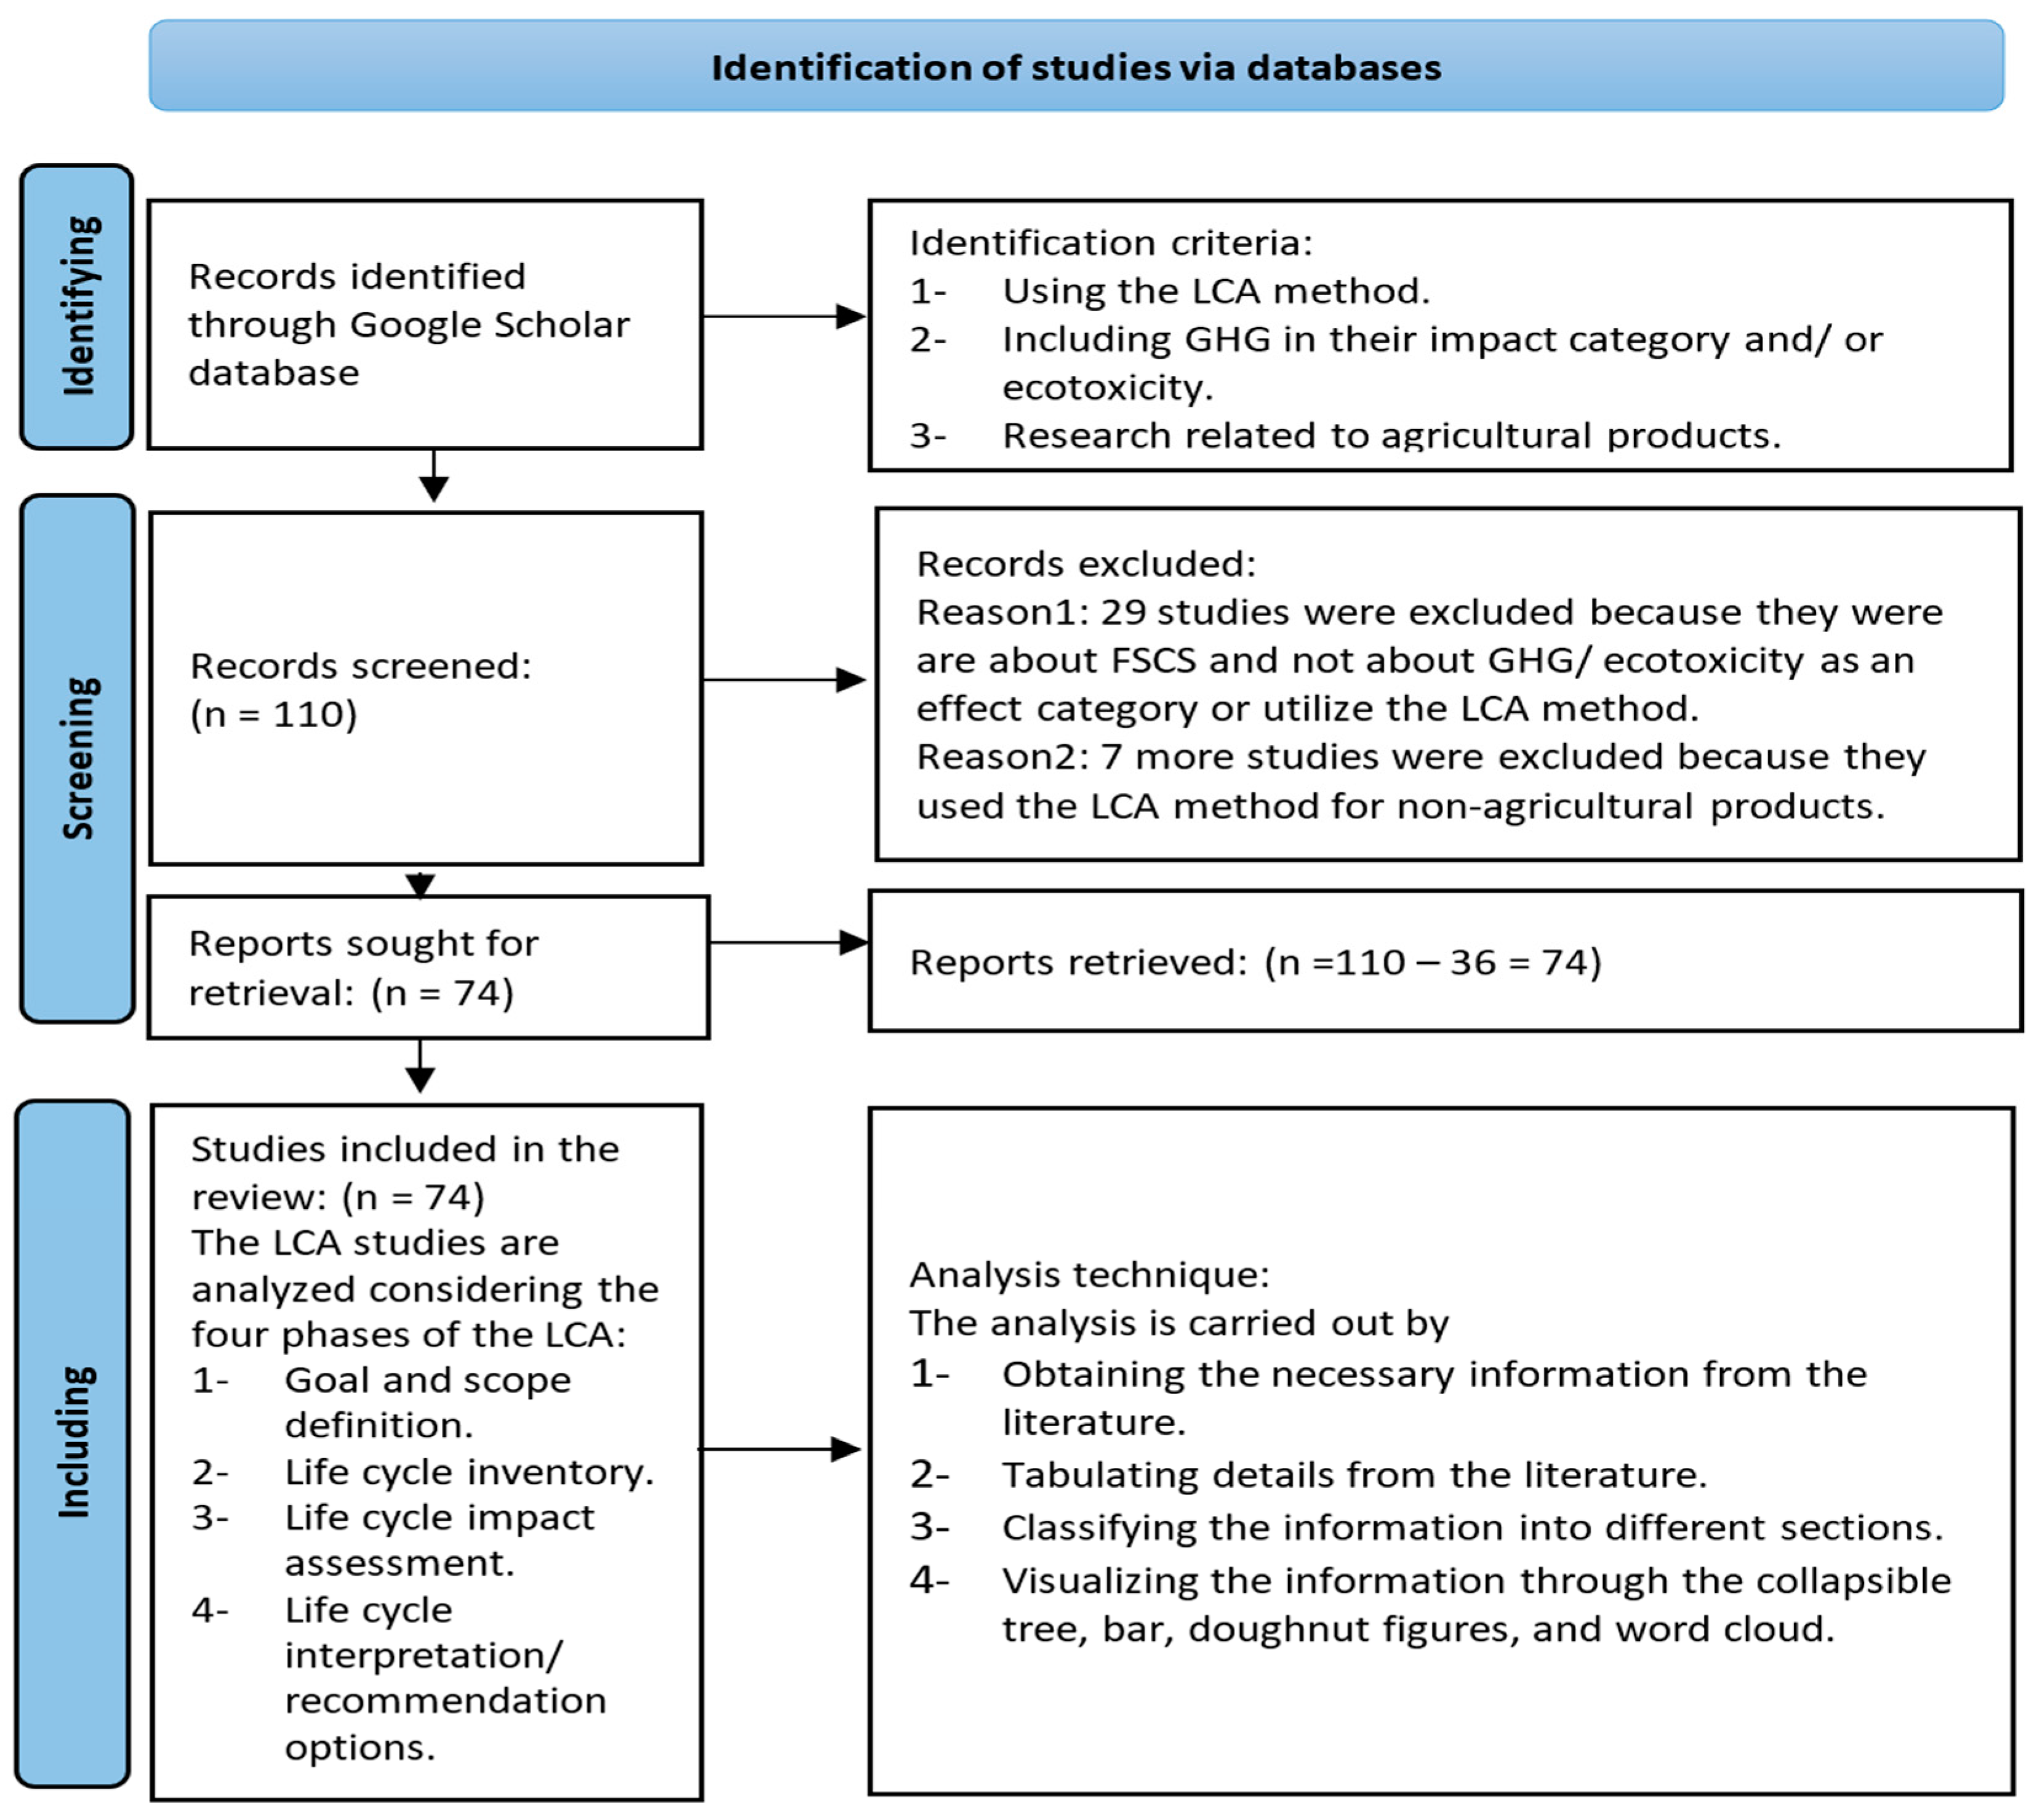
2. Materials and Methods
2.1. Eligibility Criteria
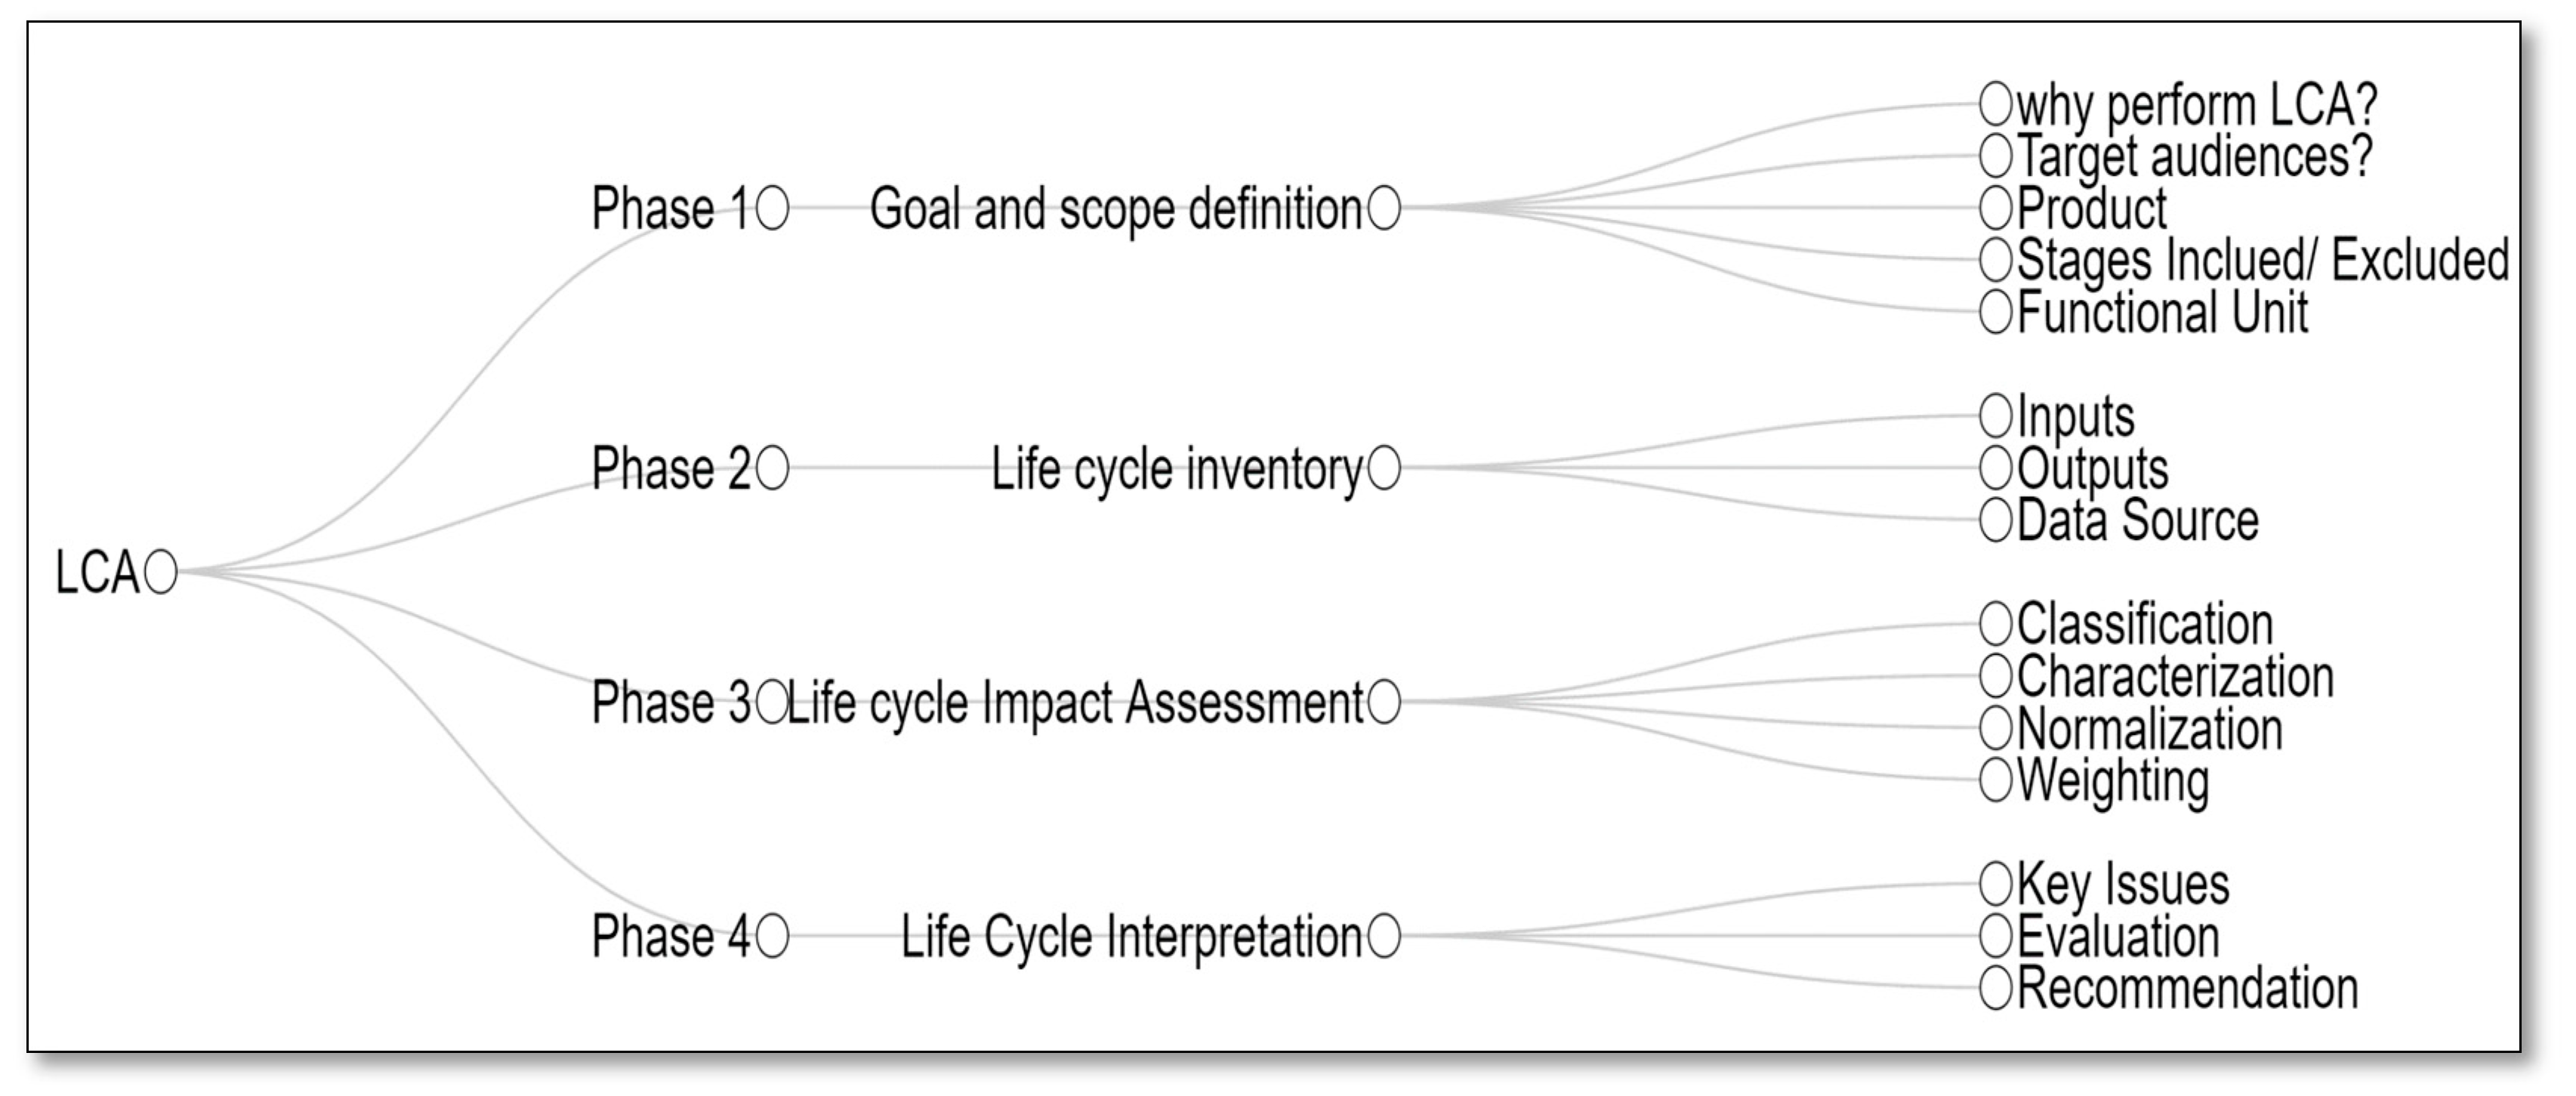
- Goal and scope definition,
- Life cycle inventory,
- Life cycle impact assessment,
- Life cycle interpretation/recommendation options.
2.2. Search Strategy
2.3. Categorization
2.4. Data Analysis
3. Results
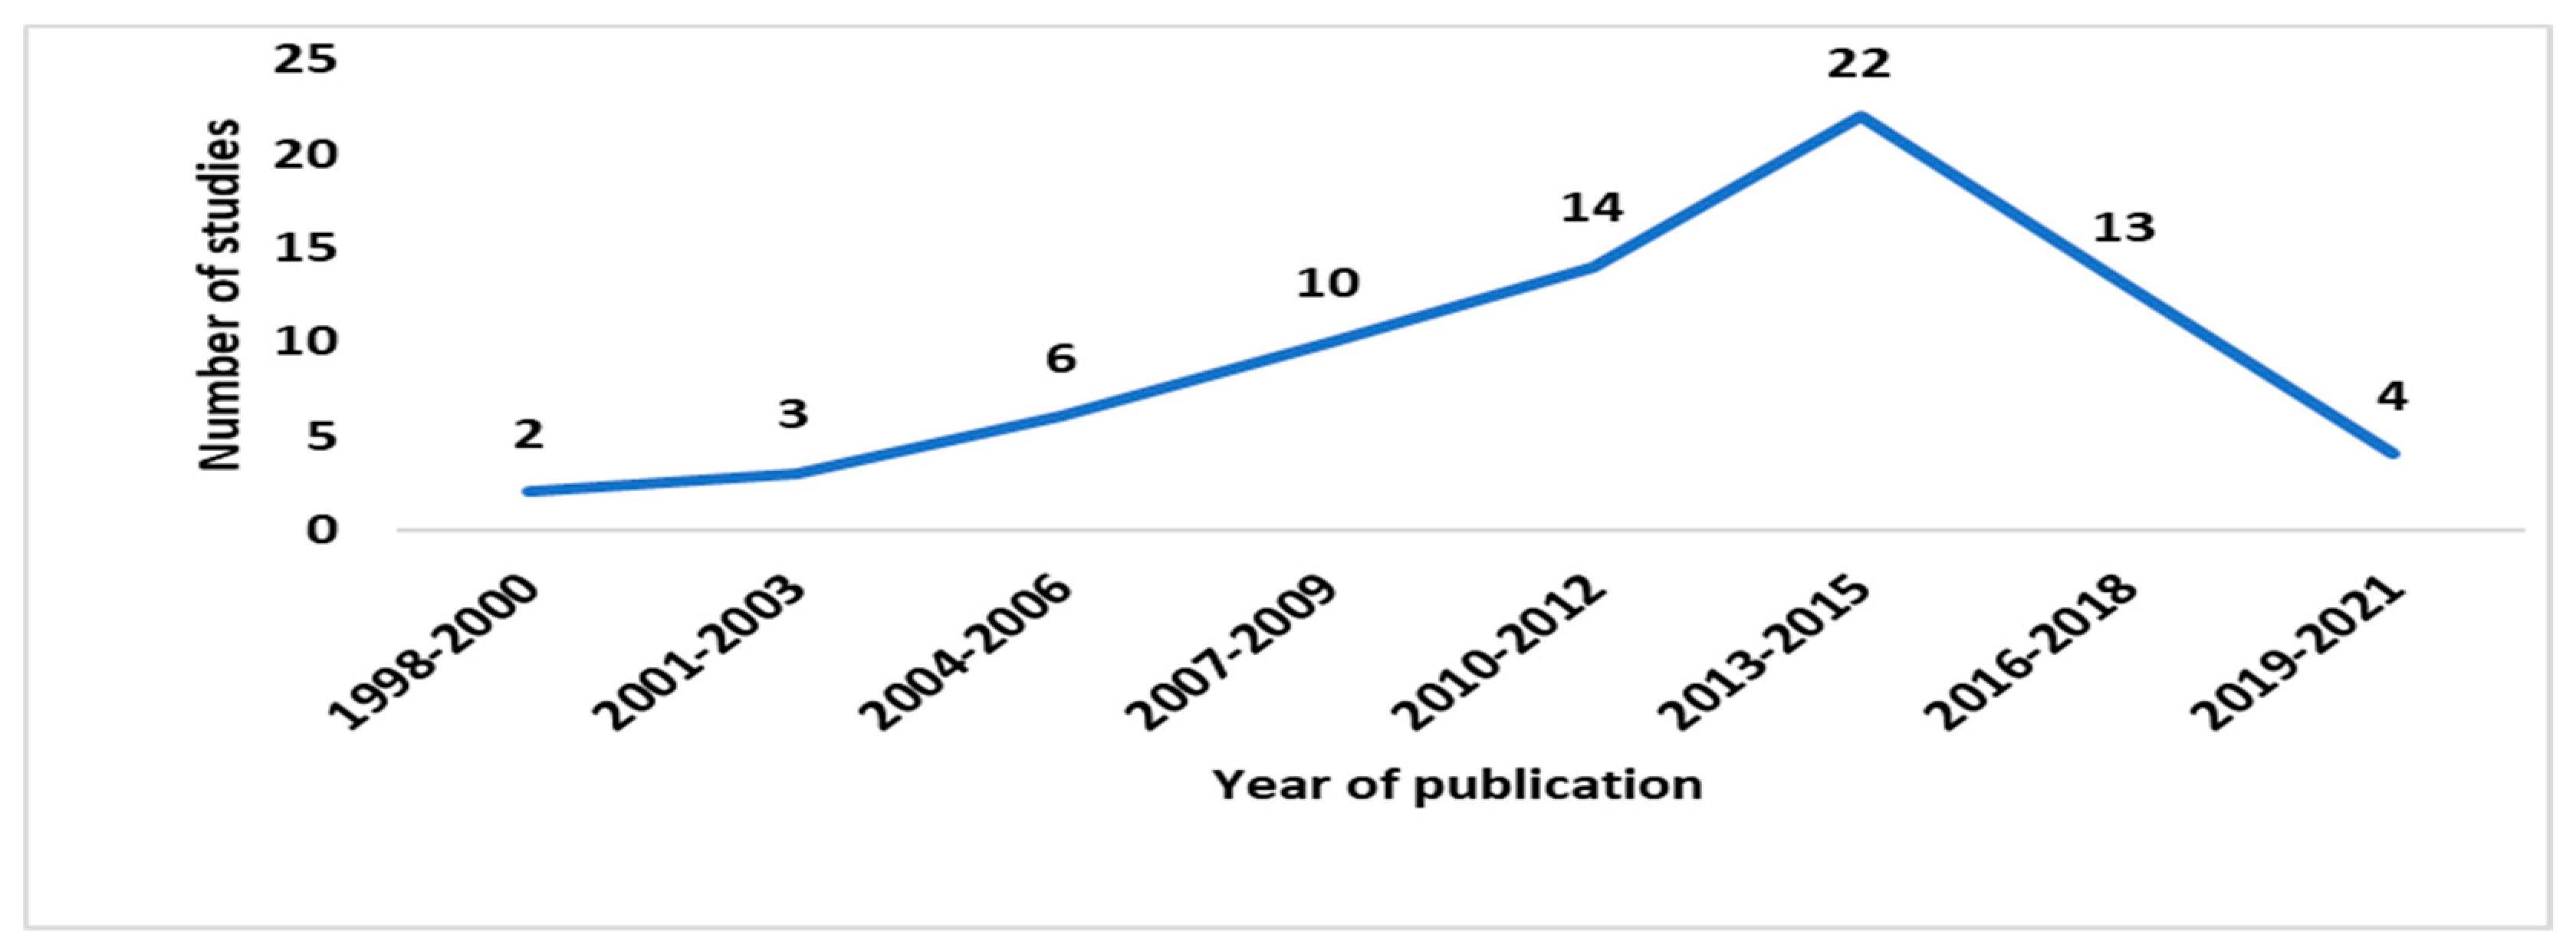
3.1. Snapshot of Selected Studies
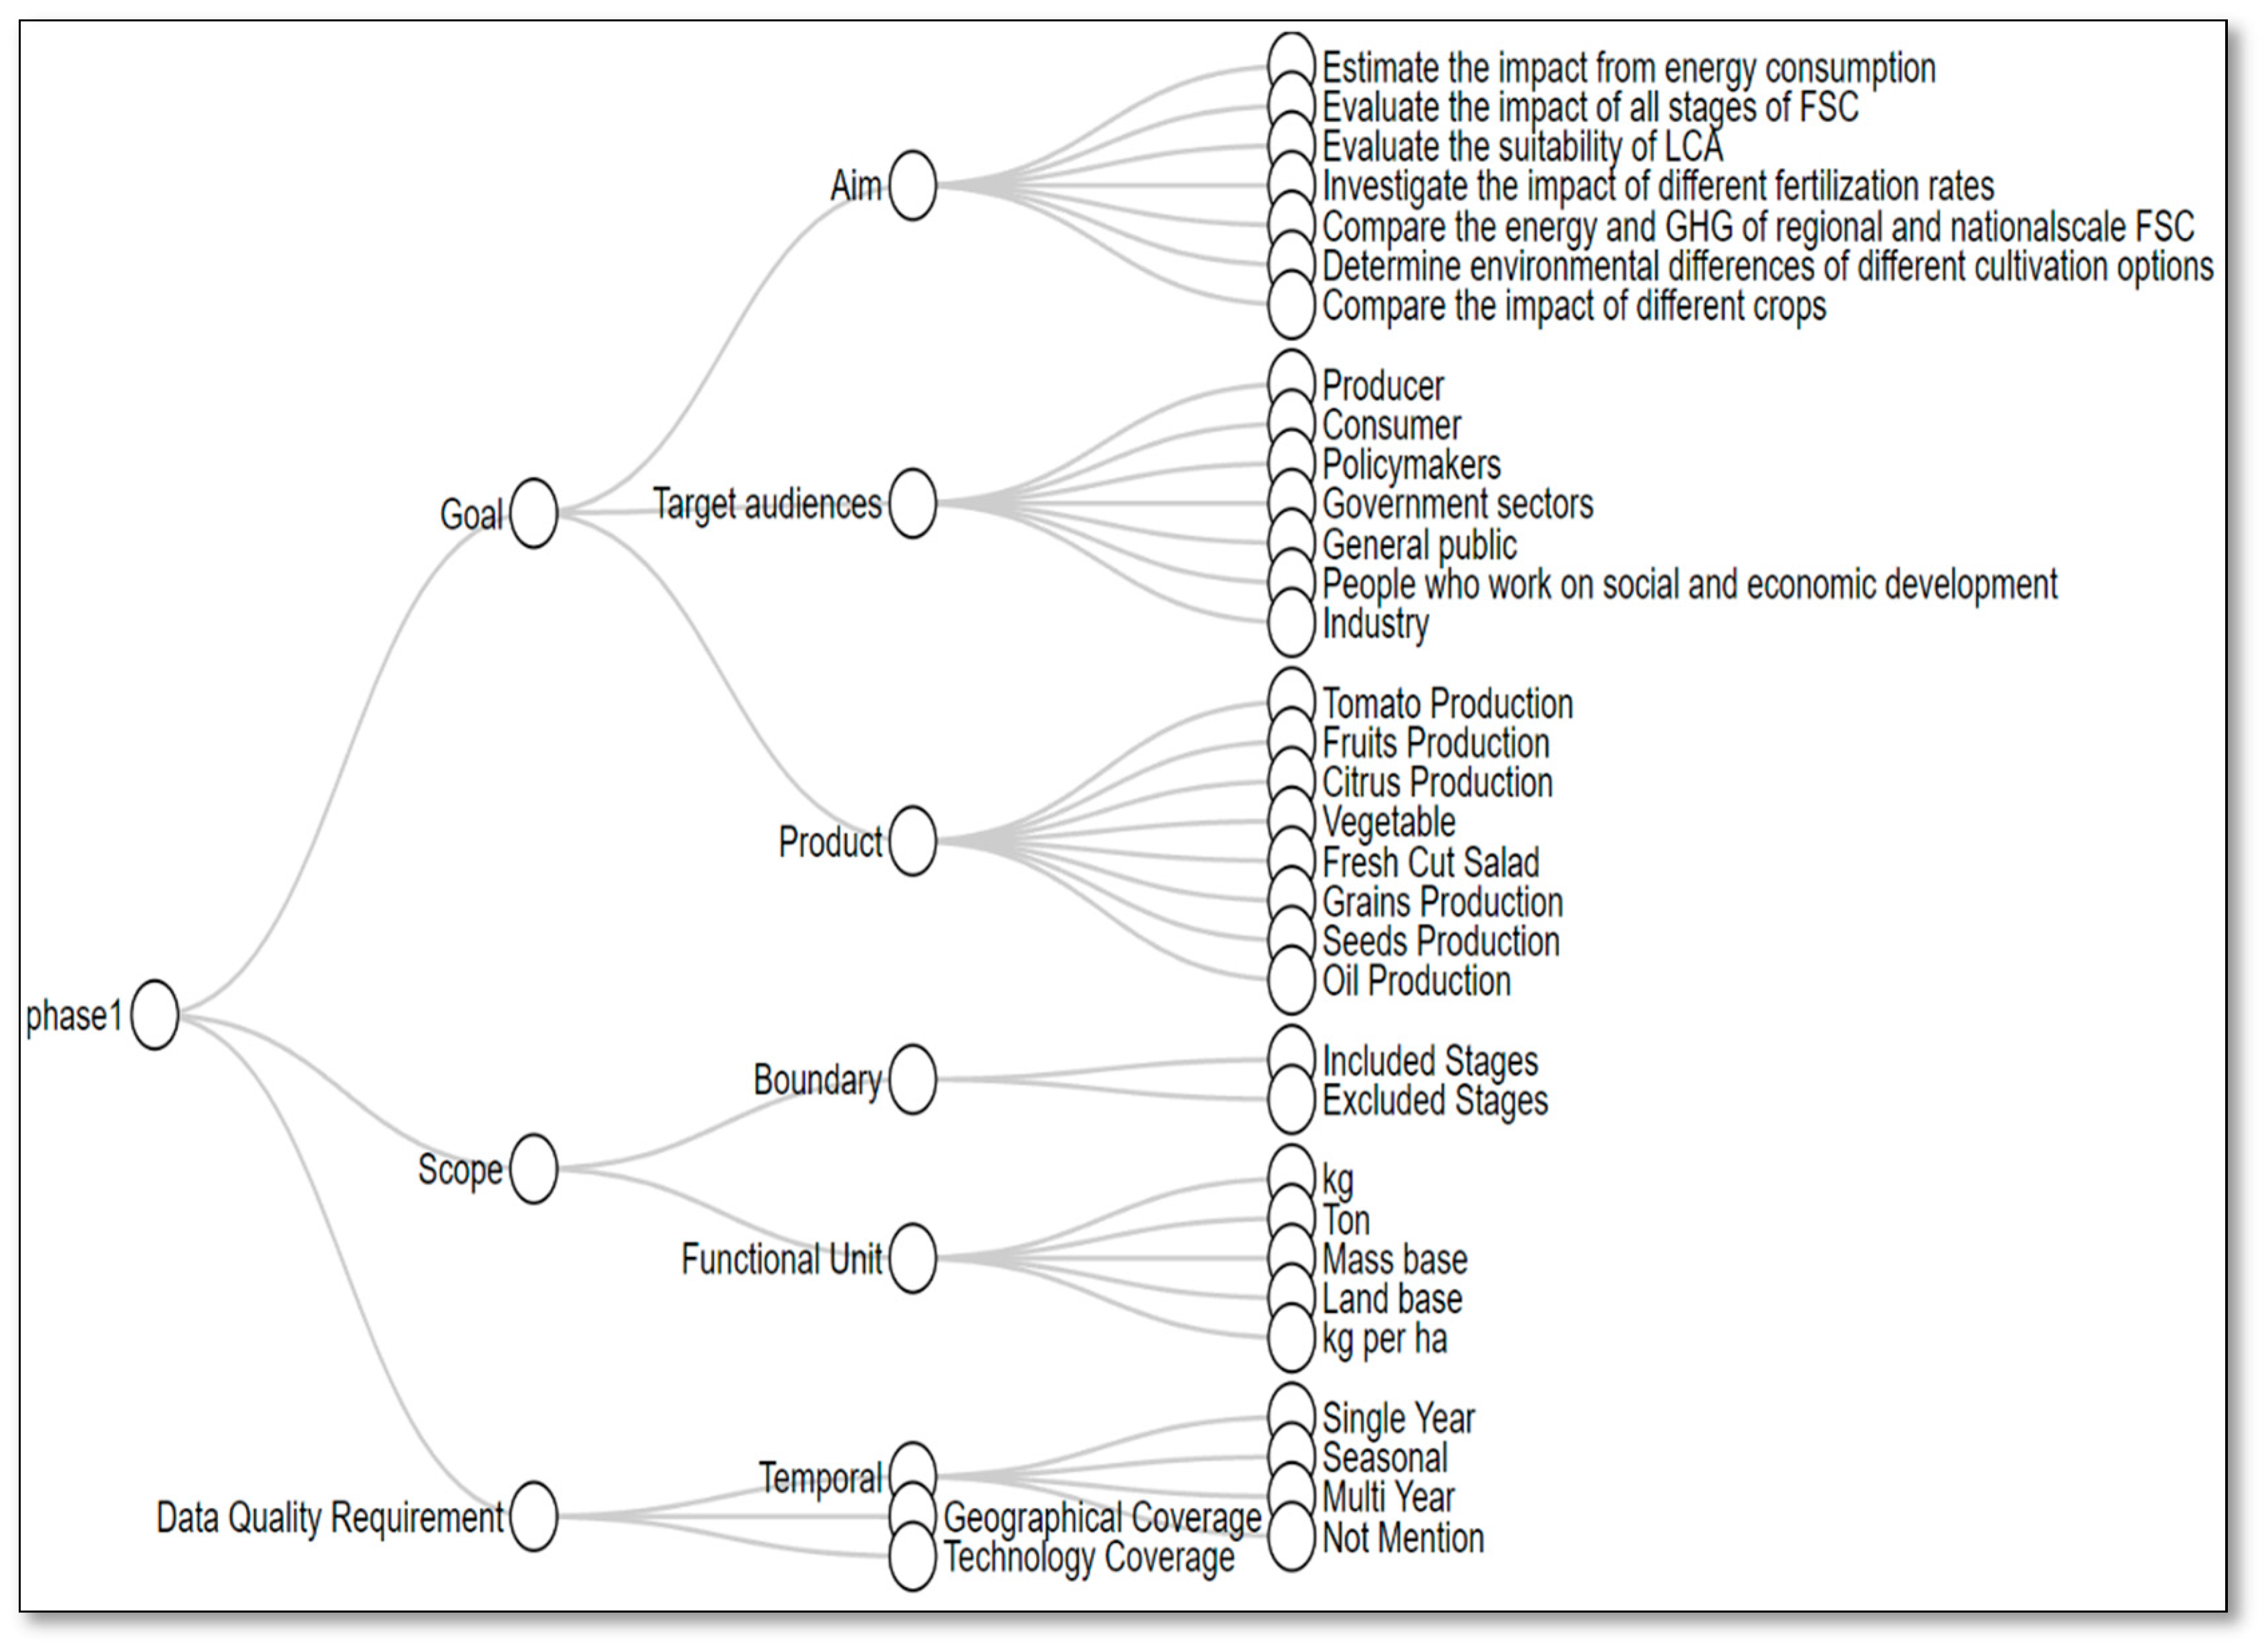
3.2. Phase 1: Goal and Scope Definition
3.2.1. Goal
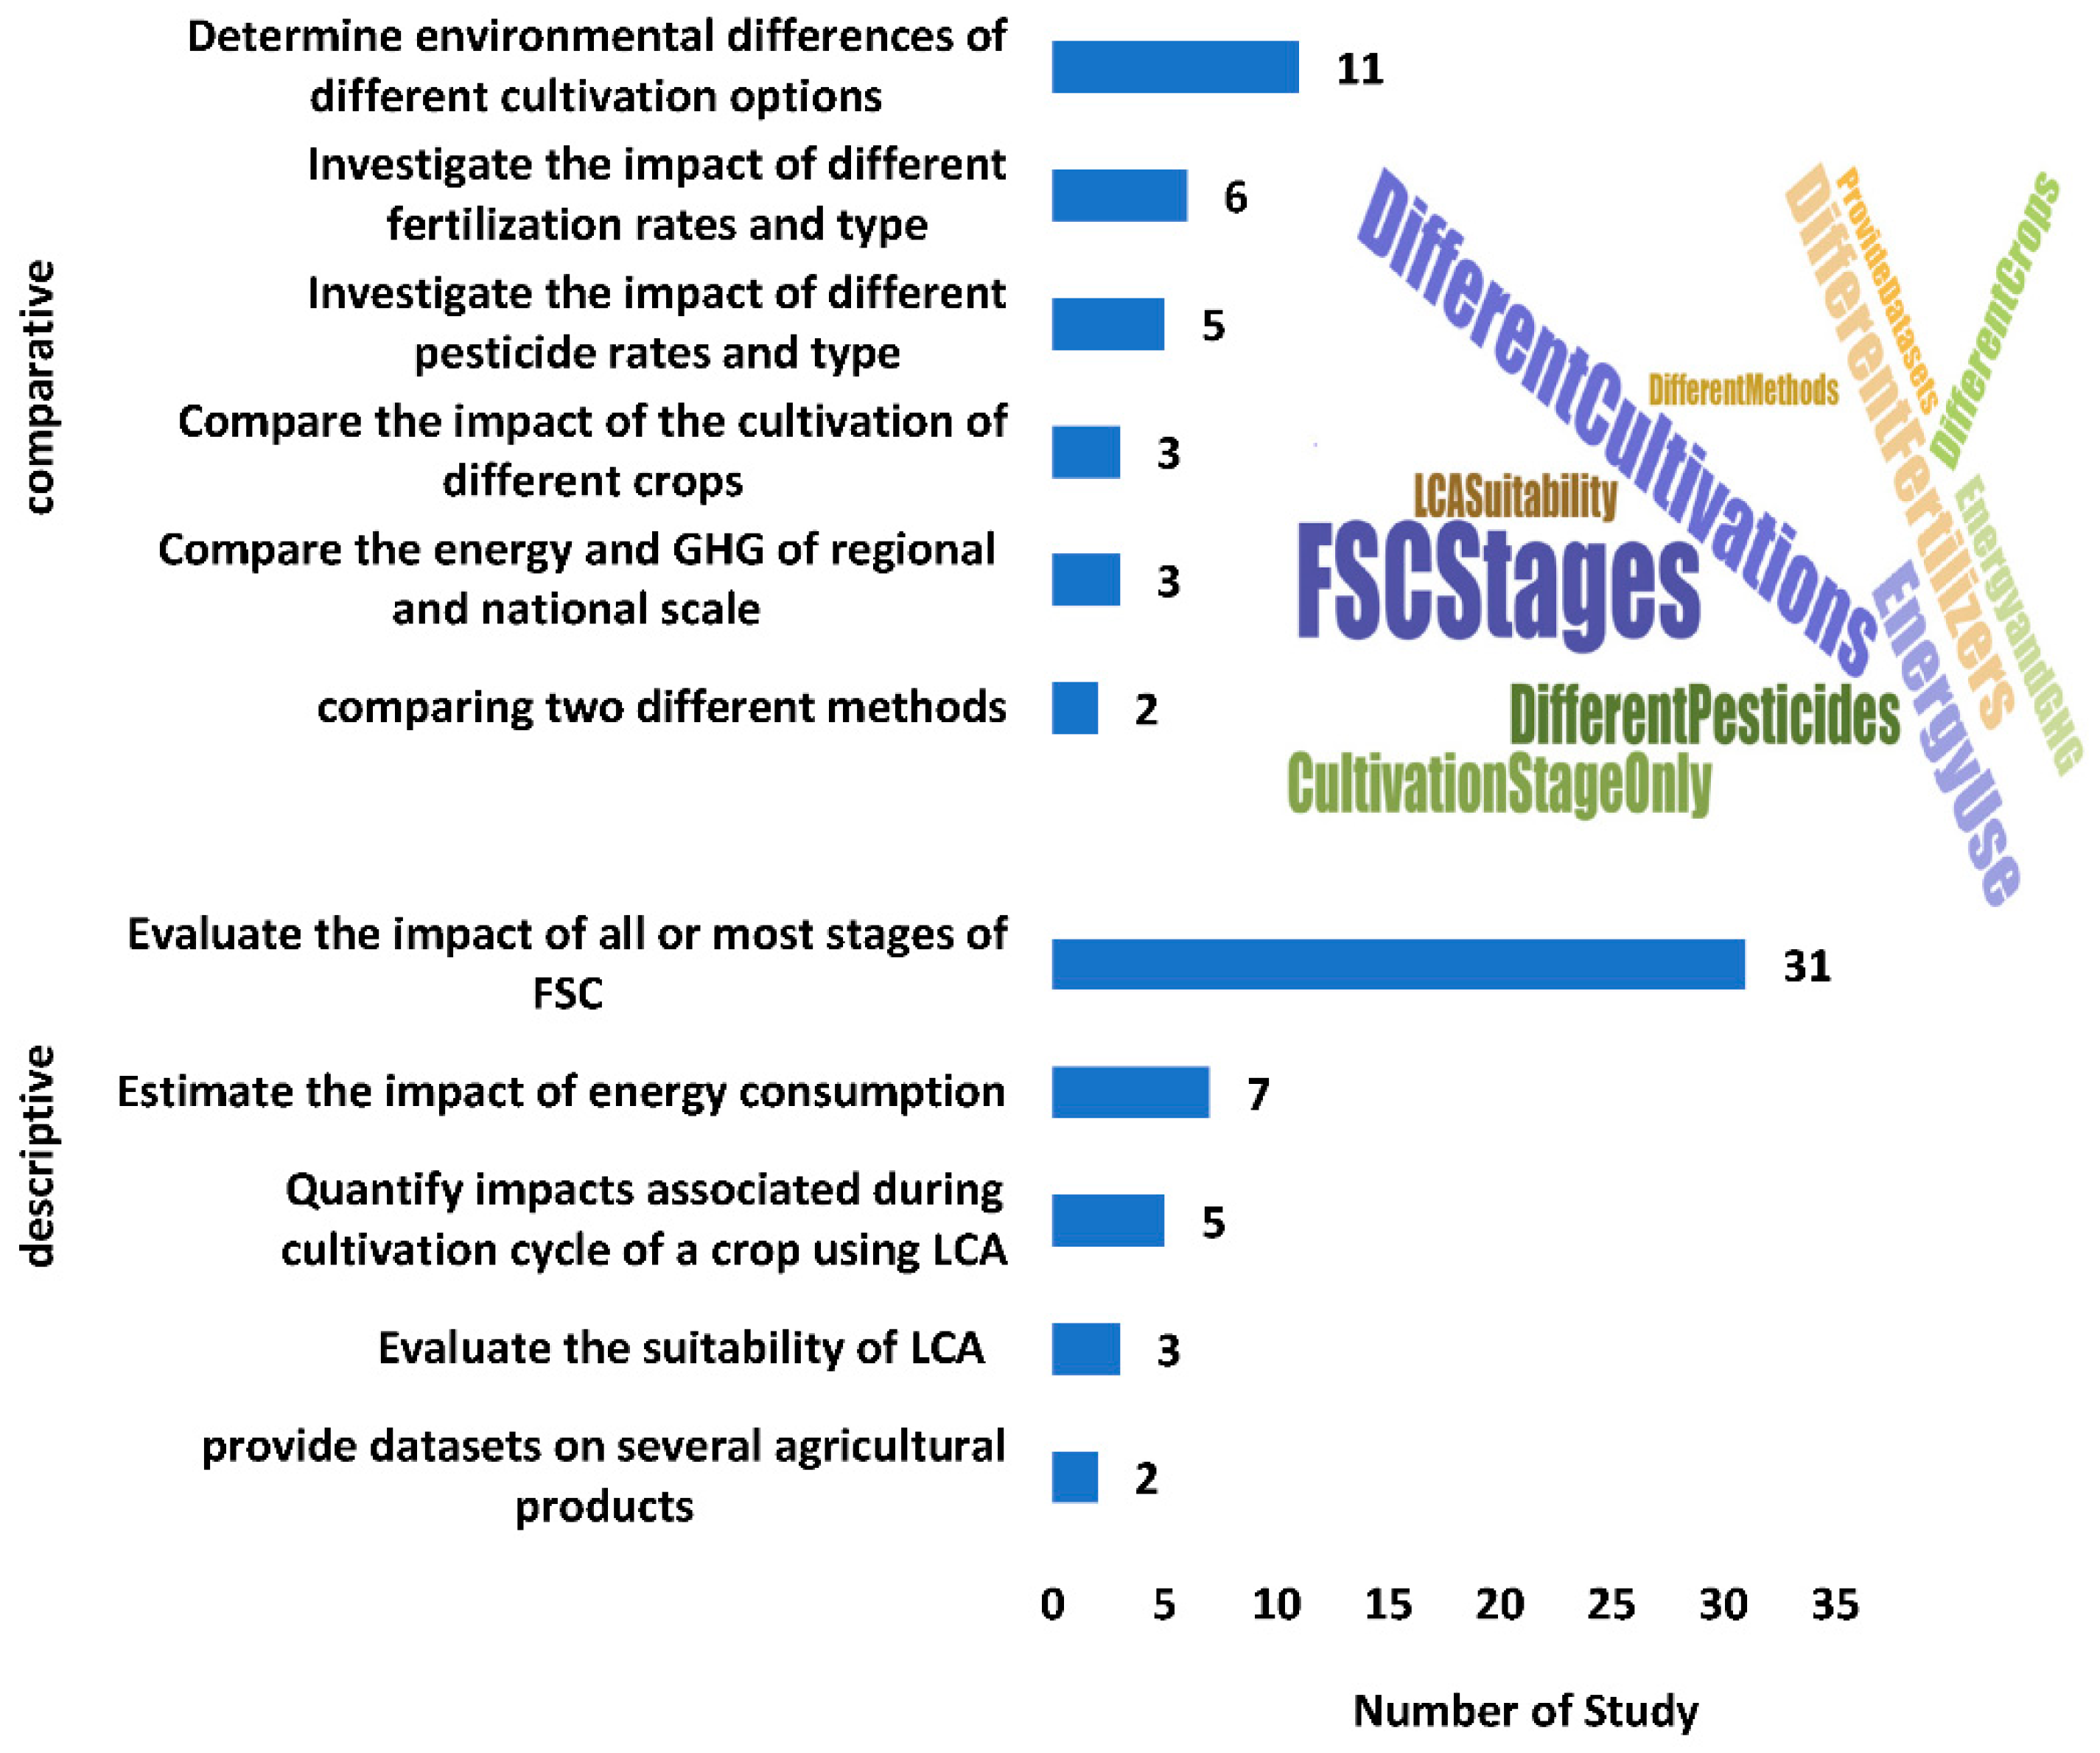
Aims of LCA
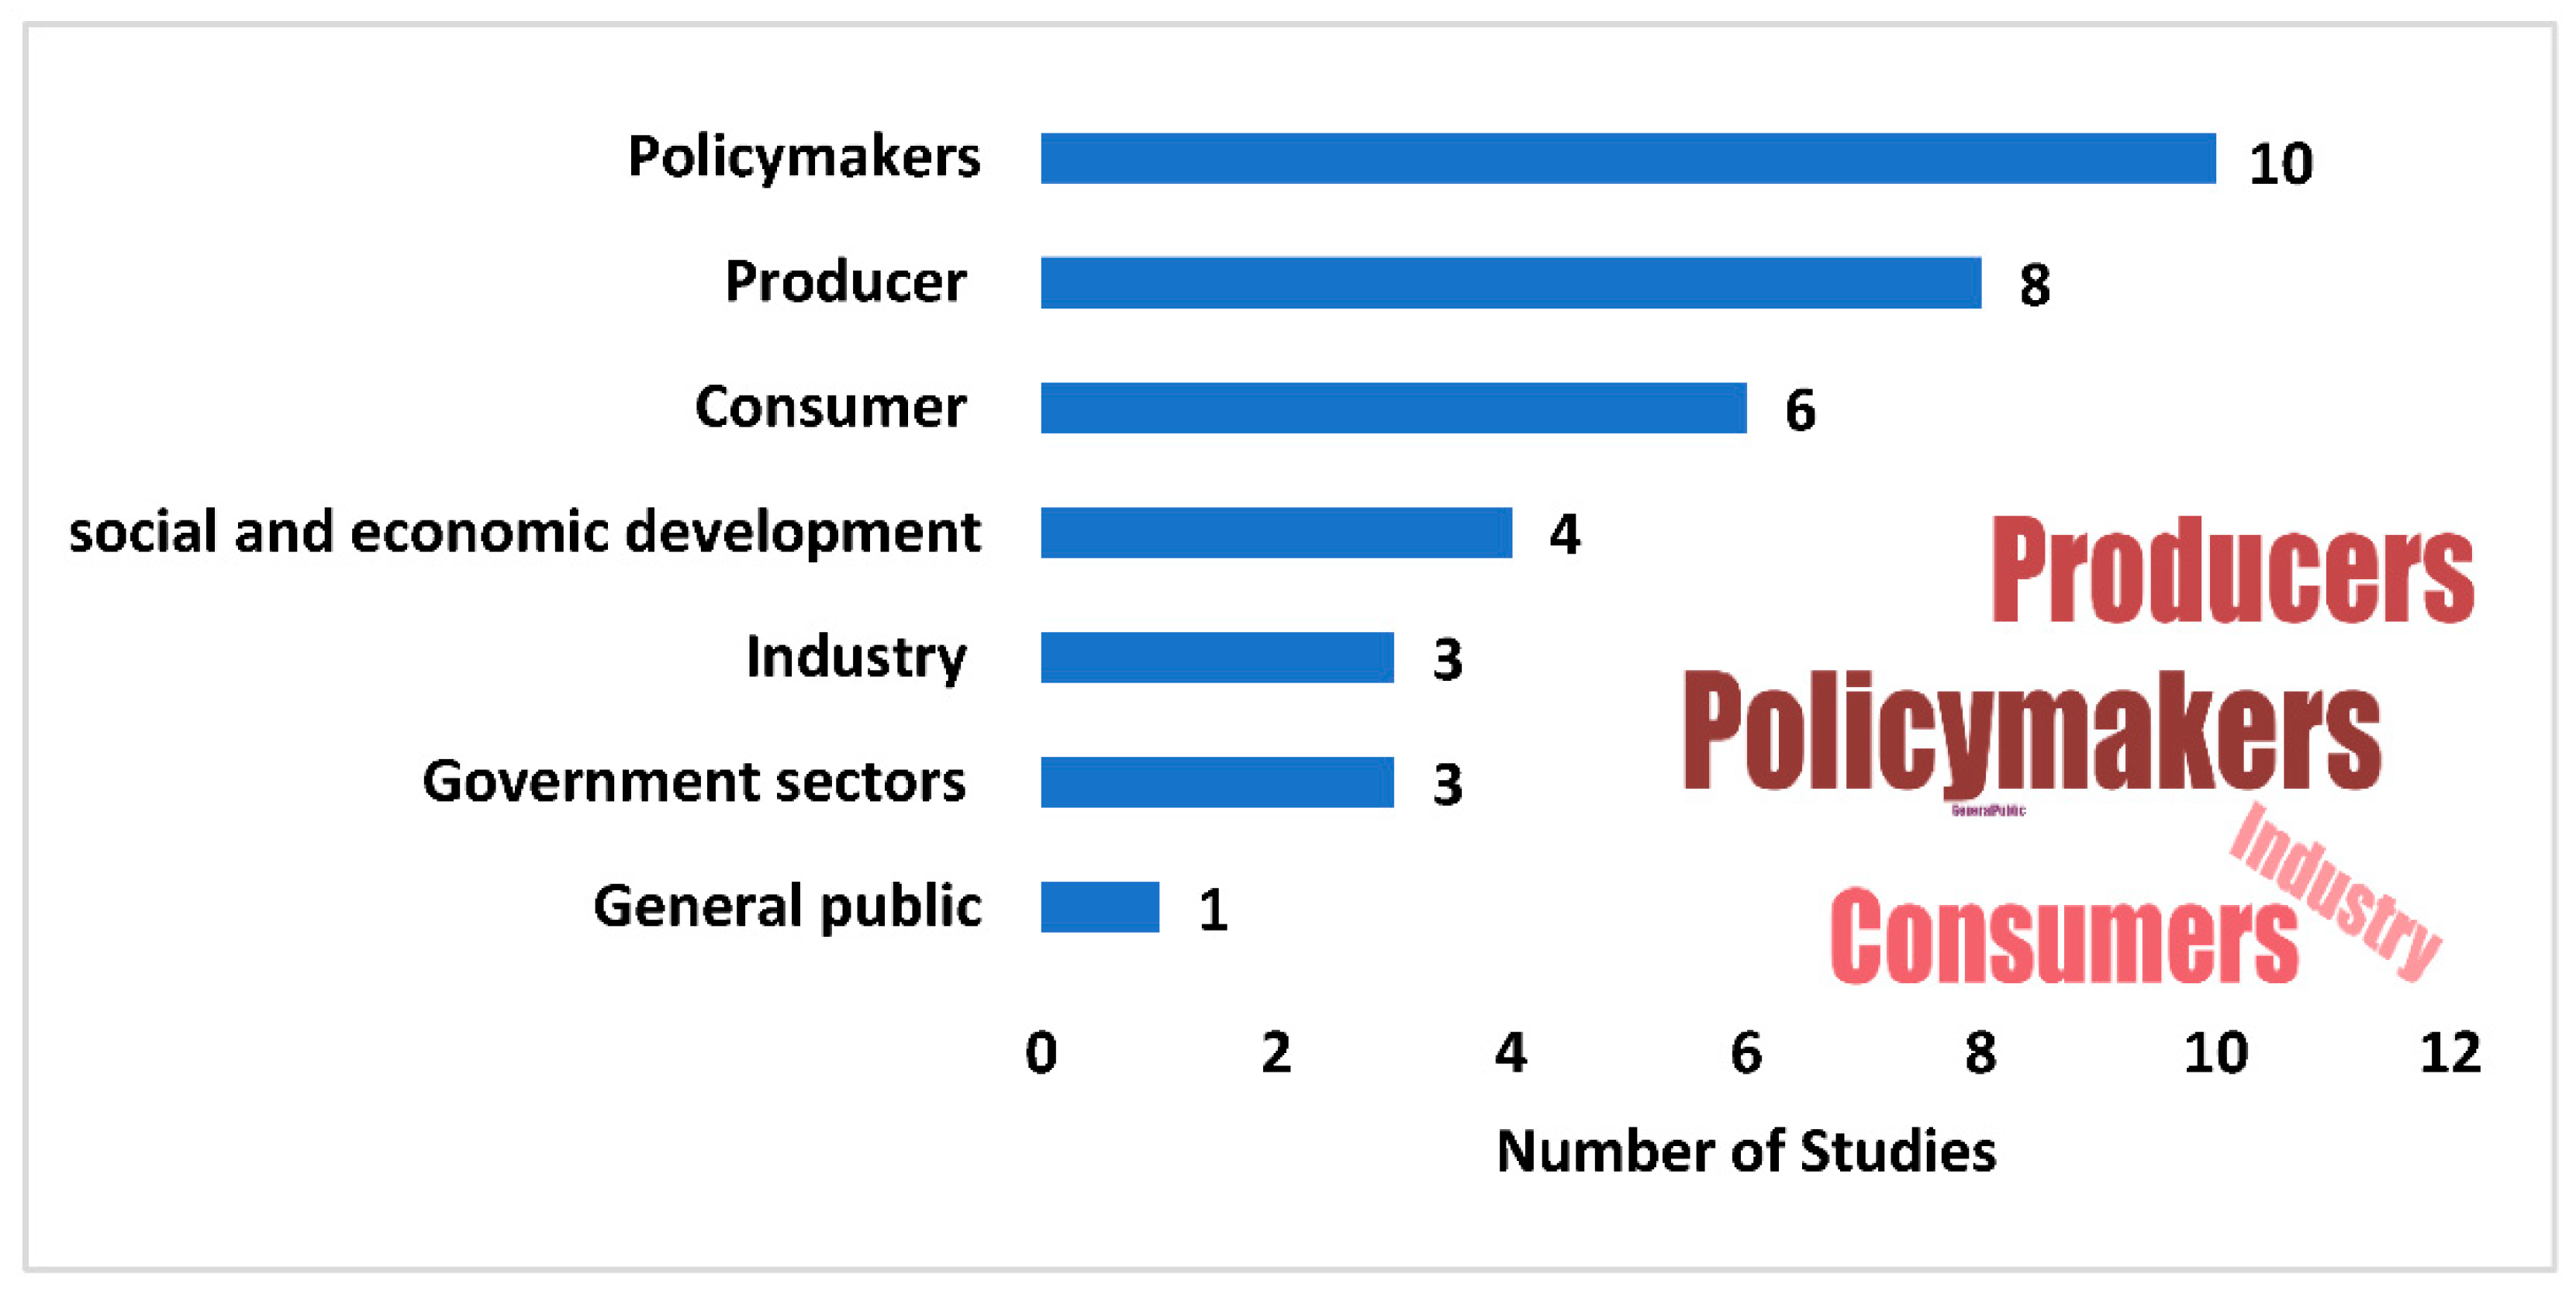
Target Audience
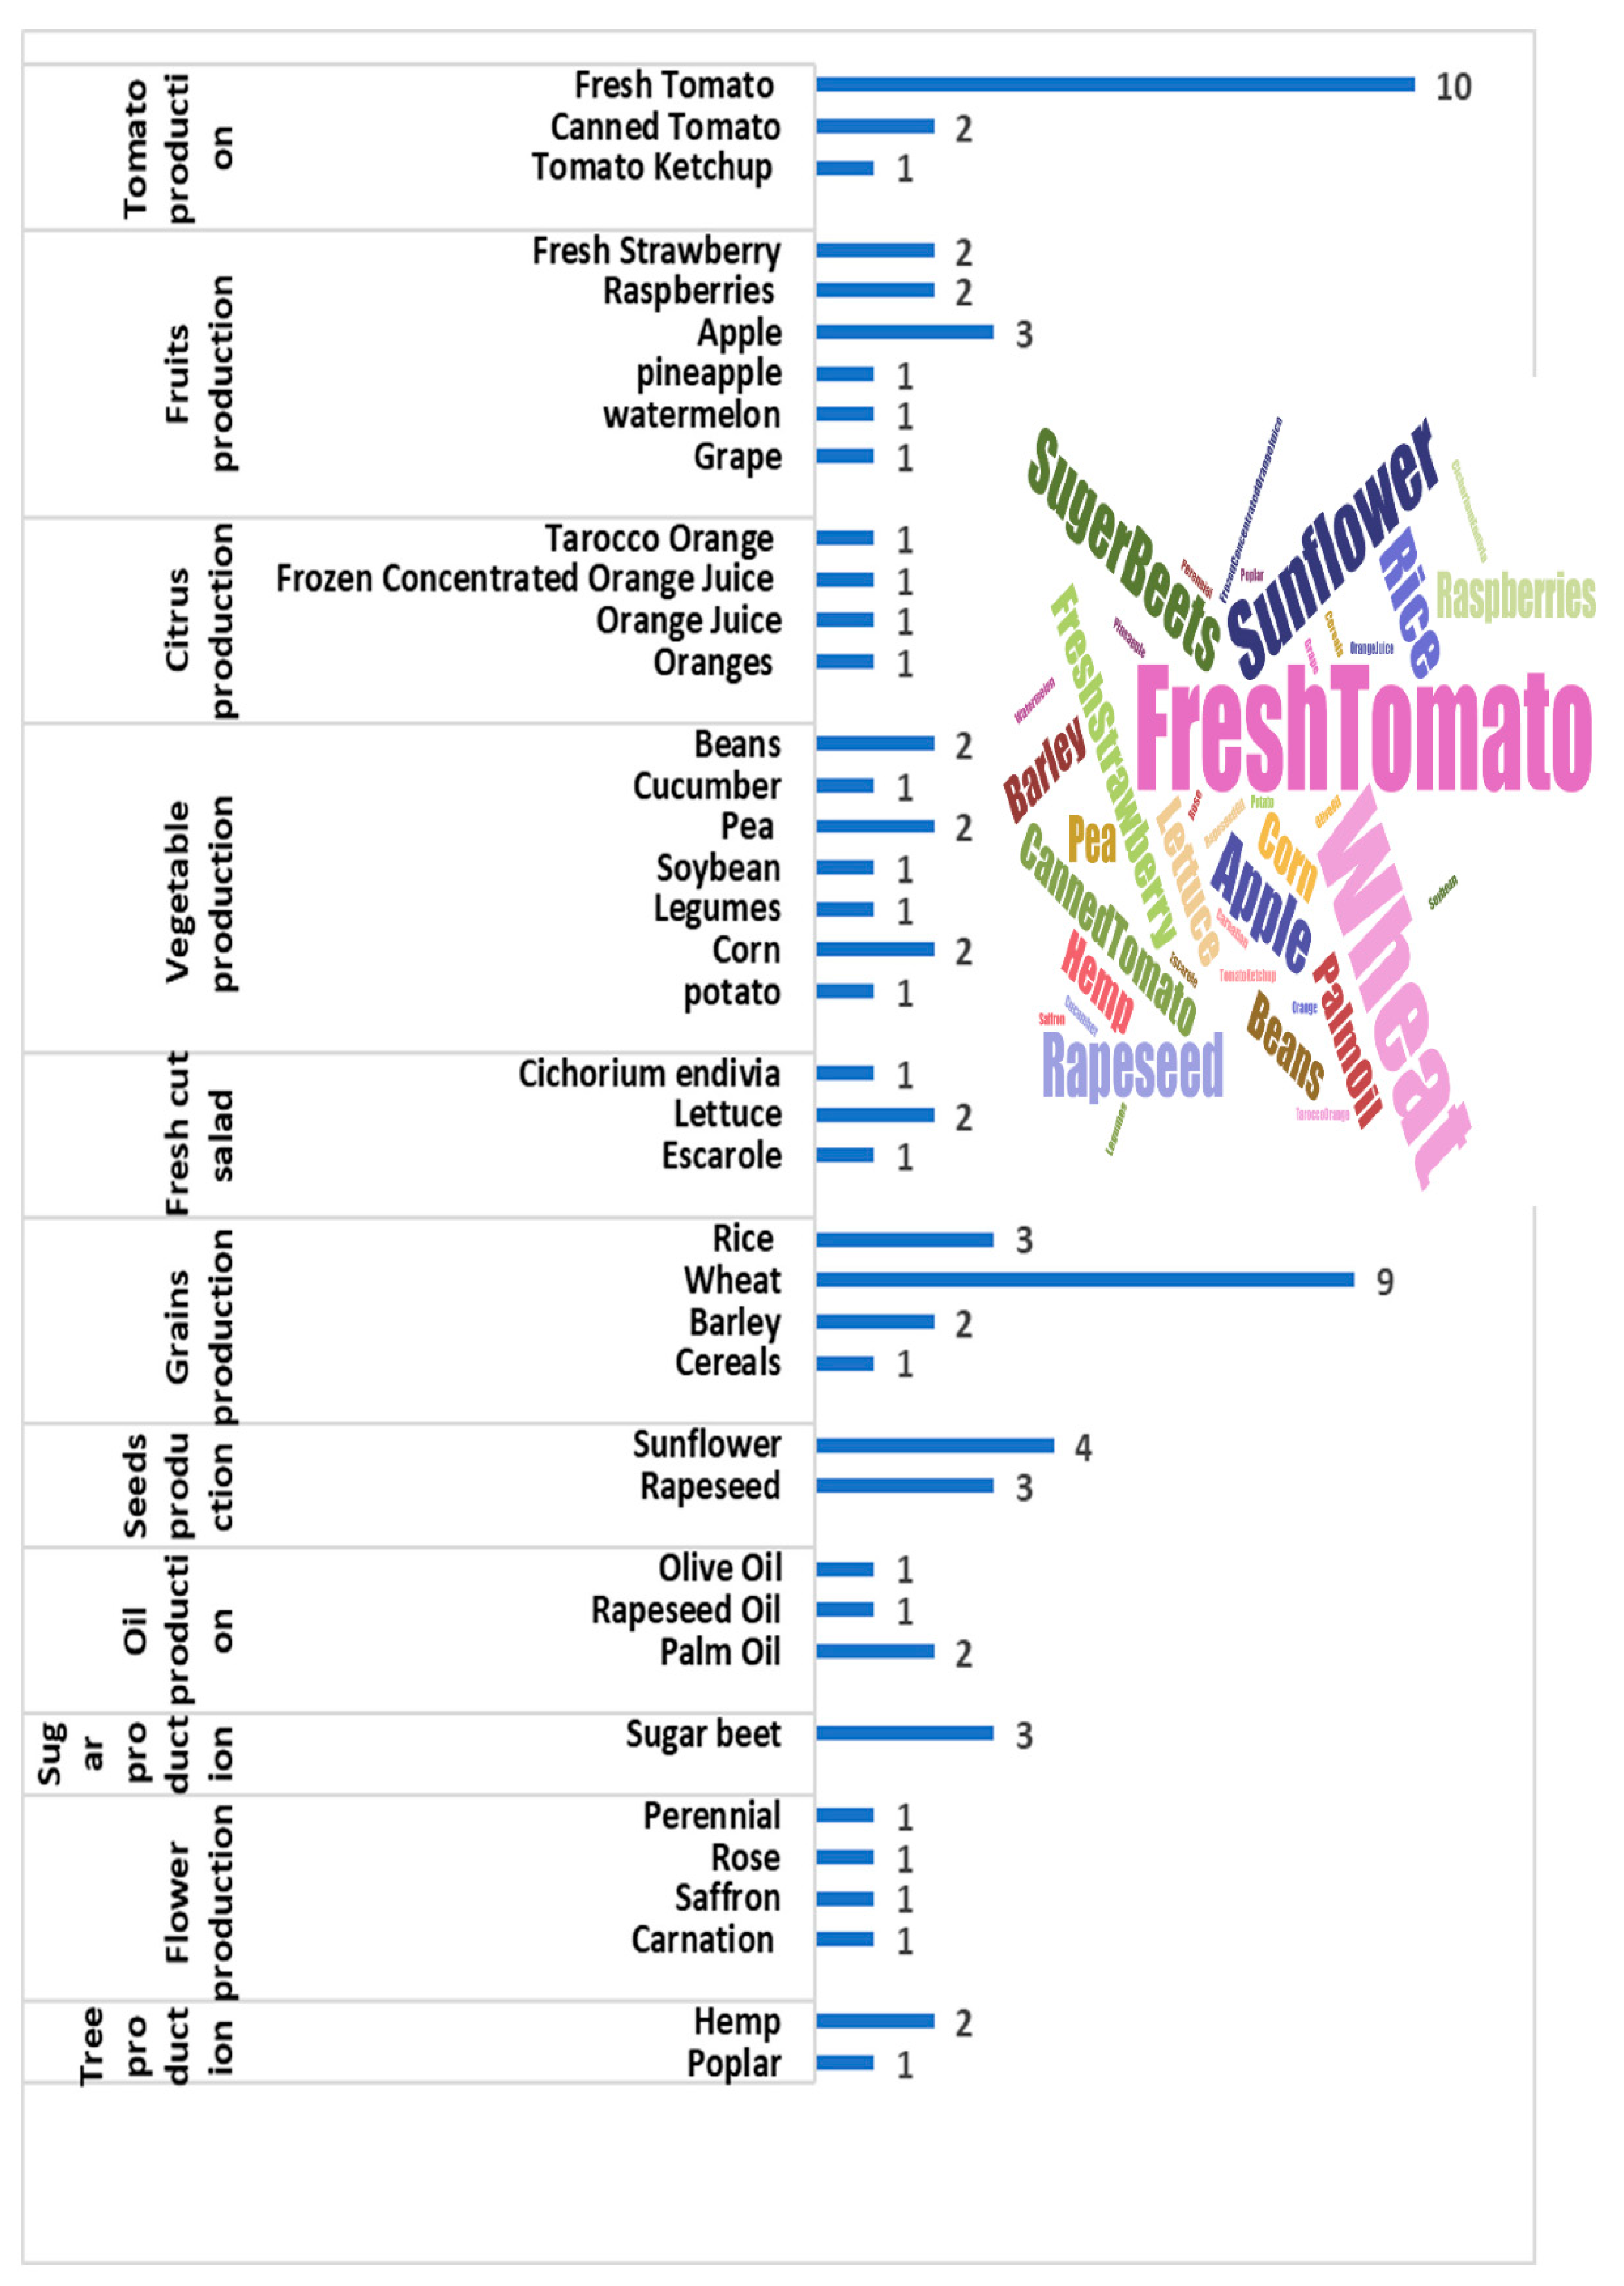
Agricultural
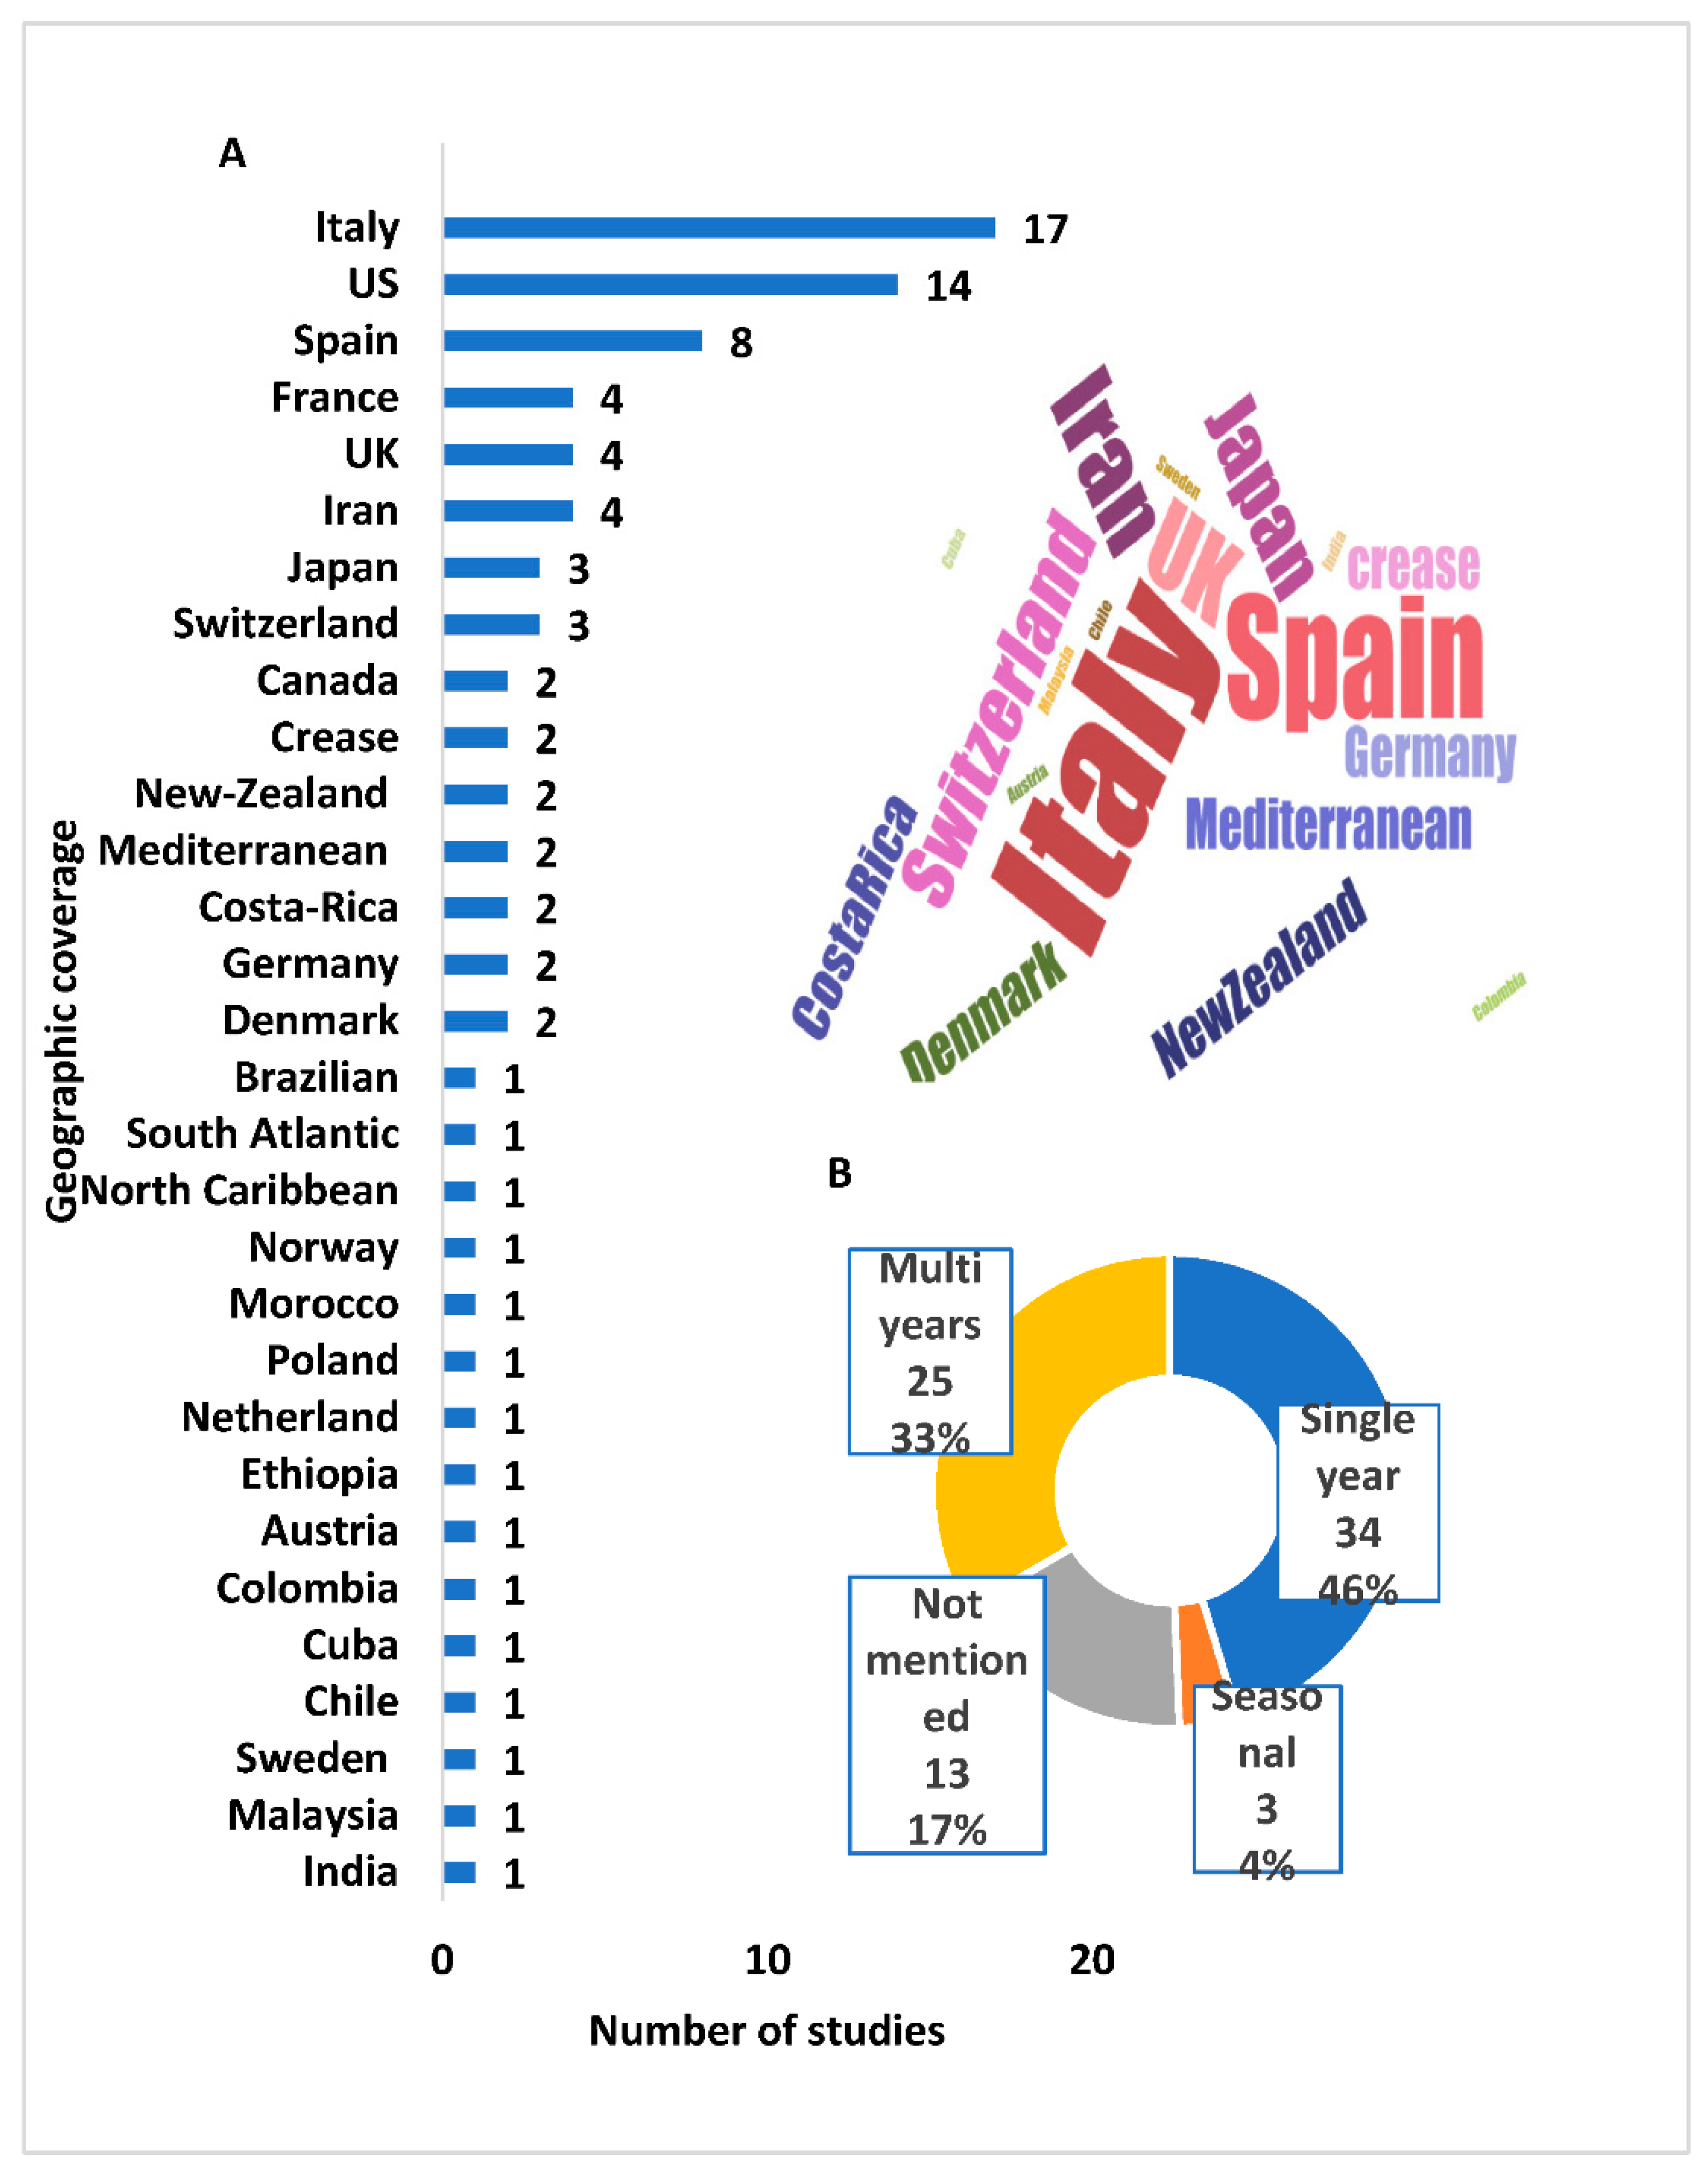
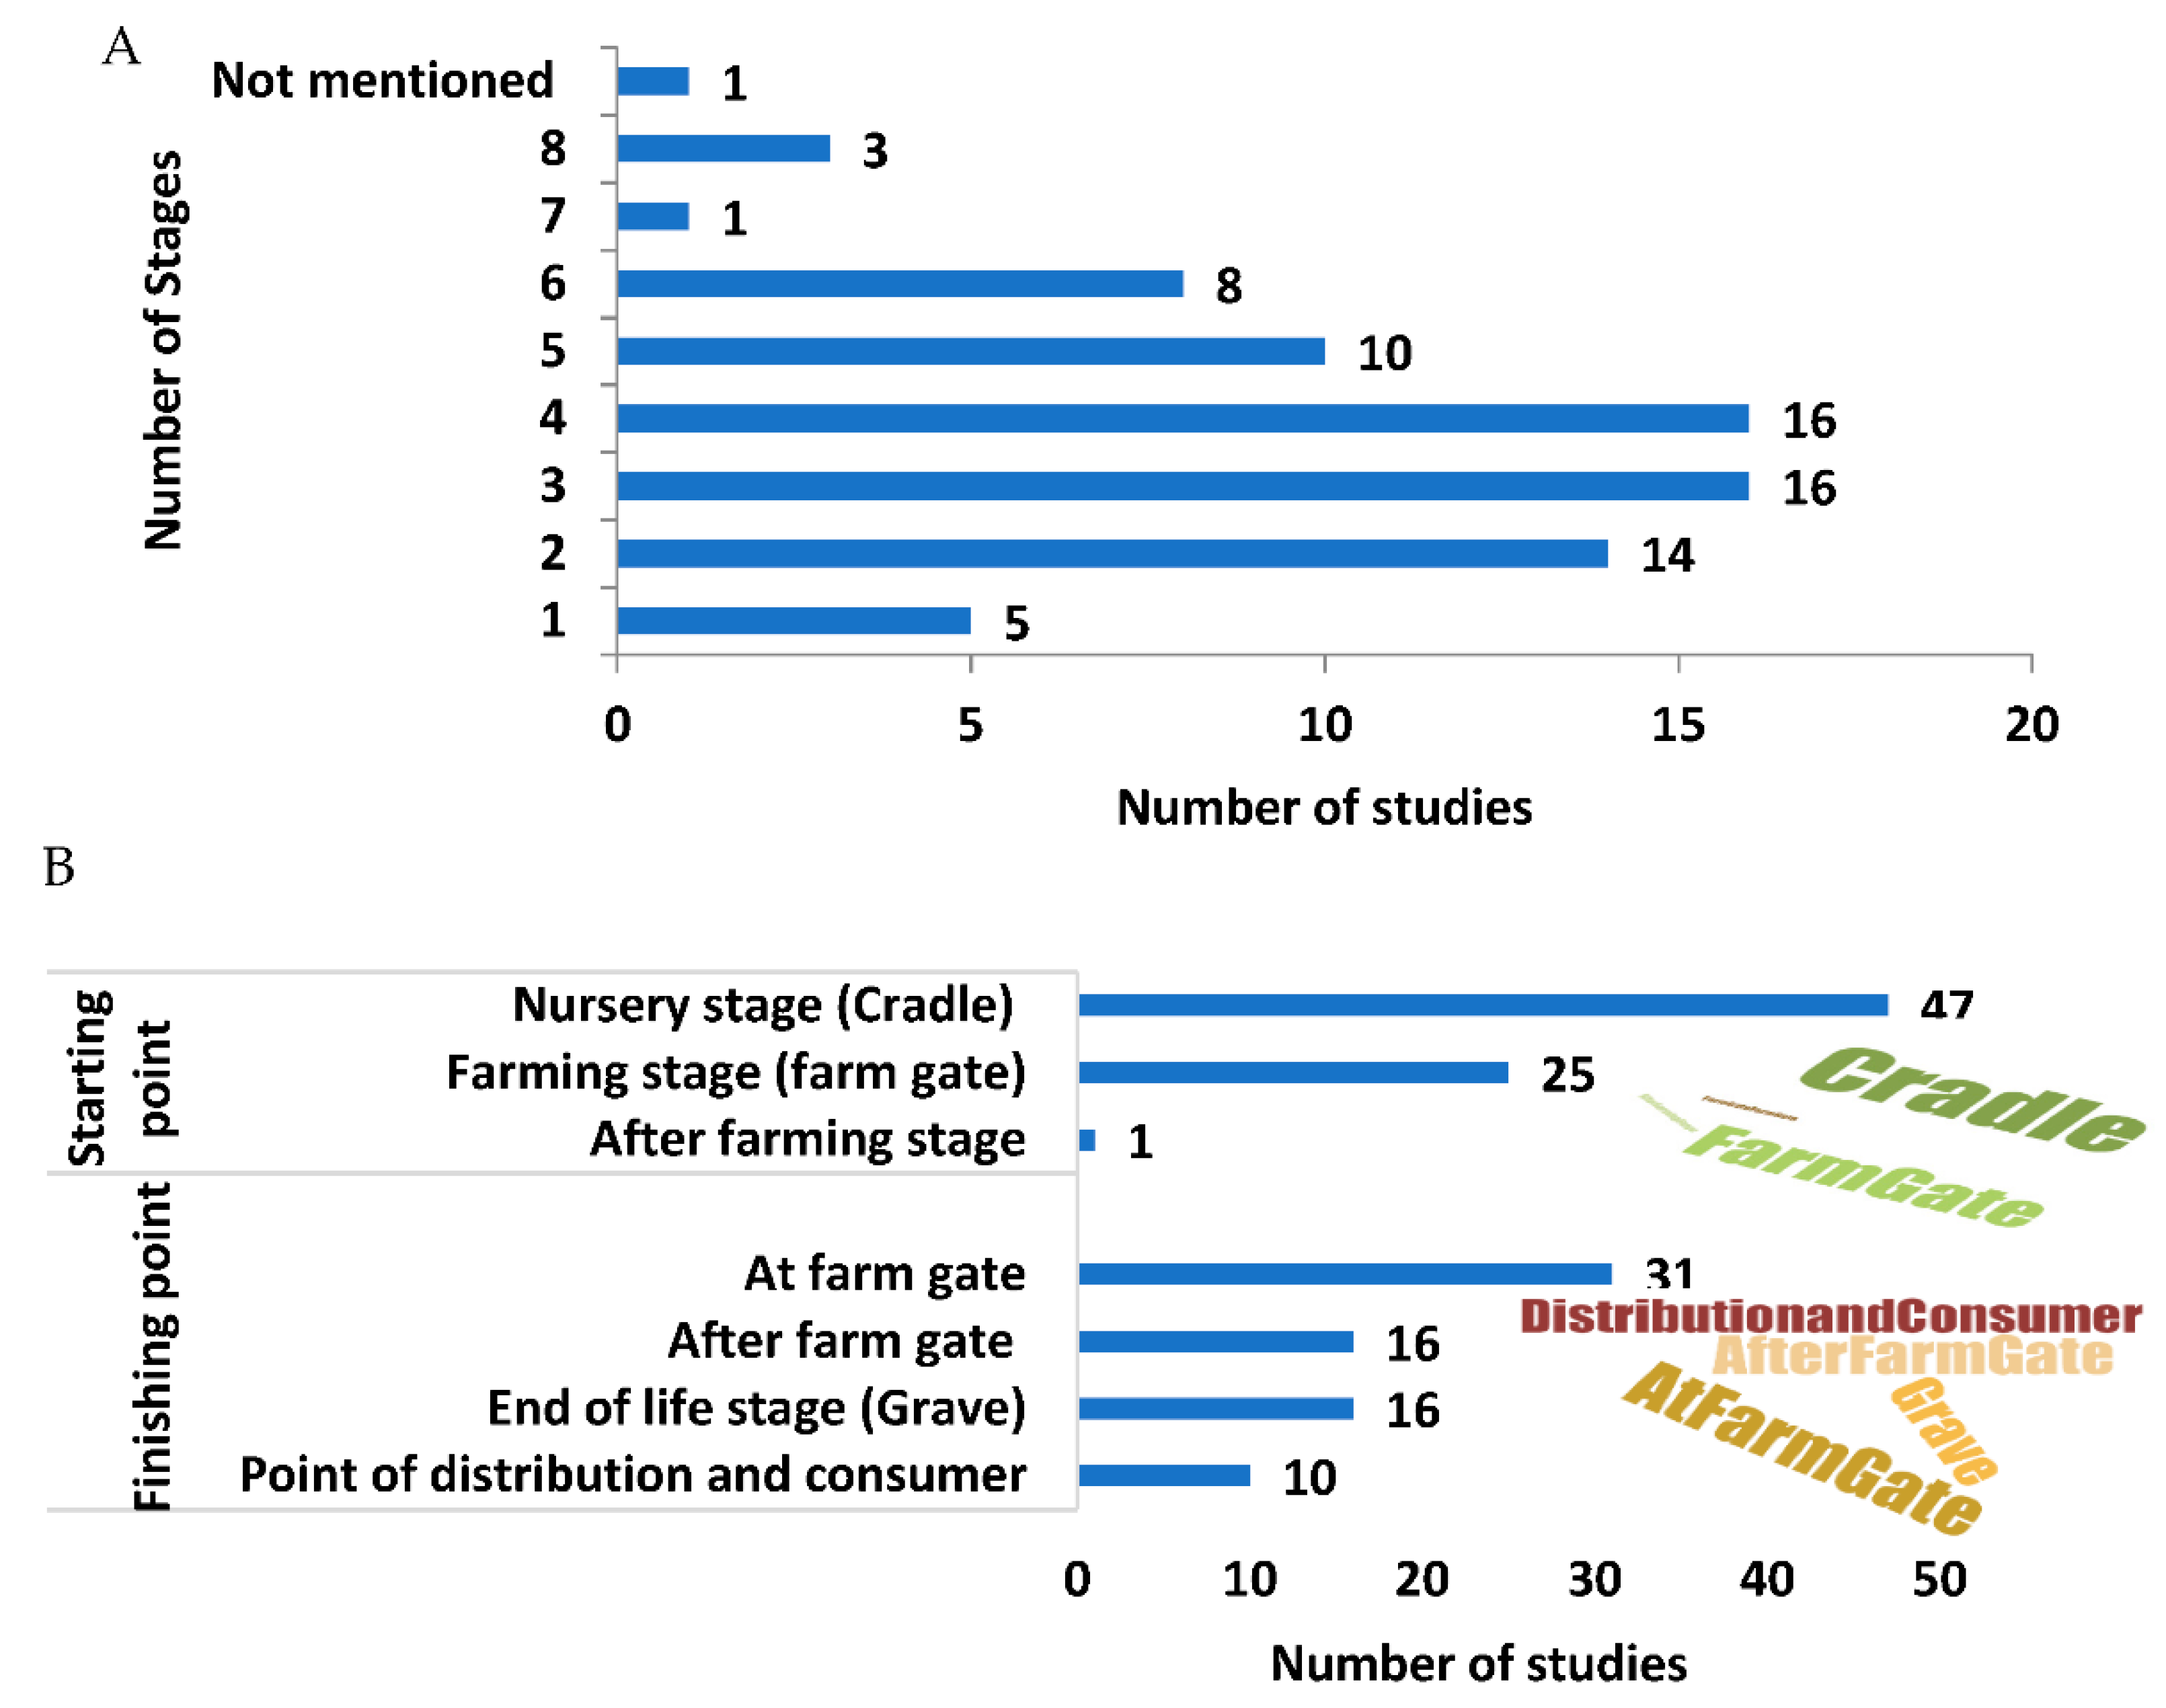
3.2.2. Scope
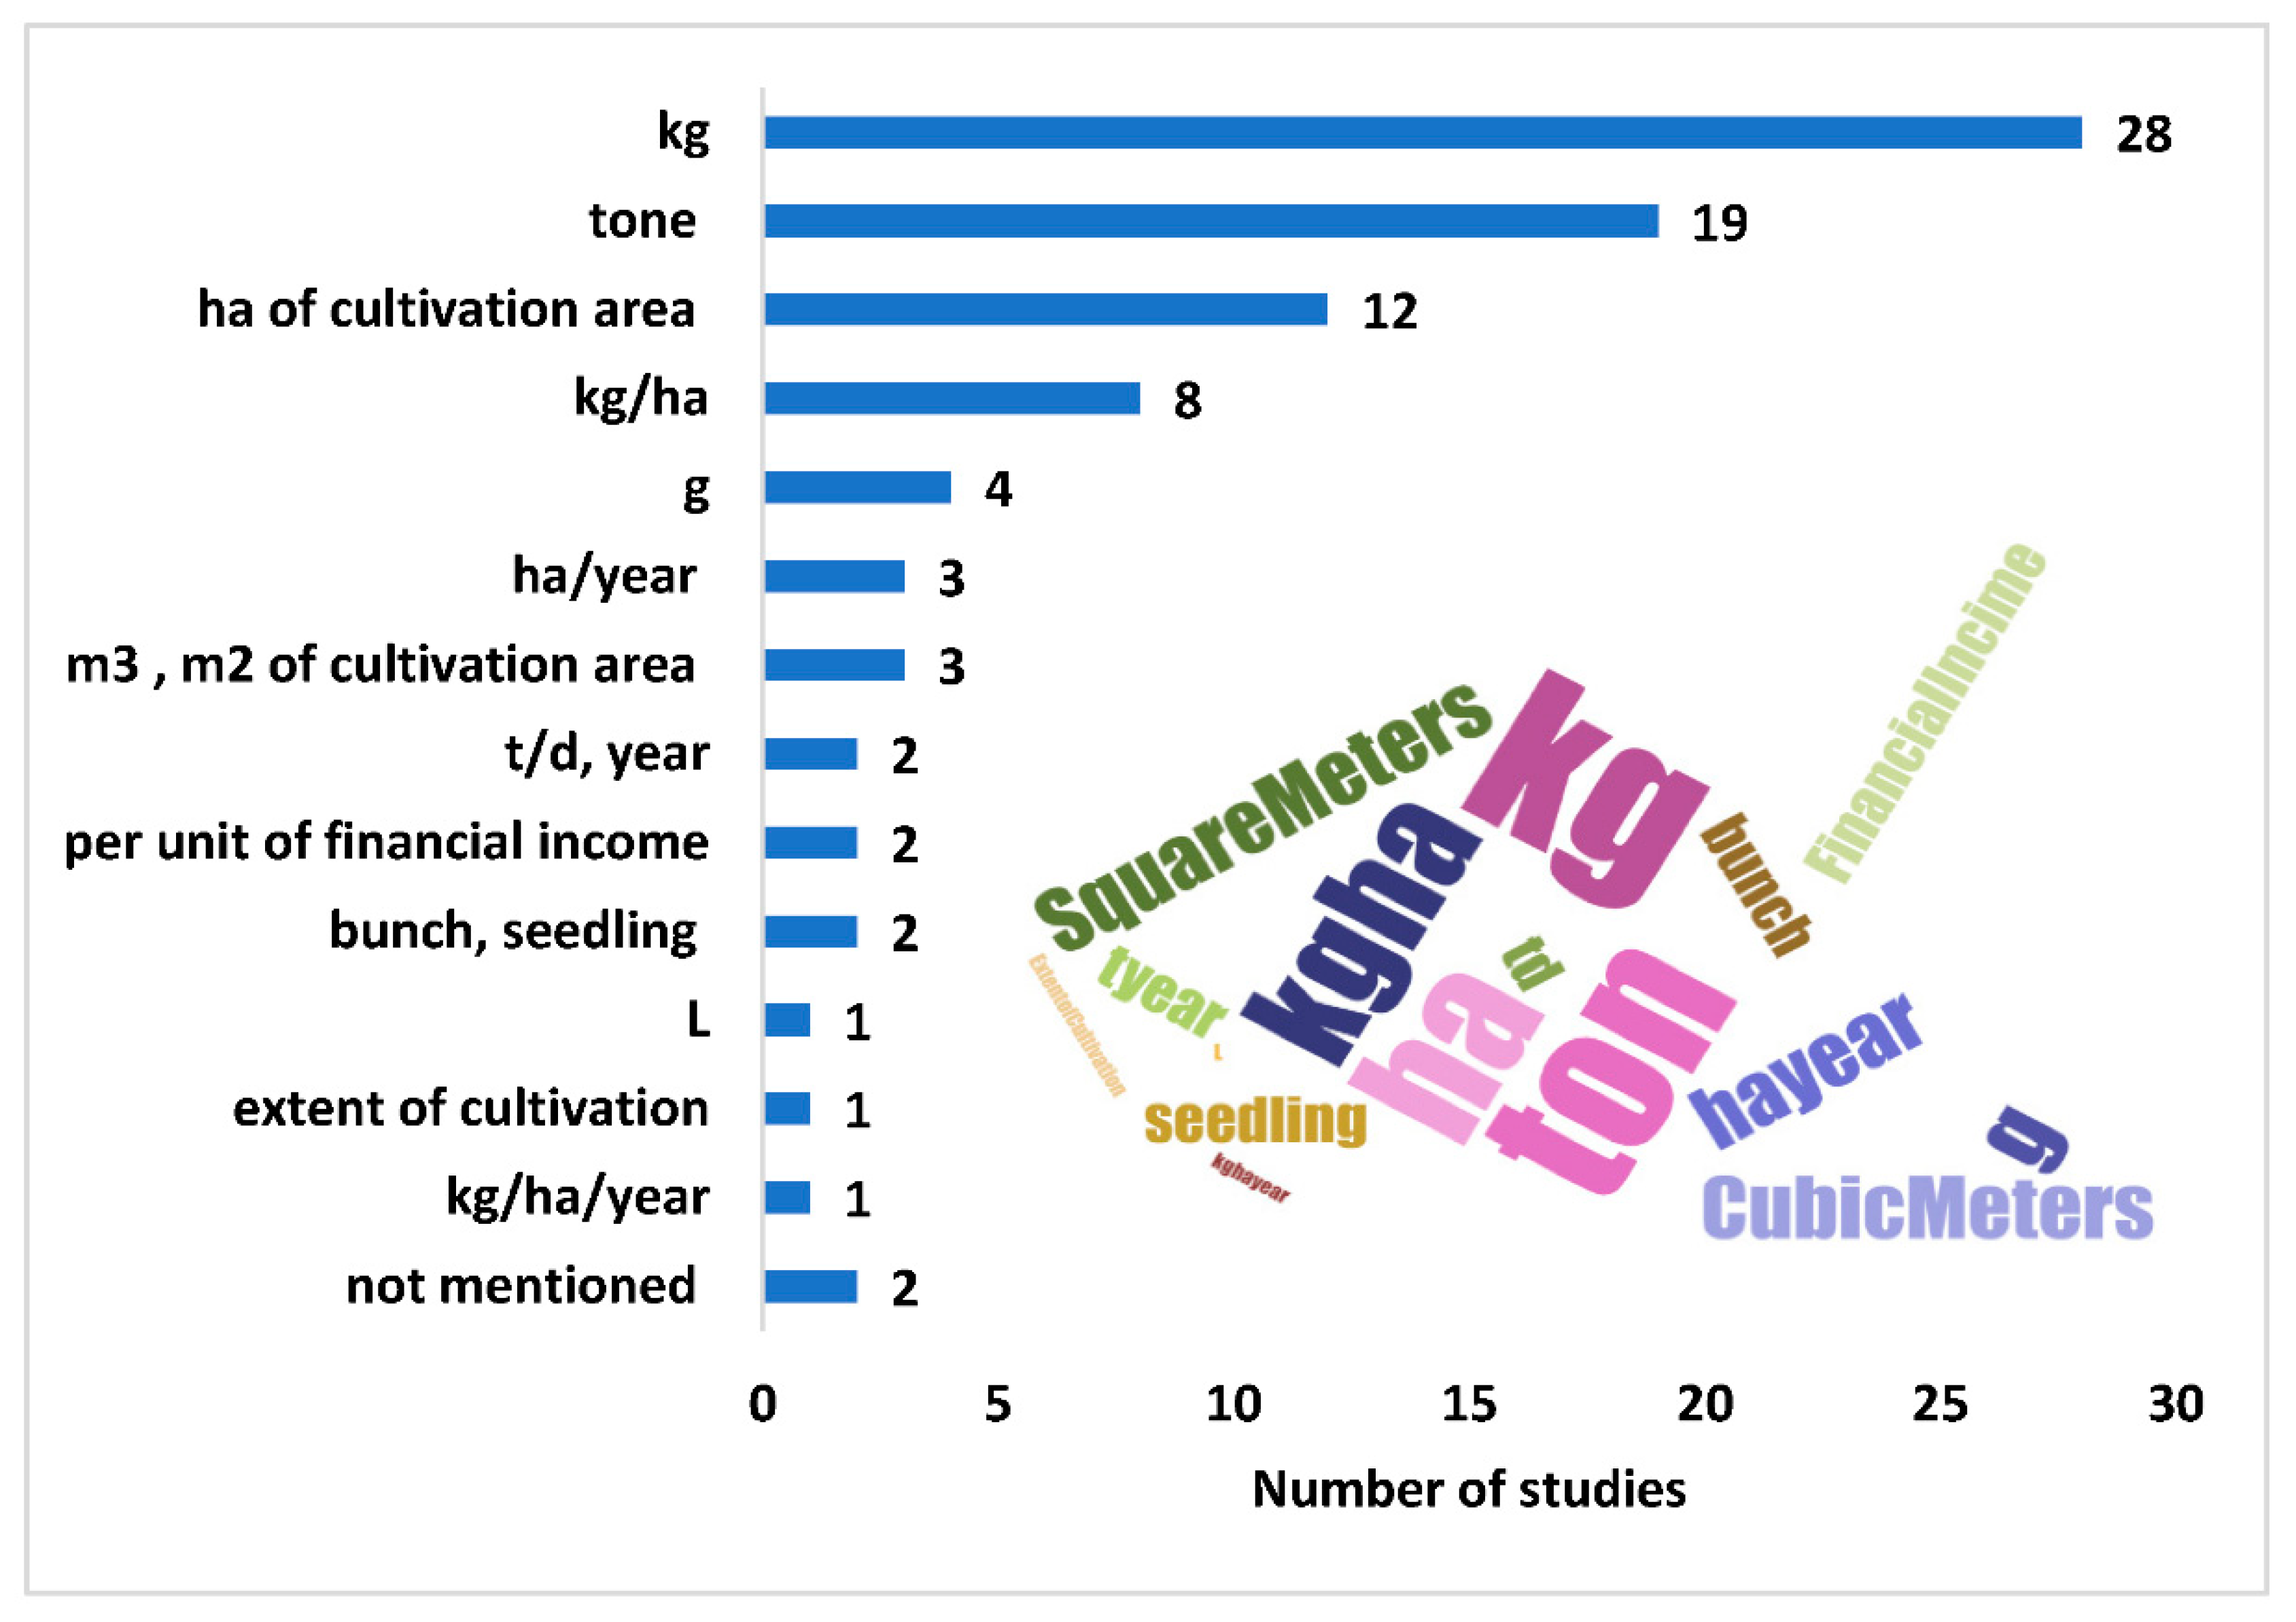
3.2.3. Functional Unit
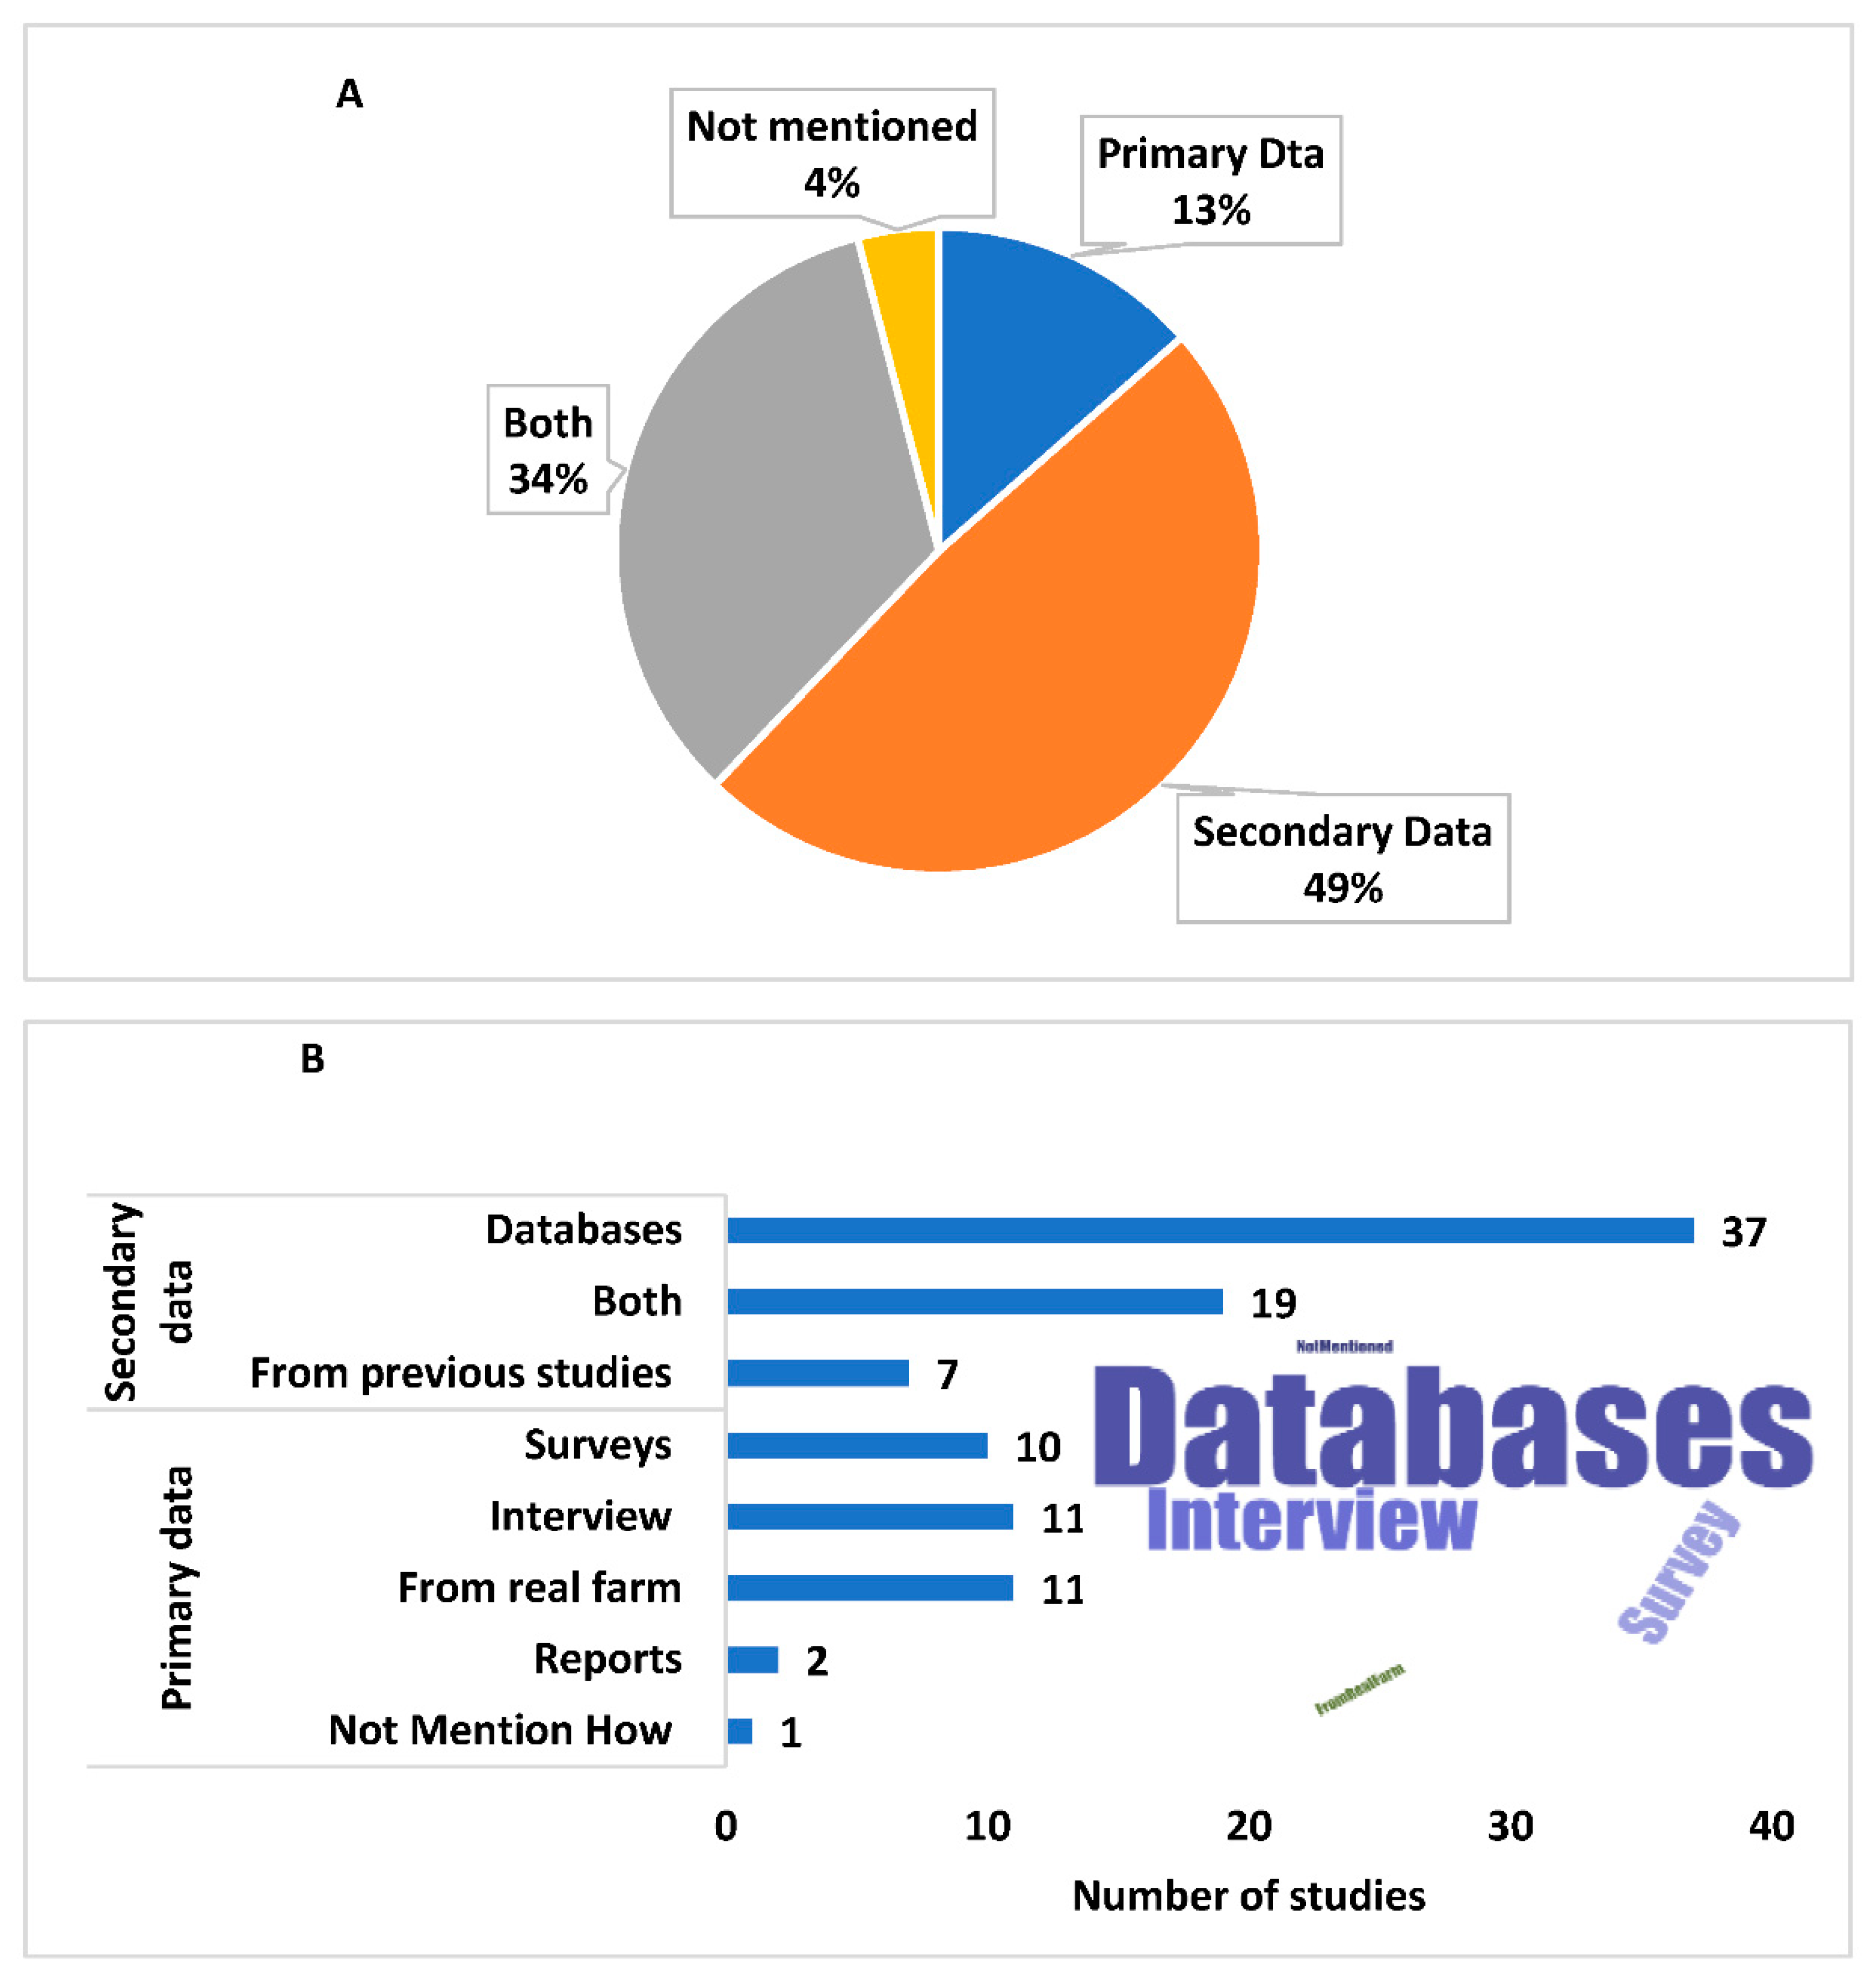
3.2.4. Data Quality Requirement
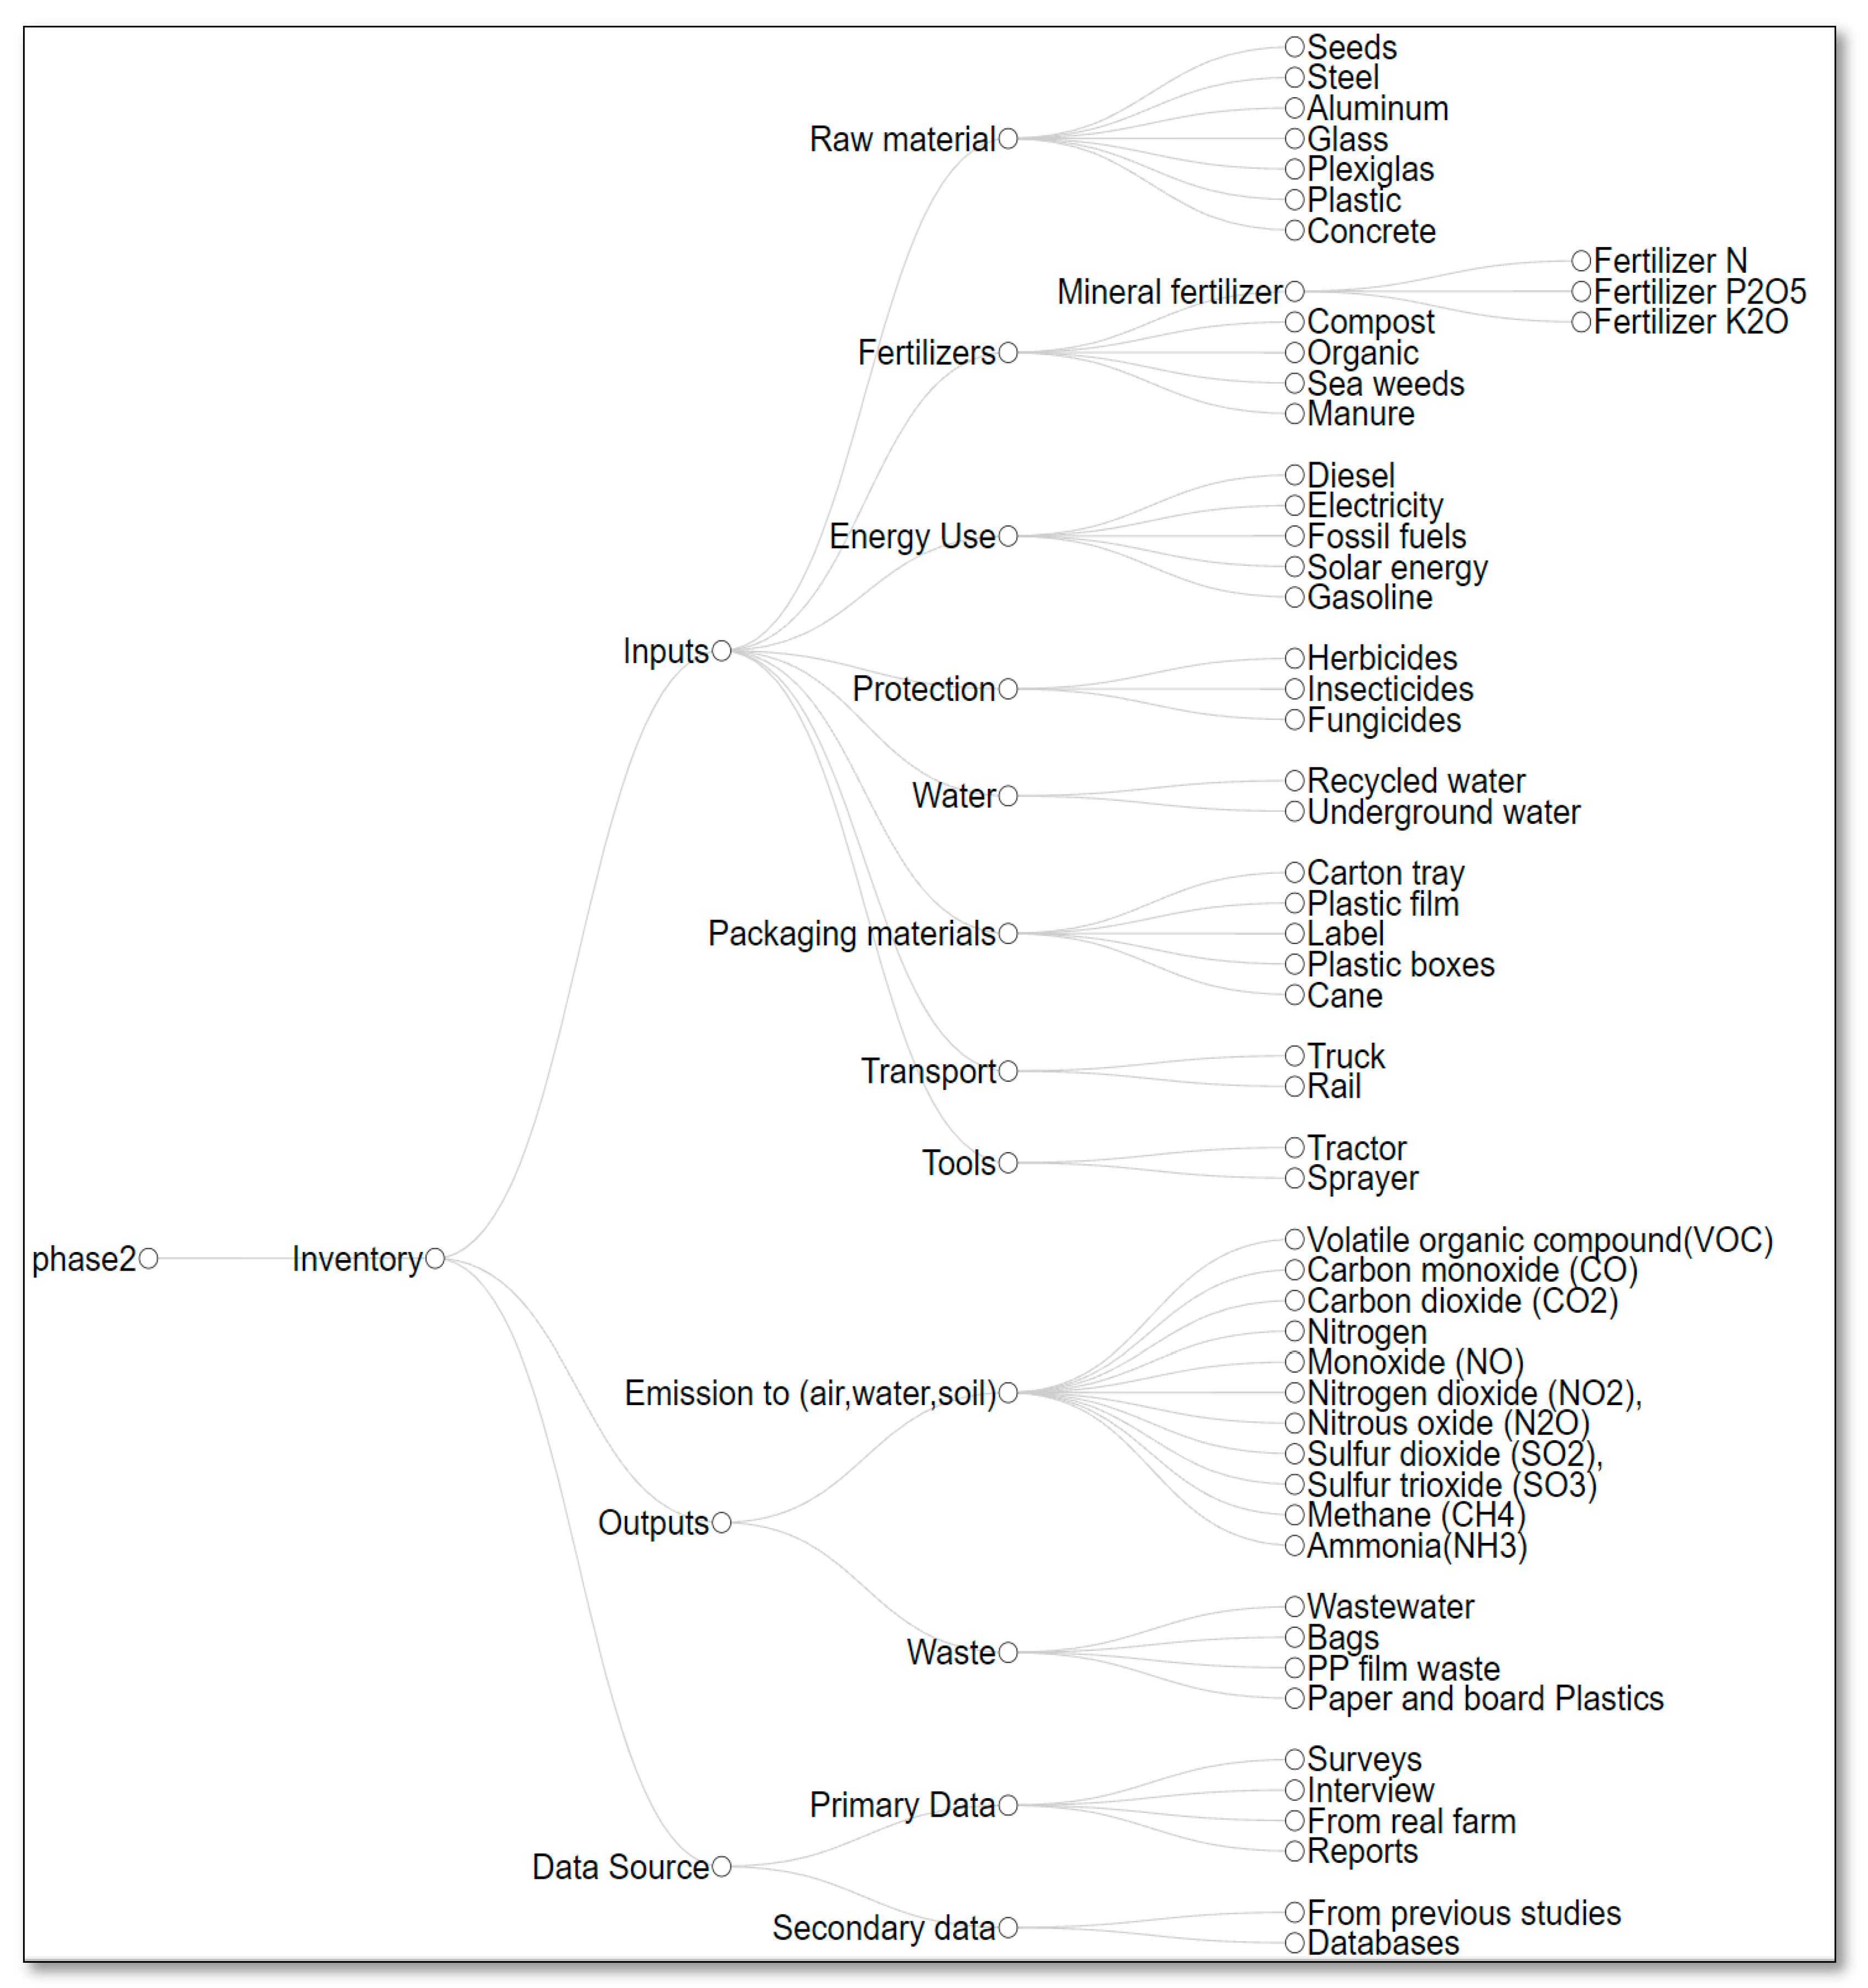
3.3. Phase 2: Life Cycle Inventory
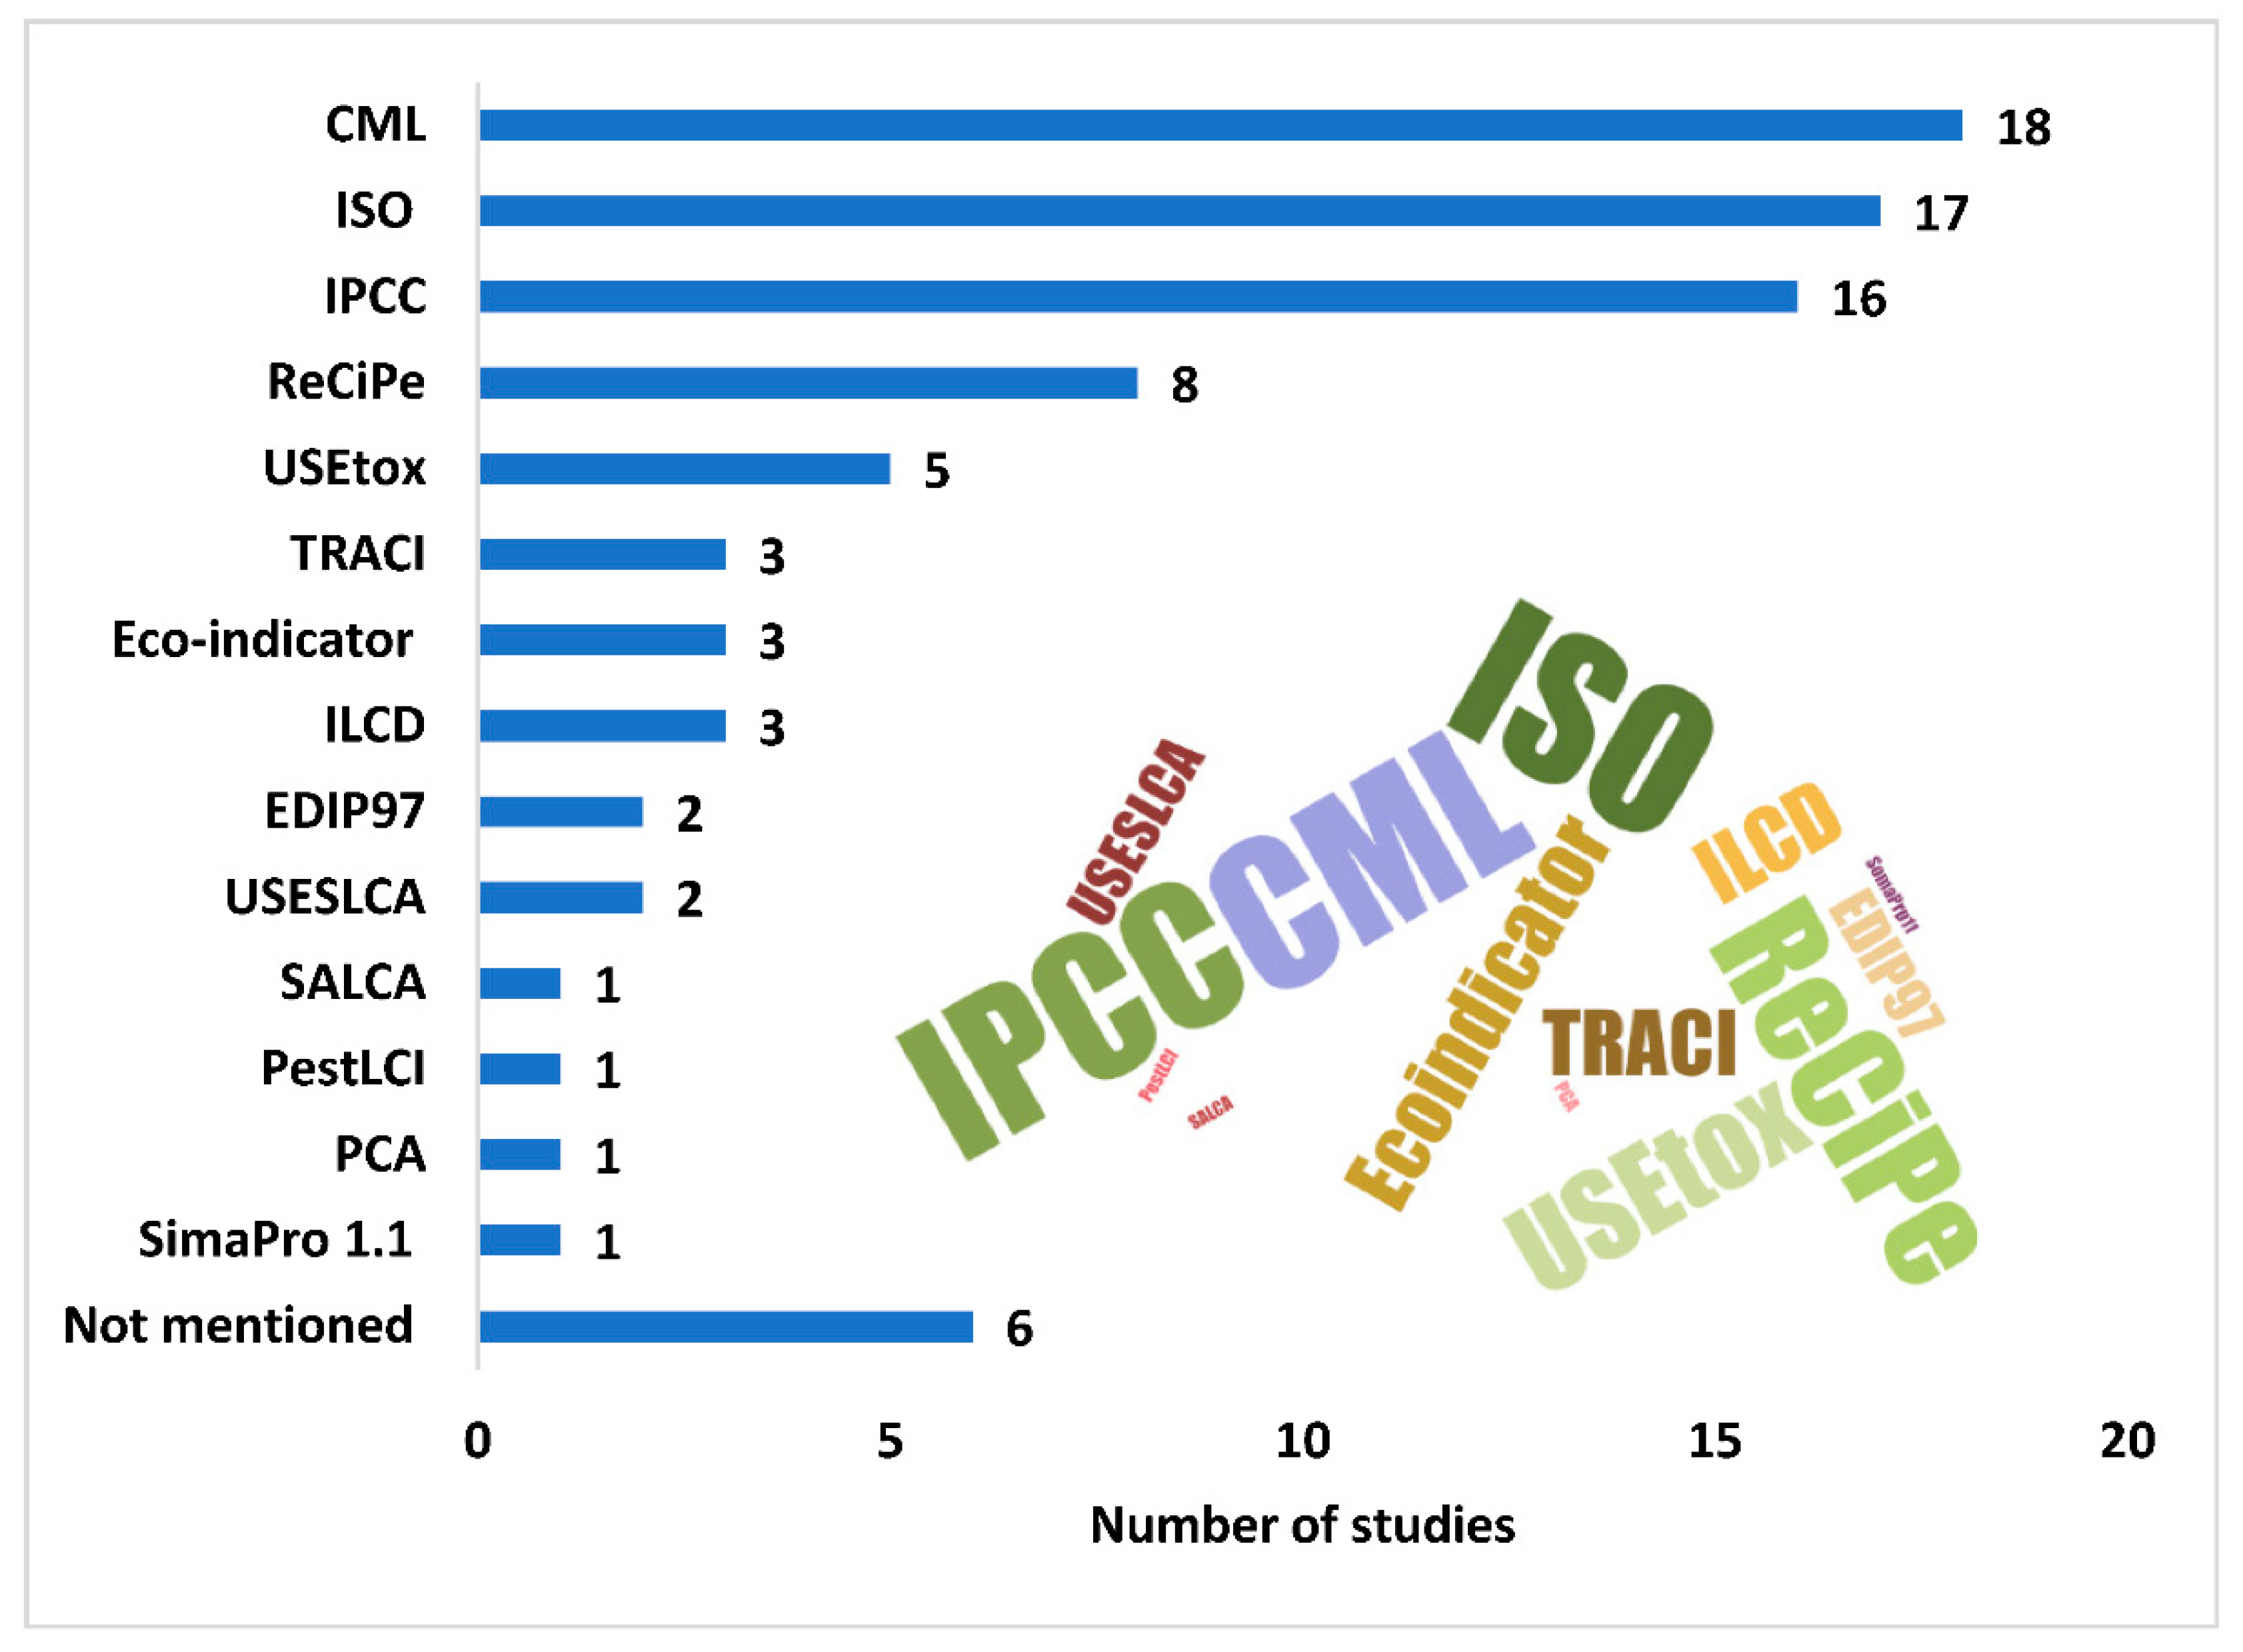
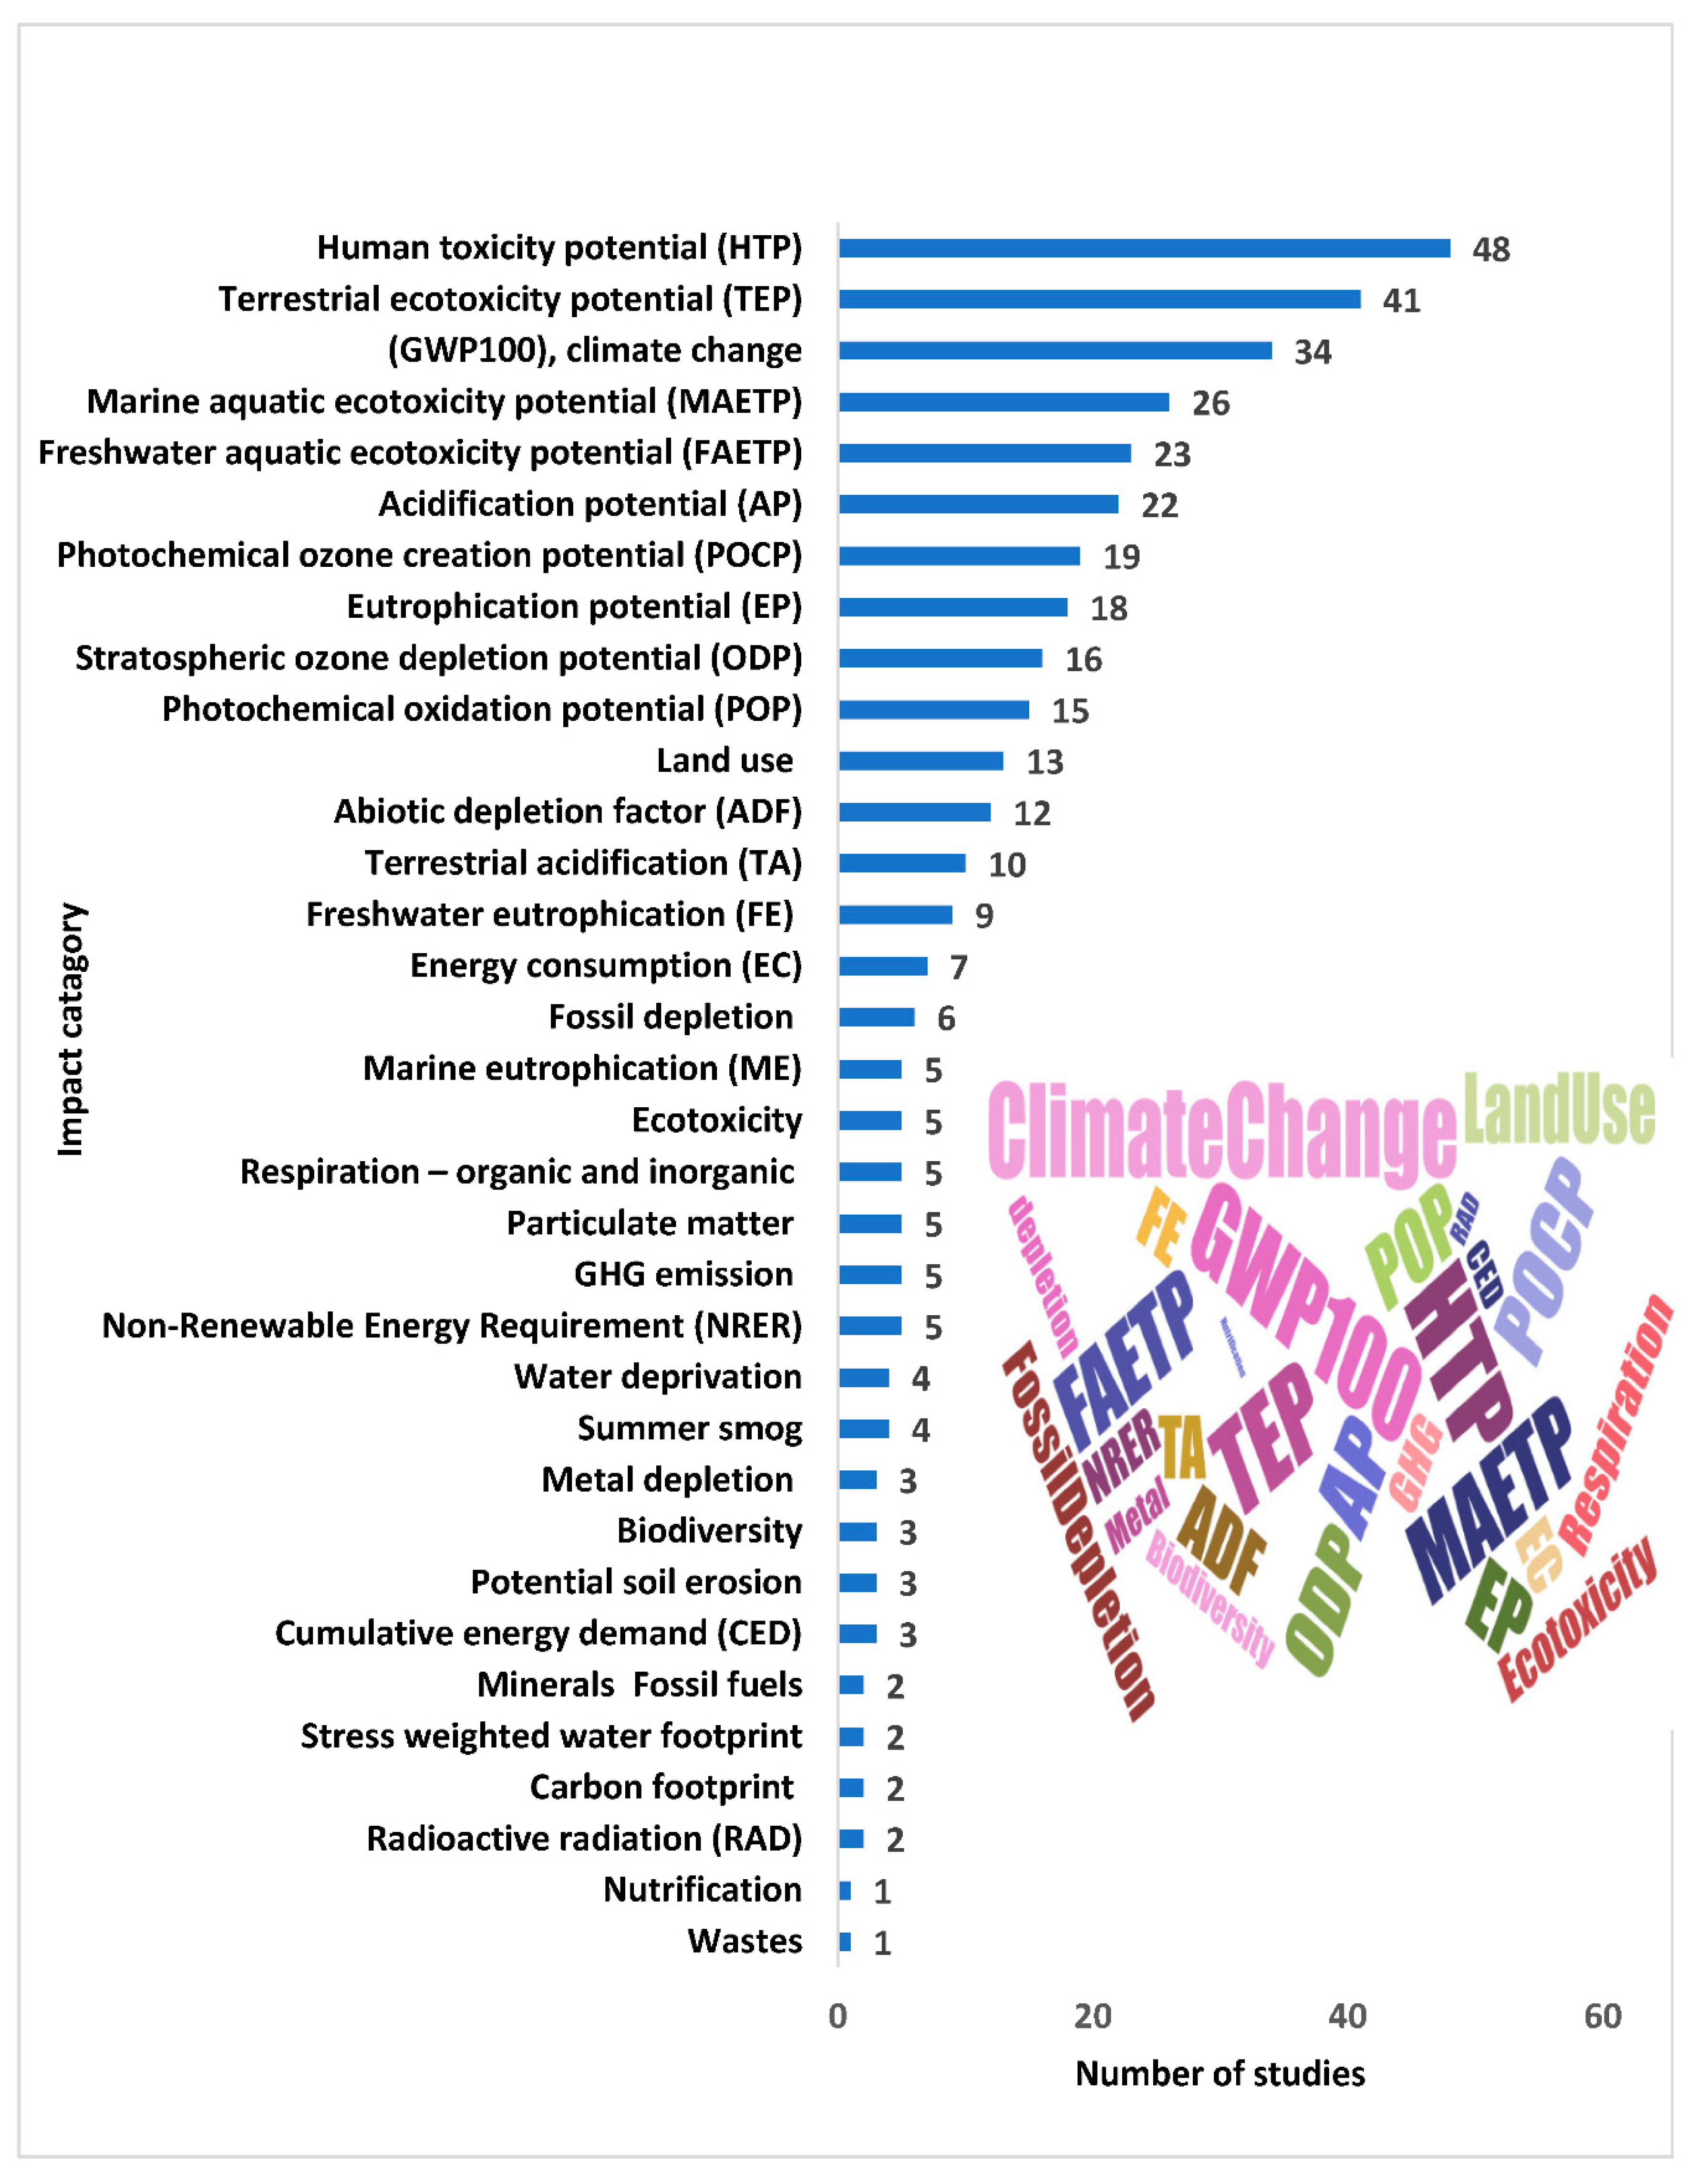
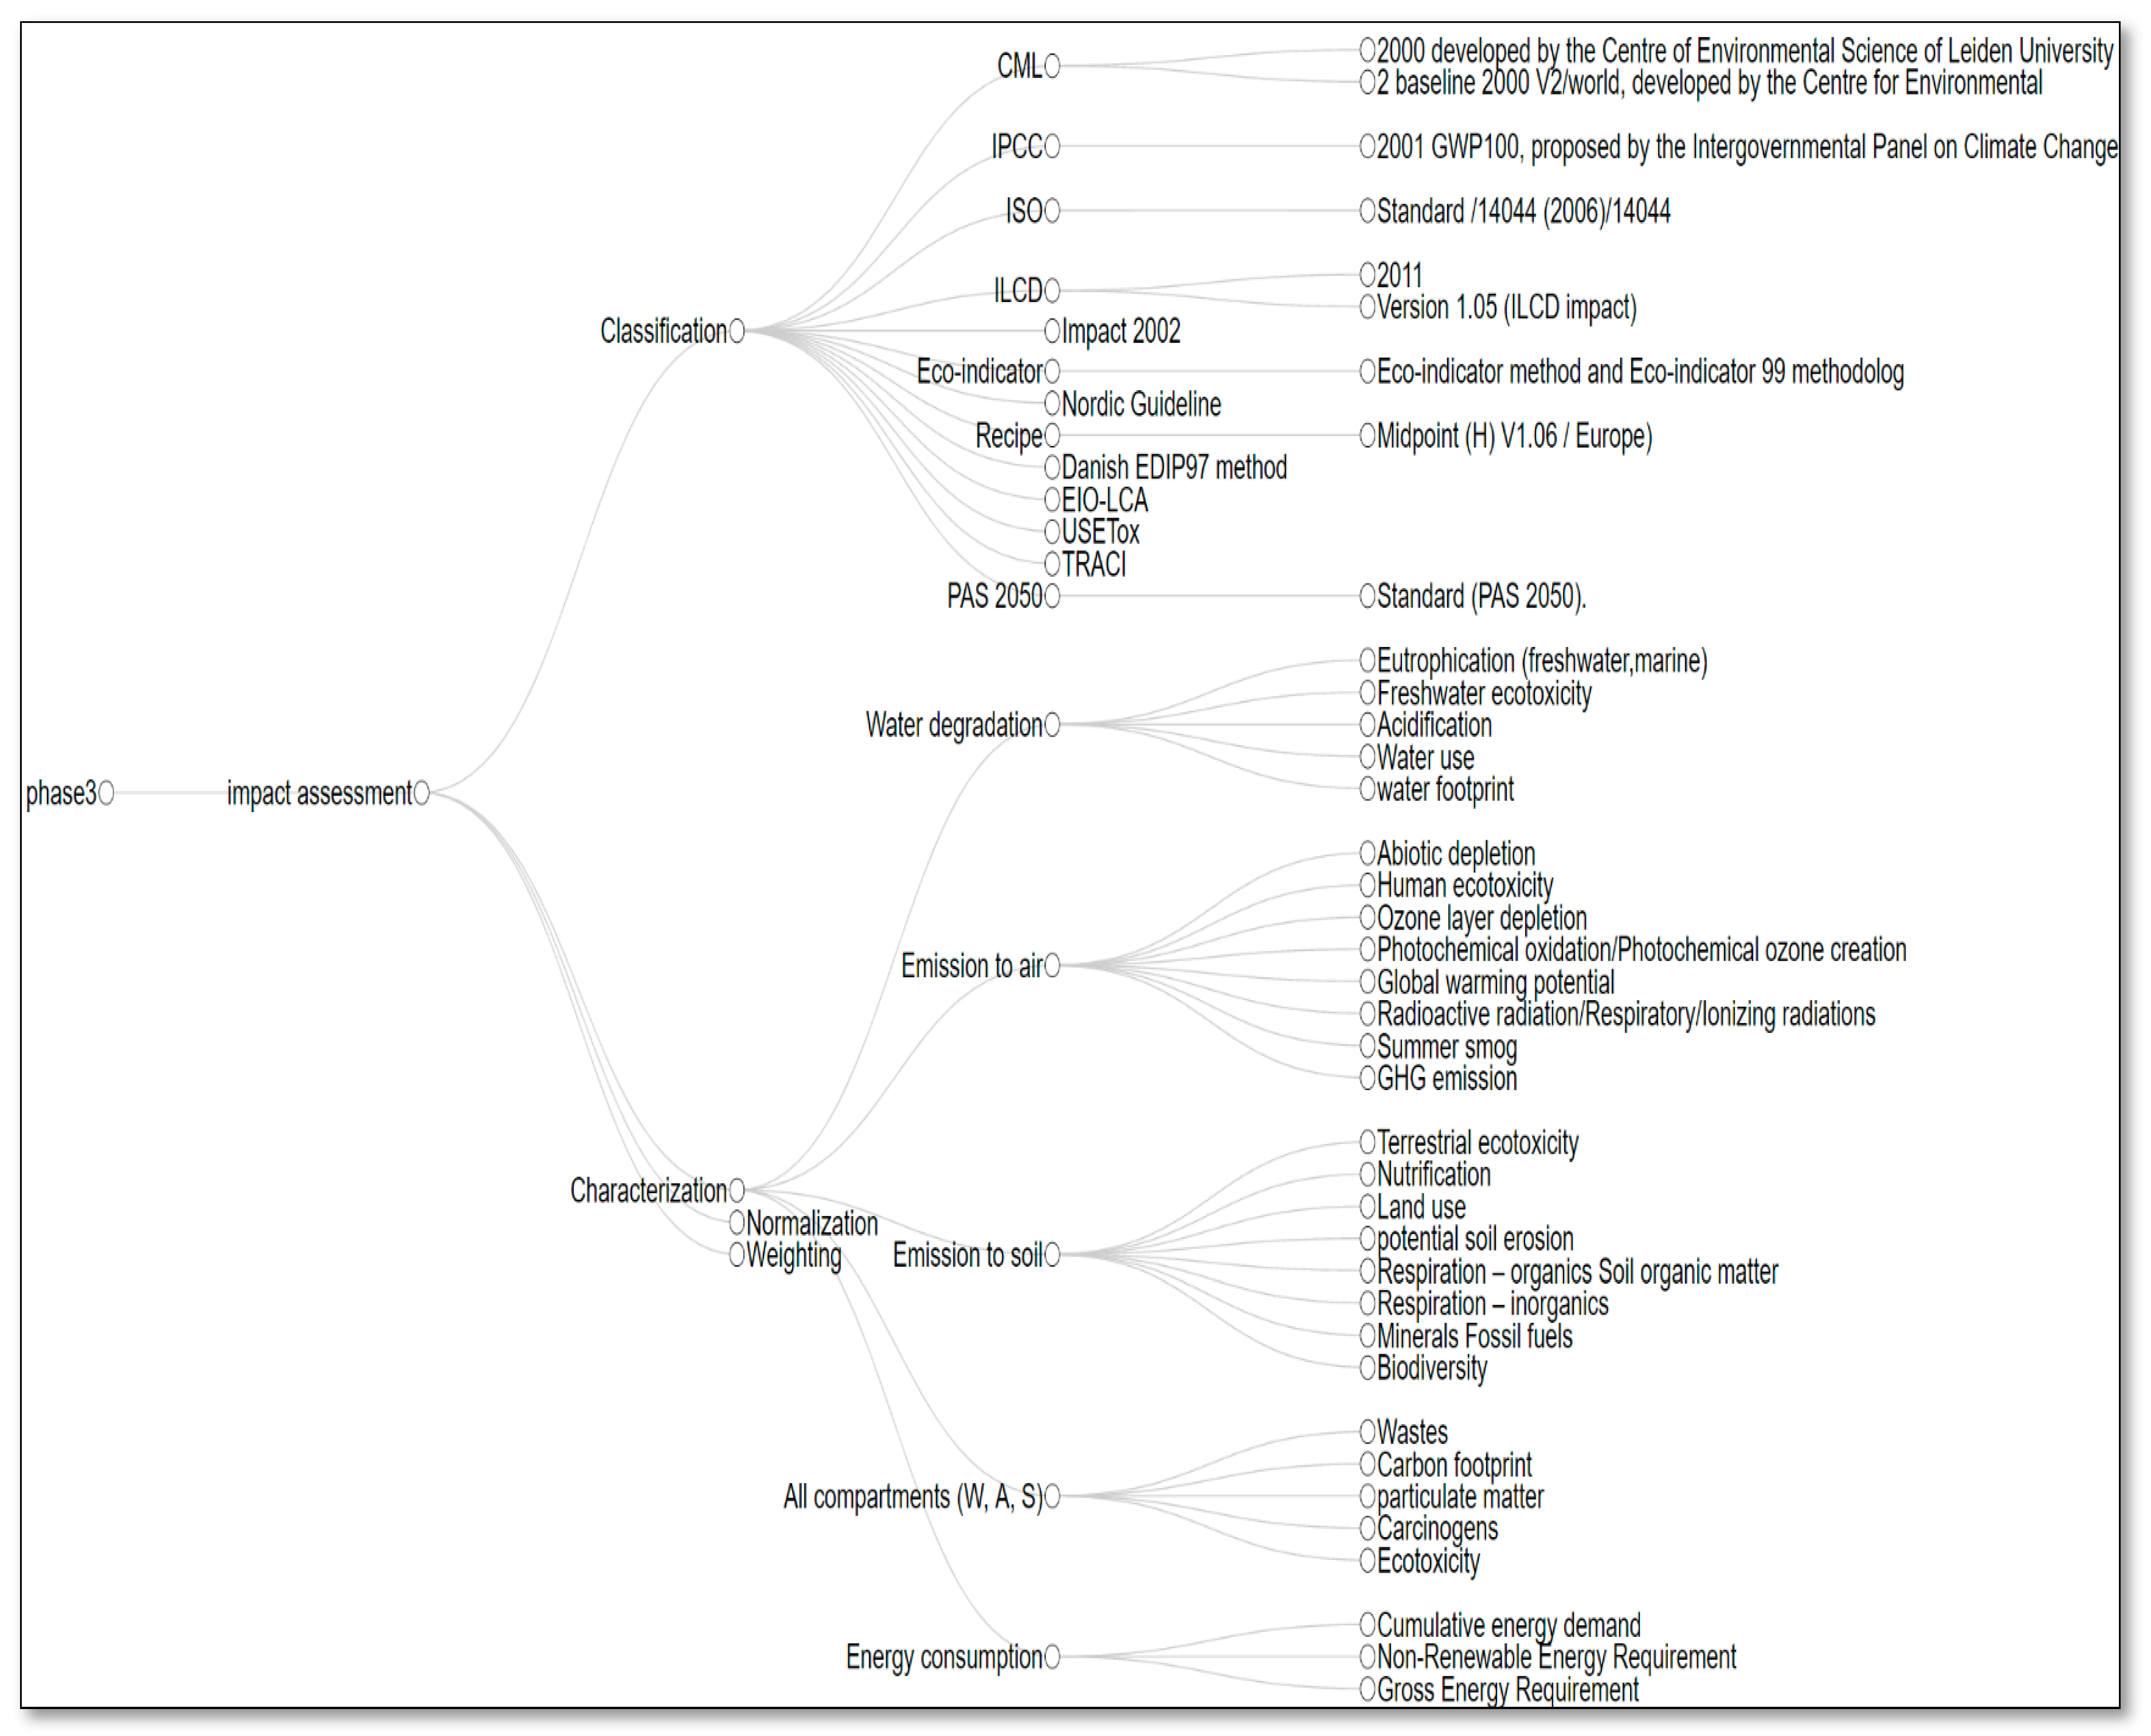
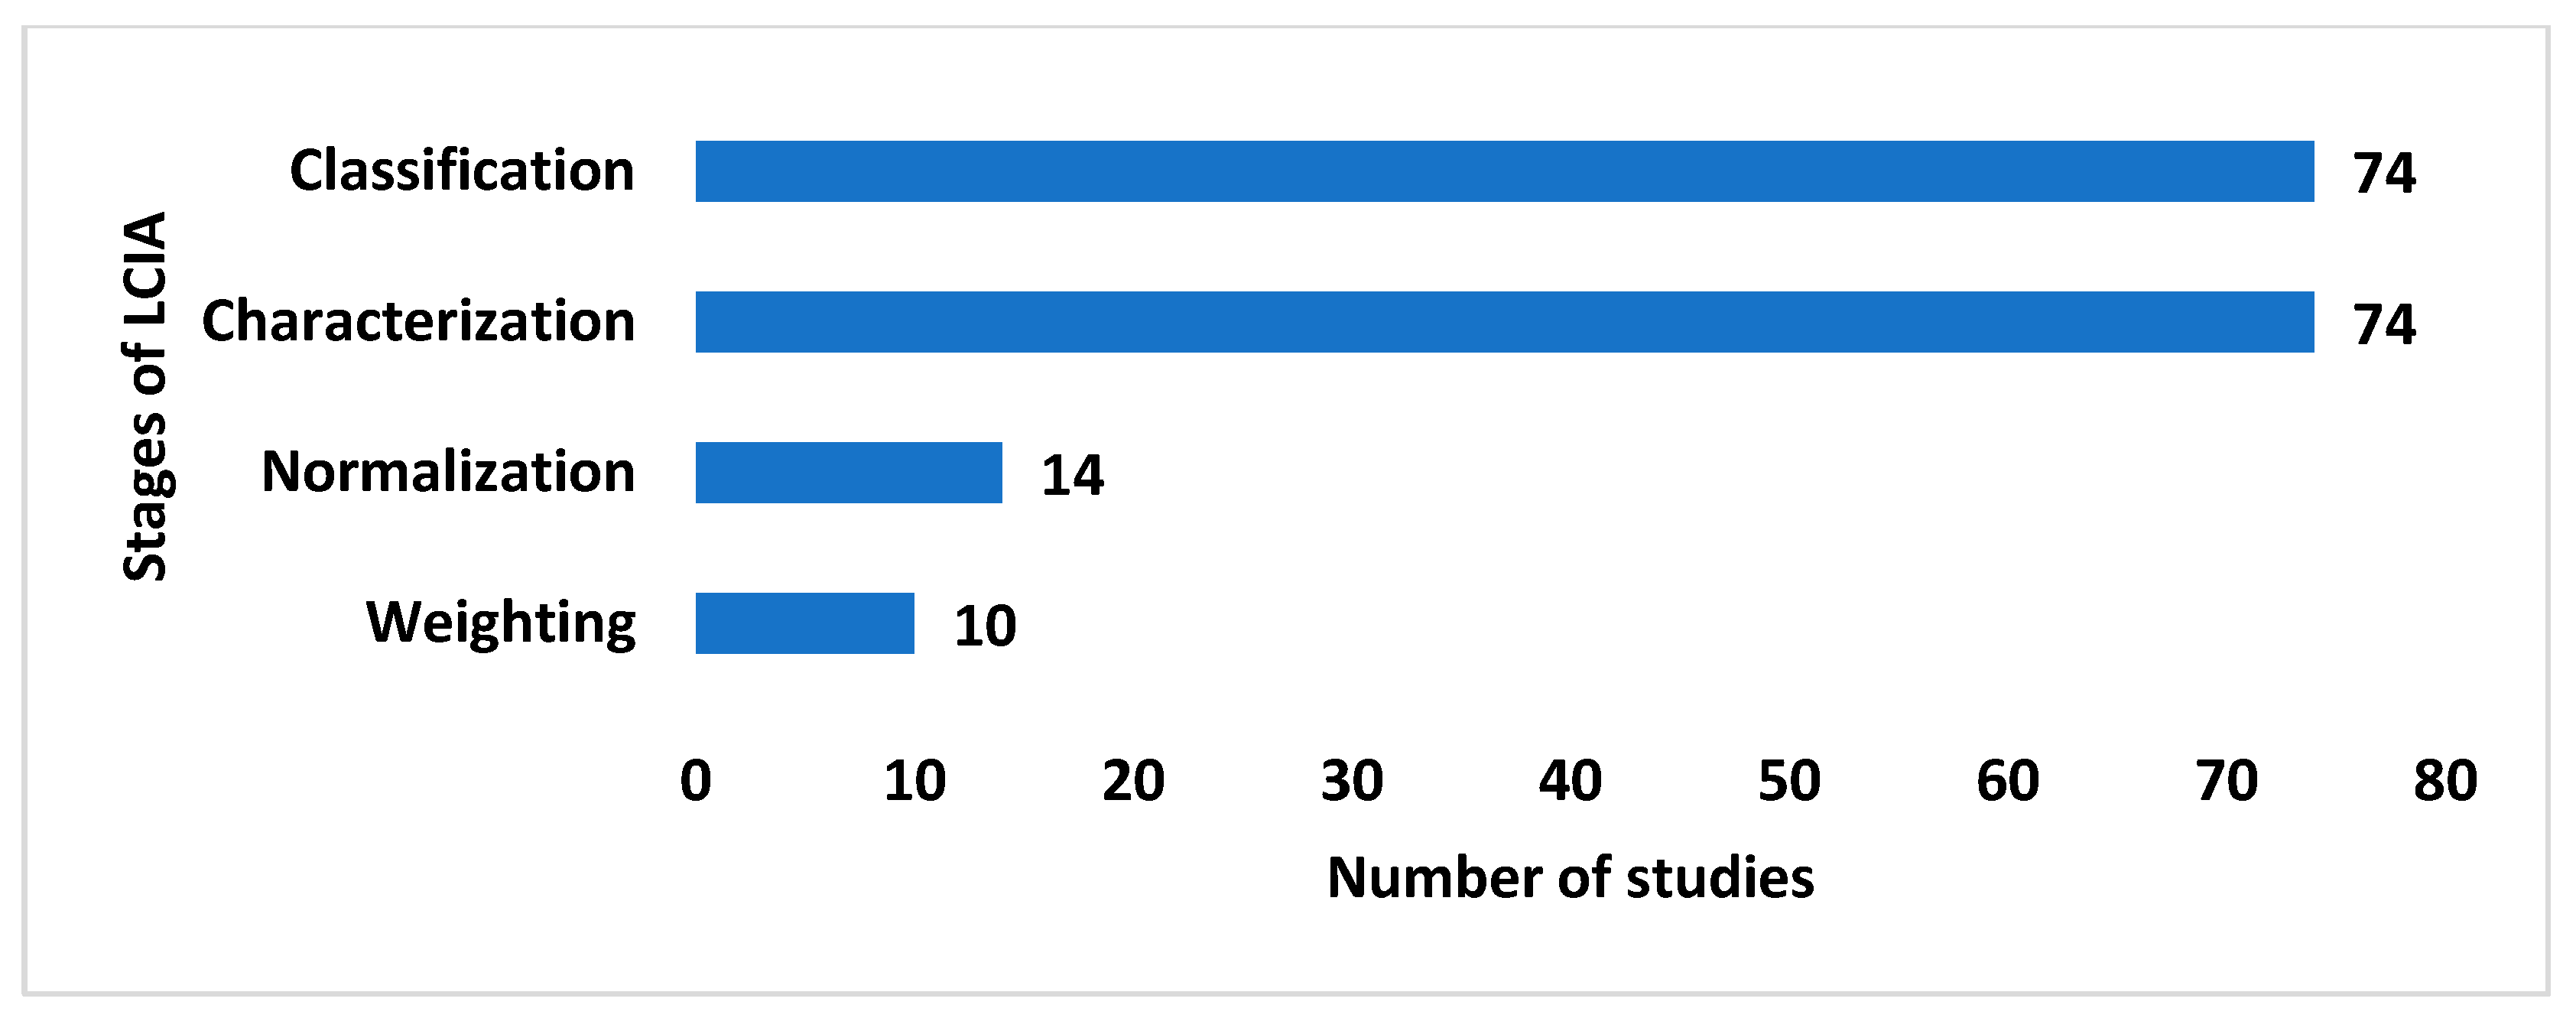
3.4. Phase 3: Life Cycle Impact Assessment
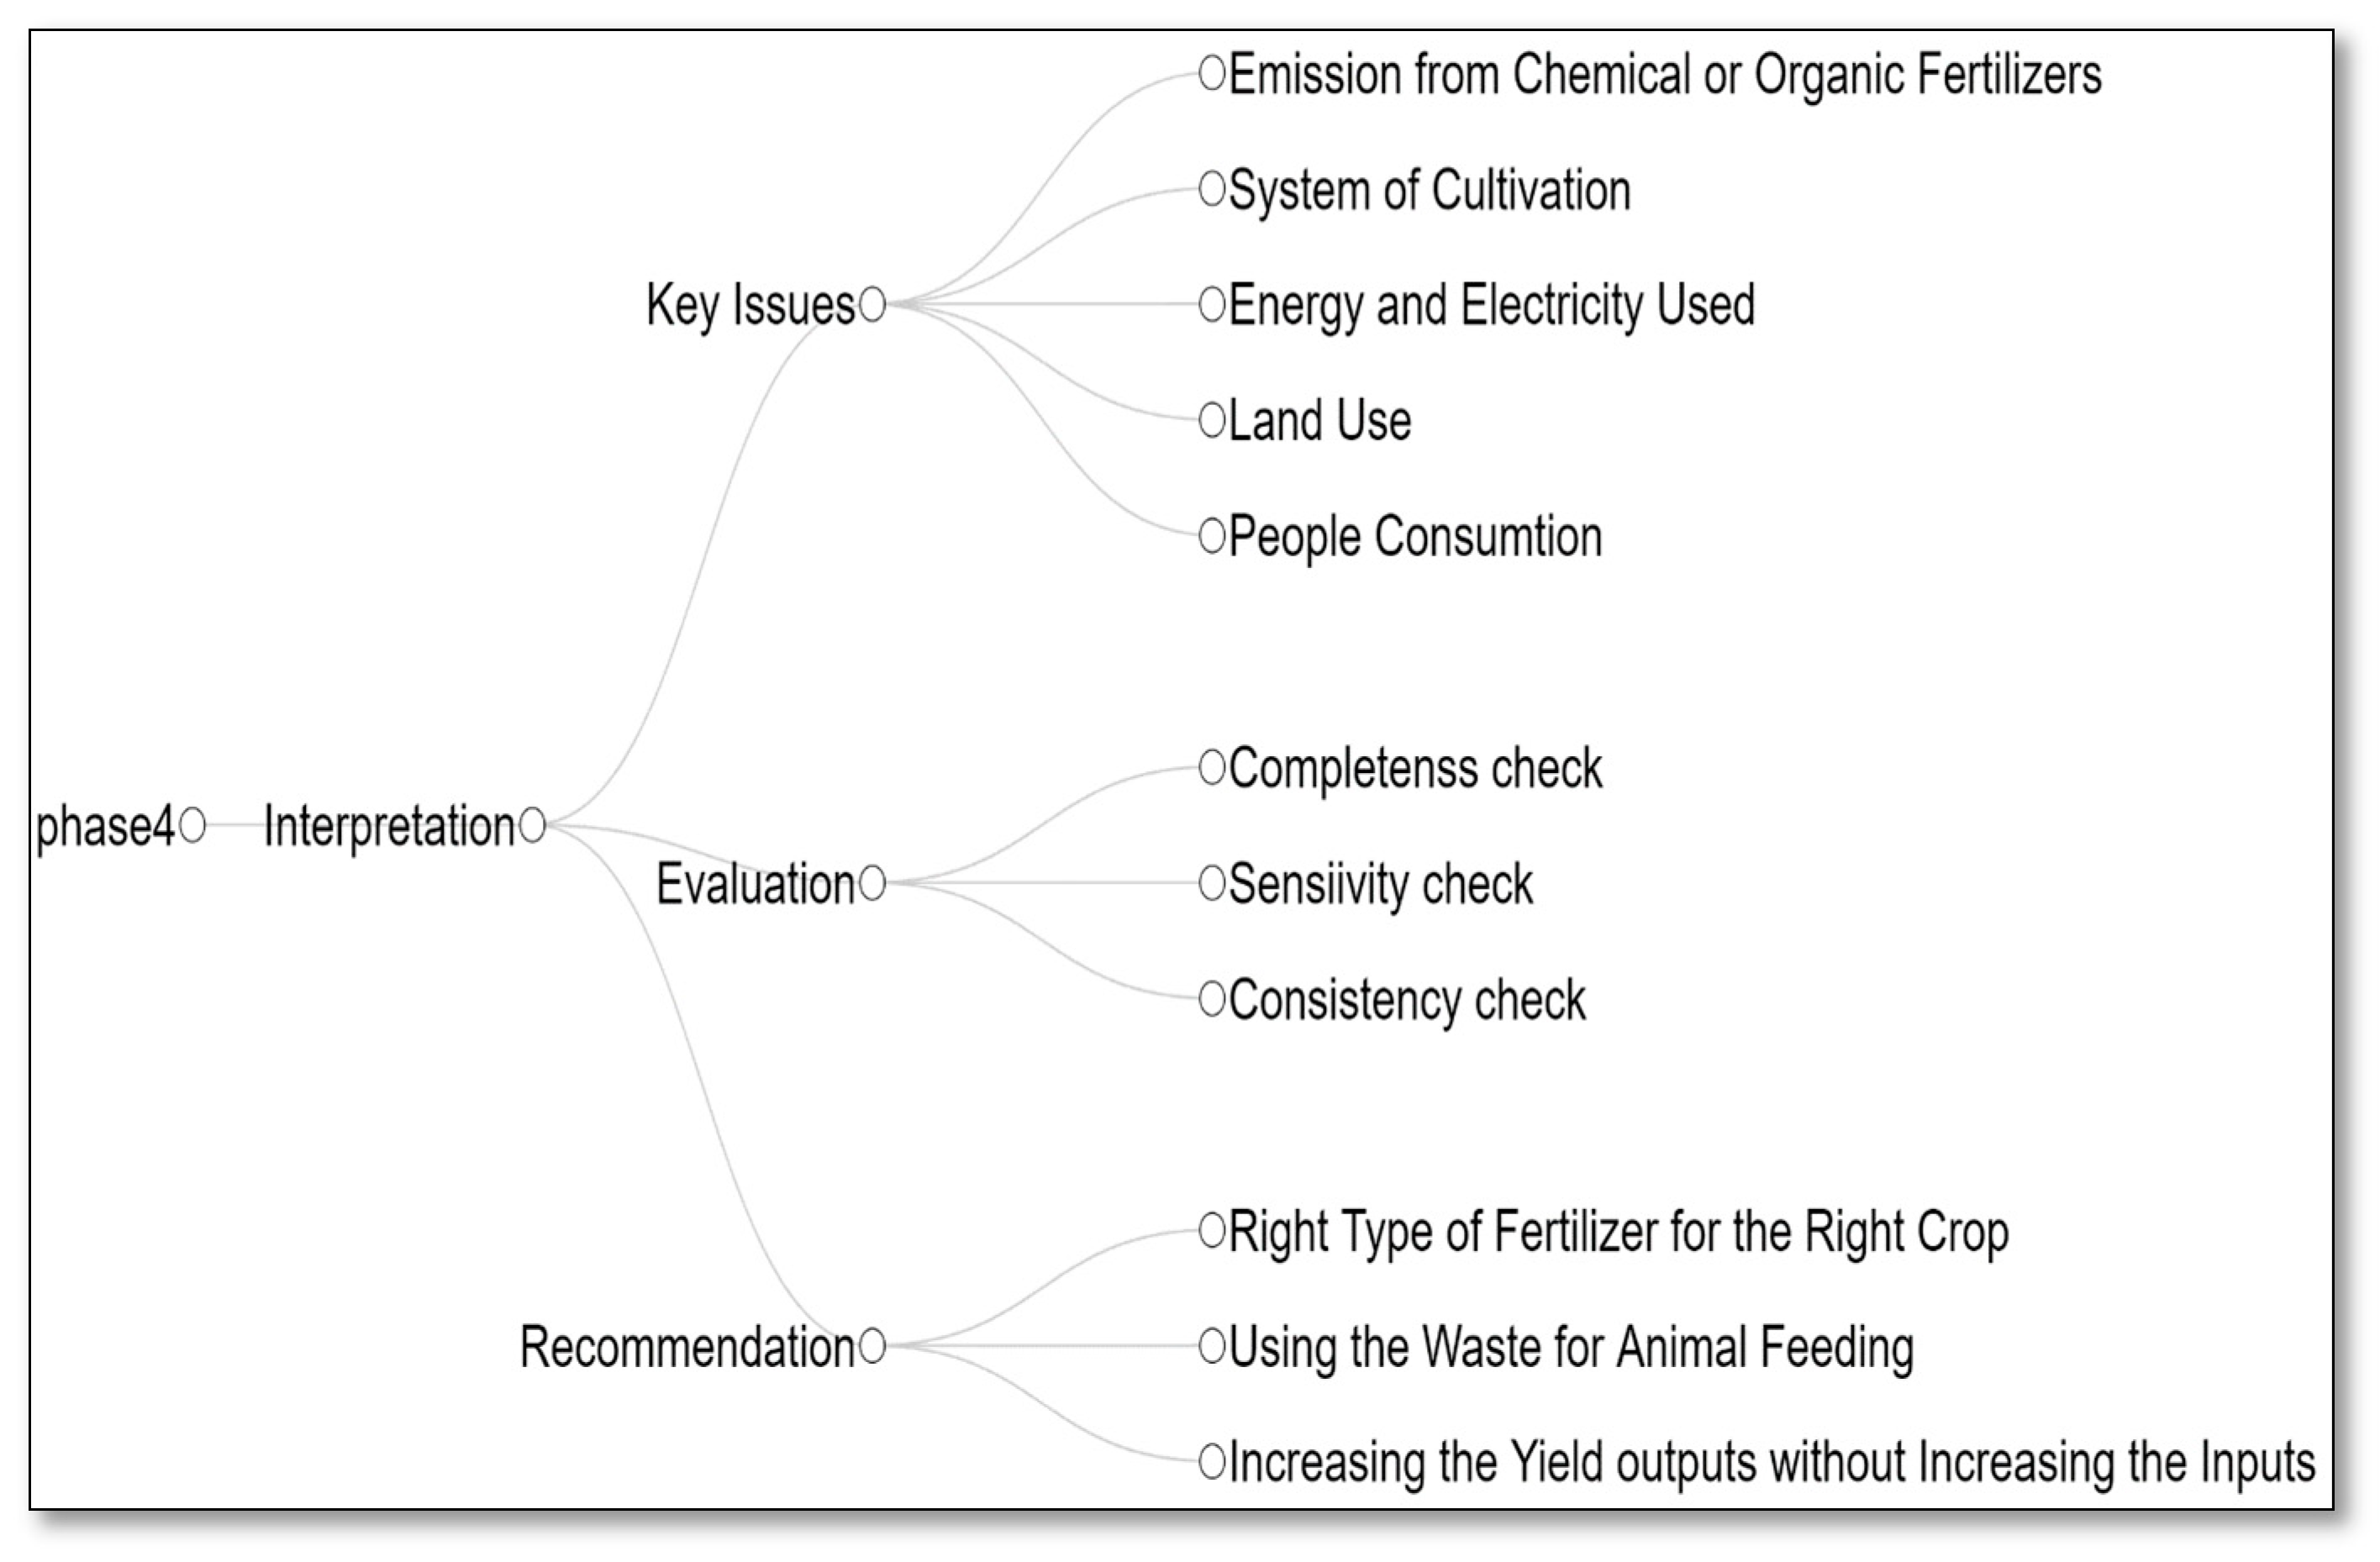
3.5. Phase 4: Life Cycle Interpretation/Recommendation Options
4. Discussion
4.1. Choice of Time, Spatial Domain, and Elementary Flows in LCA
4.2. Impact Assessment
4.3. LCA as a Tool in Environmental Policy Decisions
4.4. Challenges in Collecting the Information and Limitations
4.5. Assumptions Used, Benefits, and Recommendations
4.6. Research Gaps
Funding
Institutional Review Board Statement
Informed Consent Statement
Data Availability Statement
Conflicts of Interest
Appendix A

| Aim | Type of Aim | Studies |
|---|---|---|
| Evaluate the impact of all or most stages of FSC | Descriptive | [12,38,42,43,44,45,46,47,48,49,50,51,52,53,54,55,56,57,58,59,60,61,62,63,64,65,66,67,68,69] |
| Determine environmental differences of different cultivation options | Comparative | [24,36,39,70,71,72,73,74,75,76,77] |
| Estimate the impact of energy consumption | Descriptive | [42,43,48,50,78,79,80] |
| Investigate the impact of different fertilization rates and type | Comparative | [34,70,81,82,83,84] |
| Quantify impacts associated during cultivation cycle of a crop using life cycle analysis | Descriptive | [32,85,86,87,88] |
| Investigate the impact of different pesticide rates and type | Comparative | [28,89,90,91,92] |
| Evaluate the suitability of LCA | Descriptive | [34,93,94] |
| Compare the energy and GHG of regional and national scale | Comparative | [40,95,96] |
| Compare the impact of the cultivation of different crops | Comparative | [97,98,99] |
| Provide datasets on several agricultural products | Descriptive | [47,100] |
| Compare two different methods | Comparative | [101,102,103] |
| # | Reference | Data Source | Practice | Input | Unit | Output | Unit |
|---|---|---|---|---|---|---|---|
| 1 | [42] | Primary data Not mentioned how | Field preparation Seeding Post seeding weed control Creation of irrigation ditches Irrigation Irrigation Supporting with reeds Fertilization Plant protection Harvest Life cycle inventory data (per 1 t of beans produced) and (per 1 ha cultivated) | Diesel Seeds Manure Water (electricity) Herbicides, insecticides, fungicides N fertilizer, P2O5, K2O Manure cattle, sheep Seaweeds Land occupation | 60 kw tractor 60 kw tractor kg kg ton ton m2/year | Emissions to air, water, and soil) harvested beans | kg |
| 2 | [43] | Primary data (real farm) Secondary data (previous studies) | Cultivation and crop Orange transport Selection and washing Primary extraction | Fertilizers: N, P2O5, K2O Water Diesel HDPE bins Electric energy Water Recycled water | kg MJ kg MJ kg MJ kg | CO2, CO, NOx, SO2, N2O, NH3 Oranges Wastes (leaves, rejected, citrus) Wastewater purification plant Scraps | kg kg kg kg kg kg kg |
| 3 | [44] | Primary data (Interview) secondary data (Databases) | Crop management practices Maintenance of watering canals Bank management Plowing Fertilizing Harrowing Sowing Application of plant protection products Harvesting Fertilizers Cuoio torrefatto (12% N); ORVET 8 (8% N); Urea (46% N); Calce Fosfopotassica (8% P2O5–22% K2O–20% CaO); Complesso (18% N–36% K2O); ORVET (10% N–5% P2O5–15% K2O); Complesso (11% N–12% P2O5–36% K2O) Pesticides Gulliver Londax 60 DF–Square 60 WDG Pull 52 DF Sunrice Karmex Buggy–Clinic 360 Stratos ultra Aura K-Othrine Dipterex Heteran Nominee Rifit Cannicid–Poladan | Excavation hydraulic digger Ploughing Tillage, plowing Fertilizing, by broadcaster Tillage, harrowing, by rotary harrow Sowing Application of plant protection products, by field sprayer Combine harvesting 12% N, 46% N, 21% P2O5, 50% K2O | m3 ha ha ha ha ha kg/ha | Direct field emissions (CH4, NH3, etc.) Indirect emissions from combustion delivered refined rice Rice byproducts: husk, flour, broken grains, green grains | kg |
| 4 | [104] | Secondary data (previous studies) | Fertilizer production (process gas and fuel) Arable farming P fertilizer application Fertilizer production (effluents) Arable farming (volatilization) Fertilizer production (nitric acid production) Arable farming (denitrification/nitrification) Arable farming (leaching) P fertilizer production (effluents) | NA | NA | Fossil fuels (oil, natural gas, hard coal, lignite) Minerals (phosphate rock, potash) Land Cd CH4, CO2, CO, NOx, particles, SO2, NMVOC Ntot NH3 N2O NO3-N Ptot | NA |
| 5 | [95] | Secondary data (databases) | Field production Diced tomato processing Tomato paste processing Diced tomato packaging Tomato paste consumer packaging Transport: long-haul truck, rail | Fertilizers (synthetic/organic) Crop protection (chemical/organic) Energy (diesel, gas, electricity) Seeds/plants Water Energy Chemicals Packaging materials Fuel use efficiency | L/mt km | Field emissions of N2O during tomato production Field emissions of CO2 GHG emissions associated with the production of seeds and transplants Emissions intensity | kg CO2/mt km |
| 6 | [78] | Primary (survey and interview) Secondary data (databases and previous studies) | Pesticides Fertilizers Machinery Energy water | NA | NA | Emission from direct energy consumption and field emission Harvested apple | 1 ton |
| 7 | [8] | Primary data (real farm) Secondary data (databases) | NA | Steel, aluminum, concrete, glass fiber resin, plastic Water Fertilizer, manure Pesticide Packaging Diesel | kg m3 kg kg kg kg | Organic waste Construction waste Packaging Plastics oils Hazardous waste | kg kg kg kg kg kg |
| 8 | [45] | Primary data (interview) Secondary data (databases) | Motion of tractors Conveying and unloading Optical selection Washing Peeling Crushing and pulping for the juice Sorting Can filling and pasteurization Water purification Palletizing Irrigation Tomato fertilization Plant protection Tomato fruit transport Packaging | Diesel Electricity Natural gas Water N, P2O5, K2O Insecticide, fungicide Tin can, label, carton tray, plastic film, pallet, box for transport, plastic boxe | kg kWh/can kWh/can m3/Can kg L g/can | The resulting impact was provided as output. | NA |
| 9 | [46] | Primary data (Surveys | Resources Raw materials and fossil fuels Electric and thermal energy | Occupation, permanent crop, fruit, extensive Transformation, to permanent crop, fruit, extensive Transformation, from pasture and meadow Water, process, unspecified natural origin Fertilizer N, P2O5, K2O Pesticides Planting Irrigating Pesticide treatments Transport Power saw Petrol unleaded at a refinery Diesel at refinery Lubricating oil Sawmill Transport, lorry 16–32 ton, EURO Orchard end of life | ha·year ha ha m3 ton ton ha m3 ha kton·km p kg kg kg p ton·km p | Emission in water Nitrogen, total Phosphorus, total Potassium Waste treatments Disposal, hazardous waste, 25% water, to hazardous waste incineration | ton ton ton kg |
| 10 | [47] | Primary data (interview) Secondary data (databases) | Fuels, fertilizers, pesticides, water use, agricultural machinery models and use, yield, harvest schedule, distance and means of transport to the packing facility. | NA | NA | Air emission Water and soil waste | NA |
| 11 | [48] | Primary data (Survey) Secondary data (databases) | Life cycle inventory data for greenhouse tomato and cucumber (per 1 ton of produced crop). Energy coefficients of different inputs and output used | Machinery Labor Diesel fuel Electricity Natural gas Nitrogen Phosphate Potassium Sul Farmyard manure Pesticides Water for irrigation Plastic 1. Machinery Tractor, self-propelled Stationary Equipment implemented, machinery 2. Human labor 3. Natural gas 4. Diesel fuel 5. Biocide Herbicide, fungicide, insecticide 6. Fertilizers: N, P2O5, K2O 7. Micro (M) 8. Farmyard: manure 9. Water for Irrigation 10. Electricity 11. Seeds | kg h L kWh m3 kg kg kg kg kg kg m3 kg kg·year kg·year h m3 L kg kg kg kg m3 kWh kg | Tomato/cucumber | kg |
| 12 | [70] | Primary data (real farm) Secondary data (databases) |
Industrial composting process Biofilter characteristics and gaseous emissions
Phytosanitary substances substage (CuP) Machinery and tools substage (CuM) Irrigation substage (CuI) Post-application emissions sub-stage (CuE) Nursery plants substage (CuN) Management of waste generated in the cultivation stage
Greenhouse management substage (GM Avoided burdens of dumping OFMSW and BA in landfill | Fertilizer application Compost HNO3, KNO3, KPO4H2, K2SO4 Nitrogen application organic, mineral Irrigation water Per area Per ton tomato Open field (OF) Commercial yield, Total yield Tomato average diameter Tomato average weight Greenhouse (GH) Commercial yield Total yield diameter Tomato average weight Trucks | g·m−2 g·m−2 L·m−2 m3·FU−1 t·ha−1 mm g t·ha−1 t·ha−1 mm g T MAL | Outputs of the composting process in the industrial composting plant of Castelldefels Greenhouse gases | |
| 13 | [71] | Secondary data (both) | Wheat life cycle inputs Transport | N, P: conv Pesticide: conv Phosphate rock: org Manure: org Diesel (org and conv) Gasoline (org and conv) Truck, rail transport | kg, kg P kg kg of manure P L L t km | Baking, packaging, and sales Wheat Flour | kg |
| 14 | [39] | Secondary data (Both) | NA | Average yield per cultural cycle Specific area Water Organic fertilizers Crop residues (durum wheat) Manure Foliar nitrogenous fertilizer Differentiated and prolonged release nitrogenous fertilizer Mineral fertilizers Controlled release NPK fertilizer (14–7–14) NPK complex fertilizer Total nutrient supply N (organic fertilizers) N (mineral fertilizers) N (total) P (total, as P2O5) K (total, as K2O) Pesticides (active substances) Benfluralin (herbicide) Propyzamide (herbicide) Boscalid (fungicide) Pyraclostrobin (fungicide) Cyprodinil (fungicide) Fludioxonil (fungicide) Deltamethrin (insecticide) Spinosad (insecticide) Black LDPE mulching film (35 mm; 28 g/m2) | t m2 m3 t t kg kg kg kg kg kg kg kg kg kg kg kg kg | To air: NH3, NOx Groundwater: Surface waters: (PO4) Soil Heavy metals (Cd, Cr, Cu, Ni, Pb, Zn) Pesticides (active substances) | |
| 15 | [96] | Secondary data (databases) | Fertilizer production Pesticide production Production of greenhouse infrastructure | Mineral fertilizer N Mineral fertilizer P Mineral fertilizer K Manure compost Organic fertilizer Steel Aluminum Glass Plexiglas Plastic Iron Concrete Rockwool | N kg·ha−1·year−1 P kg·ha−1·year−1 K kg·ha−1·year−1 N kg·ha−1·year−1 N kg·ha−1·year−1 kg·ha−1·year−1 kg·ha−1·year−1 kg·ha−1·year−1 kg·ha−1·year−1 kg·ha−1·year−1 kg·ha−1·year−1 kg·ha−1·year−1 kg·ha−1·year−1 | Machine use Energy demand heating changes in soil organic carbon | h ha−1 GJ year−1 N2O emissions direct N2O emissions indirect Humus sequestration |
| 16 | [81] | Primary data (real farm) | NA | N min in the soil in spring Mineral N fertilizer rate Atmospheric N deposition Net N mineralization during vegetation Mineralization of N from sugar beet leaves (easily degradable part) Mineralization of N from sugar beet leaves (slowly degradable part) | NA | NH3 volatilization N2O emission N removal with beets N content of leaves N uptake of winter wheat in autumn | One ton of grain |
| 17 | [49] | Primary data (interview) Secondary data (databases) | Greenhouse Training system Irrigation system | Low-density Polyethylene Sawn timber Steel Wire Polyethylene Sawn timber Wire Polyethylene Polyvinylchloride | k m3 kg kg kg m3 kg kg kg | Fresh tomato Air emissions NH3 N2O-N NOx-N Water emissions N-NO3 | t kg·ha−1 kg·ha−1 |
| 18 | [50] | Primary data (real farm) Secondary data (previous studies and databases) | Cultivation and crop Primary process (citrus selection and washing, extraction) Secondary process (refining; centrifugation) Secondary process (refining; pasteurization and cooling) Concentration and cooling Packaging and storage Transport of final products | Fertilizers Water Diesel Electric energy Water Recycled water Water-oil emulsion Electric energy Cooling water Raw juice Methane Electric energy Steam Electric energy Methane Steam Cooling water electric energy Essential oil Electric energy Natural juice Concentrated juice HFO, Diesel | NA | Air emissions Amount of citrus fruit Wastes (scraps, leaves, rejected citrus) Wastewater to a purification plant Scraps to pressing process Essential oil to packaging and storage Wet wastes Wastewater to purification plant Natural and concentrated juice Concentrated juice | NA |
| 19 | [40] | Secondary data (previous studies) | (larvae/fingerlings, fertilizers, and feeds). | NA | NA | nitrogen and phosphorus emissions | NA |
| 20 | [51] | Primary data (reports) Secondary data (databases) | Land use Pesticides Fertilizer use Fuel use Seed use Sun use Agr. operations Lime hydrated Cane Cane transport River water Air Softened water Ammonium sulfate Sulfuric acid Yeast Transport of filter cake Transport of ashes | Diuron, Glyphosate, Gesapox 80, MSMA 72, Amine Salt, Isoctilic ester 48, Asulox 40, Goxone, Amigan 65, Merlin 75, Sulfatante 90, Unspecified Urea, P2O5, K2O Diesel Cane seed Solar energy Harvesting Fertilizing Planting Irrigating NaOH 50% in H2O HCl 30% in H2O | ha/year kg/ha·year kg/ha·year kg/ha·year kg/ha·year kg/ha·year kg/ha·year kg/day kg/ha·year GJ/day ha/year ha/year ha/year ha/year t/day t/day t/day t/day km t/day t/day t/day t/day t/day t/day km | Cane products Cane Agr. Wastes Emissions N2O N total to water Pesticides to water Pesticides to soil Sugar Molassesa Electr. to networka Alcohol Biogas Ash (P2O5 equiv.) Ash (K2O equiv.) Sludge/wastewater/cake (urea equiv.) Sludge/wastewater/cake (P2O5 equiv.) Sludge/wastewater/cake (K2O equiv.) Emissions to air PM10 Nitrogen oxides Emissions to water Wastewater Inorganic solids Total nitrogen Chemical oxygen demand Total phosphorus Emissions to soil Ashes Filter cake | t/day t/day kg/day kg/day kg/day kg/day t/day t/day GJ/day t/day t/day t/day t/day t/day t/day t/day t/day t/day t/day t/day t/day t/day t/day t/day t/day |
| 21 | [52] | Primary data (interview) Secondary data (databases) | Seed production and transport Fertilizer protection and transport Pesticide production and transport Machinery protection and maintenance Energy carriers and protection | NA | NA | Emission to air and water Solid emission | NA |
| 22 | [53] | Secondary data (databases) | Cultivation: Plastic cover Greenhouse Transportation: small truck, truck, sea, pre-cooling, and storage | fuel consumption, refrigeration, driving | L/t km kWh/m3/year | Waste management (CO2 emission, t/t) Paper, board, plastics CO2 emission from packaging, transportation, and storage Transportation Farm to packing house Packinghouse to wholesale | kg/t kg/t kg/t·km kg/t |
| 23 | [54] | Secondary data (databases) | Cattle manure Fuel use for various types of driving machinery and for different loads Low power Medium power High power Combine Willow harvester | N, P2O5, K2O fertilizer Slurry Power | mg/kg mg/kg kw | Willow Straw Wheat | mg/kg mg/kg mg/kg |
| 24 | [82] | Secondary data (both) | Yields for main products Straw yields and crop residues Moisture content Quantity of seed Use of machinery (number of passes) Sowing and harvest date Quantity of fertilizers Types of fertilizers in integrated systems Types of fertilizers in organic systems Pesticide applications Chemical seed dressing Machinery classes Tractor harvester Trailer machinery, tillage Slurry tank | Steel, unalloyed Steel, alloyed Other metals Rubber Plastics Others (glass, paints, etc.) | NA | Ammonia emissions Nitrate leaching P-emissions N2O emissions Heavy-metal emissions Pesticide applications Tractor combustion emissions | NA |
| 25 | [97] | Secondary data (both) | Inventory of agricultural inputs Agrochemical types and application rates Seeding rate Irrigation water intake Fuel consumption in agricultural operations Operating rate in machinery Agricultural machinery type Seed yield | Fertilizers and lime Nitrogen fertilizer (urea and diammonium phosphate) Phosphate fertilizer (diammonium phosphate) Potassium fertilizer (potassium chloride) Agricultural lime (calcic carbonate) Pesticides: Clopyralid, Haloxyfop, Picloram, Glyphosate, Linuron, Thiophanate-methyl, Prochloraz Seed Seed for sowing Irrigation requirement Irrigation water intake Diesel consumption: plowing, harrowing, crushing sowing, spraying, weeding, hilling/fertilizing harvest Tractor for field operations Tools and harvester Seed yield | kg N kg P2O5 kg K2O kg CaCO3 kg kg m3 kg kg kg t/ha | Ammonia (NH3) Nitrates (NO3) Nitrous oxide (N2O) Nitrogen oxides (NOx) Phosphates (PO4) Carbon dioxide (CO2) Glyphosate (main pesticide in rapeseed) Linuron (main pesticide in sunflower) | kg/xkg kg/xkg kg/xkg kg/xkg kg/xkg kg/xkg kg/xkg kg/xkg kg/xkg |
| 26 | [55] | Secondary data (databases) | Inventory data on wheat production (1995–2011, year−1). Wheat grown in paddy fields and Wheat grown in upland fields | Production costs Seed Chemical fertilizers Purchased manure Pesticides 49858 Fossil fuels 14760 Electricity Land improvement and irrigation Agricultural services Buildings Agricultural machinery Fossil fuels Heavy oil Diesel oil Kerosene Gasoline Motor oil Premixed fuel Calcium carbonate fertilizer Nitrogen balance Chemical fertilizers Purchased manure Atmospheric deposition Wheat straw (incorporated) Wheat Wheat straw (total) Denitrification Ammonia volatilization Surplus | yen·ha−1 L·ha−1 kg·ha−1 kg N·ha−1 | Wheat straw Wheat Air-emission sources included fossil fuel combustion, fertilizer application, and crop residue incorporation Emissions in fossil fuel combustion were calculated using the CO2, CH4, and N2O emission factors and the NOx and SOx emission factors The CO2 emission factor of calcium carbonate fertilizer on a weight the basis was 12% | |
| 27 | [105] | Primary data (real farm) Secondary data (previous studies and databases) | Farming Irrigation Soil management Pest treatment Fertilization Pruning Harvesting Olive oil mill Washing Milling Pressing Decantation Oil pomace mill Pitting Drying Solvent extraction Dysventilation and condensation | Water Pesticides Fertilizers Diesel Lubrification oil water Electric energy Water Electric energy Hexane | m3 kg kg kg L m3 kWh L kWh kg | Olive mill Wastewater Water from washing Virgin olive Exhausted pomace Pomace oil | L L L L kg kg |
| 28 | [56] | Primary data (interview) | Fertilization Pesticides Packaging Transportation | N, P, K Lubricating oils Seeds Tomatoes Sugar beets Tomato paste Raw sugar Sugar solution Vinegar Spice emulsion Salt Tomato ketchup Packaging system for tomato paste Packaging system for ketchup Transportation Shopping Household phase Electricity production Waste management | CH4, N2O, CO NMHC Biological oxygen demand (BOD) NOx Other organic compounds Water emissions Soil emissions | kg per FU kg per FU g per FU m3 per FU kg soil per FU | |
| 29 | [72] | Secondary data (databases) | Primary input and output flow from the case study farms during broccoli cropping Flow Inventory of retail-to-grave processes RDC Retailer Household | Occupation, arable land Plants (plugs) CO2 from air fixed in crop Tractor use Diesel (for field operations) Steel (spare parts replacement) Labor (labor-intensive operations) Diesel (for workers’ transport) Plastic (fleece, mulch…) Pesticides (unspecified) Fertilizers: N, P, K Manure/organic fertilizers Irrigation Bluewater, surface water Bluewater, groundwater Infrastructure (pipes, sprinklers…) Electricity (pumps) Input packed broccoli to RDC Diesel for transport to RDC From Spain From the UK Electricity RDC storage Input packed broccoli to retailer Diesel for transport to retailer Electricity retailer storage and display Solid waste from retailer to landfill Broccoli LDPE packaging Diesel for solid waste transport Input broccoli to household Petrol for transport to household Diesel for transport to household Electricity home storage Electricity cooking Natural gas cooking Tap water Solid waste from household to landfill Broccoli LDPE packaging Diesel for solid waste transport Cooking wastewater to WWTP Cooked broccoli (input to human excretion) | m2·year number kg CO2 hours L kg kg N, kg P2O5, kg K2O kg m3 m3 kg kWh kg kg kg MJ kg MJ kg kg kg MJ MJ MJ L kg kg kg L kg | Crop Soil emissions (literature) CO2 from soil CH4 from soil NH3 from soil NOx from soil N2O from soil NO3 from soil PO4 from soil Change in soil organic carbon (SOC) | kg kg CO2 kg CH4 kg NH3 kg NOx kg N2O kg NO3 kg PO4 kg C |
| 30 | [38] | Secondary data (databases) | Data inventory for the agricultural phase Data inventory for the processing phase (data refer to FU) | Seeds Compost from cow and horse manure Fosetyl-Al [Thio]carbamate-compounds [Sulfonyl]urea-compounds Diesel fuel Water Electricity for irrigation LDPE film (greenhouse) Land Salad (Valerianella locusta) Salad Electricity Water Sodium hypochlorite PP film | Mg g mg mg mg g dm3 kWh mg m2 g g kWh dm3 mg g | Emissions to air Carbon dioxide Carbon monoxide Nitrogen oxides Particulate hydrocarbons Dinitrogen monoxide Ammonia Benfluralin Fosetyl-Al Propamocarb Emissions to water Benfluralin Fosetyl-Al Propamocarb Emissions to soil Benfluralin Fosetyl-Al Propamocarb Salad bag (130 g) Salad scraps PP film waste Wastewater | g mg mg mg mg mg mg mg mg mg mg mg mg mg mg p g |
| 31 | [98] | Secondary data (previous studies) | NA | NA | NA | NA | NA |
| 32 | [73] | Primary data (interview) Secondary data (databases) | Main characteristics of the life cycle inventory of the studied conventional (Con) and organic (Org) groups of fruit tree orchards crops in Spain. Data refer to 1 ha and year unless otherwise stated | Drip irrigation Surface irrigation Water use Electricity Presence of cover crops Machinery use Fuel consumption Mulching plastic Mineral nitrogen Mineral phosphorus Mineral potassium Manure Slurry Cover crop seeds Other organic fertilizers Total carbon inputs Total nitrogen inputs Synthetic pesticides Sulfur Copper Paraffin Natural pesticides Production Yield | % of cases % of cases m3 kWh % h L kg kg N kg P2O5 kg K2O mg mg kg kg kg kg kg active matter kg kg kg | Soil emissions Direct nitrous oxide Indirect nitrous oxide Methane Carbon | kg N2O kg N2O kg CH4 kg C |
| 33 | [57] | Secondary data (previous studies) | LCI to produce a single oil palm seedling | Electricity Diesel Polybag Water Fertilizer: N, P2O5, K2O Thiocarbamate Pyrethroid Organophosphate Dithiocarbamate Unspecified pesticide Urea/sulfonylurea Glyphosate Transportation Van | kWh L kg L kg kg kg kg kg kg kg kg tkm | Emissions to air NH3 N2O NO N2 Glyphosate Metsulfuron-methyl Glufosinate ammonium Paraquat Emissions to water Glyphosate Metsulfuron-methyl Carbofuran Glufosinate ammonium Paraquat Emissions to soil Glyphosate Metsulfuron-methyl Carbofuran Glufosinate ammonium Methamidophos Paraquat | kg/t FFB kg/t FFB Leached out and runoff g/t FFB |
| 34 | [58] | Primary data (real farm) Secondary data (databases) | Fertilizer doses, application emissions, and irrigation water (per ha) for lettuce and escarole crops in the open field (OF), plastic mulch (PM), plastic mulch combined with fleece system (PM F), and greenhouse (GH) systems. Characteristics of materials and electricity and diesel consumption (per ha) included in the inventory. PY polyethylene, PP polypropylene. | Fertilizer doses N optimum P2O5 K2O Mulch Fleece Main pipe 1 Main pipe 2 Main pipe 3 Secondary pipes Drip irrigation pipes (laterals) Pumps Electricity (pumps) Electricity (climate system) Diesel (crop management) | kg m2 m2 m m m m kg MJ MJ | Air emissions NH3-N NO2-N Water emissions NO3-N Irrigation water | kg kg m3 |
| 35 | [59] | Primary data (interview) | Principal inputs involved in the analysis of the “Delizie di Bosco del Piemonte” production chain for raspberries and giant American blueberries Nursery Rooting Mulching Covering Covering Fertigation system Fertigation system Fertigation Fertigation Nozzles Cold storage Field Soil preparation Soil preparation Mulching Total processes Mulching Irrigation system Irrigation system Irrigation Irrigation Base fertilization Total fertilization Covering Covering Plant protection treatments Post-harvesting Refrigeration Flow packaging Flow packaging Flow packaging | Substratum Black PE White PE Metal supports PVC piping PVC tubing Compost mix Water PVC Electrical energy Plow or cultivator Harrow Bed-former Diesel consumption PE sheeting PVC piping PVC tubing Water Electrical energy for the well Manure Compost White PE Metal supports p.a. Electrical energy Electrical energy PE tray PE wrapping | L·ha−1 kg·ha−1 kg·ha−1 kg·ha−1 kg·ha−1 kg·ha−1 kg·ha−1 m3·ha−1 kg·ha−1 kWh·m−3 h·ha−1 h·ha−1 h·ha−1 L·h−1 kg·ha−1 kg·ha−1 kg·ha−1 m3·ha−1 kWh·ha−1 t·ha−1 t·ha−1 kg·ha−1 kg·ha−1 kg·ha−1 kWh·kg−1 kWh·kg−1 g·kg−1 g·kg−1 | GWP (global warming potential) IPCC 100a Nonrenewable energy | kg CO2 eq MJ primary |
| 36 | [60] | Secondary data (databases) | Rice production tillage, growing, harvest | Machines, materials | Rice field Pollution (emissions) Product, byproduct Rice field product, byproduct, pollution | ||
| 37 | [36] | Primary data (survey) Secondary data (previous studies and databases) | Seed Power tiller diesel fuel use GHG intensity diesel fuel Power tiller life expectancy Power tiller weight Tractor L diesel fuel/h Tractor weight Embodied GHG of steel Bullocks Allocation to straw Tractors embodied emission Fertilizers Pesticides Manure Nitrogen use efficiency | kg CO2 eq·ha−1 L/h kg CO2 eq·L−1 Years kg L/h kg kg CO2 eq·kg steel−1 kg CO2 eq·h−1 kg CO2 eq·h−1 kg CO2 eq·kg−1 CO2-eq kg/kg CO2-eq·t−1 | Methane emissions Nitrous oxide emissions SRI CH4 and N2O emissions Electricity-based emissions from irrigation. Embodied GHG emissions associated with electricity Harvest Soil organic carbon | kg CO2-eq·ha−1 kg CO2 eq·ha−1 kg CO2 eq·ha−1 kg CO2 eq·kWh−1 GHG emissions·h−1 kg CO2 eq·ha−1 | |
| 38 | [61] | Primary data (interview) | Primary production Grading and packing Regional distribution center Supermarkets | Piscicide production N fertilizer production Tools Machinery Water Compost Field diesel Packaging Electricity Electricity Pallets and packaging Electricity Pallets and packaging | NA | Land-use change Direct emission Nitrate Nitrous oxide Ammonia Waste Waste waste | NA |
| 39 | [62] | Primary data (reports) Secondary data (previous studies) | Orchard establishment inputs Agricultural stage inputs Retail stages inputs Consumption stages inputs | Water Electricity Diesel Machinery Materials Transport | L kW kg kg kg tkm | Apple Peach (NPK) NOx N2O Machinery production emissions and diesel consumed for machinery operations | kg kg |
| 40 | [74] | Secondary data (both) | Annual chemical inputs for managing a mature orange grove in Florida Chemical mowing Herbicide spray Pesticide spray Fertilization Use of energy products for undertaking various cultural activities at a mature orange grove in Florida Site preparation Management of a mature orange grove | Roundup weather max Solicam 80 DF Karmex WP Roundup weather max Prowl H20 Simazine 4L Roundup weather max Mandate Direx 4L Roundup weather max Spray oil Copper (Kocide 3000) Agrimek (if no mite resistance) Zn, Mn, B Lorsban 4EC Copper (Kocide 3000) Spray Oil MgO Dolomite Mowing (mechanical) Mowing (chemical) Discing Soil shaping Planting Mowing (mechanical) Mowing (chemical) Fertilization (16–0–16–4 MgO) Fertilization (lime) Herbicide Pesticide Conditioning Topping Hedging Brush removing Chopping brush Dead tree removal Irrigation Fruit picking Transporting pickers Roadsiding fruit | mL/ha kg/ha kg/ha mL/ha mL/ha mL/ha mL/ha mL/ha mL/ha mL/ha L/ha kg/ha mL/ha kg/ha mL/ha kg/ha L/ha kg/ha kg/ha | Emission from energy use Emission from material use | g CO2 eq./FU g CO2 eq./FU |
| 41 | [75] | Primary data (survey) Secondary data (databases) | Principal inputs involved in the production and distribution chain (scenarios 1 and 2) for strawberries Nursery Rooting Mulching Covering Covering Fertigation system Fertigation system Fertigation Fertigation Cold storage Field Soil preparation Soil preparation Mulching Total processes Mulching Irrigation system Irrigation system Irrigation Irrigation Base fertilization Total fertilization Covering Covering Plant protection treatments Post-harvesting Refrigeration Flow packaging Flow packaging | Substratum Black PE White PE Metal supports PVC piping PVC tubing Compost mix Water Electrical energy Plow or cultivator Harrow Bed-former Diesel consumption PE sheeting PVC piping PVC tubing Water Electrical energy for the well Manure Compost White PE Metal supports p.a. Electrical energy PE tray PE wrapping | L·ha−1 kg·ha−1 kg·ha−1 kg·ha−1 kg·ha−1 kg·ha−1 kg·ha−1 m3·ha−1 kWh·m−3 h·ha−1 h·ha−1 h·ha−1 L·h−1 kg·ha−1 kg·ha−1 kg·ha−1 m3·ha−1 kWh·ha−1 t·ha−1 t·ha−1 kg·ha−1 kg·ha−1 kg·ha−1 kWh·kg−1 g·kg−1 g/kg | GWP (global warming potential) IPCC 100a Non-renewable energy | kg CO2 eq·UF−1 kg CO2 eq·UF−1 |
| 42 | [93] | Secondary data (databases) | Life cycle inventory data for watermelon cultivation (per ha). Characterization factors of inputs used in watermelon production. Parameters and coefficients of objective functions. | 1. Human labor (man/woman) 2. Diesel fuel Plowing Discing Ditcher 3. Machinery Tractor and self-propelled Implement and machinery 4. Fertilizers Nitrogen (N) Phosphate (P2O5) Potassium (K2O) Microelements 5. Farmyard manure 6. Electricity 7. Chemicals Fungicide Insecticide 8. Seeds 9. Plastics Machinery Diesel fuel Chemical fertilizers (a) Urea (b) Phosphate (P2O5) (c) Potassium (K2O) Manure Pesticides Electricity Plastics Constanta N K2O P2O5 Manure Diesel Electricity Seed Chemicals Machinery Plastic Water | h L kg kg kg kWh kg kg kg kg L kg kg kg kWh kg kg kg kg kg L kWh kg kg kg kg MJ | Watermelon On-farm emissions N fertilizer Diesel fuel | kg kg MJ |
| 43 | [76] | Secondary data (databases) | NA | Mulching film for pot production (PP) Wind-stopper (galvanized iron) Hydraulic pipe/micro pipe (PEHD/PELD/PVC) Taps (PEHD/PVC) Tunnel cover Tunnel structure (galvanized iron) Poles (galvanized iron/wood) Sprinklers (galvanized iron) Hydraulic fittings (PE) Solenoid (PVC) Support canes (bamboo) Black clip (PP) Plates PP black wire (nylon) Green thread (PVC) Iron wire (galvanized iron) Elastics/hooks/butterfly valve (PE) Irrigation bar (aluminum) Block (concrete) Covering (gravel/volcanic stones) Raincoat towel (PVC/PP/PEHD) A chain-link fence (galvanized iron) Centrifugal/submersible pump (Cast iron/stainless steel) Electrical panel (PEHD/copper) Burlap (jute) String (sisal) Wire basket (iron) Plastic net (PP) Plastic box (PP) | NA | Total yearly GHG emissions are divided into different categories (kg CO2 eq/m2/year) NFS ¼ nursery farm structure; AGS ¼ aboveground structures; IC ¼ inputs of cultivation; P ¼ packaging; EFS ¼ emissions from soil | NA |
| 44 | [106] | Secondary data (databases) | NA | Strawberry (nursery field) PE punnet PE plastic film End-of-life Transport Electricity | NA | Nonrenewable energy IPCC GWP 100a | MJ·UF−1 kg CO2 eq·UF−1 |
| 45 | [79] | Primary data (surveys) | Gasoline at the refinery (US) Diesel at the refinery (US) Urea ammonium nitrate (UAN), (US) Monoammonium phosphate (US) Waxes/paraffin at the refinery (US) Potassium sulfate, at regional storage (Europe) Mined from natural sources, only transport is modeled Fishmeal Potassium carbonate, at the plant (Europe) Sulfur (elemental) at the refinery (US) Yeast (surrogate data, yeast produced as a co-product) Serenade is a strain of Bacillus subtilis (Swiss) Glyphosate, at regional storehouse (Europe) Diphenyl-ether compounds at regional storehouse (Europe) Phtalamide compounds at regional storehouse (Europe) Pesticide unspecified, at regional storehouse RER Developed based on Recycled Organics Unit (2006), updated with regionally appropriate LCI datasets Electricity grid mix (West US) Modeled based on power rating and hours of operation (California model) and Diesel (US) Truck (combination)—diesel rail (US diesel) | Gasoline Diesel Urea ammonium nitrate (UAN) Monoammonium phosphate (MAP) Adjuvant (stylet oil) Potassium sulfate Phytamin component: seabird guano Phytamin component: fishmeal Phytamin component: potassium carbonate Sulfur dust Serenade Roundup Ultra Max Goal 2XL Chateau, Pristine (Boscalid and Pyraclostrobin) Compost production Electricity Equipment operation Truck, rail shipping International shipping | NA | IPCC Tier 2 emissions were used to calculate the field-based N2O emissions from fertilizer and compost application and vineyard plant matter, including leaves, clippings, and cover crop residue following mowing (Intergovernmental Panel on Climate Change 2006; Point et al. 2012). | NA |
| 46 | [63] | Secondary data (databases) | Fossil energy life cycle factors for agricultural inputs | Nitrogen Phosphorous Potassium Lime Sulfur Micronutrients Cover crop seed Herbicide Insecticide Fungicide Gasoline Diesel Plastic Agriculture machinery Electricity | MJ/kg MJ/kg MJ/kg MJ/kg MJ/kg MJ/kg MJ/kg MJ/kg MJ/kg MJ/kg MJ/L MJ/L MJ/kg MJ/h MJ/kWh | Direct N2O emissions from agricultural Emissions (e.g., volatile organic compound (VOC), carbon monoxide (CO), carbon dioxide (CO2), nitrogen monoxide (NO), nitrogen dioxide (NO2), nitrous oxide (N2O), particulate matter (PM10), particulate matter (PM2.5), sulfur dioxide (SO2), sulfur trioxide (SO3), methane (CH4)) Emissions and energy use in transportation | NA |
| 47 | [24] | Secondary data (databases) | Electricity production Oil production Plastic P1 production Gutter A1 production Gutter A1 use and demolition Incineration of P1/A1 Recycling process Material B production Product system Electricity production Oil production Plastic P2 production Gutter A2 production Gutter A2 use and demolition Incineration of P2/A2 Recycling process Material B production Product system | Electricity Oil Plastic P1 Produced A1 Installed A1 Incinerated P1/A A1 in recycling Avoided material B | MJ kg kg 100 m 100 m kg kg kg | CO2 CH4 N2O NOx SO2 | kg kg kg kg kg |
| 48 | [64] | Secondary data (databases) | Planting and maintenance Harvesting and baling Receiving/storage Drying and chopping Pelletizing/cooling/screening Packing and storage | Seed Fertilizer Pesticide/herbicide Land use Machinery Fuel Machinery Fuel Electricity Air Plastic bag | kg·ha−1 ha kg·ha−1 ha MJ MJ kWh | Strawbale CO2 N2O CH4 SO2 PO4 Pellet | kg g CO2 eq g CO2 eq g CO2 eq g CO2 eq g SO2 eq g PO4 eq kg |
| 49 | [65] | Primary data (real farm) Secondary data (database and previous studies) | Production characteristics Greenhouse plastic Water consumption Growing media Fertilizer Pesticide Electric power Diesel and petrol Post-harvest chemicals | Plastic consumption Rejected steams Power consumption Diesel Petrol Cardboard box Bunching paper Rubber band Strapping roll Water Substrate (red ash) Pesticide Pesticide empty containers Calcium nitrate Other fertilizers Acids Post-harvest chemicals Post-harvest water use | g # kWh g g g g g g L g g g g g g g L | Roses CO2 CH4 N2O | Bunch g g g |
| 50 | [32] | Secondary data (database and previous studies) | Production of crop inputs, production and use of diesel, and field emissions | N (ammonium nitrate) P2O5 (triple superphosphate K2O (potassium chloride) CaO Seed for sowing Pesticide (active ingredient) Diesel Natural gas (for grain drying) Agricultural machinery Grain dry matter yield Stem/straw dry matter yield Sugar/tuber dry matter yield Followed bycatch crop (%) Succeeding crop NO3-N emitted | kg/ha kg/ha kg/ha kg/ha kg/ha kg/ha kg/ha kg/ha kg/ha kg/ha kg/ha kg/ha kg/ha | Hemp Sunflower Rapeseed Pea Wheat Maize Potato Sugar beet NH3-N NO3-N N2O-N PO4-P | ha ha ha ha ha ha ha ha emissions/kg emissions/kg emissions/kg emissions/kg |
| 51 | [100] | Secondary data (database and previous studies) | Infrastructure:
| Mineral fertilizers Organic fertilizers Pesticides Seed Feed | kg kg kg kg kg | Potatoes organic, at the farm Rapeseed extensive, at the farm Wheat grains conventional, Barrois, at the farm Carbon dioxide CO2 Sulfur dioxide SO2 Lead Pb Methane CH4 Benzene C6H6 Particulate Matter PM Cadmium Cd Chromium Cr Copper Cu Monoxide N2O Nickel Ni | kg kg kg g/kg g/kg g/kg g/kg g/kg g/kg g/kg g/kg g/kg g/kg |
| 52 | [85] | Primary data (survey) | Tractors and equipment Buildings required energy Carriers Mineral fertilizer Tree nursing Constructions for hail protection Water for irrigation Application of compost | Pesticides Fungicide Insecticide Herbicide Other plants treatment products Fertilizers N-fertilizer Ca- and Mg-fertilizer (kg Ca, Mg) K-fertilizer P-fertilizer Machinery Diesel Tractor Equipment Buildings | kg active matter kg N kg K2O kg P2O5 kg kg kg m2 | Total receipts Yield | USD·ha−1 t·ha−1 |
| 53 | [89] | Secondary data (databases) | Pesticide Seeds PK fertilizer N fertilizer Machinery mulching Machinery irrigation Machinery pesticide Machinery fertilization Machinery weeding Machinery soil tillage Machinery harvest Machinery sowing | Energy input | MJ eq | CH4 N2O CO2 Ph NH3 NO−3 | t CO2 eq·ha−1·year−1 kg N eq·ha−1·year−1 t CO2 eq·ha−1·year−1 kg N eq·ha−1·year−1 kg N eq·ha−1·year−1 kg N eq·ha−1·year−1 |
| 54 | [77] | Primary data (farmers) Secondary data (databases and references) | Transportation Fertilization Pesticides Irrigation | Inputs 1. Diesel fuel 2. Transportation 3. Human labor 4. Chemical fertilizers (a) Nitrogen (b) Phosphate (c) Potassium (d) Sulfur 5. Manure 6. Chemical pesticides (a) Fungicide (b) Insecticide 7. Irrigation water The total energy input | L kg h kg kg kg m3 MJ | Grape Ammonia (NH3) Ammonia (NH3) Benzene Benzo (a) pyrene Cadmium (Cd) Carbon dioxide (CO2) Carbon dioxide (CO2) from urea. Carbon monoxide (CO) Chromium (Cr) Copper (Cu) Diazinon Dinitrogen monoxide (N2O) Dinitrogen monoxide (N2O) Dinitrogen monoxide (N2O) from atmospheric deposition Hydrocarbons (HC, as NMVOC) Methane (CH4) Nickel (Ni) Nitrate (NO3) Nitrogen oxide (NOx) Nitrogen oxides (NOx) PAH (polycyclic hydrocarbons) Particulates (b2.5 mm) Phosphorus emissions from fertilizers application emitted into groundwater. Selenium (Se) Sulfur dioxide (SO2) Tillet Zinc (Zn) | kg kg·ha−1 kg·ha−1 kg·ha−1 kg·ha−1 kg·ha−1 kg·ha−1 kg·ha−1 kg·ha−1 kg·ha−1 kg·ha−1 kg·ha−1 kg·ha−1 kg·ha−1 kg·ha−1 kg·ha−1 kg·ha−1 kg·ha−1 kg·ha−1 kg·ha−1 kg·ha−1 kg·ha−1 kg·ha−1 kg·ha−1 kg·ha−1 kg·ha−1 kg·ha−1 |
| 55 | [83] | Primary data (field experiment) Secondary data (database) | Fertilization Cutting preparation Spraying Ploughing Disking Harrowing Marking Spraying Mechanical weeding Fertilizing Lignin production and application Harvest Transport Liquidation | Tractor/harvester Machinery Diesel fuel | kg·ha−1 | CO2 PM SO2 p | kg Mg−1 CO2 eq kg MP 10 eq kg SO2 eq kg p eq |
| 56 | [90] | Secondary data (databases and previous studies) | Pesticide application | Active ingredients of the pesticide | t | Active ingredients emissions | Unitless |
| 57 | [66] | Primary (survey) Secondary data (database and previous studies) | Nursery Tomato cultivation Packaging Transportation | Reporting period Country (Production site) Growing period Greenhouse structure Substrate Greenhouse heating CO2 enrichment Yield Fertilization Irrigation Energy consumption | ton·ha−1 kg N·ha−1, kg P2O5·ha−1, kg K2O·ha−1 water m3·ha−1 kWh·ha−1 | Nitrogen oxides, phosphates, and pesticides emissions nitrous oxide, and ammonia | g N eq g P eq |
| 58 | [86] | Secondary data (databases) | Applying farmyard manure Land preparation Planting Fertilizing Harvesting | N-based fertilizers P-based fertilizers K-based fertilizers Pesticides Farmyard manure Microelements Diesel fuel Water | kg kg kg kg t kg L m3 | Carbon dioxide (CO2) Sulfur dioxide (SO2) Methane (CH4) Benzene Cadmium (Cd) Chromium (Cr) Copper (Cu) Dinitrogen monoxide (N2O) Nickel (Ni) Zinc (Zn) Benzo(a)pyrene Ammonia (NH3) Selenium (Se) PAH (polycyclic hydrocarbons) Hydrocarbons (HC, as NMVOC) Nitrogen oxides (NOx) Carbon monoxide (CO) Particulates (<2.5 μm) | kg kg kg kg kg kg kg kg kg kg kg kg |
| 59 | [67] | Secondary data (databases) | Fertilization, split fertilization, chemical fallow, liming, sowing and spraying at the farm | NPK-fertilizer N-fertilizer Roundup (glyphosate) Dolomite (CaO) Celest Formula M (fludioxonil) Starane XL (fluroxypyr/florasulam) Fastac 50 (alpha-ceypermethrin) | kg·ha−1 kg·ha−1 kg·ha−1 kg·ha−1 kg·ha−1 kg·ha−1 kg·ha−1 | N2O NH3 NOx | kg N2O-N/kg N input kg NH3-N NOx-N/kg |
| 60 | [103] | Primary data (real farm) Secondary data (databases) | production, transport to the farm and use on the farm | Fertilizers, pesticides, field materials, pesticide spray equipment, irrigation system and packaging manufacturing | NA | Pesticide emission | NA |
| 61 | [87] | Secondary data (databases and previous studies) |
| Fertilizer N, P, K Lime Fuel Seeds Agricultural equipment | NA | Agricultural engine emissions (CO, HC, NOx, SO2, PM, CO2) (EPA 2004) Direct field emission from fertilization (NO3, NH4, N2O, NOx, CO2, PO4) Hemp straws and seeds | NA |
| 62 | [91] | Secondary data (databases) | Pesticide application | S-Metolachlor (H) Simazine (H) Glyphosate (H) Glufosinate ammonium (H) Dimethenamid-P (H) Atrazine (H) Alachlor (H) Acetochlor (H) 2,4-d-dimethylammonium… 2,4-d-2-ethylhexyl ester (H) Fipronil (I) Chlorpyrifos (I) | kg/kg corn kg/kg corn kg/kg corn kg/kg corn kg/kg corn kg/kg corn kg/kg corn kg/kg corn kg/kg corn kg/kg corn | Pesticide emission to air, surface water, and groundwater | % |
| 63 | [101] | Primary data (real farm) Secondary data (databases) | Manufacture of greenhouse components, substrate, fertilizers, and pesticides. the electricity production mix; and transport and disposal of materials | greenhouse components Water consumption and fertilizer and pesticide doses applied | kg, m2, m3 M3 kg, L kg | N2O NOx NH3 Azoxystrobin Chlorothalonil Clofentezine Fenbutatin oxide Mancozeb Spinosad Copper chloride oxide, hydrate Concrete Plastics Substrate | kg kg kg kg kg kg kg kg kg kg kg kg kg |
| 64 | [94] | Primary data (survey) Secondary data (databases and previous studies) |
| Yield Grain Straw Agricultural field operations Ploughing Harrowing by rotary harrow Sowing Fertilizing by broadcaster Slurry spreading Pest control application by field Sprayer Harvesting Bailing Transport (tractor and trailer) Grain drying Seeds Fertilizers Calcium ammonium nitrate (CAN) Ammonium nitrate Pig slurry Dairy cattle slurry Pesticides Tribenuron-methyl Pyraclostrobin Tebuconazole Pirimicarb Difensulfuron 2,3-d-Bromoxinil | t/ha t/ha number of repetitions (rep) rep rep rep rep rep rep rep rep rep rep kg/ha kg N/ha kg N/ha kg N/ha kg N/ha g/ha g/ha g/ha g/ha g/ha g/ha g/ha | Fertilizers’ emissions NH3 N2O NO3 PO4 Pesticides’ emissions Tribenuron-methyl Pyraclostrobin Tebuconazole Pirimicarb Thifensulfuron-methyl (difensulfuron) 2,4-d-Bromoxynil | kg/ha kg/ha kg/ha kg/ha kg/ha kg/ha kg/ha kg/ha kg/ha kg/ha kg/ha |
| 65 | [80] | Secondary data (databases) | Slurry tanker and spreading device production Tractor production Diesel production | Raw materials Energy | Field emissions NH3, N2O, NO3, PO4 Other emissions to air, soil, water | kg N | |
| 66 | [84] | Secondary data (databases) | Transportation of raw materials Production of technical oxide Transportation of technical oxide Production of fertilizer Transportation of fertilizer Spreading | Zinc ashes | 9 kg·ha−1 every three years | Zn ZnCl2 ZnO | kg kg kg |
| 67 | [68] | Primary data (interview) | Desiccation Liming Soybean and sunflower seeds treatment Sowing and fertilization Topdressing fertilization Pesticide and herbicide application Soybean and sunflower harvesting | Product Resources Occupation, arable, non-irrigated Materials/fuels Seeds Limestone Urea, as N Single superphosphate, as P2O5 Triple superphosphate, as P2O5 Potassium chloride, as K2O Herbicides Insecticides Fungicides Mineral oil Boric acid Liming Pesticide application Sowing and fertilization Pesticide application Harvesting | kg ha·year−1 kg kg kg kg kg kg kg kg kg kg kg ha ha ha ha ha | Emissions to air Ammonia Dinitrogen monoxide Nitrogen oxides CO2, fossil CO2, land transformation Emissions to water Nitrate Cadmium 2 Copper Zinc Lead Nickel Chromium Emissions to soil Cadmium Copper Zinc Lead Nickel Chromium Herbicides Insecticides Fungicides | kg kg kg kg kg kg kg kg kg kg kg kg kg kg kg kg kg kg kg kg kg |
| 68 | [99] | Primary data (survey) Secondary data (databases) | Direct agricultural inputs Production of the different agricultural inputs, | Information about tractors and implements, labor hours, and input rates such as agrochemicals and water use) nitrogen (urea and ammonium nitrate), phosphorous or potassium-based fertilizers and herbicides (terbutilazine, alachlor, lumax, and S-metolachlor | NH3 N2O NO3 | kg N2O-N·ha−1·kg−1 | |
| 69 | [92] | Secondary data (databases and previous studies) | Pesticide application | Abamectin Azadirachtin Chlorpyrifos Clofentezine Copper oxychloride Fenazaquin Fenbutatin-oxyde Fluroxypyr Fosetyl-Al Glufosinate-ammonium Glyphosate Hexythiazox Imazalil Imidacloprid Insecticide Lambda-cyhalothrin Mancozeb MCPA Paraquat Propargite Pyridaben Pyriproxyfen Spinosad Tebufenpyrad Thiabendazole White mineral oil (paraffin oil) | kg·m−2 kg·m−2 kg·m−2 kg·m−2 kg·m−2 kg·m−2 kg·m−2 kg·m−2 kg·m−2 kg·m−2 kg·m−2 kg·m−2 kg·m−2 kg·m−2 kg·m−2 kg·m−2 kg·m−2 kg·m−2 kg·m−2 kg·m−2 kg·m−2 kg·m−2 kg·m−2 kg·m−2 kg·m−2 | Pesticide emission | NA |
| 70 | [88] | Primary data (survey and interview) Secondary data (Databases and previous studies) | NA | Cut flowers Carnation support net Plastic cover material Putty for sun protection Water for the putty used for sun protection Transporting of cut flowers to Athens (2 times per week) Electricity consumption for refrigeration of the cut flowers, water pumping Fertilizers Water for plant protection Fungicides, Pesticides Soil disinfection (once every three years) Water for soil disinfection, plant watering (3 times per week) Humidification | Stems/year kg/year kg/year kg/year m3/year km/year kWh/year kg N/year, kg P/year, kg K/year m3/year kg/year kg/year m3/year | N2O, NOx, and ammonia | NA |
| 71 | [28] | Secondary data (databases and previous studies) | Pesticide application | Abamectine Azoxystrobin Benomyl Bromopropylate Captan Cyromazine Deltametrin Fenarimol Iprodione Kresoxim-metil Mancozeb Pimetrozine | kgai·FU−1 kgai·FU−1 kgai·FU−1 kgai·FU−1 kgai·FU−1 kgai·FU−1 kgai·FU−1 kgai·FU−1 kgai·FU−1 kgai·FU−1 kgai·FU−1 kgai·FU−1 | Pesticide emission to air, soil, and water | NA |
| 72 | [12] | Secondary data (databases) | Fertilizer application Seeds use Plant protection production application Agriculture activity | N, P, K fertilizer | NA | NH3 NOx N2O NO3 PO4−3 P HMa Heavy metal Active ingredients CO2 NMVOC PM | NA |
| 73 | [102] | Secondary data (databases) | NA | Pesticide N Fertilizer P Fertilizer | NA | N2O, air emission P, water Emission NO−3, water Emission Pesticides, water emission | NA |
| 74 | [69] | Primary data (surveys) Secondary data (databases) | Soil tillage Seedbed preparation Owing Fertilization Plant protection Harvest Stubble cultivation Transport to the farm and grain drying | Fertilizer use Number of passes for fertilizer spreading Pesticide use (active ingredients) Herbicides Fungicides Insecticides Other pesticides Total pesticides Number of passes for pesticide spraying | kg N·ha−1·year−1 kg P2O5·ha−1·year−1 kg K2O·ha−1·year−1 ha−1·year−1 kg·ha−1·year−1 kg·ha−1·year−1 kg·ha−1·year−1 kg·ha−1·year−1 kg·ha−1·year−1 ha−1·year−1 | Yields Gross energy yield Raw protein yield Gross margin | kg DM·ha−1·year−1 GJ·ha−1·year−1 kg·ha−1·year−1 D·ha−1·year−1 |
References
- Kucukvar, M.; Ismaen, R.; Onat, N.C.; Al-Hajri, A.; Al-Yafay, H.; Al-Darwish, A. Exploring the Social, Economic and Environmental Footprint of Food Consumption: A Supply Chain-Linked Sustainability Assessment. In Proceedings of the 2019 IEEE 6th International Conference on Industrial Engineering and Applications (ICIEA), Tokyo, Japan, 12–15 April 2019; IEEE: Piscataway, NJ, USA; pp. 733–742. [Google Scholar]
- Institute of Medicine and National Research Council. 2 Overview of the U.S. Food System. In A Framework for Assessing Effects of the Food System; The National Academies Press: Washington, DC, USA, 2015; Available online: https://www.nap.edu/read/18846/chapter/5 (accessed on 28 September 2021). [CrossRef] [Green Version]
- Tilman, D.; Balzer, C.; Hill, J.; Befort, B.L. Global Food Demand and the Sustainable Intensification of Agriculture. Proc. Natl Acad. Sci. USA 2011, 108, 20260–20264. [Google Scholar] [CrossRef] [PubMed] [Green Version]
- Brandt, K.; Barrangou, R. Applications of CRISPR Technologies Across the Food Supply Chain. Annu. Rev. Food Sci. Technol. 2019, 10, 133–150. [Google Scholar] [CrossRef] [PubMed]
- FAO; WFP; IFAD. The State of Food Insecurity in the World 2012. Economic Growth Is Necessary but Not Sufficient to Accelerate Reduction of Hunger and Malnutrition; FAO: Rome, Italy, 2012; p. 5. Available online: https://www.fao.org/3/i3027e/i3027e00.pdf (accessed on 28 September 2021).
- Sources of Greenhouse Gas Emissions. US EPA. Available online: https://www.epa.gov/ghgemissions/sources-greenhouse-gas-emissions (accessed on 28 July 2021).
- US EPA. Overview of Greenhouse Gases. Available online: https://www.epa.gov/ghgemissions/overview-greenhouse-gases (accessed on 28 July 2021).
- Cellura, M.; Longo, S.; Mistretta, M. Life Cycle Assessment (LCA) of Protected Crops: An Italian Case Study. J. Clean. Prod. 2012, 28, 56–62. [Google Scholar] [CrossRef]
- Von Blottnitz, H.; Curran, M.A. A Review of Assessments Conducted on Bio-Ethanol as a Transportation Fuel from a Net Energy, Greenhouse Gas, and Environmental Life Cycle Perspective. J. Clean. Prod. 2007, 15, 607–619. [Google Scholar] [CrossRef]
- Lee, K.-M.; Inaba, A. Life Cycle Assessment Best Practices of ISO 14040 Series; Center for Ecodesign and LCA (CEL), Ajou University: Suwon, Korea, 2004; p. 96. [Google Scholar]
- Buyle, M.; Braet, J.; Audenaert, A. Life Cycle Assessment in the Construction Sector: A Review. Renew. Sustain. Energy Rev. 2013, 26, 379–388. [Google Scholar] [CrossRef]
- Corrado, S.; Castellani, V.; Zampori, L.; Sala, S. Systematic Analysis of Secondary Life Cycle Inventories When Modelling Agricultural Production: A Case Study for Arable Crops. J. Clean. Prod. 2018, 172, 3990–4000. [Google Scholar] [CrossRef] [PubMed]
- Atenstaedt, R. Word Cloud Analysis of the BJGP. Br. J. Gen. Pract. 2012, 62, 148. [Google Scholar] [CrossRef] [PubMed] [Green Version]
- Heimerl, F.; Lohmann, S.; Lange, S.; Ertl, T. Word Cloud Explorer: Text Analytics Based on Word Clouds. In Proceedings of the 2014 47th Hawaii International Conference on System Sciences, Waikoloa, HI, USA, 6–9 January 2014; pp. 1833–1842. [Google Scholar]
- DePaolo, C.A.; Wilkinson, K. Get Your Head into the Clouds: Using Word Clouds for Analyzing Qualitative Assessment Data. TechTrends 2014, 58, 38–44. [Google Scholar] [CrossRef]
- Present Your Data in A Doughnut Chart. Available online: https://support.microsoft.com/en-us/office/present-your-data-in-a-doughnut-chart-0ac0efde-34e2-4dc6-9b7f-ac93d1783353 (accessed on 4 October 2021).
- What Is A Pie Chart and When to Use It. Available online: https://www.storytellingwithdata.com/blog/2020/5/14/what-is-a-pie-chart (accessed on 4 October 2021).
- Wu, J. Improving the Writing of Research Papers: IMRAD and Beyond. Landsc. Ecol. 2011, 26, 1345–1349. [Google Scholar] [CrossRef] [Green Version]
- Vyas, V.d.H.A. Tantraguna—The Ancient Criteria for Scientific Writing. Ayu 2016, 37, 158–162. [Google Scholar] [CrossRef] [PubMed]
- Nair, P.K.R.; Nair, V.D. Organization of a Research Paper: The IMRAD Format. In Scientific Writing and Communication in Agriculture and Natural Resources; Nair, P.K.R., Nair, V.D., Eds.; Springer International Publishing: Cham, Switzerland, 2014; pp. 13–25. [Google Scholar]
- Hertwich, E.G.; Pease, W.S. ISO 14042 Restricts Use and Development of Impact Assessment. Int. J. Life Cycle Assess. 1998, 3, 180–181. [Google Scholar] [CrossRef]
- Pryshlakivsky, J.; Searcy, C. Fifteen Years of ISO 14040: A Review. J. Clean. Prod. 2013, 57, 115–123. [Google Scholar] [CrossRef]
- Fava, J.; Baer, S.; Cooper, J. Increasing Demands for Life Cycle Assessments in North America. J. Ind. Ecol. 2009, 13, 491–494. [Google Scholar] [CrossRef]
- Huijbregts, M. Uncertainty and Variability in Environmental Life-Cycle Assessment. Int. J. Life Cycle Assess. 2002, 7, 173. [Google Scholar] [CrossRef] [Green Version]
- Bhatia, P.; Cummis, C.; Draucker, L.; Rich, D.; Lahd, H.; Brown (WBCSD), A. Greenhouse Gas Protocol Product Life Cycle Accounting and Reporting Standard; World Resources Institute (WRI) and World Business Council for Sustainable Development (WBCSD): Washington, DC, USA, 2011. [Google Scholar]
- Heijungs, R.; Guinée, J.B. (Eds.) Environmental Life Cycle Assessment of Products; Centre of Environmental Science: Leiden, The Netherlands, 1992. [Google Scholar]
- Lueddeckens, S.; Saling, P.; Guenther, E. Temporal Issues in Life Cycle Assessment—A Systematic Review. Int. J. Life Cycle Assess. 2020, 25, 1385–1401. [Google Scholar] [CrossRef]
- Antón, A.; Castells, F.; Montero, J.I.; Huijbregts, M. Comparison of Toxicological Impacts of Integrated and Chemical Pest Management in Mediterranean Greenhouses. Chemosphere 2004, 54, 1225–1235. [Google Scholar] [CrossRef] [PubMed]
- Huijbregts, M.A.J.; Struijs, J.; Goedkoop, M.; Heijungs, R.; Jan Hendriks, A.; van de Meent, D. Human Population Intake Fractions and Environmental Fate Factors of Toxic Pollutants in Life Cycle Impact Assessment. Chemosphere 2005, 61, 1495–1504. [Google Scholar] [CrossRef] [PubMed]
- Jolliet, O.; Margni, M.; Charles, R.; Humbert, S.; Payet, J.; Rebitzer, G.; Rosenbaum, R. IMPACT 2002+: A New Life Cycle Impact Assessment Methodology. Int. J. Life Cycle Assess. 2003, 8, 324. [Google Scholar] [CrossRef] [Green Version]
- de García, S.O.; García-Encina, P.A.; Irusta-Mata, R. The Potential Ecotoxicological Impact of Pharmaceutical and Personal Care Products on Humans and Freshwater, Based on USEtoxTM Characterization Factors. A Spanish Case Study of Toxicity Impact Scores. Sci. Total Environ. 2017, 609, 429–445. [Google Scholar] [CrossRef]
- Van Der Werf, H.M.G. Life Cycle Analysis of Field Production of Fibre Hemp, the Effect of Production Practices on Environmental Impacts. Euphytica 2004, 140, 13–23. [Google Scholar] [CrossRef]
- Charles, R.; Jolliet, O.; Gaillard, G.; Pellet, D. Environmental Analysis of Intensity Level in Wheat Crop Production Using Life Cycle Assessment. Agric. Ecosyst. Environ. 2006, 113, 216–225. [Google Scholar] [CrossRef]
- Brentrup, F.; Küsters, J.; Lammel, J.; Barraclough, P.; Kuhlmann, H. Environmental Impact Assessment of Agricultural Production Systems Using the Life Cycle Assessment (LCA) Methodology II. The Application to N Fertilizer Use in Winter Wheat Production Systems. Eur. J. Agron. 2004, 20, 265–279. [Google Scholar] [CrossRef]
- Nesheim, M.C.; Oria, M.; Yih, P.T.; Committee on a Framework for Assessing the Health, Environmental, and Social Effects of the Food System; Food and Nutrition Board; Board on Agriculture and Natural Resources; Institute of Medicine; National Research Council. Environmental Effects of the U.S. Food System; National Academies Press: Washington, DC, USA, 2015. [Google Scholar]
- Gathorne-Hardy, A. A life cycle assessment (LCA) of greenhouse gas emissions from SRI and flooded rice production in SE India. Taiwan Water Conserv. J. 2013, 61, 111–125. [Google Scholar]
- Hanieh, A.A.; Hasan, A.; Assi, M. Date Palm Trees Supply Chain and Sustainable Model. J. Clean. Prod. 2020, 258, 120951. [Google Scholar] [CrossRef]
- Fusi, A.; Castellani, V.; Bacenetti, J.; Cocetta, G.; Fiala, M.; Guidetti, R. The Environmental Impact of the Production of Fresh Cut Salad: A Case Study in Italy. Int. J. Life Cycle Assess. 2016, 21, 162–175. [Google Scholar] [CrossRef]
- Tasca, A.L.; Nessi, S.; Rigamonti, L. Environmental Sustainability of Agri-Food Supply Chains: An LCA Comparison between Two Alternative Forms of Production and Distribution of Endive in Northern Italy. J. Clean. Prod. 2017, 140, 725–741. [Google Scholar] [CrossRef]
- Reckenholz-Tänikon, A. Towards a Sustainable Management of the Food Chain. In Proceedings of the Research Station ART 6th International Conference on Life Cycle Assessment in the Agri-Food Sector, Zurich, Switzerland, 12–14 November 2008. [Google Scholar]
- O’Neill, B.C.; Kriegler, E.; Ebi, K.L.; Kemp-Benedict, E.; Riahi, K.; Rothman, D.S.; van Ruijven, B.J.; van Vuuren, D.P.; Birkmann, J.; Kok, K. The Roads Ahead: Narratives for Shared Socioeconomic Pathways Describing World Futures in the 21st Century. Glob. Environ. Chang. 2017, 42, 169–180. [Google Scholar] [CrossRef] [Green Version]
- Abeliotis, K.; Detsis, V.; Pappia, C. Life Cycle Assessment of Bean Production in the Prespa National Park, Greece. J. Clean. Prod. 2013, 41, 89–96. [Google Scholar] [CrossRef]
- Beccali, M.; Cellura, M.; Iudicello, M.; Mistretta, M. Resource Consumption and Environmental Impacts of the Agrofood Sector: Life Cycle Assessment of Italian Citrus-Based Products. Environ. Manag. 2009, 43, 707–724. [Google Scholar] [CrossRef] [PubMed]
- Blengini, G.A.; Busto, M. The Life Cycle of Rice: LCA of Alternative Agri-Food Chain Management Systems in Vercelli (Italy). J. Environ. Manag. 2009, 90, 1512–1522. [Google Scholar] [CrossRef] [PubMed]
- Garofalo, P.; D’Andrea, L.; Tomaiuolo, M.; Venezia, A.; Castrignanò, A. Environmental Sustainability of Agri-Food Supply Chains in Italy: The Case of the Whole-Peeled Tomato Production under Life Cycle Assessment Methodology. J. Food Eng. 2017, 200, 1–12. [Google Scholar] [CrossRef]
- Radzyminska, M.; Garbowska, B.; Jakubowska, D. Health Quality and Nutritional Value of Rye Bread Produced on a Small and Large Scale in Poland. Ital. J. Food Sci. 2013, 25, 126. [Google Scholar]
- Ingwersen, W.W. Life Cycle Assessment of Fresh Pineapple from Costa Rica. J. Clean. Prod. 2012, 35, 152–163. [Google Scholar] [CrossRef]
- Khoshnevisan, B.; Rafiee, S.; Omid, M.; Mousazadeh, H.; Clark, S. Environmental Impact Assessment of Tomato and Cucumber Cultivation in Greenhouses Using Life Cycle Assessment and Adaptive Neuro-Fuzzy Inference System. J. Clean. Prod. 2014, 73, 183–192. [Google Scholar] [CrossRef]
- Bojacá, C.R.; Wyckhuys, K.A.; Schrevens, E. Life Cycle Assessment of Colombian Greenhouse Tomato Production Based on Farmer-Level Survey Data. J. Clean. Prod. 2014, 69, 26–33. [Google Scholar] [CrossRef]
- Beccali, M.; Cellura, M.; Iudicello, M.; Mistretta, M. Life Cycle Assessment of Italian Citrus-Based Products. Sensitivity Analysis and Improvement Scenarios. J. Environ. Manag. 2010, 91, 1415–1428. [Google Scholar] [CrossRef]
- Contreras, A.M.; Rosa, E.; Pérez, M.; Van Langenhove, H.; Dewulf, J. Comparative Life Cycle Assessment of Four Alternatives for Using By-Products of Cane Sugar Production. J. Clean. Prod. 2009, 17, 772–779. [Google Scholar] [CrossRef]
- Hospido, A.; Milà i Canals, L.; McLaren, S.; Truninger, M.; Edwards-Jones, G.; Clift, R. The Role of Seasonality in Lettuce Consumption: A Case Study of Environmental and Social Aspects. Int. J. Life Cycle Assess. 2009, 14, 381–391. [Google Scholar] [CrossRef]
- Roy, P.; Nei, D.; Okadome, H.; Nakamura, N.; Orikasa, T.; Shiina, T. Life Cycle Inventory Analysis of Fresh Tomato Distribution Systems in Japan Considering the Quality Aspect. J. Food Eng. 2008, 86, 225–233. [Google Scholar] [CrossRef]
- Broek, R.; Treffers, D.-J.; Meeusen, M.; Wijk, A.; Nieuwlaar, E.; Turkenburg, W. Green Energy or Organic Food? A Life-Cycle Assessment Comparing Two Uses of Set-Aside Land. J. Ind. Ecol. 2001, 5, 65–87. [Google Scholar] [CrossRef]
- Masuda, K. Measuring Eco-Efficiency of Wheat Production in Japan: A Combined Application of Life Cycle Assessment and Data Envelopment Analysis. J. Clean. Prod. 2016, 126, 373–381. [Google Scholar] [CrossRef]
- Andersson, K.; Ohlsson, T.; Olsson, P. Screening Life Cycle Assessment (LCA) of Tomato Ketchup: A Case Study. J. Clean. Prod. 1998, 6, 277–288. [Google Scholar] [CrossRef]
- Choo, Y.M.; Muhamad, H.; Hashim, Z.; Subramaniam, V.; Puah, C.W.; Tan, Y. Determination of GHG Contributions by Subsystems in the Oil Palm Supply Chain Using the LCA Approach. Int. J. Life Cycle Assess. 2011, 16, 669–681. [Google Scholar] [CrossRef]
- Romero-Gámez, M.; Audsley, E.; Suárez-Rey, E.M. Life Cycle Assessment of Cultivating Lettuce and Escarole in Spain. J. Clean. Prod. 2014, 73, 193–203. [Google Scholar] [CrossRef]
- Girgenti, V.; Peano, C.; Bounous, M.; Baudino, C. A Life Cycle Assessment of Non-Renewable Energy Use and Greenhouse Gas Emissions Associated with Blueberry and Raspberry Production in Northern Italy. Sci. Total Environ. 2013, 458, 414–418. [Google Scholar] [CrossRef] [PubMed] [Green Version]
- Breiling, M.; Hoshino, T.; Matsuhashi, R. Contributions of Rice Production to Japanese Greenhouse Gas Emissions Applying Life Cycle Assessment as a Methodology; The University of Tokyo: Tokyo, Japan, 1999; p. 32. [Google Scholar]
- Kulak, M.; Graves, A.; Chatterton, J. Reducing Greenhouse Gas Emissions with Urban Agriculture: A Life Cycle Assessment Perspective. Landsc. Urban Plan. 2013, 111, 68–78. [Google Scholar] [CrossRef]
- Vinyes, E.; Asin, L.; Alegre, S.; Muñoz, P.; Boschmonart, J.; Gasol, C.M. Life Cycle Assessment of Apple and Peach Production, Distribution and Consumption in Mediterranean Fruit Sector. J. Clean. Prod. 2017, 149, 313–320. [Google Scholar] [CrossRef]
- Tabatabaie, S.M.H.; Murthy, G.S. Cradle to Farm Gate Life Cycle Assessment of Strawberry Production in the United States. J. Clean. Prod. 2016, 127, 548–554. [Google Scholar] [CrossRef] [Green Version]
- Li, X.; Mupondwa, E.; Panigrahi, S.; Tabil, L.; Adapa, P. Life Cycle Assessment of Densified Wheat Straw Pellets in the Canadian Prairies. Int. J. Life Cycle Assess. 2012, 17, 420–431. [Google Scholar] [CrossRef]
- Sahle, A.; Potting, J. Environmental Life Cycle Assessment of Ethiopian Rose Cultivation. Sci. Total Environ. 2013, 443, 163–172. [Google Scholar] [CrossRef]
- Payen, S.; Basset-Mens, C.; Perret, S. LCA of Local and Imported Tomato: An Energy and Water Trade-Off. J. Clean. Prod. 2015, 87, 139–148. [Google Scholar] [CrossRef]
- Roer, A.-G.; Korsaeth, A.; Henriksen, T.M.; Michelsen, O.; Strømman, A.H. The Influence of System Boundaries on Life Cycle Assessment of Grain Production in Central Southeast Norway. Agric. Syst. 2012, 111, 75–84. [Google Scholar] [CrossRef]
- Matsuura, M.I.S.F.; Dias, F.R.T.D.; Picoli, J.F.; Lucas, K.R.G.; de Castro, C.; Hirakuri, M.H. Life-Cycle Assessment of the Soybean-Sunflower Production System in the Brazilian Cerrado. Int. J. Life Cycle Assess. 2017, 22, 492–501. [Google Scholar] [CrossRef] [Green Version]
- Nemecek, T.; Von Richthofen, J.-S.; Dubois, G.; Casta, P.; Charles, R.; Pahl, H. Environmental Impacts of Introducing Grain Legumes into European Crop Rotations. Eur. J. Agron. 2008, 28, 380–393. [Google Scholar] [CrossRef]
- Martínez-Blanco, J.; Muñoz, P.; Antón, A.; Rieradevall, J. Assessment of Tomato Mediterranean Production in Open-Field and Standard Multi-Tunnel Greenhouse, with Compost or Mineral Fertilizers, from an Agricultural and Environmental Standpoint. J. Clean. Prod. 2011, 19, 985–997. [Google Scholar] [CrossRef]
- Meisterling, K.; Samaras, C.; Schweizer, V. Decisions to Reduce Greenhouse Gases from Agriculture and Product Transport: LCA Case Study of Organic and Conventional Wheat. J. Clean. Prod. 2009, 17, 222–230. [Google Scholar] [CrossRef]
- Canals, L.M.I.; Muñoz, I.; Hospido, A.; Plassmann, K.; McLaren, S.; Edwards-Jones, G.; Hounsome, B. Life cycle assessment (LCA) of domestic vs. imported vegetables. In Case Studies on Broccoli, Salad Crops and Green Beans; In RELU Project REW-224-25-0044; Centre for Environmental Strategy, University of Surrey: Guildford, UK, 2008. [Google Scholar]
- Aguilera, E.; Guzmán, G.; Alonso, A. Greenhouse Gas Emissions from Conventional and Organic Cropping Systems in Spain. II. Fruit Tree Orchards. Agron. Sustain. Dev. 2015, 35, 725–737. [Google Scholar] [CrossRef] [Green Version]
- Dwivedi, P.; Spreen, T.; Goodrich-Schneider, R. Global Warming Impact of Florida’s Not-From-Concentrate (NFC) Orange Juice. Agric. Syst. 2012, 108, 104–111. [Google Scholar] [CrossRef]
- Girgenti, V.; Peano, C.; Baudino, C.; Tecco, N. From “Farm to Fork” Strawberry System: Current Realities and Potential Innovative Scenarios from Life Cycle Assessment of Non-Renewable Energy Use and Green House Gas Emissions. Sci. Total Environ. 2014, 473, 48–53. [Google Scholar] [CrossRef] [PubMed]
- Lazzerini, G.; Lucchetti, S.; Nicese, F.P. Green House Gases(GHG) Emissions from the Ornamental Plant Nursery Industry: A Life Cycle Assessment(LCA) Approach in a Nursery District in Central Italy. J. Clean. Prod. 2016, 112, 4022–4030. [Google Scholar] [CrossRef]
- Mohseni, P.; Borghei, A.M.; Khanali, M. Coupled Life Cycle Assessment and Data Envelopment Analysis for Mitigation of Environmental Impacts and Enhancement of Energy Efficiency in Grape Production. J. Clean. Prod. 2018, 197, 937–947. [Google Scholar] [CrossRef]
- Milà i Canals, L.; Burnip, G.M.; Cowell, S.J. Evaluation of the Environmental Impacts of Apple Production Using Life Cycle Assessment (LCA): Case Study in New Zealand. Agric. Ecosyst. Environ. 2006, 114, 226–238. [Google Scholar] [CrossRef]
- Steenwerth, K.L.; Strong, E.B.; Greenhut, R.F.; Williams, L.; Kendall, A. Life Cycle Greenhouse Gas, Energy, and Water Assessment of Wine Grape Production in California. Int. J. Life Cycle Assess. 2015, 20, 1243–1253. [Google Scholar] [CrossRef]
- Langevin, B.; Basset-Mens, C.; Lardon, L. Inclusion of the Variability of Diffuse Pollutions in LCA for Agriculture: The Case of Slurry Application Techniques. J. Clean. Prod. 2010, 18, 747–755. [Google Scholar] [CrossRef]
- Brentrup, F.; Küsters, J.; Kuhlmann, H.; Lammel, J. Application of the Life Cycle Assessment Methodology to Agricultural Production: An Example of Sugar Beet Production with Different Forms of Nitrogen Fertilisers. Eur. J. Agron. 2001, 14, 221–233. [Google Scholar] [CrossRef]
- Nemecek, T.; Erzinger, S. Modelling Representative Life Cycle Inventories for Swiss Arable Crops (9 Pp). Int. J. Life Cycle Assess. 2005, 10, 68–76. [Google Scholar] [CrossRef]
- Krzyżaniak, M.; Stolarski, M.J.; Warmiński, K. Life Cycle Assessment of Poplar Production: Environmental Impact of Different Soil Enrichment Methods. J. Clean. Prod. 2019, 206, 785–796. [Google Scholar] [CrossRef]
- Lebailly, F.; Levasseur, A.; Samson, R.; Deschênes, L. Development of a Dynamic LCA Approach for the Freshwater Ecotoxicity Impact of Metals and Application to a Case Study Regarding Zinc Fertilization. Int. J. Life Cycle Assess. 2014, 19, 1745–1754. [Google Scholar] [CrossRef]
- Mouron, P.; Nemecek, T.; Scholz, R.W.; Weber, O. Management Influence on Environmental Impacts in an Apple Production System on Swiss Fruit Farms: Combining Life Cycle Assessment with Statistical Risk Assessment. Agric. Ecosyst. Environ. 2006, 114, 311–322. [Google Scholar] [CrossRef]
- Khanali, M.; Shahvarooghi Farahani, S.; Shojaei, H.; Elhami, B. Life Cycle Environmental Impacts of Saffron Production in Iran. Environ. Sci. Pollut. Res. Int. 2017, 24, 4812–4821. [Google Scholar] [CrossRef] [PubMed] [Green Version]
- Andrianandraina; Ventura, A.; Senga Kiessé, T.; Cazacliu, B.; Idir, R.; Werf, H.M.G. Sensitivity Analysis of Environmental Process Modeling in a Life Cycle Context: A Case Study of Hemp Crop Production. J. Ind. Ecol. 2015, 19, 978–993. [Google Scholar] [CrossRef]
- Abeliotis, K.; Barla, S.-A.; Detsis, V.; Malindretos, G. Life Cycle Assessment of Carnation Production in Greece. J. Clean. Prod. 2016, 112, 32–38. [Google Scholar] [CrossRef]
- Deytieux, V.; Nemecek, T.; Freiermuth Knuchel, R.; Gaillard, G.; Munier-Jolain, N.M. Is Integrated Weed Management Efficient for Reducing Environmental Impacts of Cropping Systems? A Case Study Based on Life Cycle Assessment. Eur. J. Agron. 2012, 36, 55–65. [Google Scholar] [CrossRef]
- Peña, N.; Knudsen, M.T.; Fantke, P.; Antón, A.; Hermansen, J.E. Freshwater Ecotoxicity Assessment of Pesticide Use in Crop Production: Testing the Influence of Modeling Choices. J. Clean. Prod. 2019, 209, 1332–1341. [Google Scholar] [CrossRef]
- Xue, X.; Hawkins, T.R.; Ingwersen, W.W.; Smith, R.L. Demonstrating an Approach for Including Pesticide Use in Life-Cycle Assessment: Estimating Human and Ecosystem Toxicity of Pesticide Use in Midwest Corn Farming. Int. J. Life Cycle Assess. 2015, 20, 1117–1126. [Google Scholar] [CrossRef]
- Juraske, R.; Sanjuán, N. Life Cycle Toxicity Assessment of Pesticides Used in Integrated and Organic Production of Oranges in the Comunidad Valenciana, Spain. Chemosphere 2011, 82, 956–962. [Google Scholar] [CrossRef]
- Khoshnevisan, B.; Bolandnazar, E.; Shamshirband, S.; Shariati, H.M.; Anuar, N.B.; Mat Kiah, M.L. Decreasing Environmental Impacts of Cropping Systems Using Life Cycle Assessment (LCA) and Multi-Objective Genetic Algorithm. J. Clean. Prod. 2015, 86, 67–77. [Google Scholar] [CrossRef]
- Schmidt Rivera, X.C.; Bacenetti, J.; Fusi, A.; Niero, M. The Influence of Fertiliser and Pesticide Emissions Model on Life Cycle Assessment of Agricultural Products: The Case of Danish and Italian Barley. Sci. Total Environ. 2017, 592, 745–757. [Google Scholar] [CrossRef] [PubMed] [Green Version]
- Brodt, S.; Kramer, K.J.; Kendall, A.; Feenstra, G. Comparing Environmental Impacts of Regional and National-Scale Food Supply Chains: A Case Study of Processed Tomatoes. Food Policy 2013, 42, 106–114. [Google Scholar] [CrossRef]
- Theurl, M.C.; Haberl, H.; Erb, K.-H.; Lindenthal, T. Contrasted Greenhouse Gas Emissions from Local versus Long-Range Tomato Production. Agron. Sustain. Dev. 2014, 34, 593–602. [Google Scholar] [CrossRef] [Green Version]
- Iriarte, A.; Rieradevall, J.; Gabarrell, X. Life Cycle Assessment of Sunflower and Rapeseed as Energy Crops under Chilean Conditions. J. Clean. Prod. 2010, 18, 336–345. [Google Scholar] [CrossRef]
- Schmidt, J.H. Comparative Life Cycle Assessment of Rapeseed Oil and Palm Oil. Int. J. Life Cycle Assess. 2010, 15, 183–197. [Google Scholar] [CrossRef]
- Noya, I.; González-García, S.; Bacenetti, J.; Arroja, L.; Moreira, M.T. Comparative Life Cycle Assessment of Three Representative Feed Cereals Production in the Po Valley (Italy). J. Clean. Prod. 2015, 99, 250–265. [Google Scholar] [CrossRef]
- Nemecek, T.; Kägi, T. Life Cycle Inventories of Agricultural Production Systems. Final Rep. Ecoinvent 2007, 361. [Google Scholar] [CrossRef]
- Antón, A.; Torrellas, M.; Núñez, M.; Sevigné, E.; Amores, M.J.; Muñoz, P.; Montero, J.I. Improvement of Agricultural Life Cycle Assessment Studies through Spatial Differentiation and New Impact Categories: Case Study on Greenhouse Tomato Production. Environ. Sci. Technol. 2014, 48, 9454–9462. [Google Scholar] [CrossRef] [PubMed]
- Shrestha, P.; Karim, R.A.; Sieverding, H.L.; Archer, D.W.; Kumar, S.; Nleya, T.; Graham, C.J.; Stone, J.J. Life Cycle Assessment of Wheat Production and Wheat-Based Crop Rotations. J. Environ. Qual. 2020, 49, 1515–1529. [Google Scholar] [CrossRef] [PubMed]
- Gentil, C.; Basset-Mens, C.; Manteaux, S.; Mottes, C.; Maillard, E.; Biard, Y.; Fantke, P. Coupling Pesticide Emission and Toxicity Characterization Models for LCA: Application to Open-Field Tomato Production in Martinique. J. Clean. Prod. 2020, 277, 124099. [Google Scholar] [CrossRef]
- Brentrup, F.; Küsters, J.; Kuhlmann, H.; Lammel, J. Environmental Impact Assessment of Agricultural Production Systems Using the Life Cycle Assessment Methodology. Eur. J. Agron. 2004, 20, 247–264. [Google Scholar] [CrossRef]
- Salomone, R.; Ioppolo, G. Environmental Impacts of Olive Oil Production: A Life Cycle Assessment Case Study in the Province of Messina (Sicily). J. Clean. Prod. 2012, 28, 88–100. [Google Scholar] [CrossRef]
- Peano, C.; Baudino, C.; Tecco, N.; Girgenti, V. Green Marketing Tools for Fruit Growers Associated Groups: Application of the Life Cycle Assessment (LCA) for Strawberries and Berry Fruits Ecobranding in Northern Italy. J. Clean. Prod. 2015, 104, 59–67. [Google Scholar] [CrossRef]


Publisher’s Note: MDPI stays neutral with regard to jurisdictional claims in published maps and institutional affiliations. |
© 2021 by the authors. Licensee MDPI, Basel, Switzerland. This article is an open access article distributed under the terms and conditions of the Creative Commons Attribution (CC BY) license (https://creativecommons.org/licenses/by/4.0/).
Share and Cite
Alhashim, R.; Deepa, R.; Anandhi, A. Environmental Impact Assessment of Agricultural Production Using LCA: A Review. Climate 2021, 9, 164. https://doi.org/10.3390/cli9110164
Alhashim R, Deepa R, Anandhi A. Environmental Impact Assessment of Agricultural Production Using LCA: A Review. Climate. 2021; 9(11):164. https://doi.org/10.3390/cli9110164
Chicago/Turabian StyleAlhashim, Rahmah, Raveendranpillai Deepa, and Aavudai Anandhi. 2021. "Environmental Impact Assessment of Agricultural Production Using LCA: A Review" Climate 9, no. 11: 164. https://doi.org/10.3390/cli9110164
APA StyleAlhashim, R., Deepa, R., & Anandhi, A. (2021). Environmental Impact Assessment of Agricultural Production Using LCA: A Review. Climate, 9(11), 164. https://doi.org/10.3390/cli9110164