1. Introduction
Financial markets are intricately linked, and fluctuations in one market may rapidly propagate across borders, influencing neighboring countries and markets in a process termed volatility spillover (
Diebold & Yilmaz, 2009;
Engle et al., 2012a). As capital flows and trade continue to globalize, the G20 nations, accounting for more than 85% of global GDP, have emerged as crucial influencers in global financial dynamics (
IMF, 2020;
World Bank, 2021). Comprehending the manifestation of volatility spillovers across these countries is essential, particularly during periods of severe economic turmoil and geopolitical instability. In the last twenty years, the world has experienced significant shocks, particularly the Global Financial Crisis of 2008, the European Sovereign Debt Crisis, the COVID-19 pandemic, and the ongoing Russia-Ukraine War, all of which have profoundly impacted global financial markets (
Reinhart & Rogoff, 2009;
Lane, 2012;
Baker et al., 2020;
Goodell, 2020).
The 2008 Global Financial Crisis stemmed from the failure of the subprime mortgage market in the United States, rapidly evolving into a worldwide financial catastrophe (
Brunnermeier, 2009;
Acharya & Richardson, 2009). This crisis interrupted global credit flows, diminished investor confidence, and markedly heightened financial market volatility (
Longstaff, 2010;
Ehrmann et al., 2011). Research indicates that throughout this timeframe, volatility spillovers across G20 stock markets accelerated, with developed nations assuming a more prominent role in shock transmission (
Diebold & Yilmaz, 2012;
Borri & Shakhnov, 2020). Subsequently, the European Debt Crisis from 2010 to 2012, instigated by excessive sovereign borrowing and structural disparities, especially in Greece, Portugal, Spain, and Italy, rekindled concerns of contagion inside the Eurozone (
Lane, 2012;
Aizenman et al., 2013). This crisis resulted in the decoupling and recoupling of volatility transmission patterns throughout the G20, especially between European and non-European markets (
J. Wang et al., 2024;
Beirne & Fratzscher, 2013).
The emergence of COVID-19 in late 2019 initiated a new kind of disruption, characterized by pervasive uncertainty, lockdowns, and supply chain interruptions (
D. Zhang et al., 2020;
H. Liu et al., 2020;
Narayan, 2020). Financial markets exhibited extraordinary volatility, characterized by abrupt declines and swift recoveries driven by pandemic-related policy interventions (
Albulescu, 2020;
Sharif et al., 2020). Studies reveal that during COVID-19, the trajectory and intensity of volatility spillovers fluctuated regularly, with developing markets exhibiting heightened sensitivity to global shocks (
Zaremba et al., 2020). Furthermore, the variability in policy responses across the G20—spanning from assertive monetary easing to fiscal stimulus—further affected volatility transmission (
Ashraf, 2020;
Fernandes, 2020).
The Russia-Ukraine War, initiated in February 2022, has introduced additional layers of geopolitical and energy-related insecurity. The conflict impacted international commodity markets, particularly oil and food supply, resulting in repercussions across financial and currency markets (
L. Zhang et al., 2024). The G20 nations, owing to their diverse economic connections with Russia and Ukraine, have seen asymmetrical volatility spillovers (
Yang et al., 2023;
Hossain et al., 2024). European markets, owing to their energy reliance on Russia, exhibited more volatility compared to more insulated economies such as Australia or Brazil (
Xue et al., 2024).
This research aims to analyze the type, direction, and degree of volatility spillovers across G20 stock markets throughout these four pivotal periods. Although previous research has examined spillovers during specific crises (e.g.,
Diebold & Yilmaz, 2014;
Yarovaya et al., 2022), a comparative assessment including all significant crises of the past two decades is still scarce. Moreover, the structural disruptions caused by these occurrences need a dynamic framework for the analysis of volatility transmission (
Baruník & Křehlík, 2018;
Yi et al., 2018). This study seeks to address this deficiency by utilizing a robust econometric model, specifically the TVP VAR BK, which captures both time-varying and frequency-dependent spillovers, thus enhancing the literature on systemic risk, portfolio diversification, and macro-financial stability (
Kaminsky & Reinhart, 2000;
Forbes & Rigobon, 2002;
Antonakakis & Gabauer, 2017).
Despite extensive research on volatility spillovers during individual crisis periods, there remains a significant gap in the literature regarding a comprehensive and comparative analysis of spillover dynamics across multiple major crises using advanced time-varying methodologies (
Anand K & Mishra, 2023;
Padmasree, 2023). Most existing studies focus on specific crisis periods or employ static methodologies that fail to capture the evolving nature of financial market interconnections (
Guru & Yadav, 2023;
Kubitza, 2021). The existing literature has several limitations that this research addresses. First, many studies rely on rolling window approaches that suffer from arbitrary parameter choices and loss of observations. Second, most research focuses on time-domain analysis, missing the frequency-specific characteristics of spillover transmission (
Zhao et al., 2023). Third, comparative analysis across multiple crisis periods using consistent methodological frameworks remains limited. Furthermore, while individual studies have examined volatility spillovers during the global financial crisis, European debt crisis, COVID-19 pandemic, and Russia-Ukraine conflict, no comprehensive study has systematically compared spillover patterns across all these major crises using the advanced TVP-VAR Barunik-Krehlik methodology.
The remainder of the paper is structured as follows:
Section 2 reviews the related literature on volatility spillovers and market interconnectedness during crisis periods.
Section 3 details the data sources, sample period, and econometric methodologies employed, including the rationale for frequency-domain analysis.
Section 4 presents and analyzes the empirical results, highlighting total and directional spillovers as well as frequency decomposition across crisis events.
Section 5 concludes the paper, summarizes the main contributions, and suggests avenues for future research in the evolving landscape of global financial integration.
Section 6 discusses the practical implications for policymakers, investors, and regulators, especially regarding risk management, portfolio diversification, and systemic risk monitoring.
2. Literature Review
In this section, we have discussed the existing body of literature on volatility spillover among international markets. Numerous studies have previously examined how different crises, such as economic crisis, climate risks, COVID crisis, geopolitical risks, etc., have affected the volatility spillover for market and sectoral indices (
L. Zhang et al., 2024;
Shu et al., 2025;
W. P. Chen et al., 2025;
Karkowska & Urjasz, 2025). Volatility spillovers refer to the effect that the occurrence of an event in one market may have on the volatility of other markets (
Naeem et al., 2023). The transmission of crises resulting from economic interconnectedness through real and financial linkages causes volatility spillover (
Kaminsky & Reinhart, 1998). Other factors that contribute to the spread of crises include market imperfections or the activities of foreign investors (
Kodres & Pritsker, 2002).
Müller et al. (
1997) assert that in a heterogeneous market, different types of traders or investors exhibit distinct behaviours and contribute to the volatility of different time resolutions. They concluded that long-term volatility is a stronger predictor of short-term volatility and that investors with varying time horizons have unequal information flow.
Janakiramanan and Lamba (
2000) showed that markets with a high number of cross-listings or those that are geographically and economically close to each other influence their neighboring markets. According to
Johansson and Ljungwall (
2009), there was a substantial spillover effect and interdependence among China’s three stock markets.
Furthermore, several scholars argued that the appearance and interconnectedness of volatility and illiquidity in equity markets worldwide appear to have been significantly influenced by the US market and the global financial crisis (
Li & Giles, 2015;
Tsai, 2014). According to
Diebold and Yilmaz (
2012), the stock market’s diverse range of participants, each with their own short-term or long-term goals, may cause the time-domain spillover across various frequencies to be uneven. In both the short and long term,
Li and Giles (
2015) discovered strong transmission of unidirectional shock spillovers from the US stock market to the Japanese and Asian emerging stock markets. They added that there are significant bidirectional volatility spillovers between the US and Asian markets because of the Asian financial crisis. Similarly, during the US subprime financial crisis, they discovered notable bidirectional shock spillovers between the Asian emerging markets and the Japanese market. According to
Tsai (
2014), there were significant spillover effects in the US markets for the period prior to 1997, the dot-com bubble collapse from 2000 to 2002, the subprime mortgage crisis, and the bankruptcy of Lehman Brothers from 2007 to 2008. Additionally, they claimed that strong net spillover is caused by investor attitude, such as an increase in the fear index.
Tsai (
2014) asserts that the US market facilitates the diffusion of information that improves other stock markets. However, depending on the other circumstances, such as the dissemination of information about monetary policy, personal income, or the unemployment rate, the impact of US spillovers differs. Also,
Copeland et al. (
2017) discovered that the volatility index (VIX)change had an impact on the cross-sectional returns of different stock types based on market capitalisation, with large-cap companies being more strongly impacted than others.
Forbes and Rigobon (
2002),
Gallo and Otranto (
2008),
Diebold and Yilmaz (
2009),
Engle et al. (
2012b),
Shu et al. (
2025), and
W. P. Chen et al. (
2025) are just a few of the several studies that have found significant and noteworthy spillovers of cross-market volatility using GARCH, VAR, or MEM. Additionally, several researchers have previously used the methodology of
Diebold and Yilmaz (
2012) and
Baruník and Křehlík (
2018) to find volatility spillover among various bonds, stocks, and commodities markets, including
Baruník et al. (
2016),
Ferrer et al. (
2018),
D. Zhang and Broadstock (
2020),
Jena et al. (
2021),
W. P. Chen et al. (
2025).
Karkowska and Urjasz (
2025), using the methodology of
Diebold and Yilmaz (
2012;
2014) and
Baruník and Křehlík (
2018), demonstrated that the geopolitical risk of the COVID-19 pandemic and the conflict in Ukraine caused volatility spillover from the US and developed European stock markets to the Asia-Pacific and emerging European stock markets.
Shu et al. (
2025) and
W. P. Chen et al. (
2025) indicated a significant effect of climate disasters on Chinese stock market volatility and cryptocurrency liquidity spillover effects.
Shu et al. (
2025) using the TVPVAR-DY model stated that climate risk suppresses China’s trade policy uncertainty, increases geopolitical risk, risk aversion, and climate risk concern, resulting in stock market risk spillovers.
W. P. Chen et al. (
2025) applied advanced wavelet analysis and causality methods and found that both the climate risks and transition risk lead to changes in investors’ expectations and have strong associations with volatility in energy stock markets.
Jebabli et al. (
2022) examined time-varying volatility spillovers between energy and stock markets because of the global financial crisis of 2008 and the ongoing COVID-19 pandemic crisis using a generalised vector autoregressive paradigm. Both crises exhibited significant distinctions even if they have many commonalities, including economic decline, uncertainty, and the responses of monetary and fiscal authorities. They stated that the COVID-19 pandemic crisis saw a significant increase in volatility spillovers between the energy and stock markets, surpassing the global financial crisis of 2007–2008.
Jena et al. (
2021) studied the spillover impact between different stock categories and discovered that there are different short- and long-term spillover effects among financial variables due to variations in shock frequency responses.
He et al. (
2020) used Mann-Whitney tests and traditional t-tests to assess the impact of COVID-19 on daily stock market returns and discovered a negative spillover effect on stock market returns. Further,
Yousef (
2020), using GARCH and GJR-GARCH models, found that COVID-19 has caused the primary G7 stock to experience more stock market volatility. They claimed that the GARCH effect estimates were higher than the ARCH effect estimates, indicating that the current levels of volatility will continue to have an influence for a longer period of time.
In an inter-asset setting,
Maghyereh et al. (
2019) examined the frequency domain connectivity between gold, Islamic bonds (Sukuk), and Islamic equity. They discovered that there was low short-term volatility spillover between gold and Islamic assets.
D. Zhang and Broadstock (
2020) discovered that the global financial crisis of 2008 demonstrated the interconnectedness among different international markets and their significant influence on the global economic system. In their study, they exhibited that short-term transitory and long-term fundamental factors were equally affected by the high level of volatility in seven commodity markets generated by the risk stemming from the financial crisis. They found that although changes in oil prices were explained by the financial system, the financial sector was only marginally affected by the oil shock.
Tiwari et al. (
2018) examined the type of spillover in the temporal and frequency domains for four global asset classes: stocks, sovereign bonds, currency, and credit default swaps (CDS). They argued that whereas equities and CDS markets were net volatility transmitters, volatility spillover among the four asset classes was more pronounced in the short term.
Baruník et al. (
2016) found asymmetric volatility spillover among 21 highest capitalization equities from different sectors using a vector autoregressive framework. Also, Crude oil prices, US stock prices, clean energy companies, and some significant financial variables, such as the VIX, the yield on US Treasury 10-year bonds, and the treasury yield VIX, all experienced volatility spillover (
Ferrer et al., 2018).
Ferrer et al. (
2018) stated that price fluctuations were most noticeable during the short term, but the effects subsided over time.
In conclusion, increased uncertainty and crisis events like the global crisis of 2007–2009, the COVID-19 crisis, the conflict between Russia and Ukraine, etc., necessitate regular and proactive measures to study the relationship between the various crises and systemic risk caused by them, affecting various financial markets or economies.
4. Empirical Result
This section analyzes the volatility spillover patterns among G20 nations using the Time-Varying Parameter Vector Autoregressive (TVP-VAR) model with frequency decomposition, as introduced by
Baruník and Křehlík (
2018). This analysis encompasses four significant global crises, namely the GFC 2008, the EDC, the COVID-19 pandemic, and the Russia-Ukraine war, providing a thorough temporal and spectral examination of financial interconnectedness. The model facilitates a detailed analysis of market responses by categorizing spillovers into short-term and long-term components, allowing for the exploration of their evolution across various frequencies and crisis episodes. The findings are presented using the TCI and net spillover metrics, enabling a comparative analysis of each country’s function as a transmitter or recipient of volatility over time. This section presents findings and emphasizes significant changes in contagion patterns across each crisis period.
Table 2 describes the descriptive statistics of G20 nations during the four major crisis periods, namely the Russia-Ukraine crisis, the COVID-19 pandemic, the GFC, and the EDC. Throughout the Russia-Ukraine War, the majority of nations experienced modest yet predominantly favorable mean returns, signifying slight market resilience. Nevertheless, rising economies like Russia, Argentina, and Turkey exhibited considerable volatility and negative skewness, indicating heightened uncertainty and downside risk. Increased kurtosis in nations such as India and Turkey signifies fat-tailed distributions, implying the potential for severe returns. The COVID-19 Pandemic caused significant volatility in both developed and emerging markets. Negative skewness and elevated kurtosis in numerous countries, particularly in Russia and India, indicate substantial downside risks and recurrent extreme return occurrences. Notwithstanding these risks, average returns were somewhat positive for numerous industrialized nations, signifying a modest rebound amidst instability. The Global Financial Crisis of 2008 exerted the most profound and coordinated global effects. Almost all nations encountered adverse mean returns and increased standard deviations, particularly in Argentina, Brazil, and Germany. The pervasive negative skewness and elevated kurtosis in nations such as Russia and India indicate a prevalent propensity for significant negative shocks and substantial tail risk throughout this timeframe.
Based on the
Baruník and Křehlík (
2018) methodology,
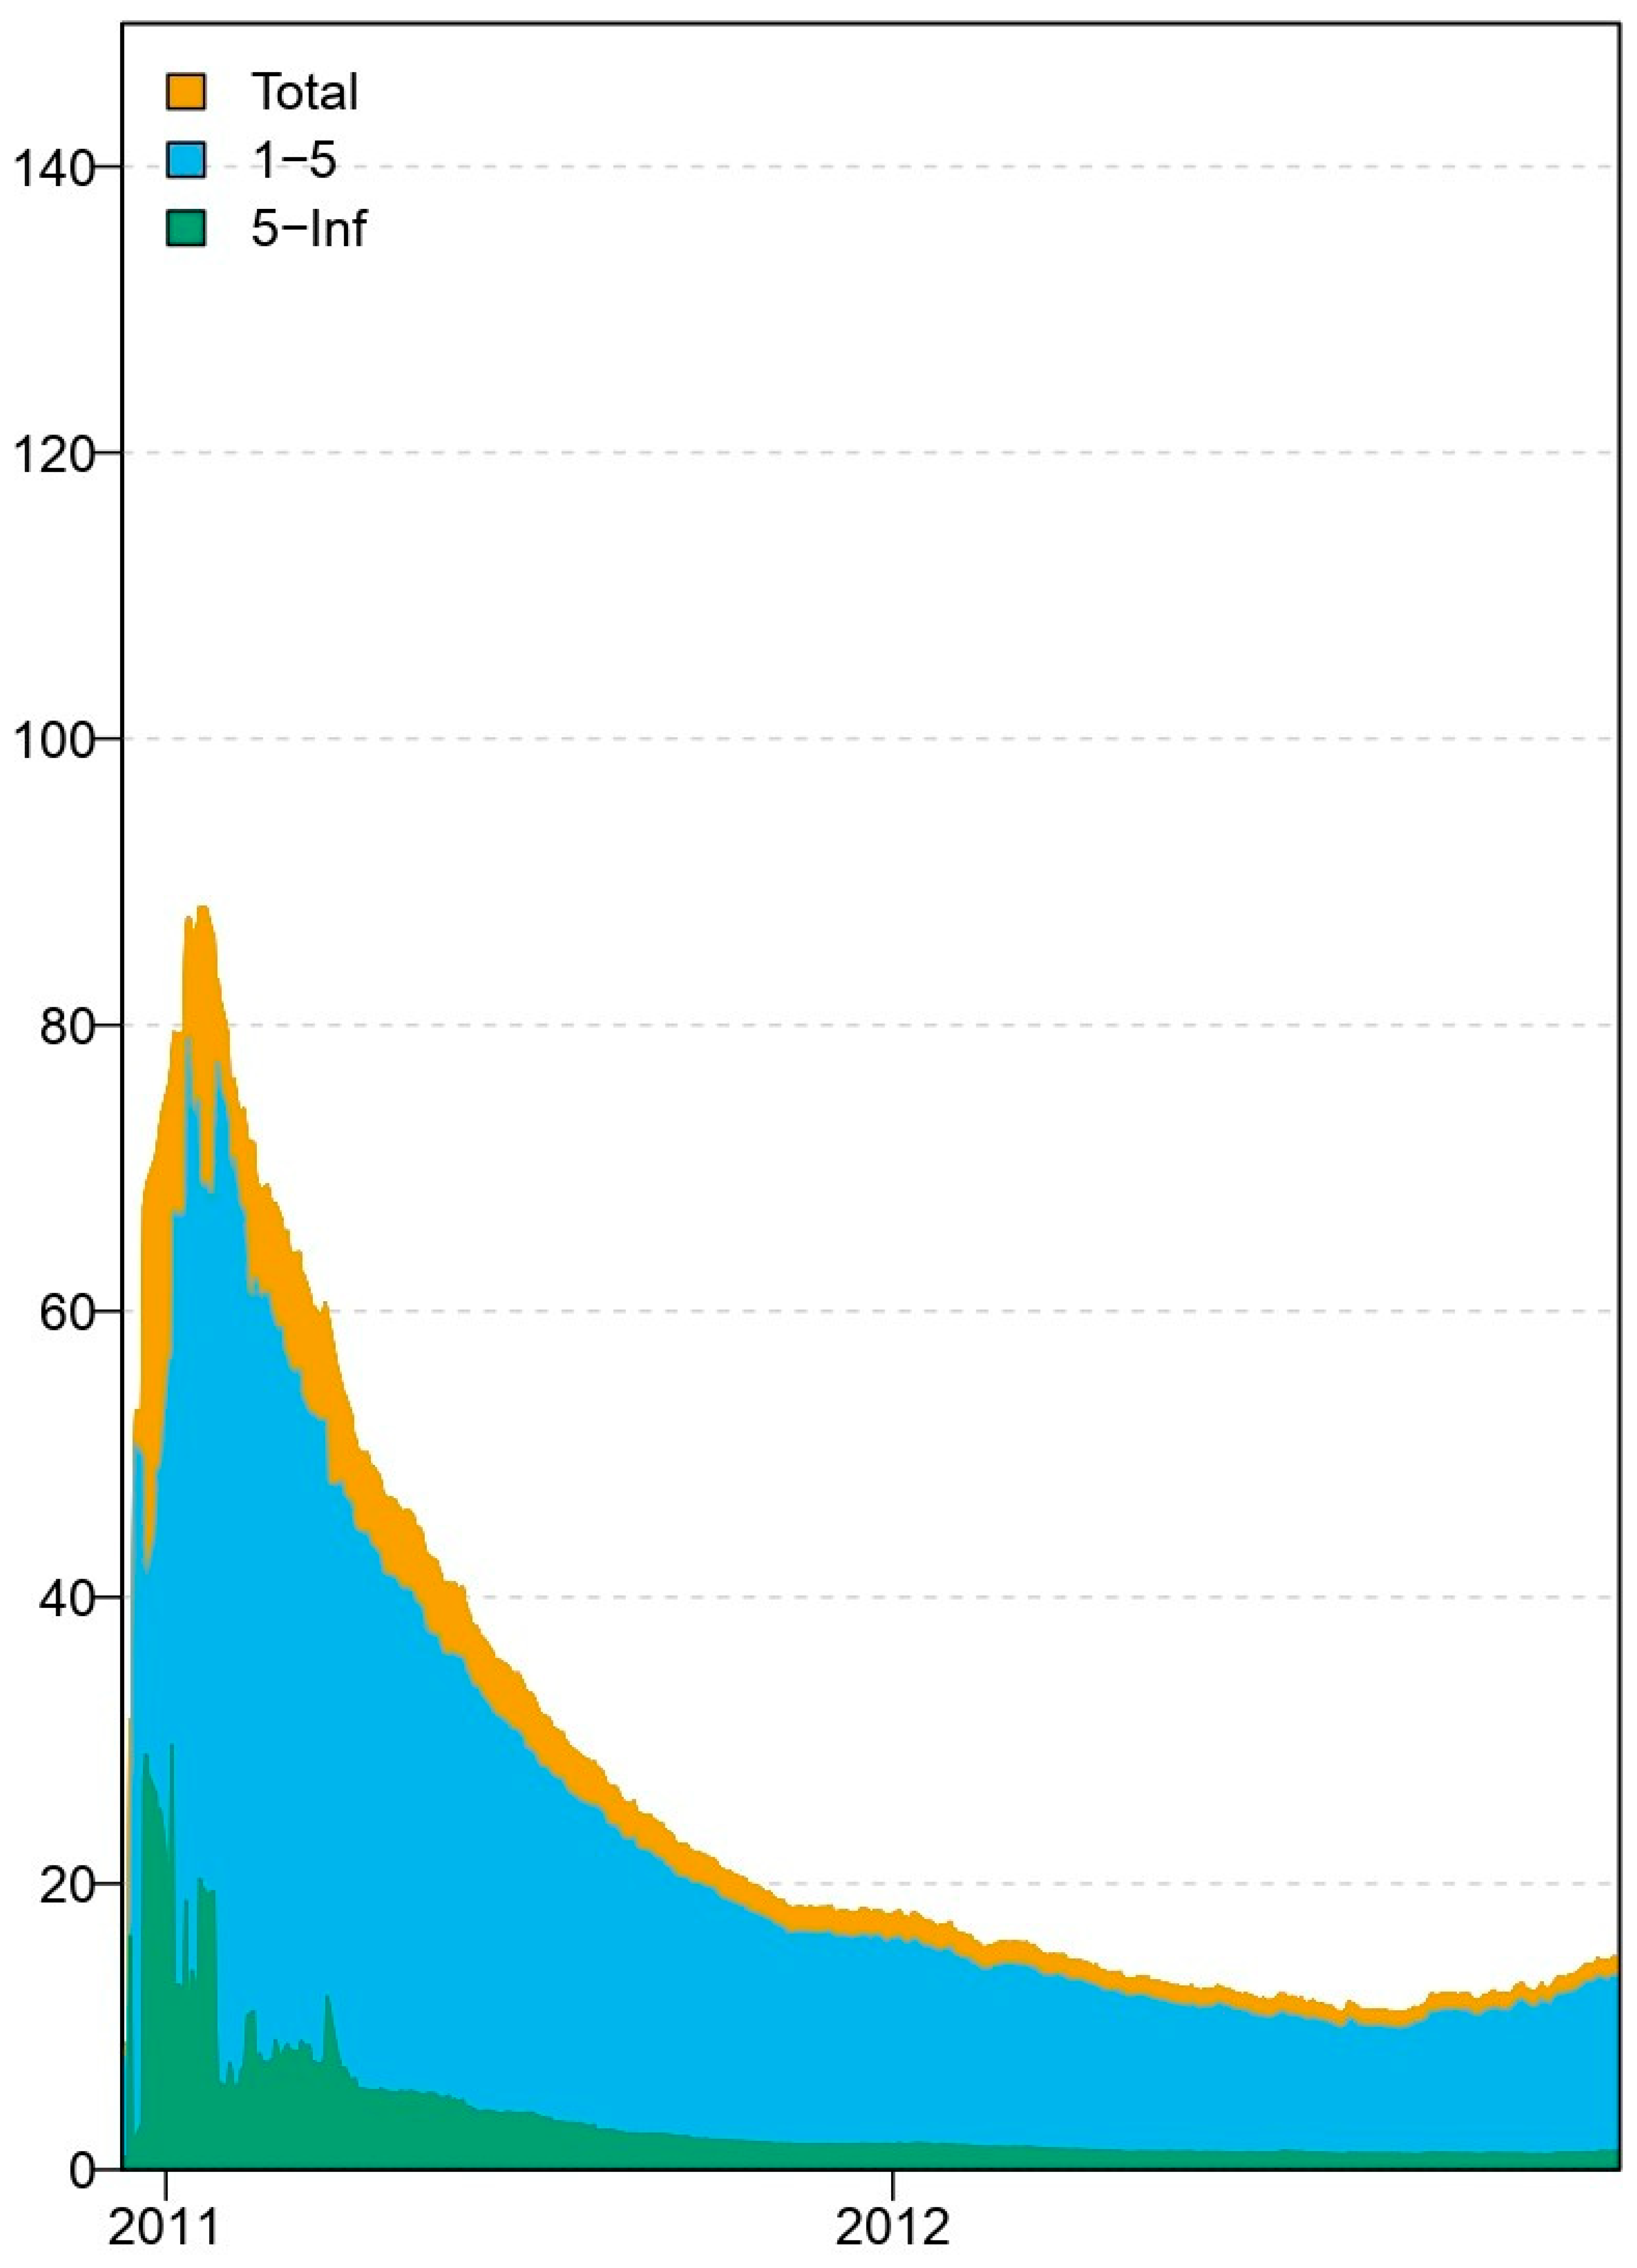
Table 3 presents the return spillover at 1–5 (short-term) and 5–Inf (long-term) frequencies during the European debt crisis (EDC). “TO” shows the extent to which each country transmits volatility shocks to other countries, whereas the “FROM” column reveals the degree to which each country receives volatility spillover from others. The “NET” shows the difference between the “TO” row and the “FROM” column, representing a country that is a net transmitter (positive values) or net receiver (negative) of volatility shocks, respectively. Moreover, the total connectedness index (TCI) is also reported, indicating how integrated the markets were during the crisis period. The TCI value of 23.98% (short term) implies that during the EDC, approximately one-quarter of the volatility in G20 markets was driven by cross-country shocks, indicating moderate financial integration and spillover effects among these economies. Thus, the remaining 76.02% of the variation is explained by own-country effects, i.e., internal market dynamics. Conversely, the TCI value decreases to 3.44% in the long term, implying a low degree of financial integration at 5–Inf frequency.
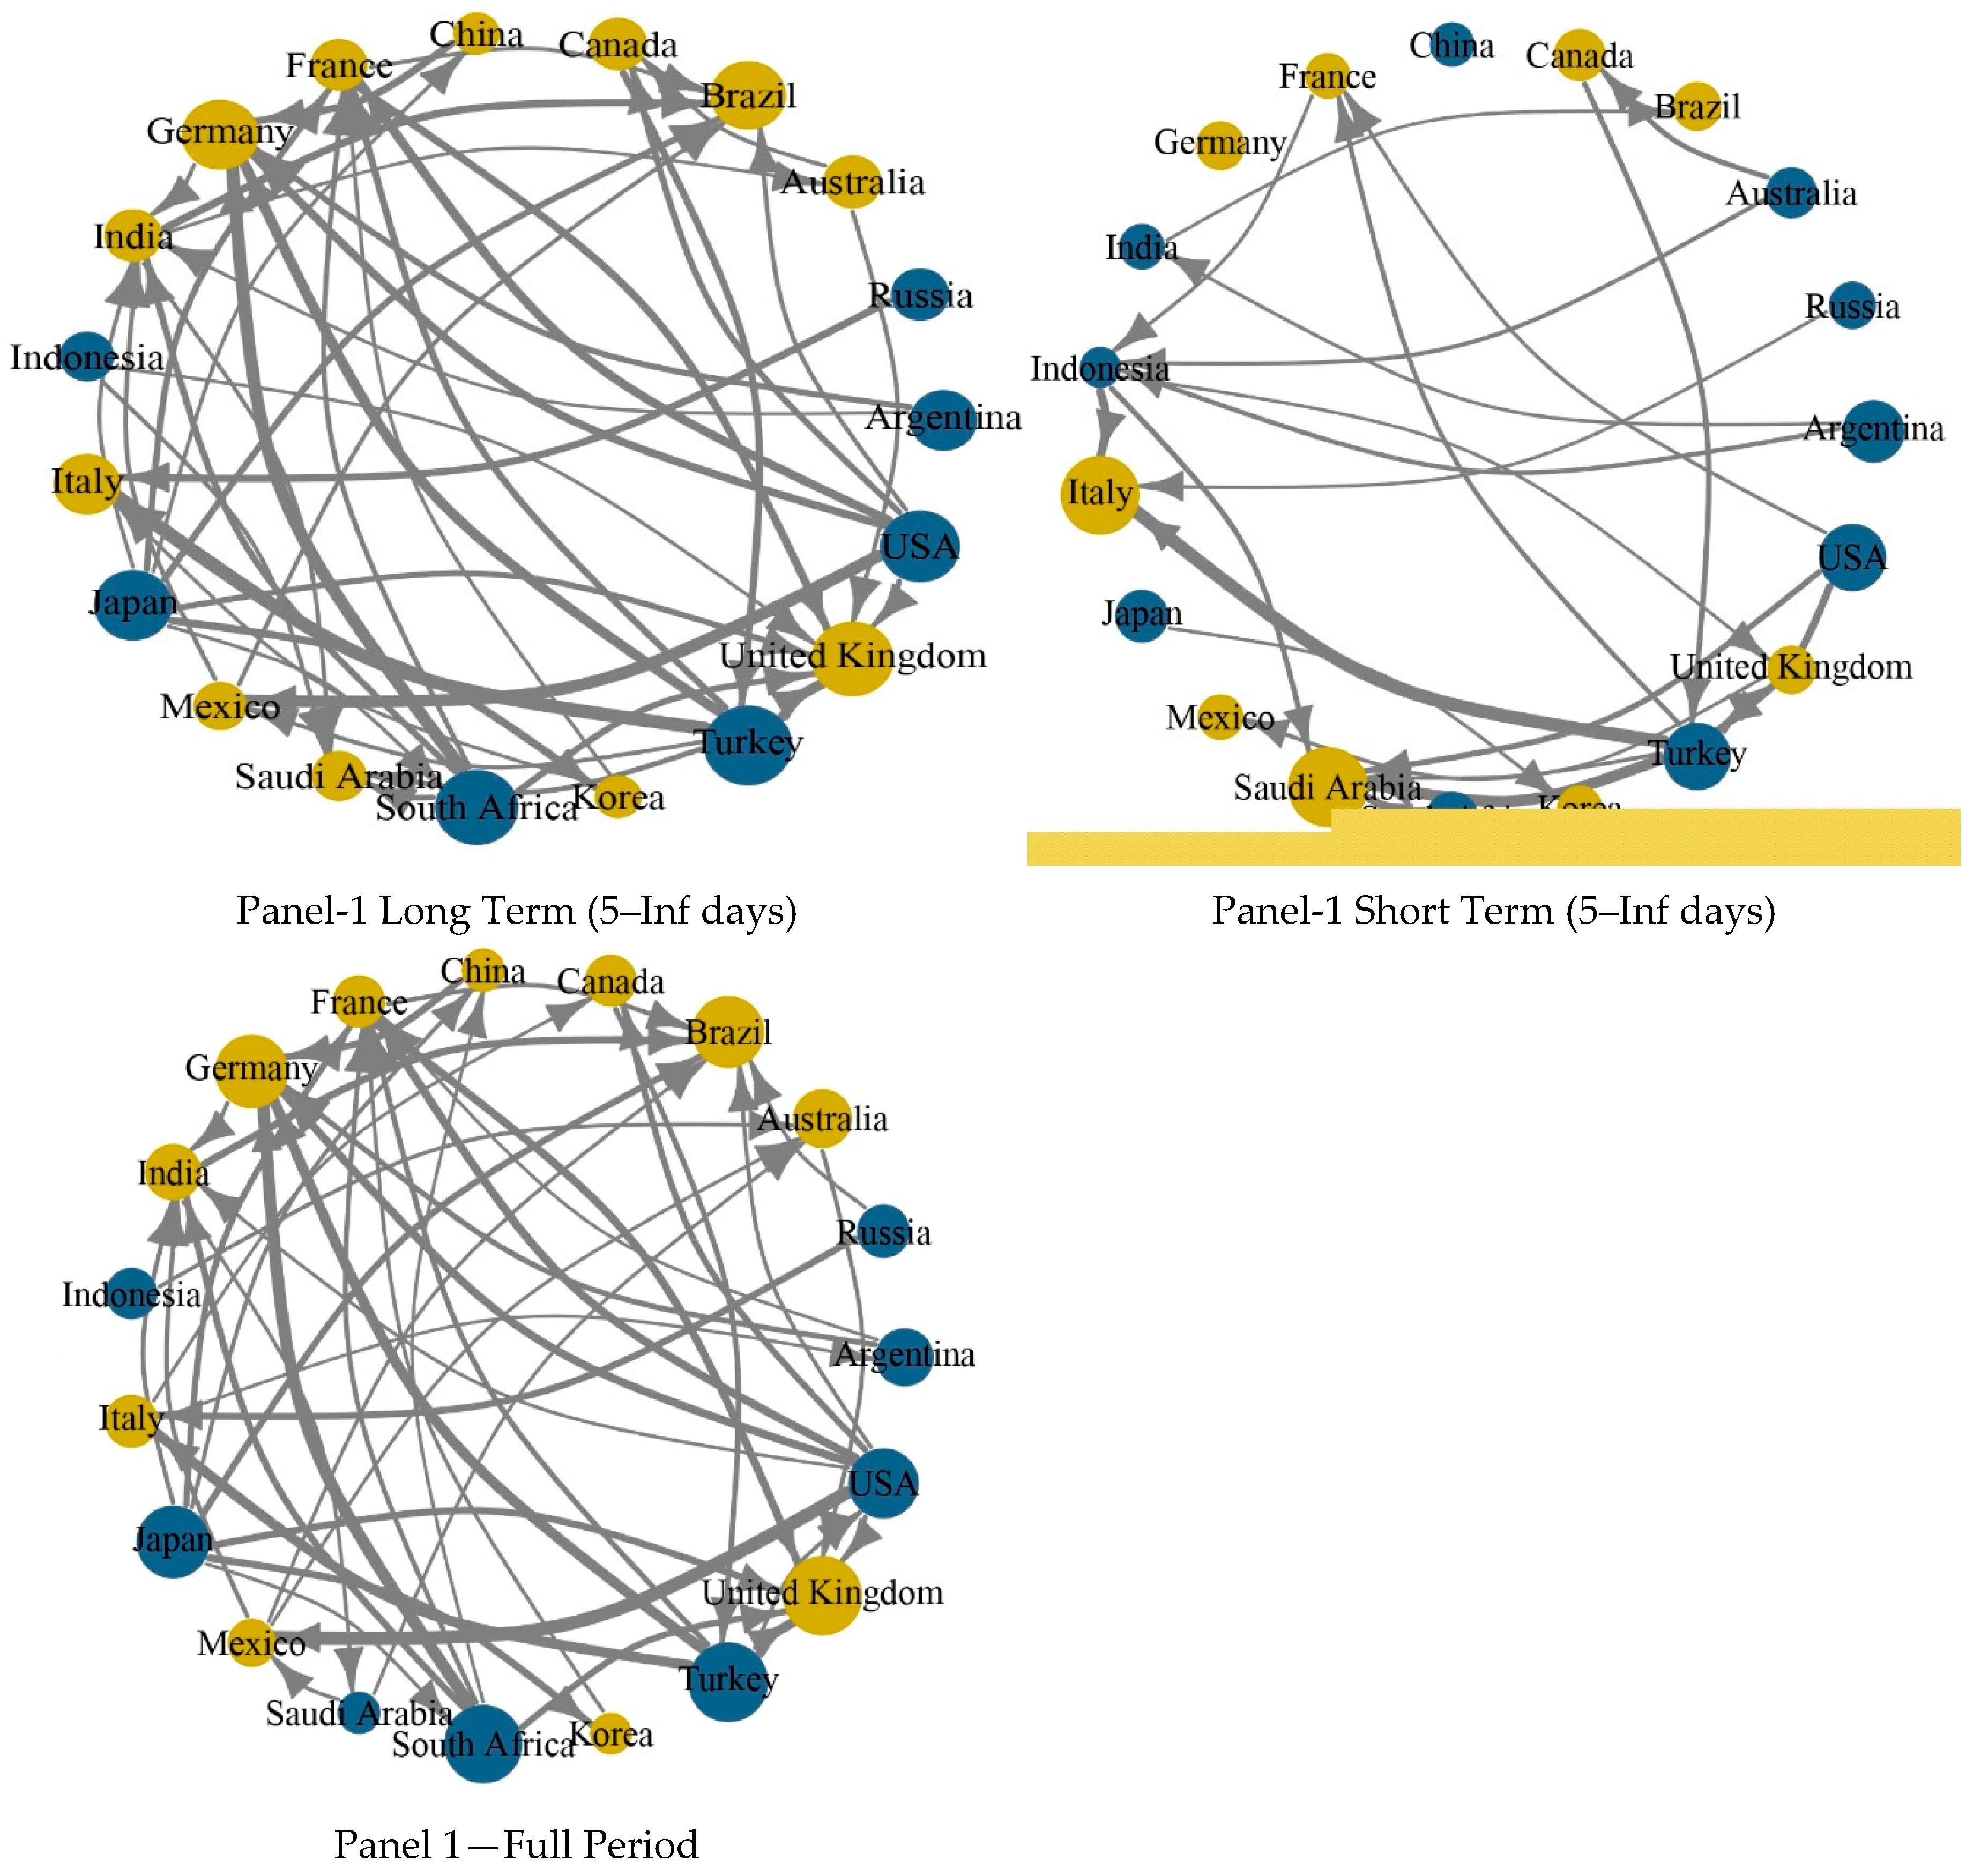
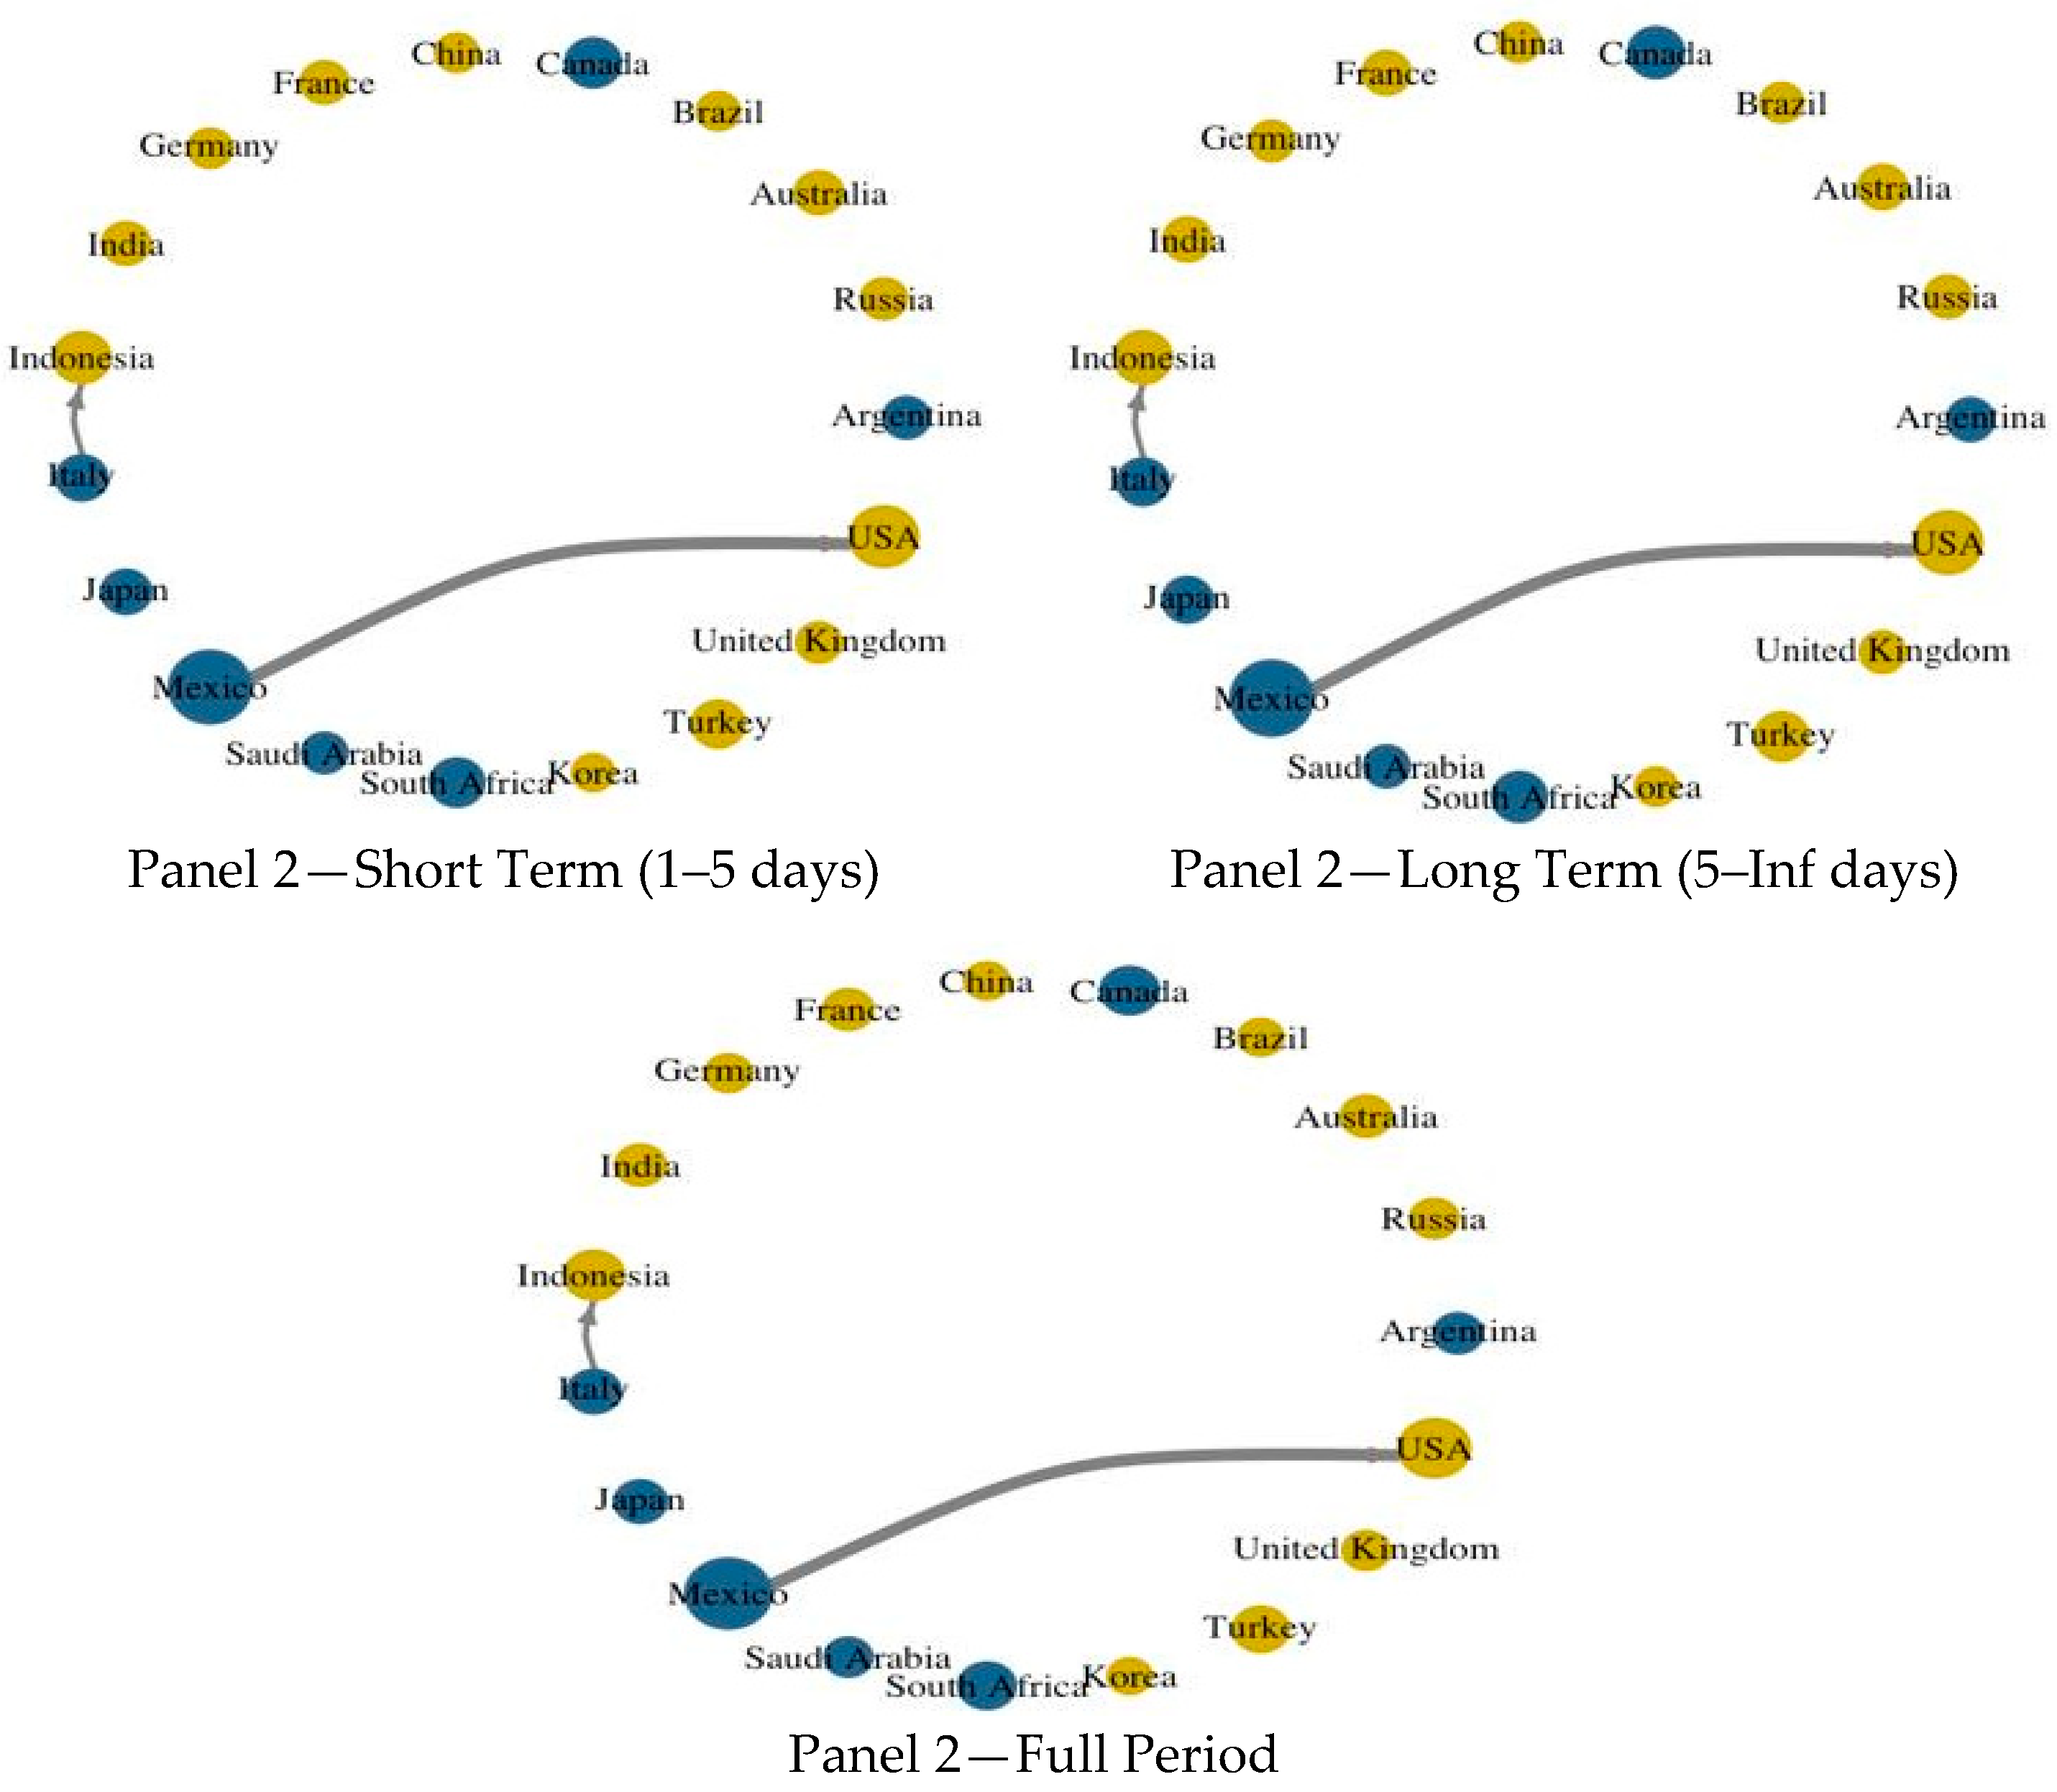
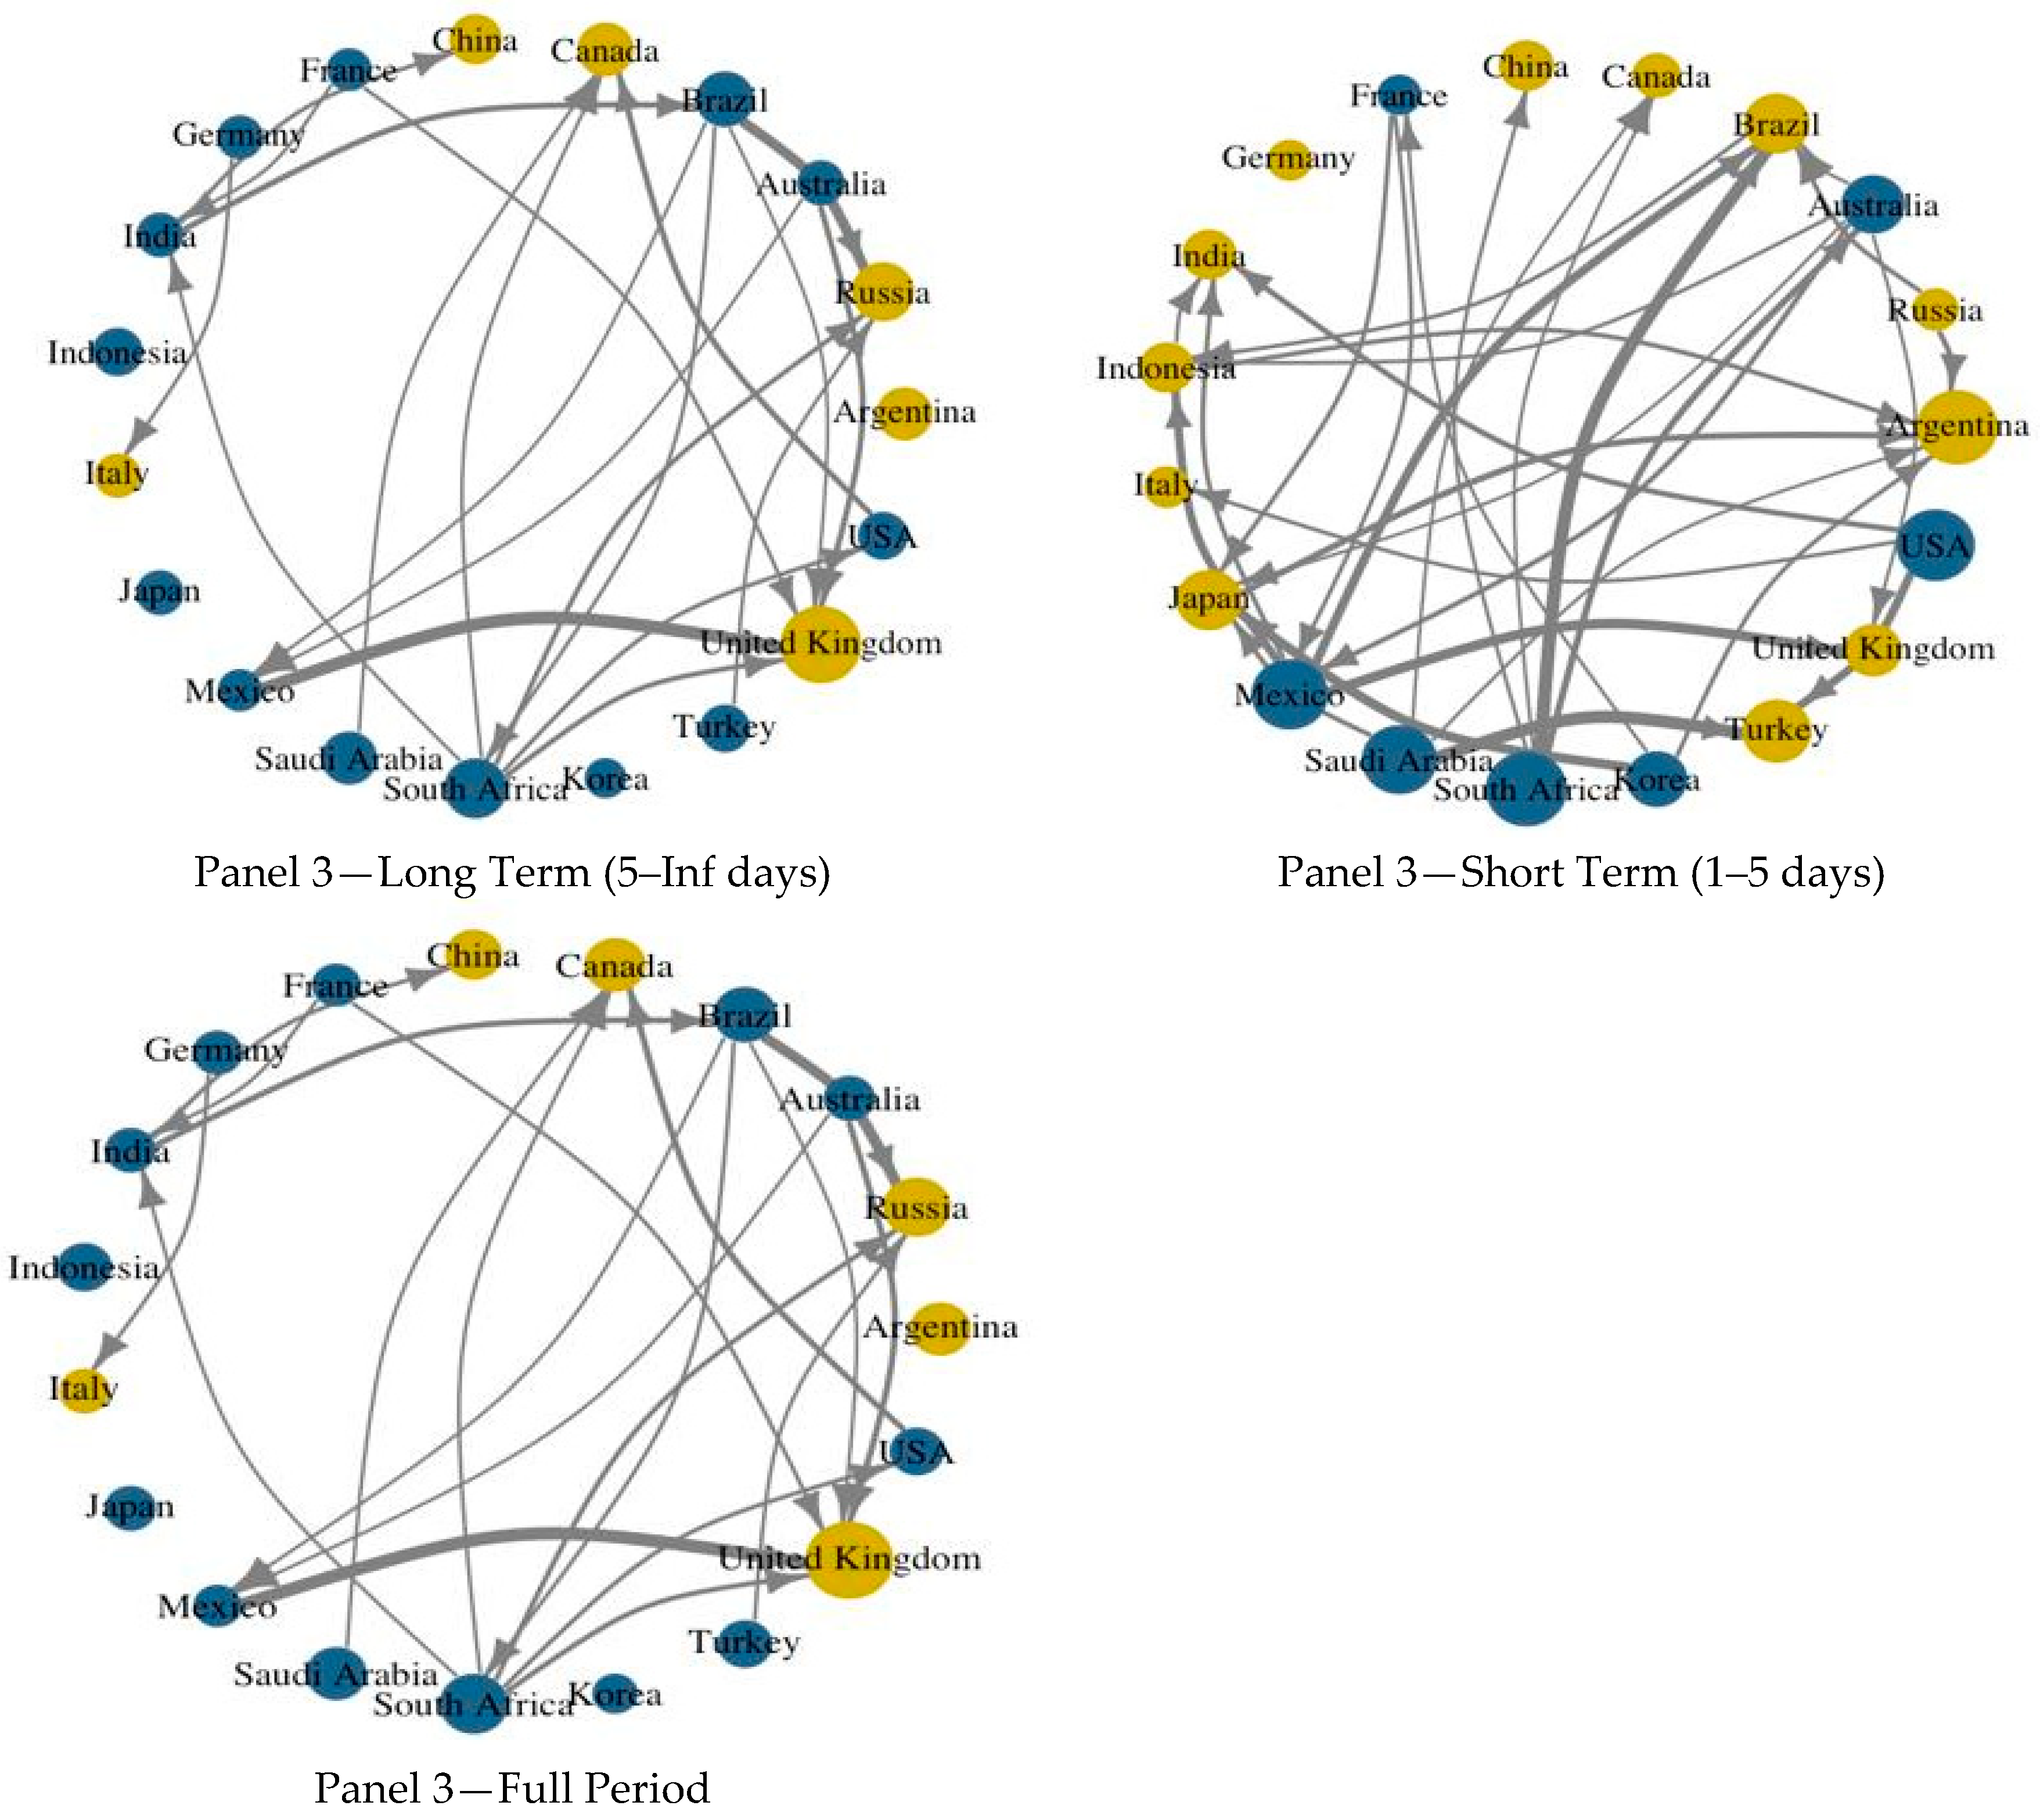
Figure 1 shows the connectivity between the G20 nations across varied sub-periods i.e., short term, long-term, and full period.
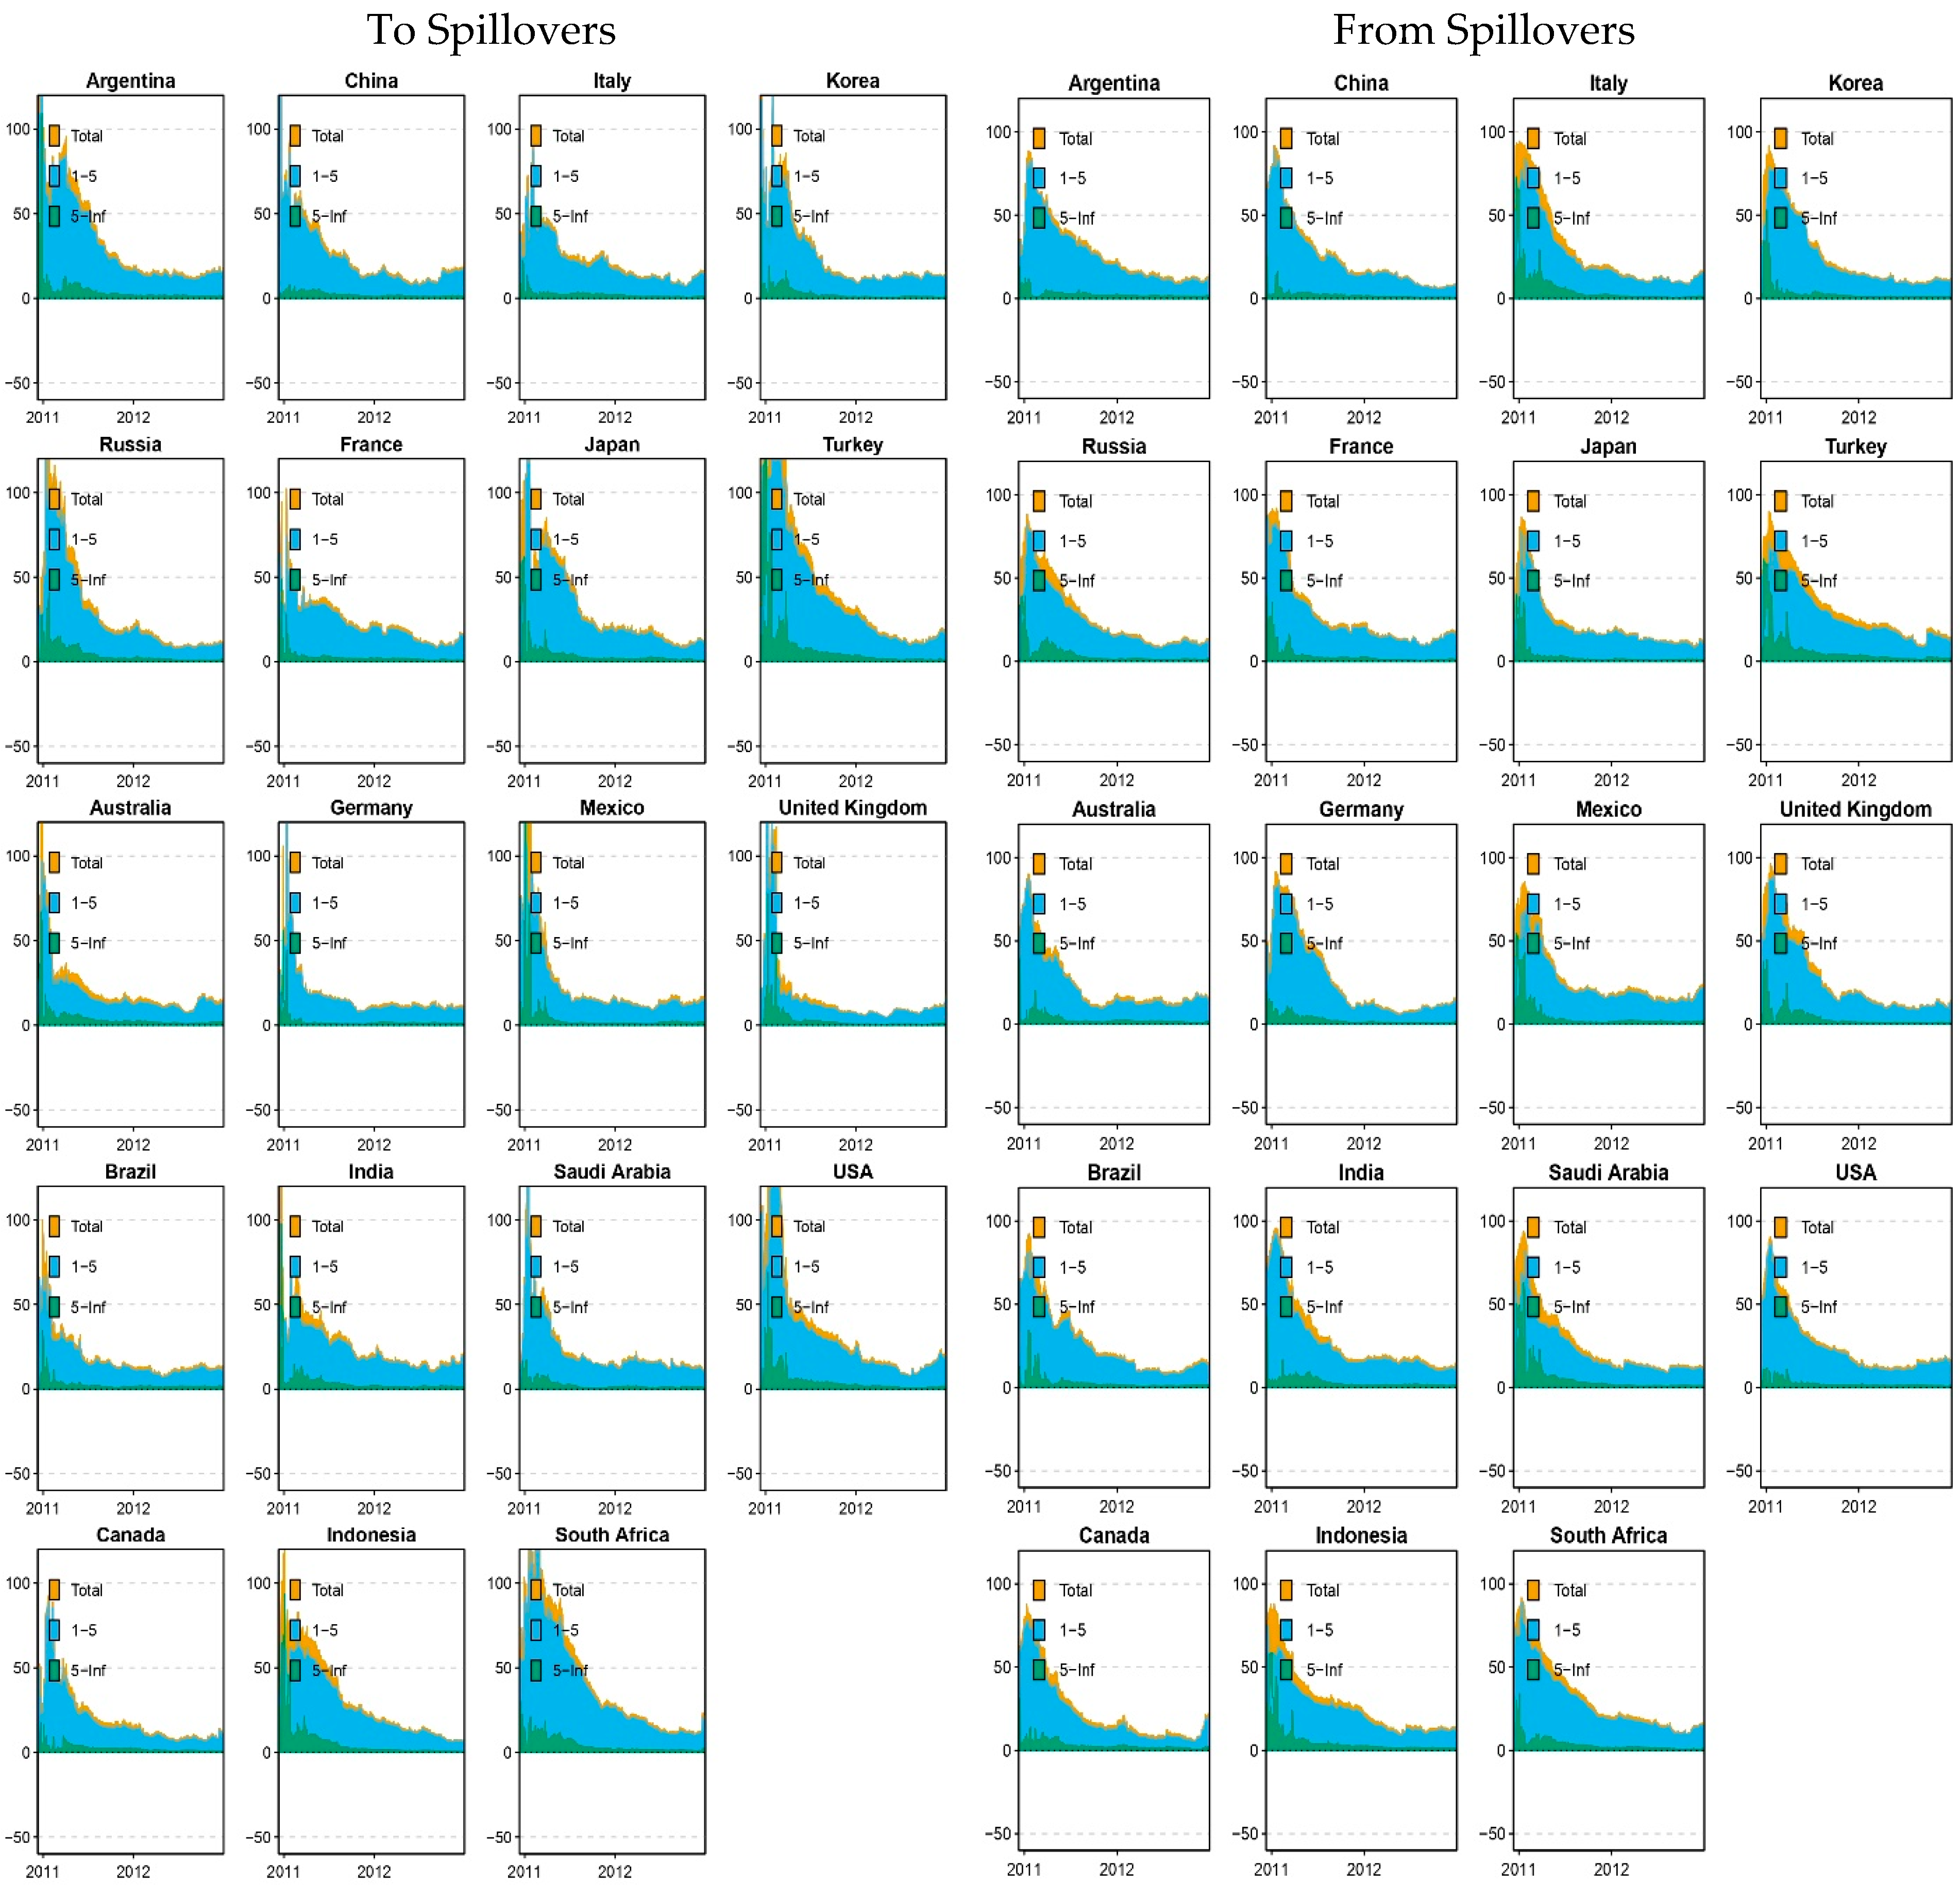
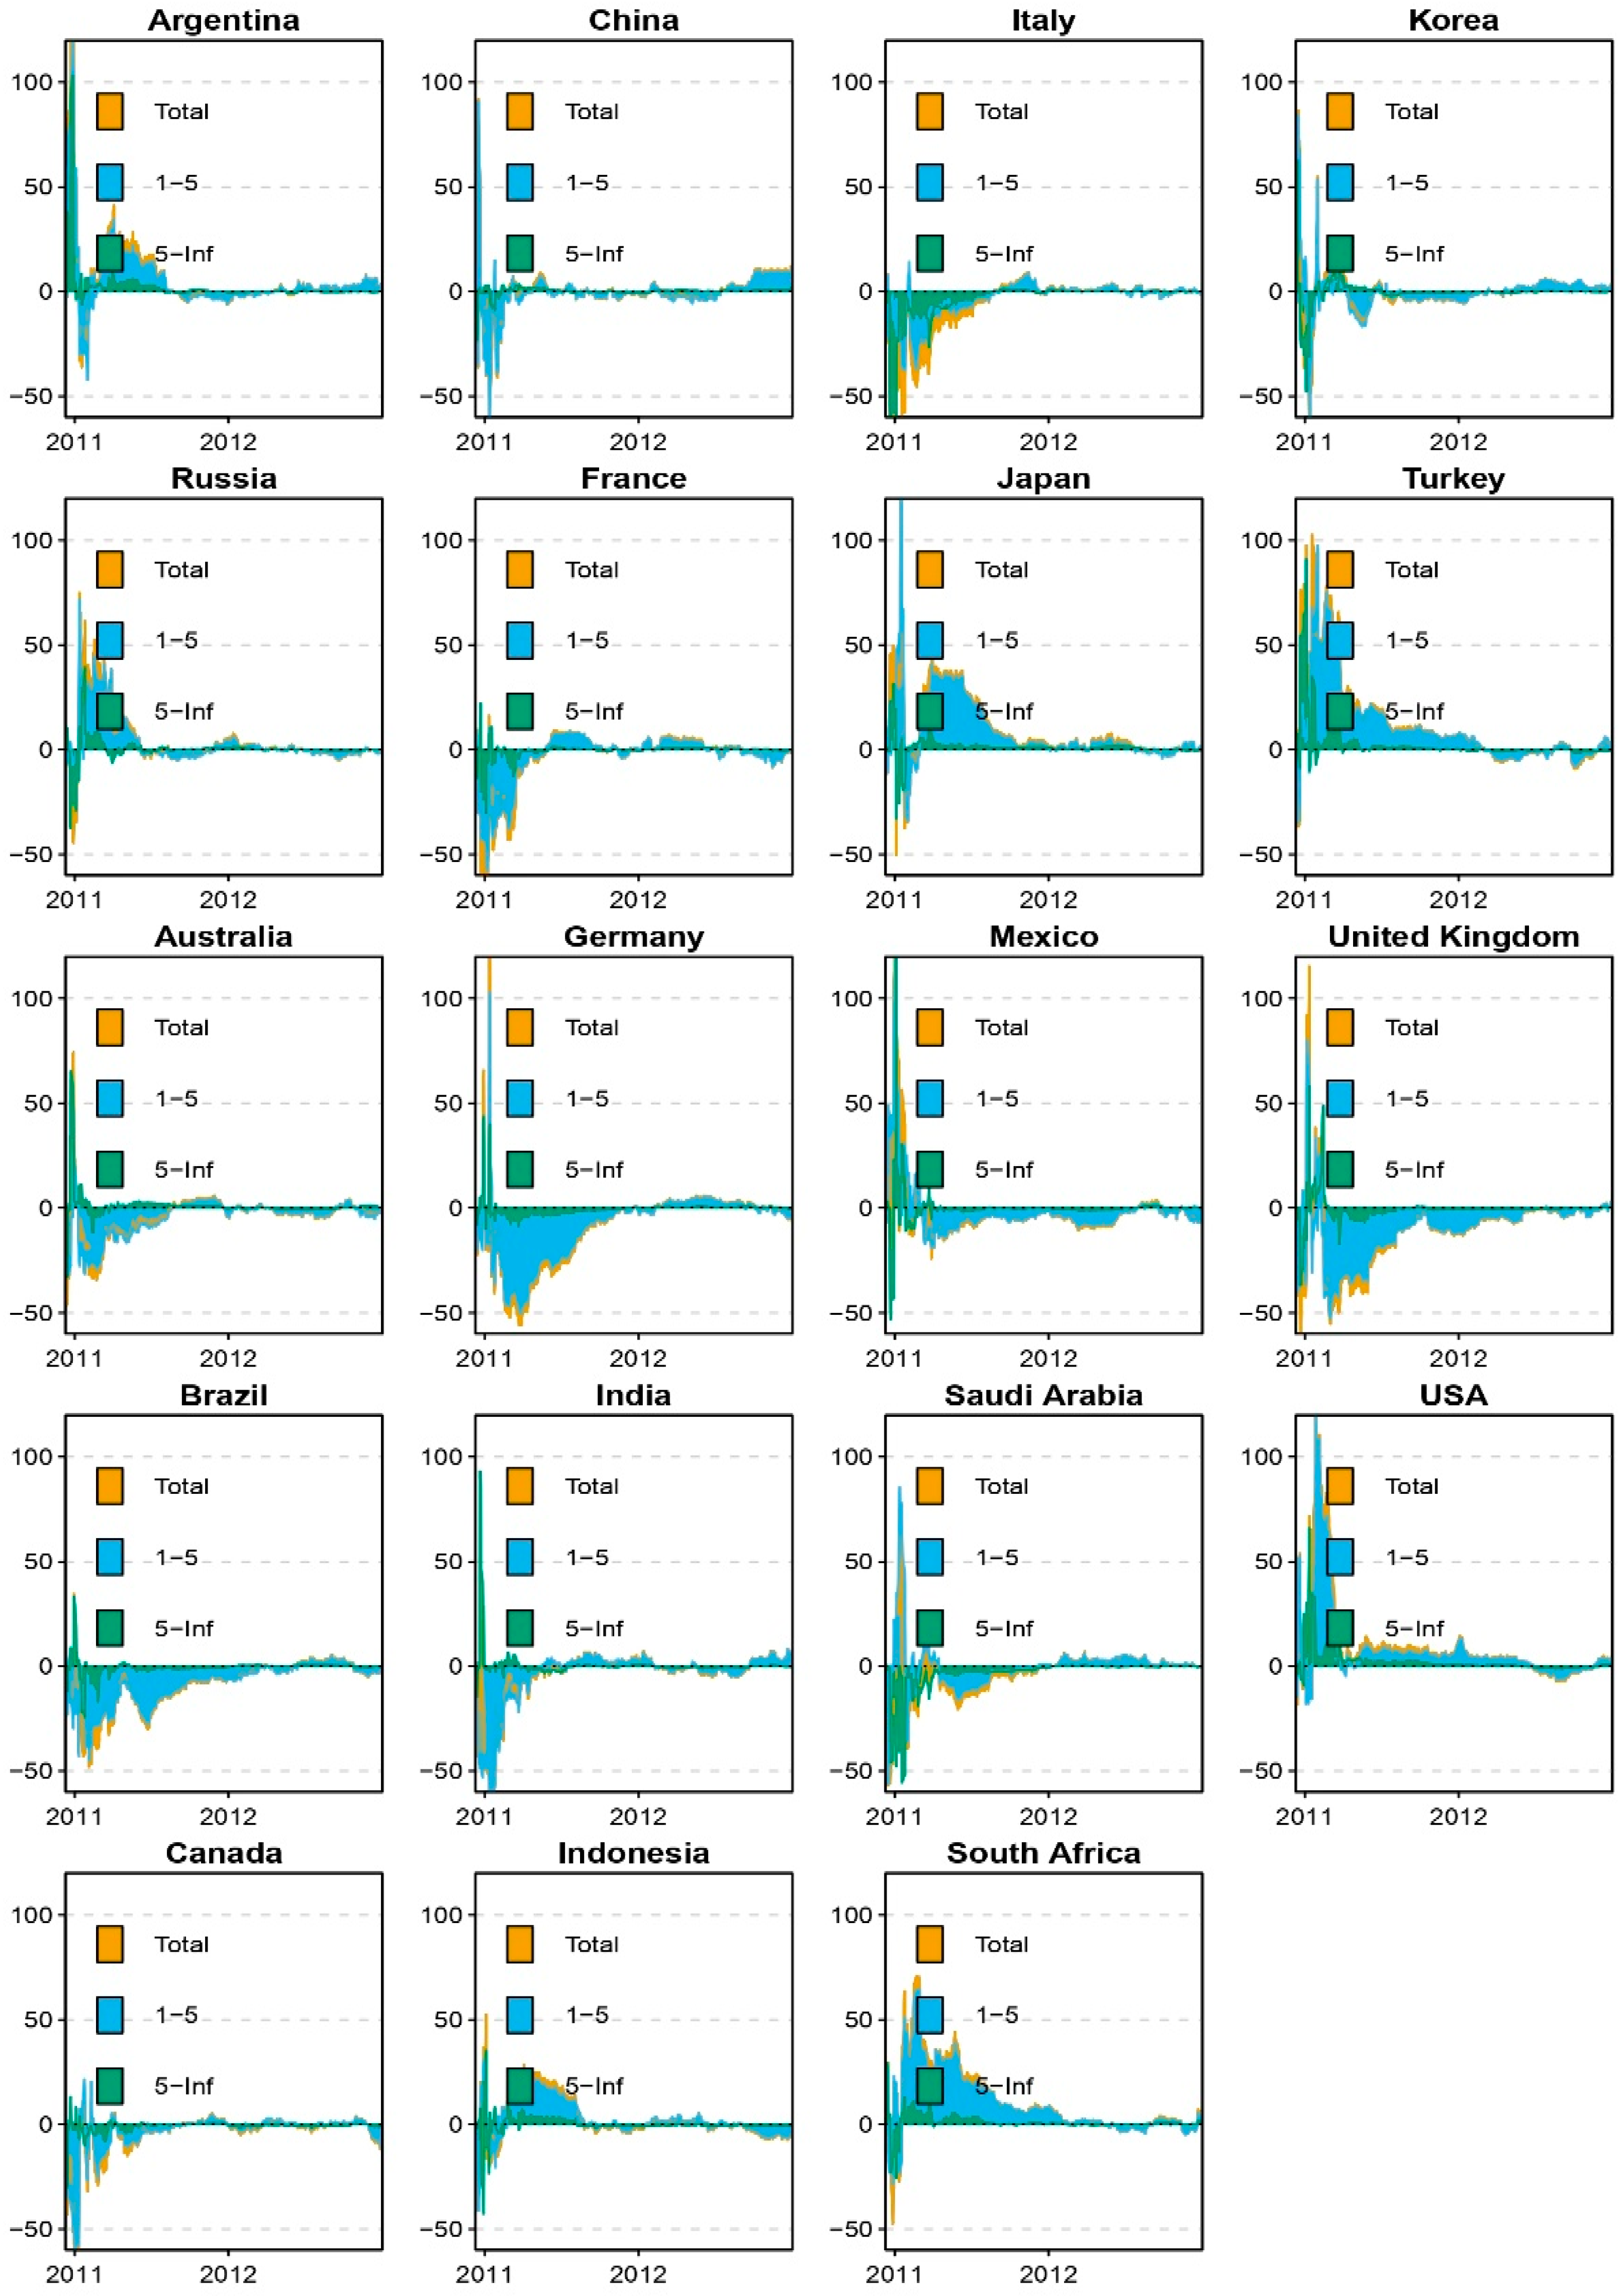
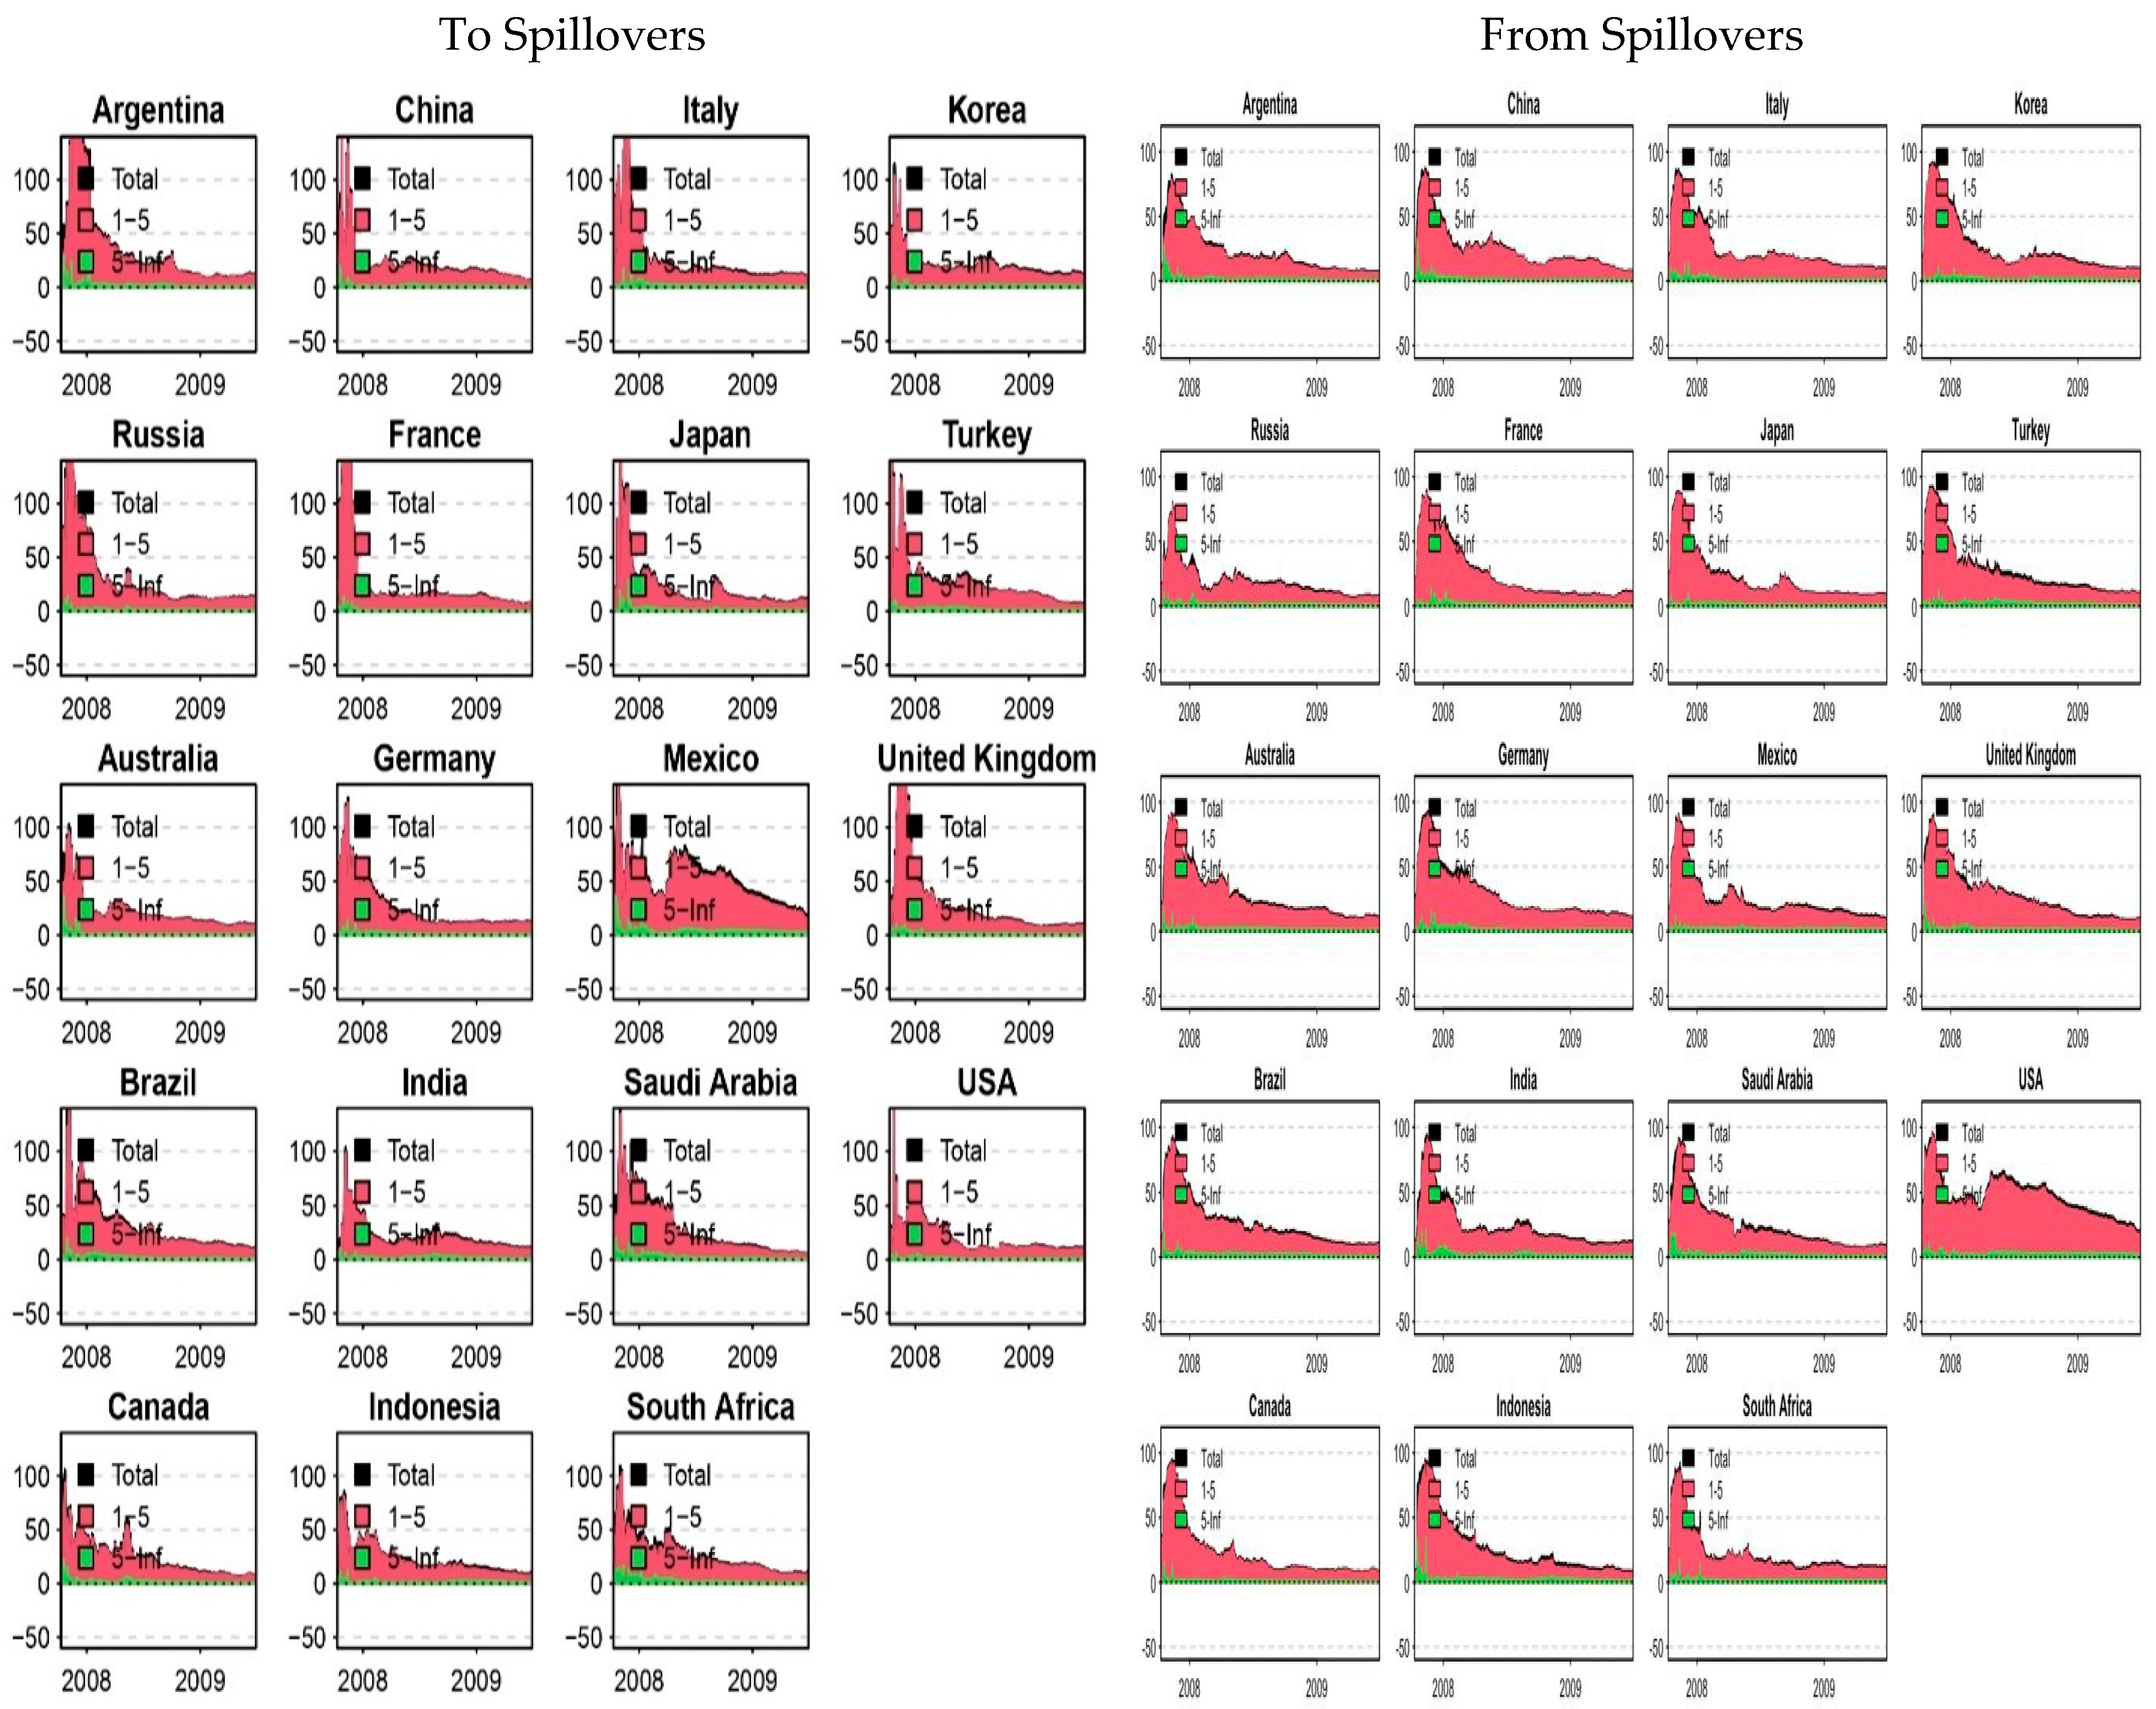
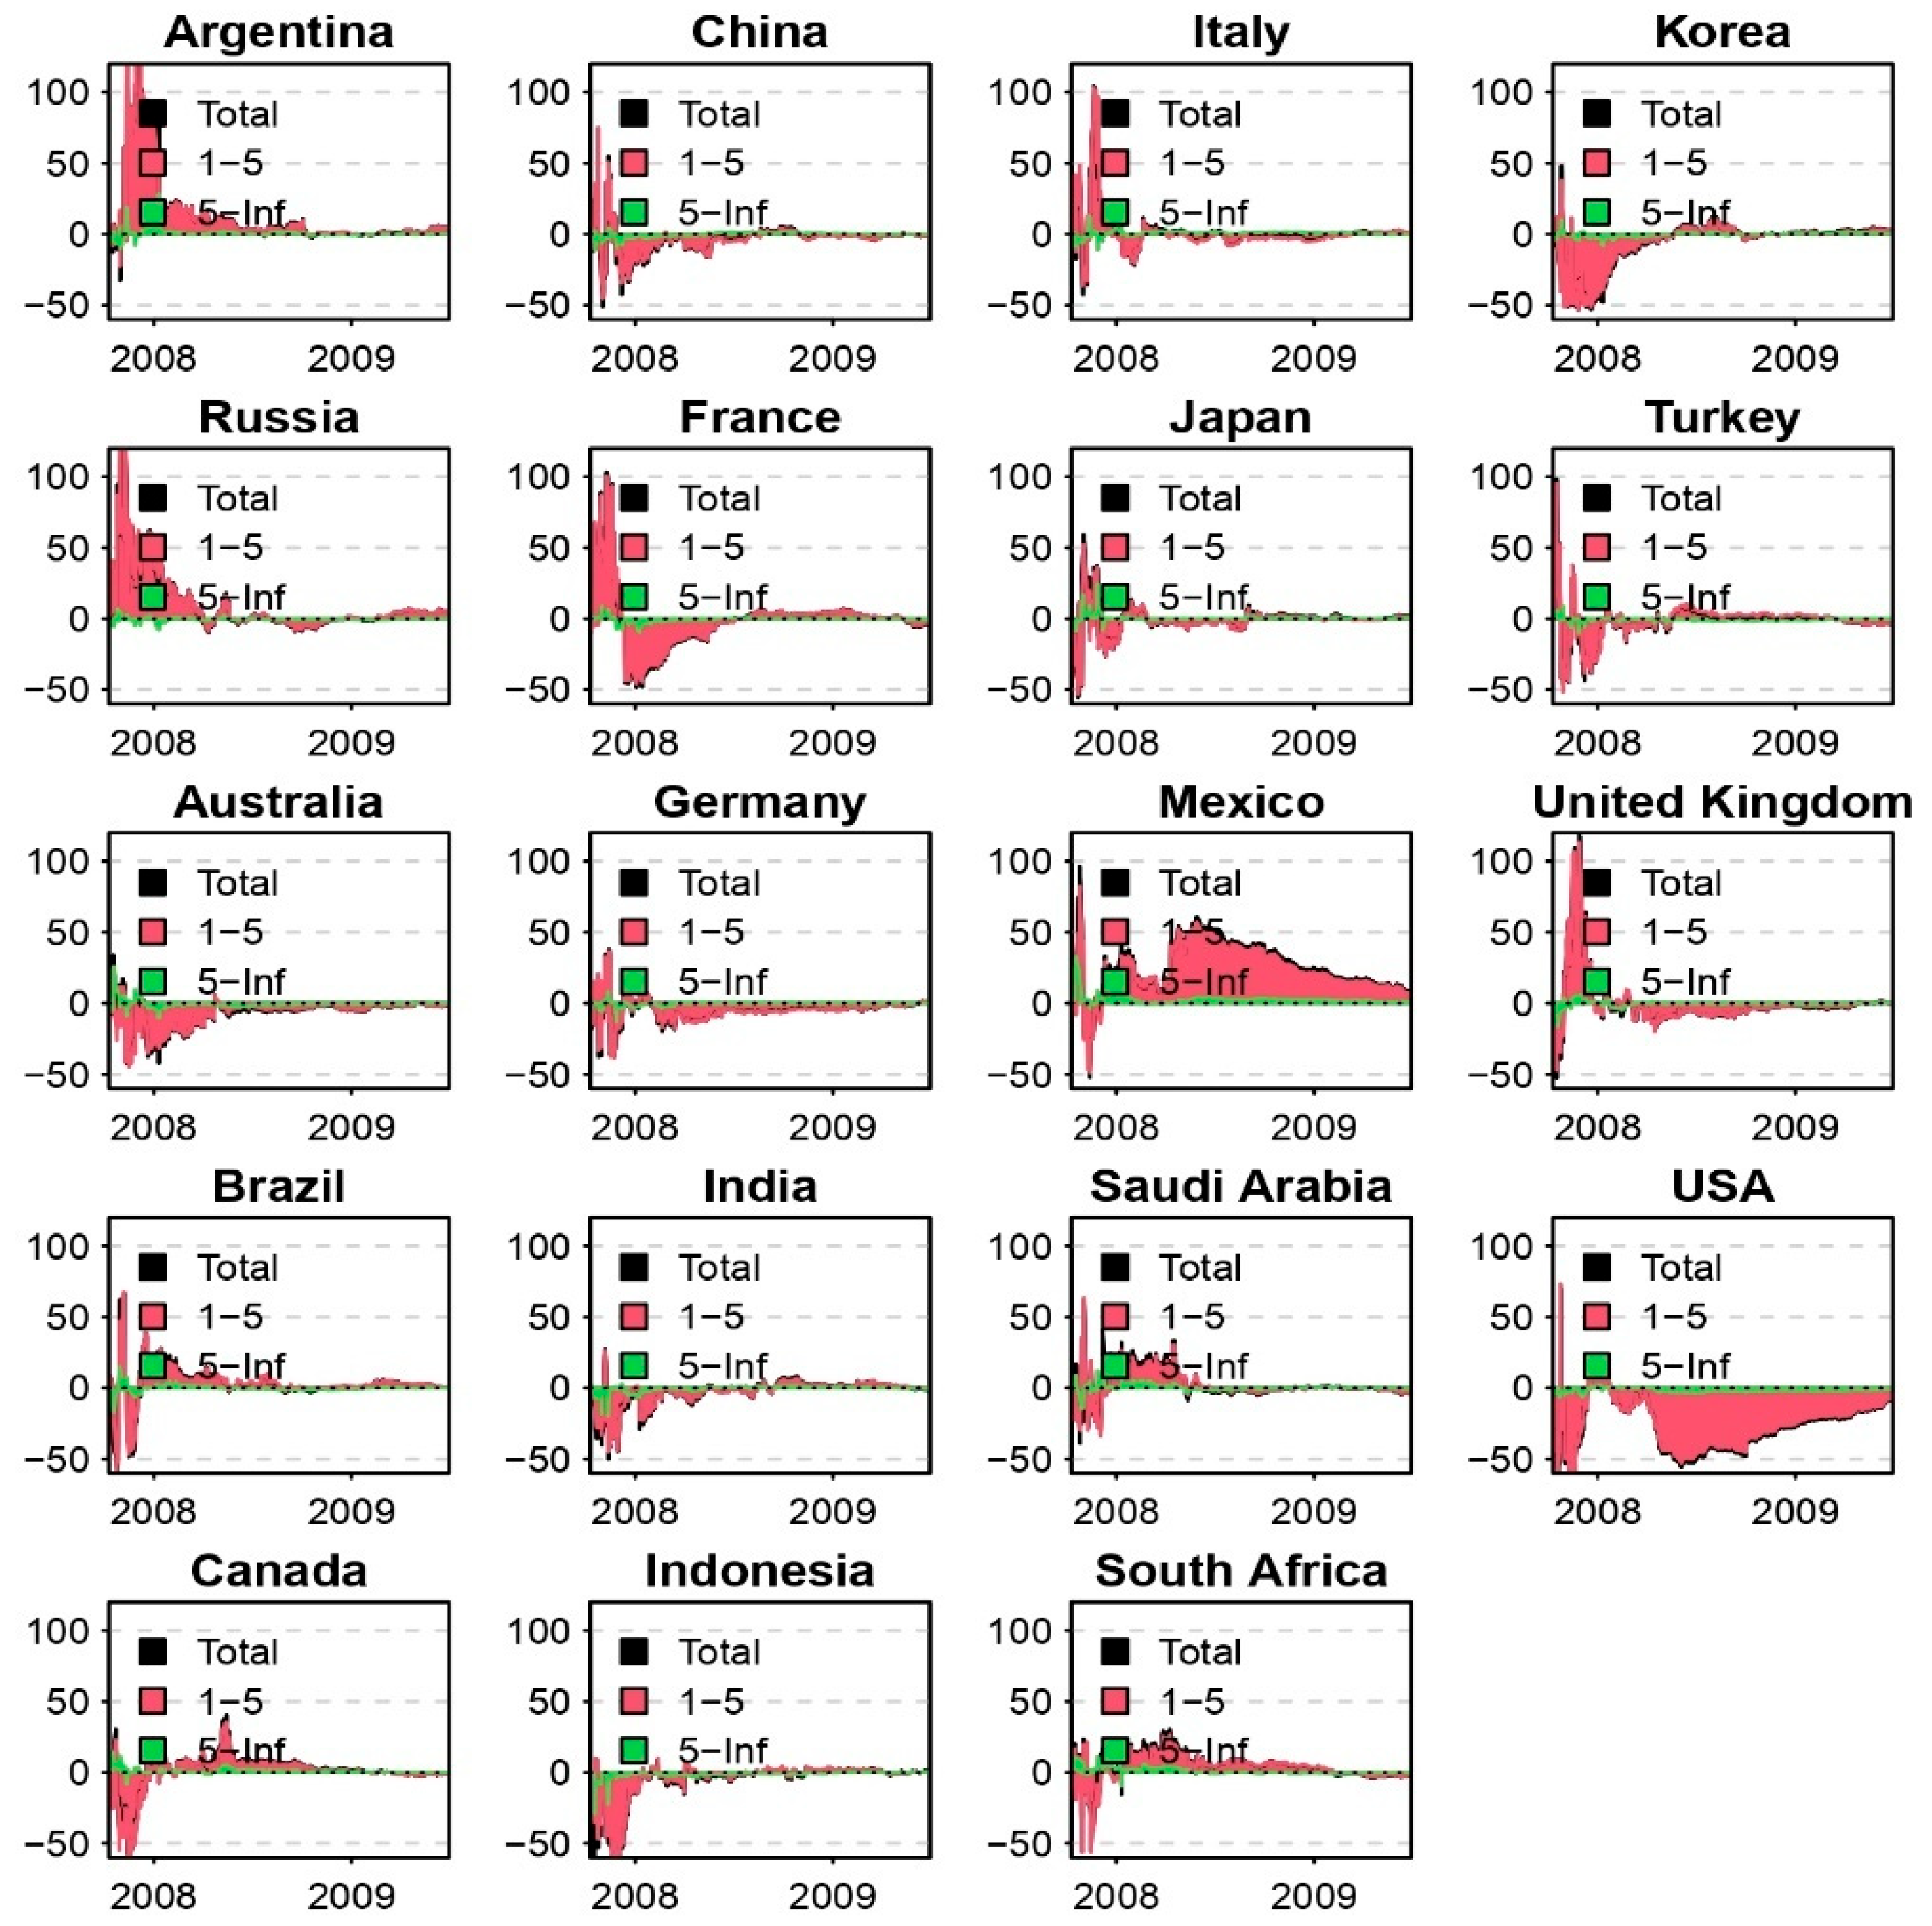
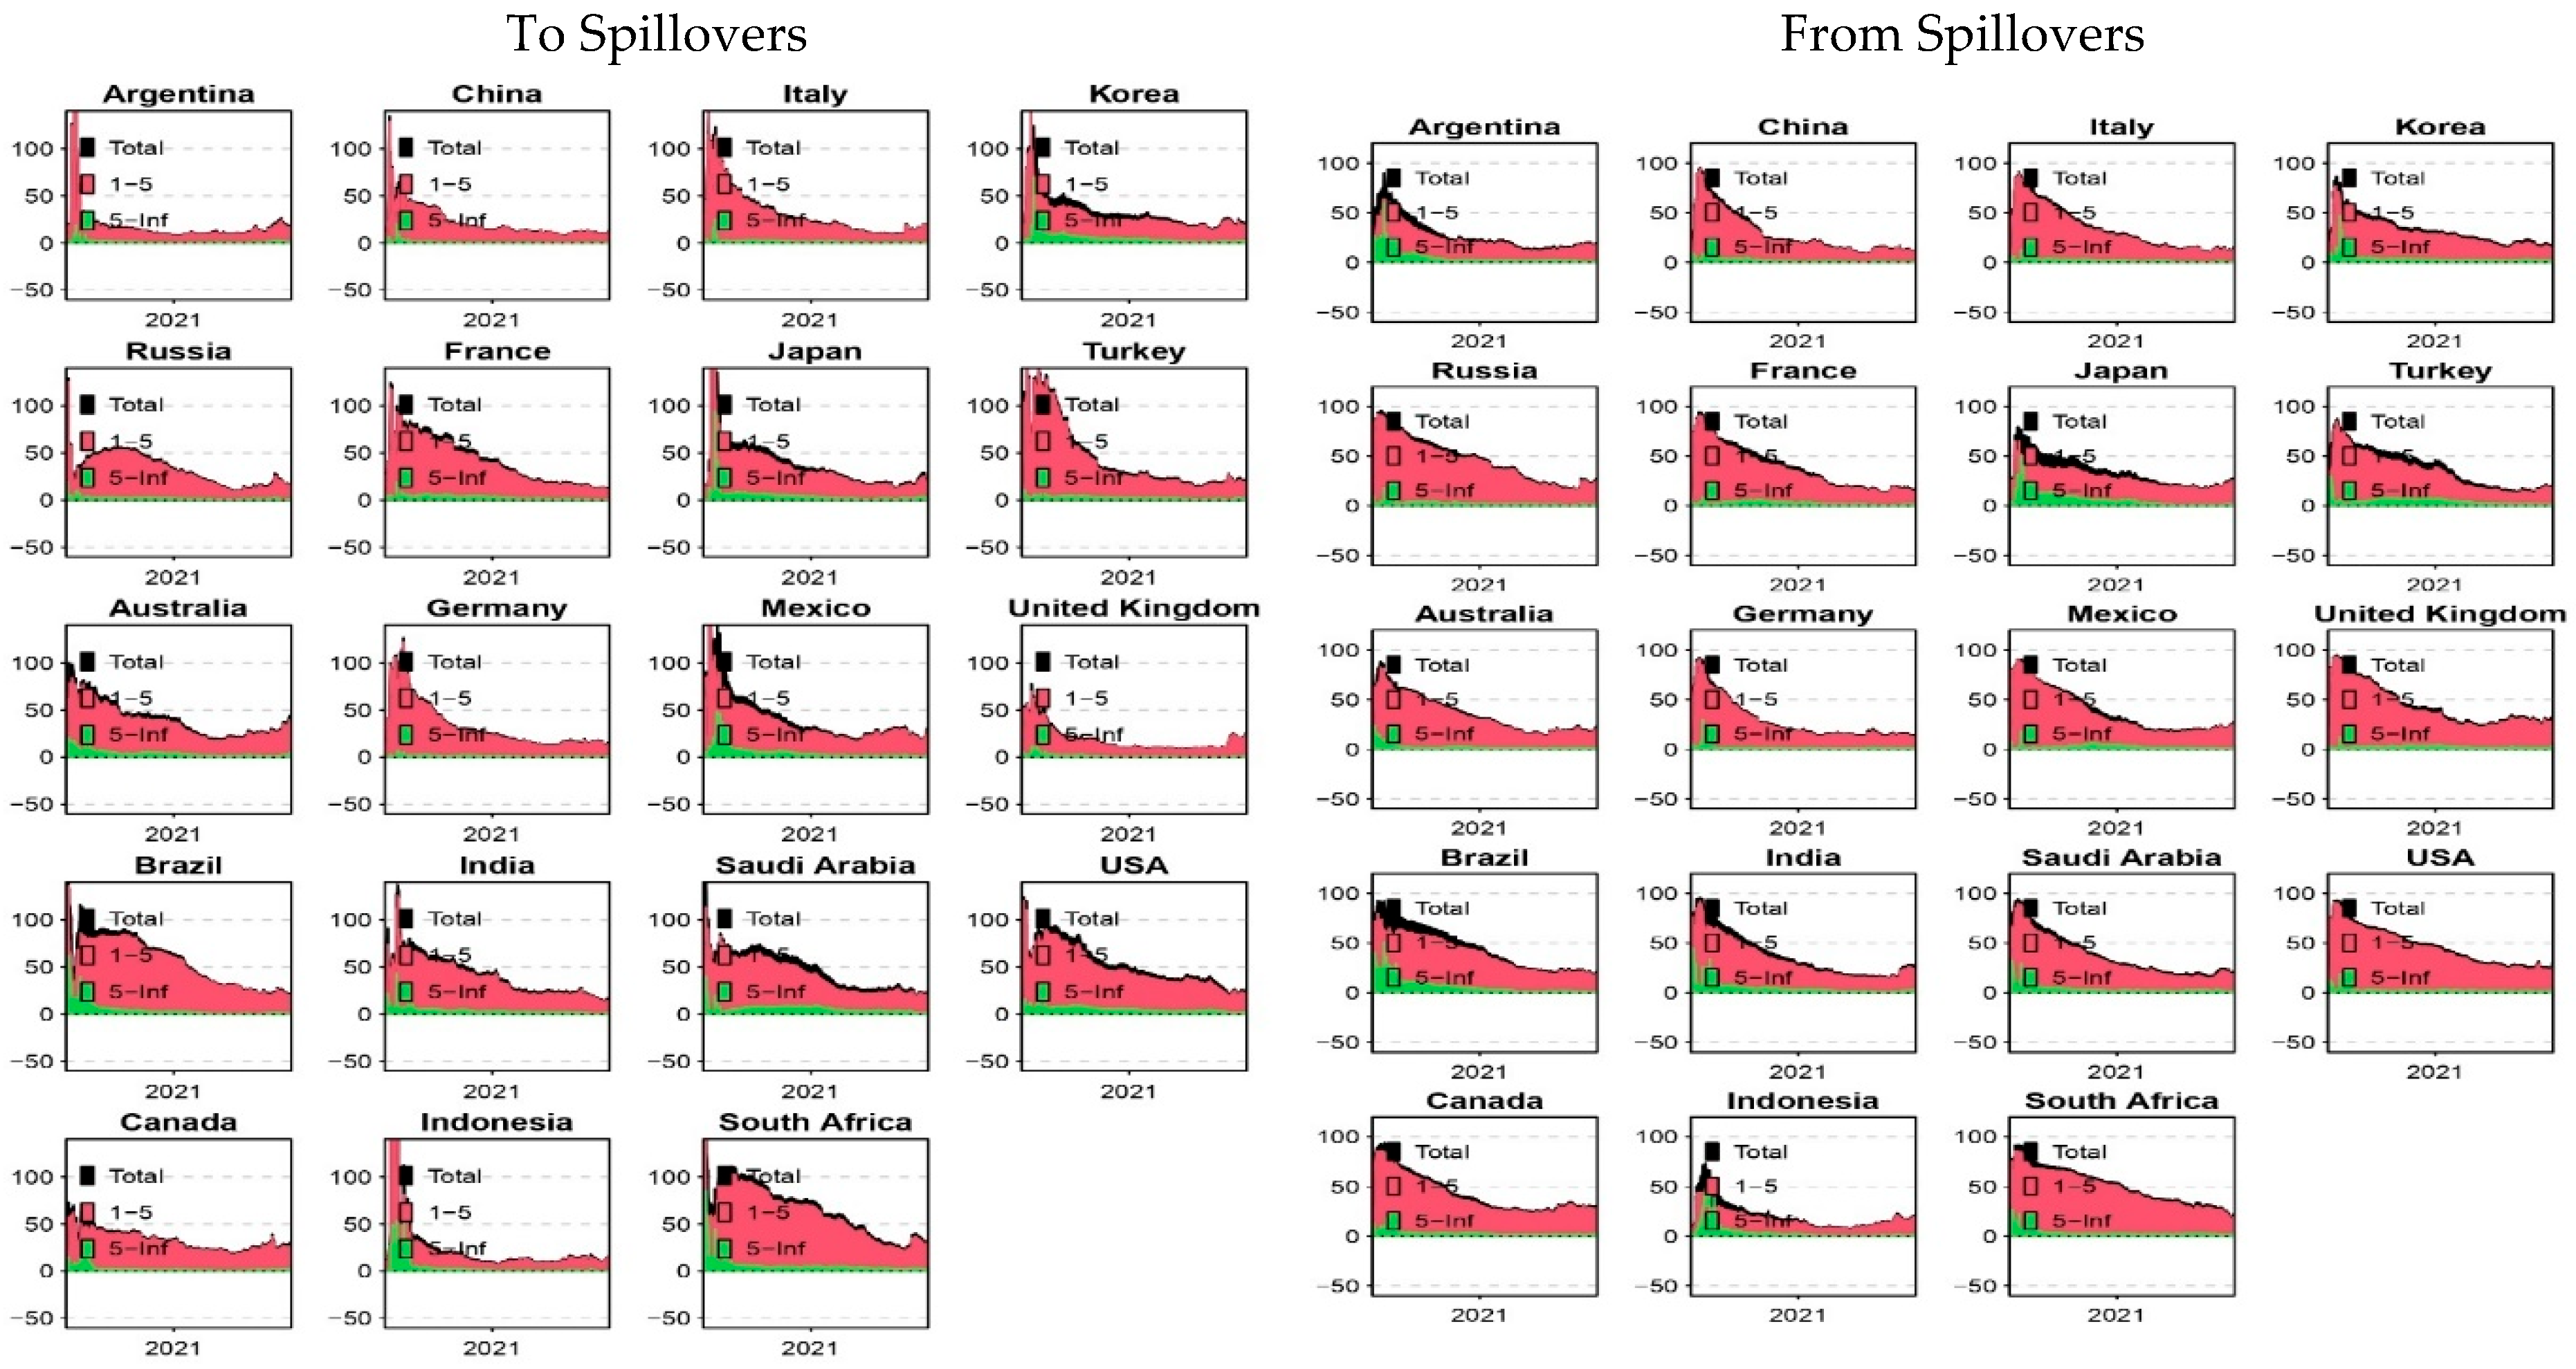
Figure 2 and
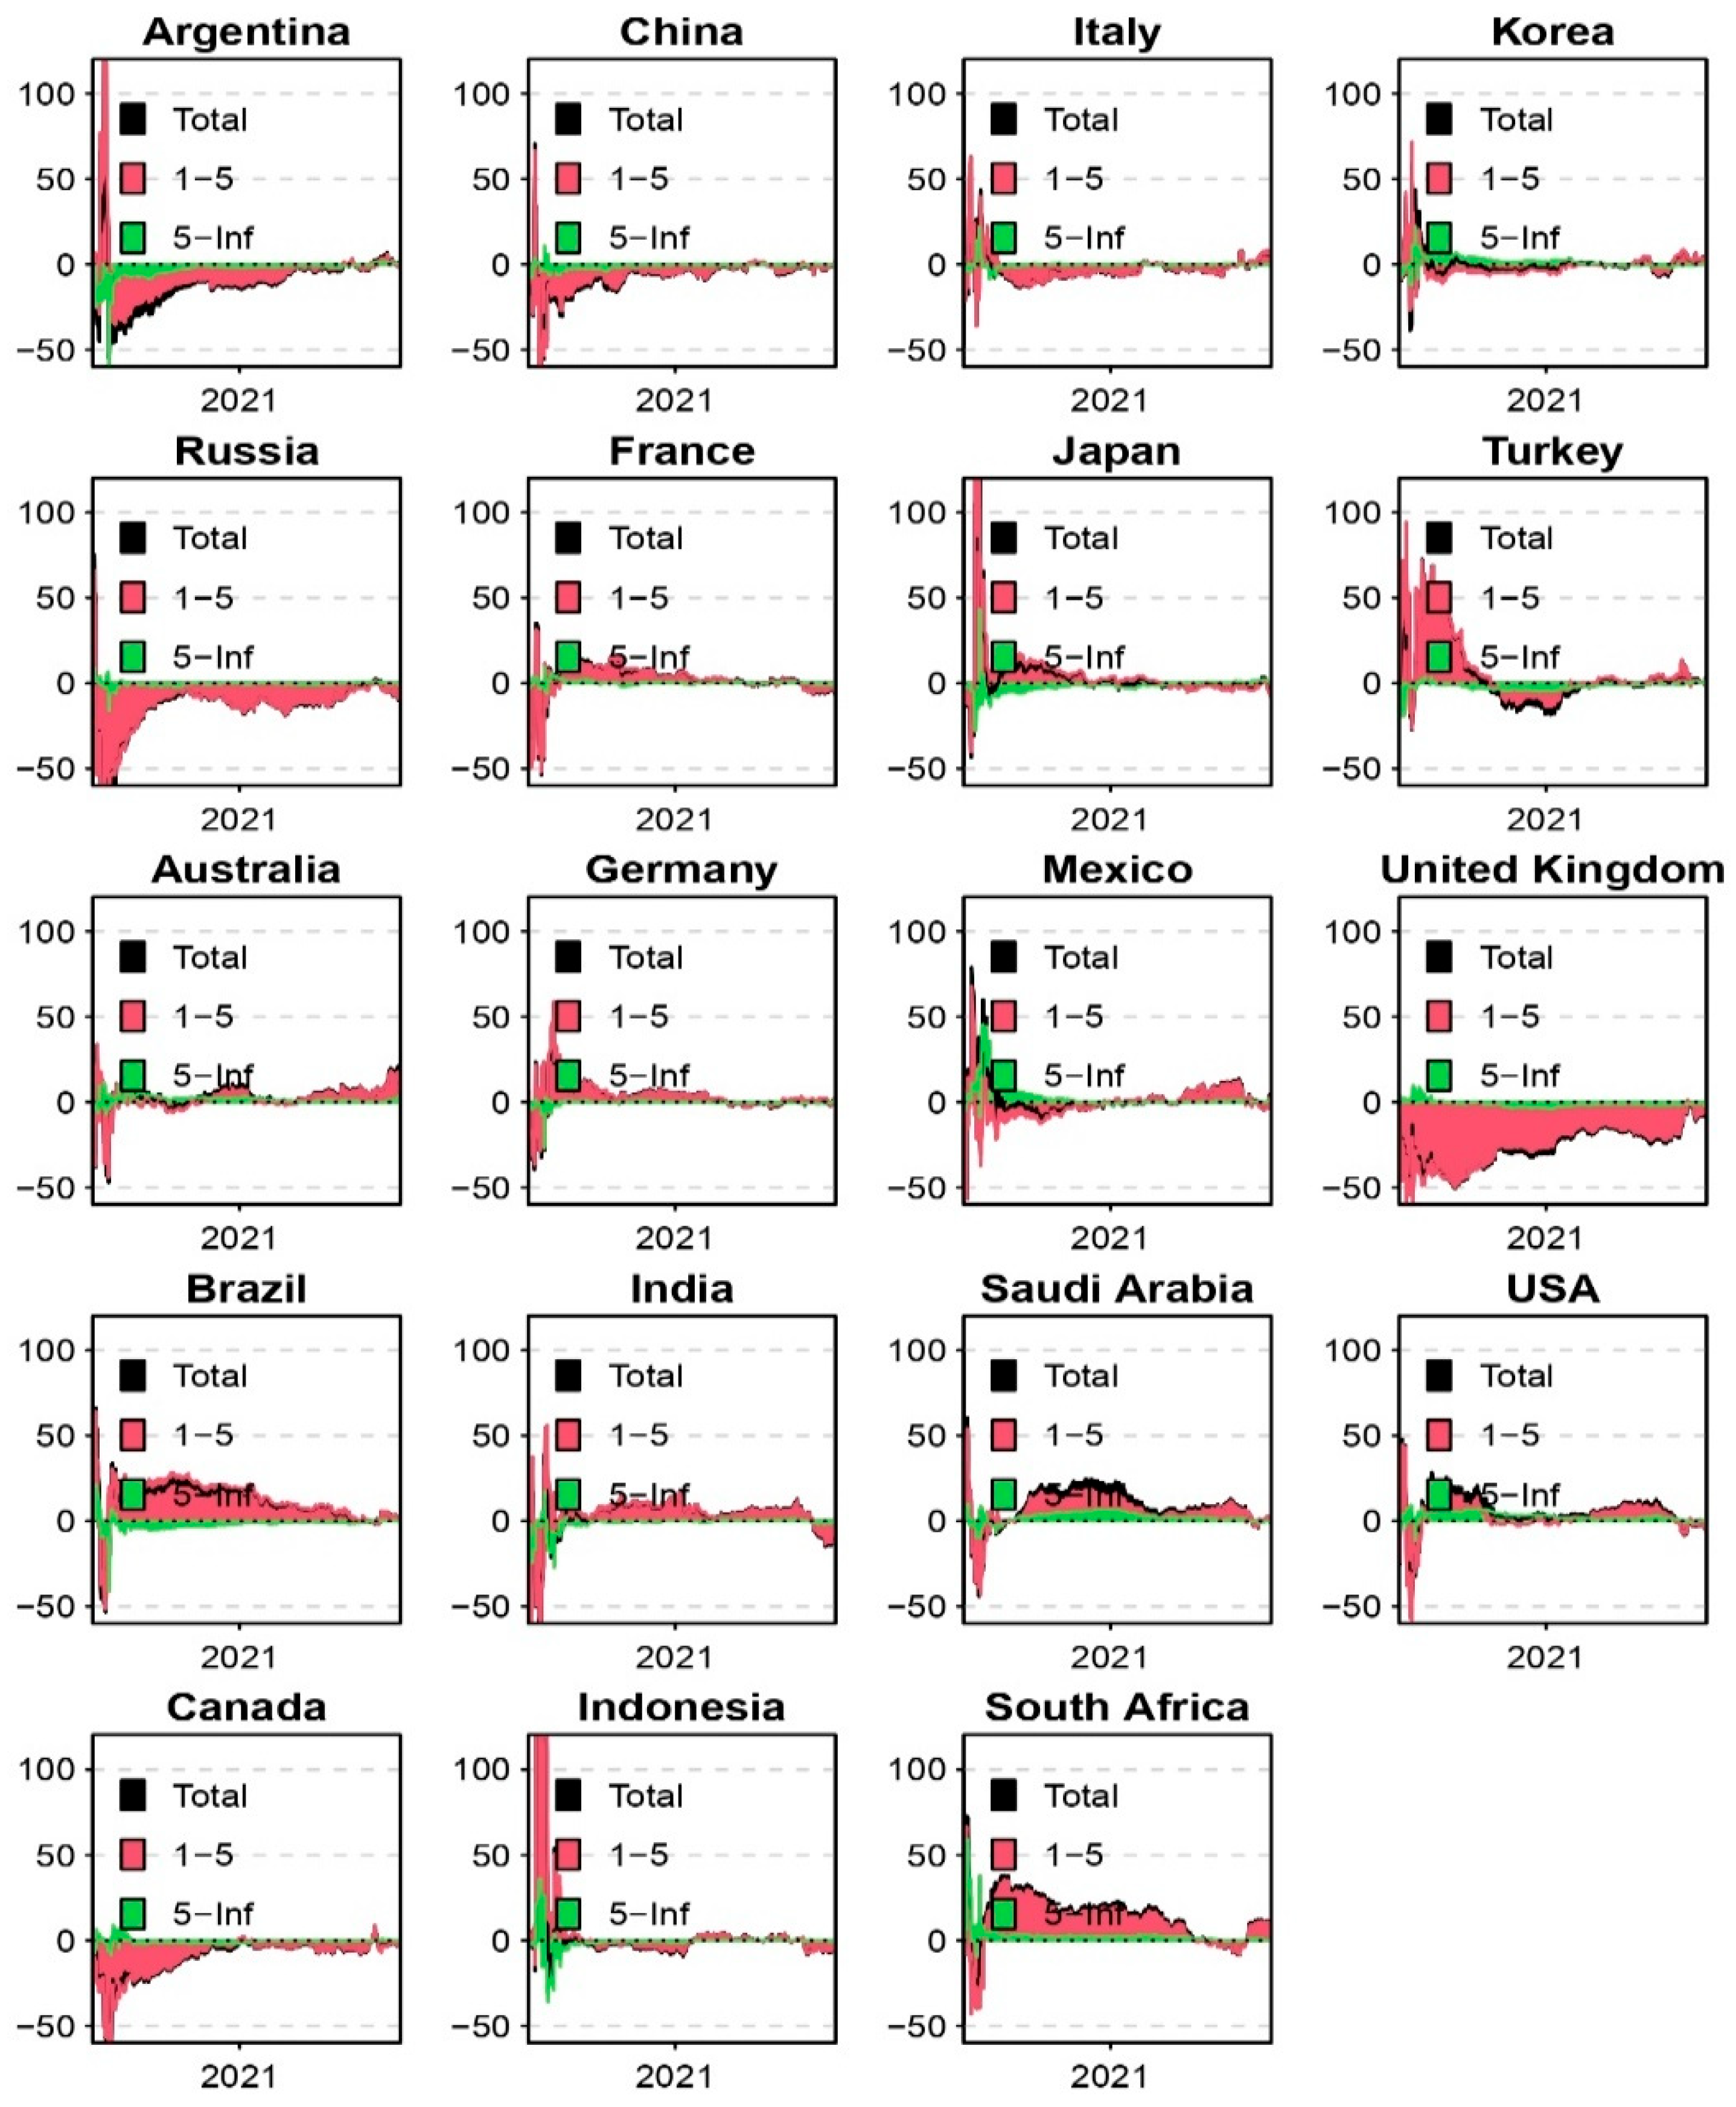
Figure 3 show the “To, From, and net spillovers,” respectively.
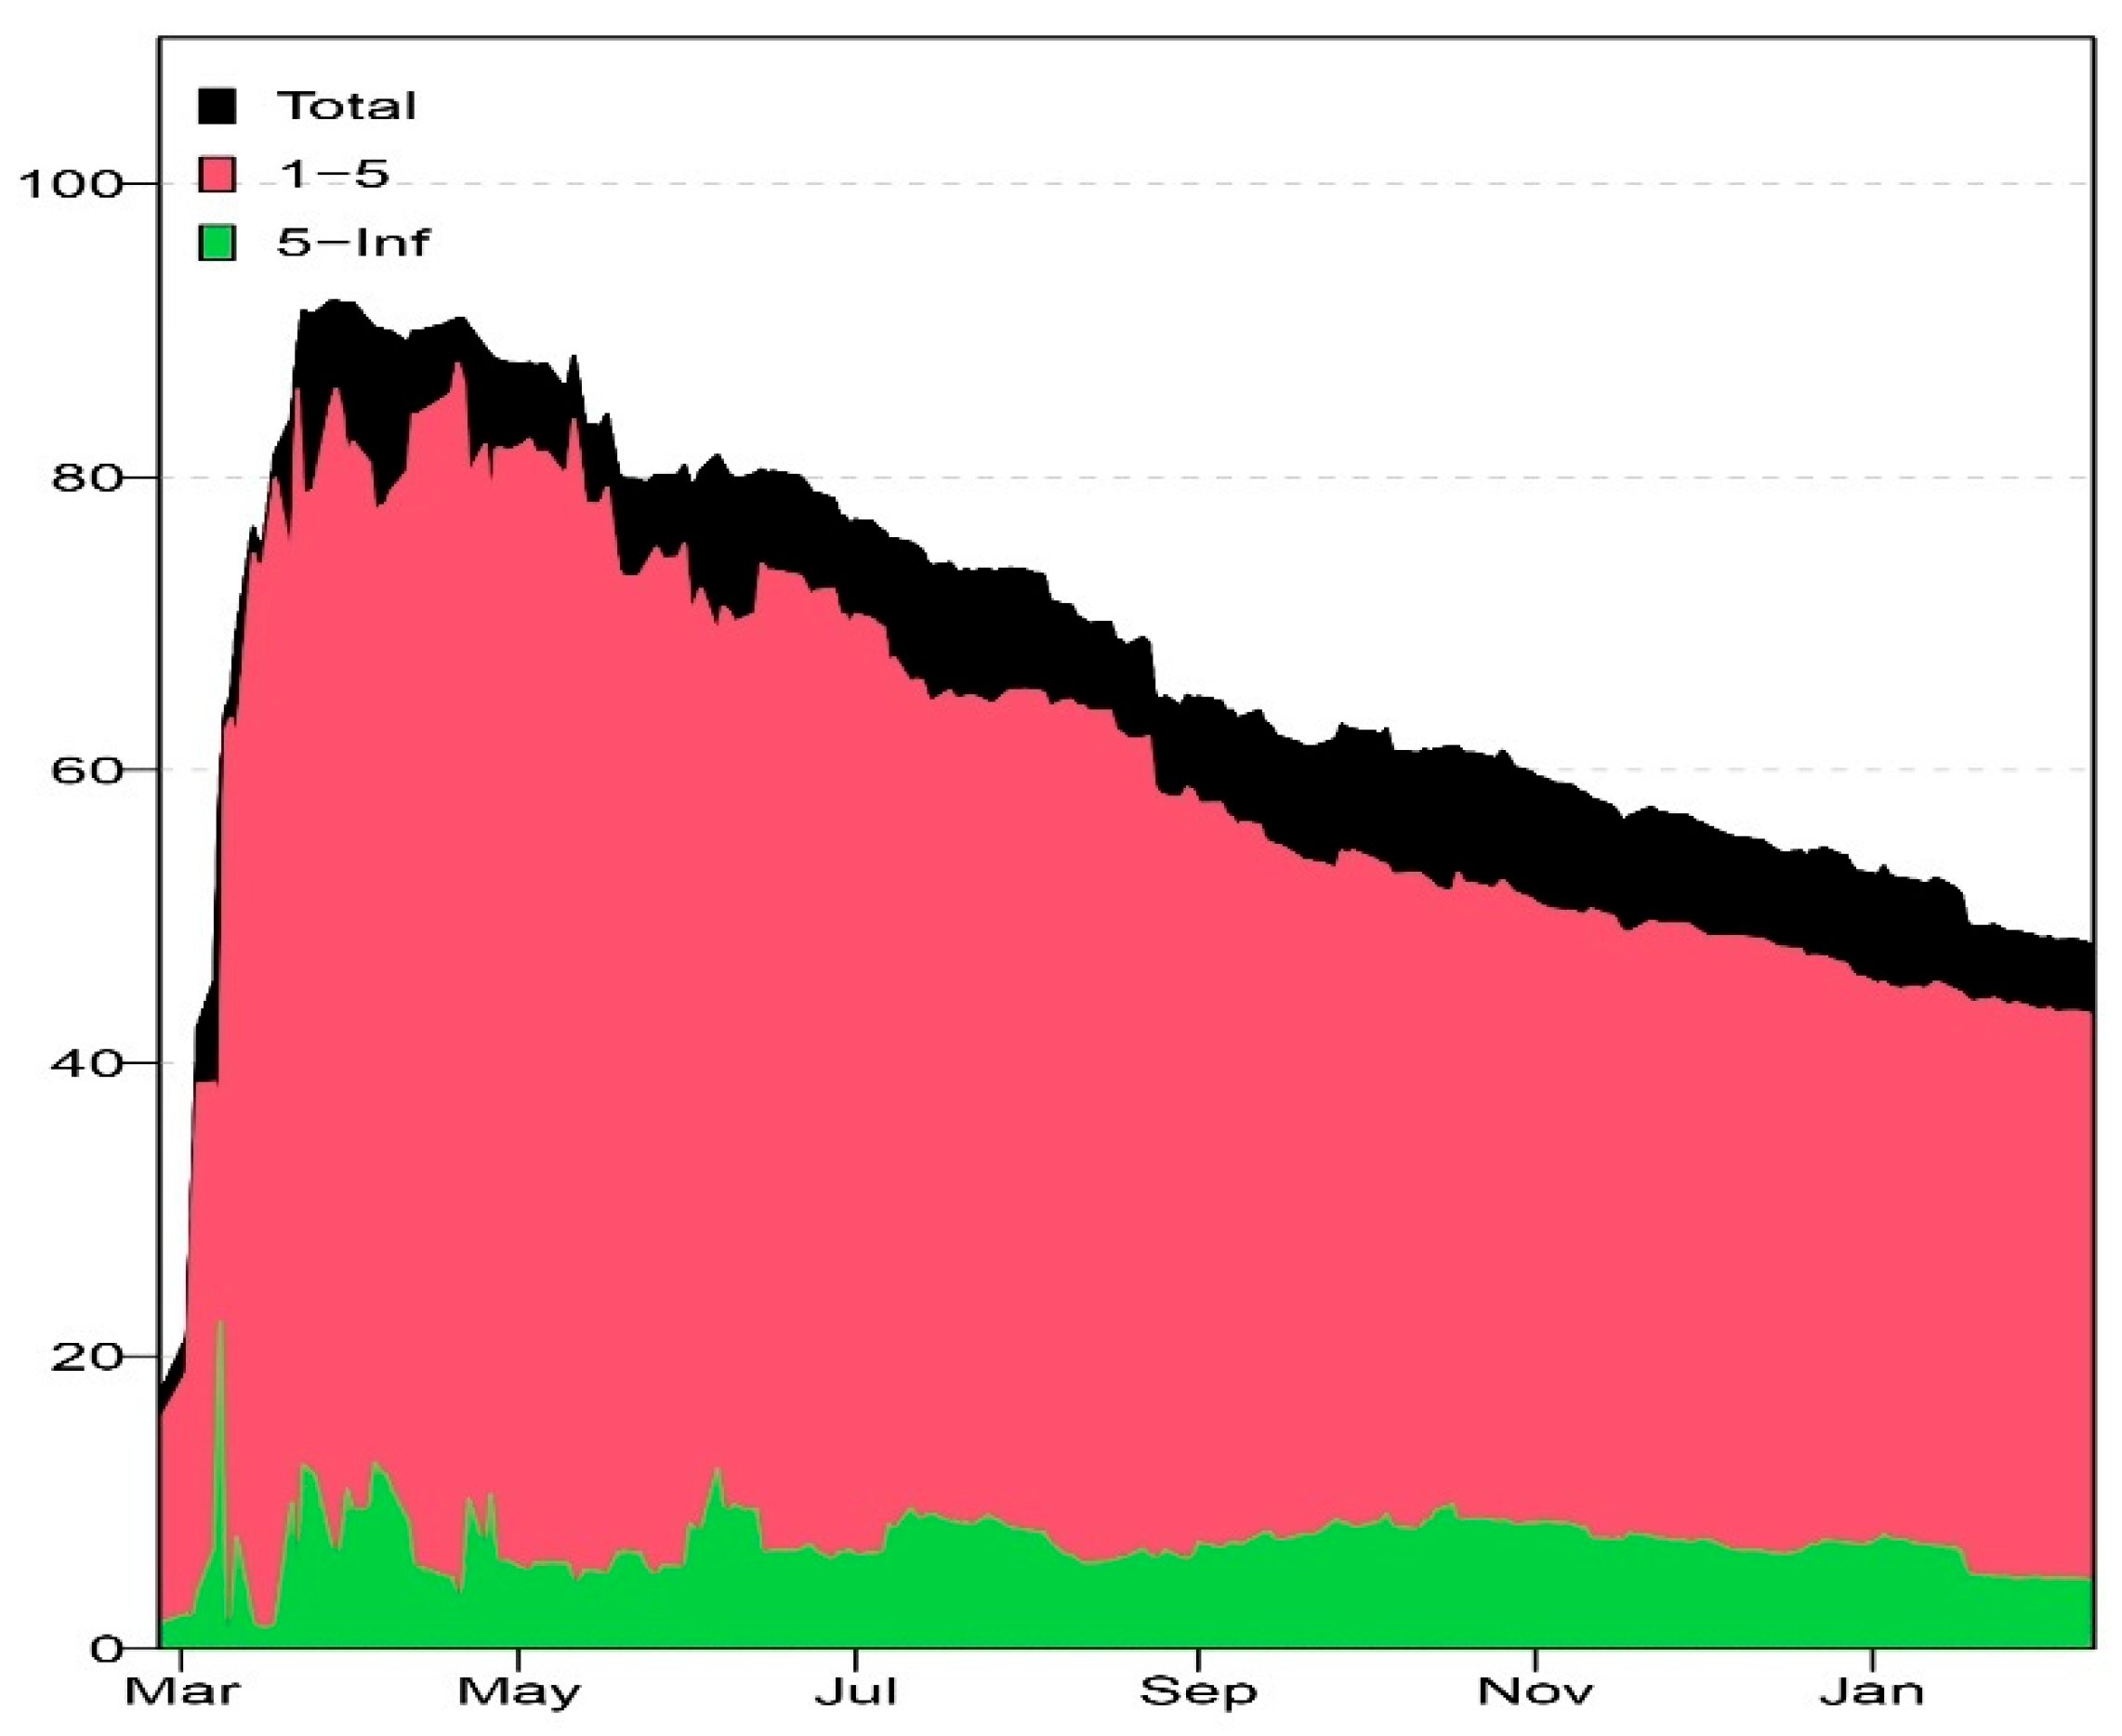
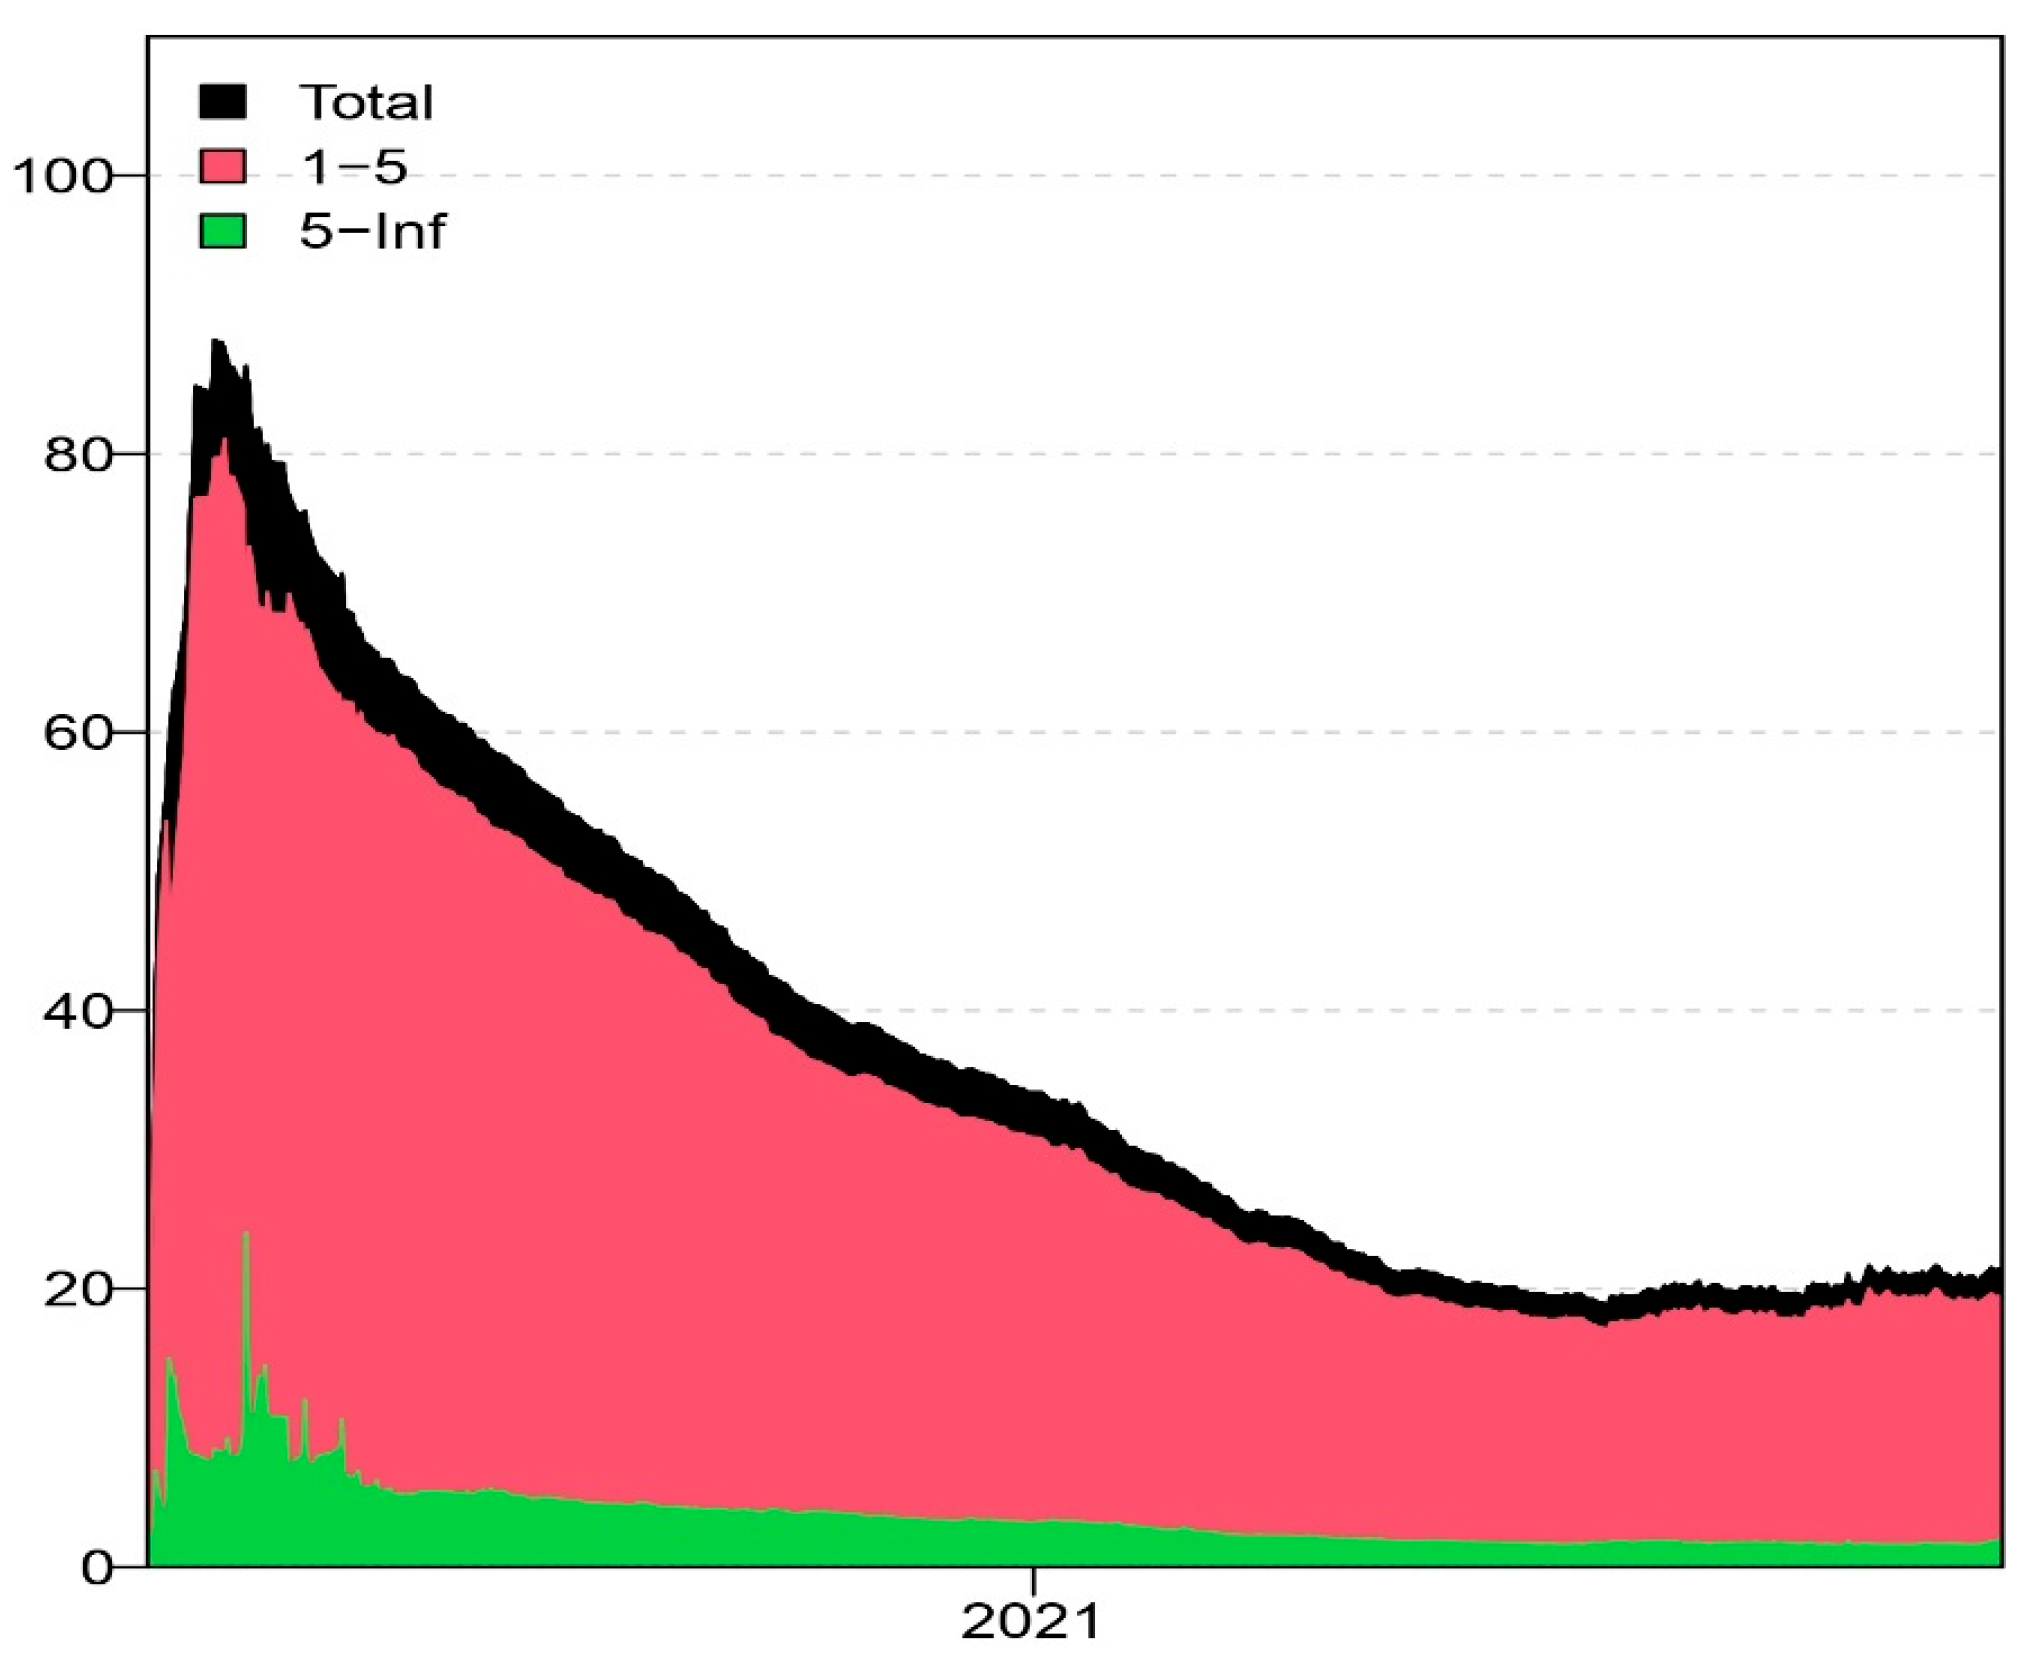
Figure 4 shows TCI across varied frequencies.
Moreover, the empirical results reveal that Brazil (7.97%), India (4%), Australia (4.61%), Germany (8.41%), and United Kingdom (9.89%) emerged as the primary recipients of volatility spillover across varied frequencies, except Australia, and India, which became net transmitters of volatility spillovers in the long run (5 and above) which reflects their growing influence in regional networks and structural reforms that strengthened market resilience (
Das & Debnath, 2022). Whereas Brazil, India, and the UK are major emerging and developed markets with substantial FPI exposure, which increases sensitivity to global shocks. Cross-border liquidity mismatches and dependence on foreign currency-denominated assets amplify volatility reception during stress events (
Korkusuz et al., 2023). Also, during 1–5 (short-term) frequency, Japan (8.28%), Turkey (10.05%), South Africa (9.7%), and the USA (7.58%) emerged as the net transmitter of shocks. Japan, Turkey, South Africa, and the USA became net transmitters due to their roles as global financial hubs and high-frequency trading activity. Moreover, the US dollar’s dominance and Japan’s liquidity provisions during crises exacerbated spillovers (
Mi et al., 2025). On the contrary, Italy (3.06%) and Saudi Arabia (3.14%) emerged as the primary recipients of volatility spillover in the long run, whereas the USA (2.12%), Turkey (2.13%), and Argentina (1.73%) emerged as the primary transmitters of shocks. Italy and Saudi Arabia are net recipients due to lower financial integration and sectoral vulnerabilities (e.g., Italy’s banking sector, Saudi Arabia’s oil dependency). Their markets absorb rather than transmit shocks during turbulence, whereas Argentina’s role as a transmitter aligns with its macroeconomic instability, which propagates volatility to neighboring markets despite its smaller size (
Korkusuz et al., 2023).
Table 4 presents the results of volatility spillover during the global financial crisis (GFC 2008).
Figure 5 shows the connectivity between the G20 nations across varied sub-periods, i.e., short-term, long-term, and full period.
Figure 6 and
Figure 7 show the “To, From, and net spillovers,” respectively.
Figure 8 shows the TCI across varied frequencies. The empirical findings reveal that the stock markets of USA (25.75%), Australia (6.98%), China (3.8%), France (1.58%), Germany (4.64%), India (2.92%), and Indonesia (4.1%), and Korea (5.71%), and Turkey (1.22%) emerged as the primary recipients of shocks during the GFC 2008 across varied frequencies. Since the US was the epicenter of the GFC 2008, the USA emerged as the biggest transmitter of volatility spillover. Australia’s high exposure to global trade and financial flows made it vulnerable to external shocks (
Guru & Yadav, 2023). Since France and Germany are the major European economies, they were heavily impacted by the contagion (
Akca & Ozturk, 2016). Moreover, Korea’s export-oriented economy and financial integration with global markets increased its susceptibility to the shocks (
B. Wang & Xiao, 2023). Furthermore, the emerging markets such as India, China, Indonesia, and Turkey’s growing financial integration made them more vulnerable to the shocks (
Dufrénot & Keddad, 2014;
Akca & Ozturk, 2016). On the contrary, Mexico (24.01%), Argentina (13.03%), and South Africa (3.81%) act as transmitters of shocks across varied frequencies. Since Mexico had great ties with the US (
Xiao et al., 2023), and Argentina’s financial instability and sovereign debt issues made these countries transmit the shock to other countries during the crisis period (
Nghi & Kieu, 2021). Moreover, South Africa is a significant commodity exporter (
Naeem et al., 2024). However, in the short run (1–5), Russia (9.59%) and Brazil (3.36%) were the transmitters of shocks, whereas they became net recipients of shocks in the long run (5–Inf). This shift suggests that while these markets initially contributed to global volatility, they eventually became more affected by the prolonged global financial instability (
T. Liu & Gong, 2020). Moreover, the table describes that the value of total connectedness was higher in the short run, reaching 24.45% in comparison to the long run, reaching 2.1%. These results indicate that the interactions were more significant within one week of the crisis. Also, over longer horizons, markets had time to absorb information and adjust, reducing the intensity of spillovers (
Naeem et al., 2024).
Table 5 states the empirical results of volatility spillover between G20 nations during the COVID-19 pandemic using the TVP VAR BK methodology.
Figure 9 shows the connectivity between the G20 nations across varied sub-periods, i.e., short-term, long-term, and full period.
Figure 10 and
Figure 11 show the “To, From, and net spillovers,” respectively.
Figure 12 shows the TCI across varied frequencies. The findings reveal that the UK (25.11%), Russia (13.3%), Canada (9.4%), Argentina (6.63%), China (6.29%), Italy (2.9%), and Korea (1.3%) act as the net recipients of shocks during the COVID-19 pandemic across the varied frequencies. The UK and Canada are the major global financial hubs, and their exposure to extensive global trade amplified their shock reception during the pandemic (
Li et al., 2021;
Xiang et al., 2022). Commodity-dependent economies such as Russia and Argentina faced dual shocks from induced demand contractions and oil price volatility, exacerbating their roles as net recipients (
Huang et al., 2023). Also, China’s manufacturing-centric economy suffered significant supply chain disruptions and export demand reduction, making it vulnerable to shocks during the pandemic (
Dsouza et al., 2024). However, Australia (2.08%), France (1.99%), Saudi Arabia (6.82%), South Africa (11.27%), and the USA (2.9%) emerged as the net transmitter of volatility spillover during the COVID-19 pandemic at both 1–5 (short term) and 5–Inf (long term) frequencies. The USA and Australia acted as volatility sources because of their central role in global capital flows and investor sentiment channels, whereas Saudi Arabia and South Africa amplified spillover via oil and mineral supply chains, thus transmitting volatility to other dependent markets (
Korkusuz et al., 2023). Also, Brazil, France, India, Indonesia, Japan, and Turkey acted as a net transmitter of shocks in the short run, but they became net recipients of shocks in the long run. Initial pandemic shocks allowed these markets to transmit volatility via rapid sell-offs and currency fluctuations, whereas prolonged economic strain increased their susceptibility to external shocks, reversing their net position (
Li et al., 2021;
Yu et al., 2021). This implies that investors looking for long-run gains must look beyond these countries during the crisis period.
Table 4 also reveals that the TCI was 33.85% in the short run (1–5), which reached 3.64% in the short run. It implies that short-term spikes reflected panic-driven contagion, where spillovers amplified over tightly linked markets, whereas long-term reduction signaled investor recalibration.
Table 6 reveals the empirical results of volatility spillover between G20 nations during the Russia-Ukraine crisis.
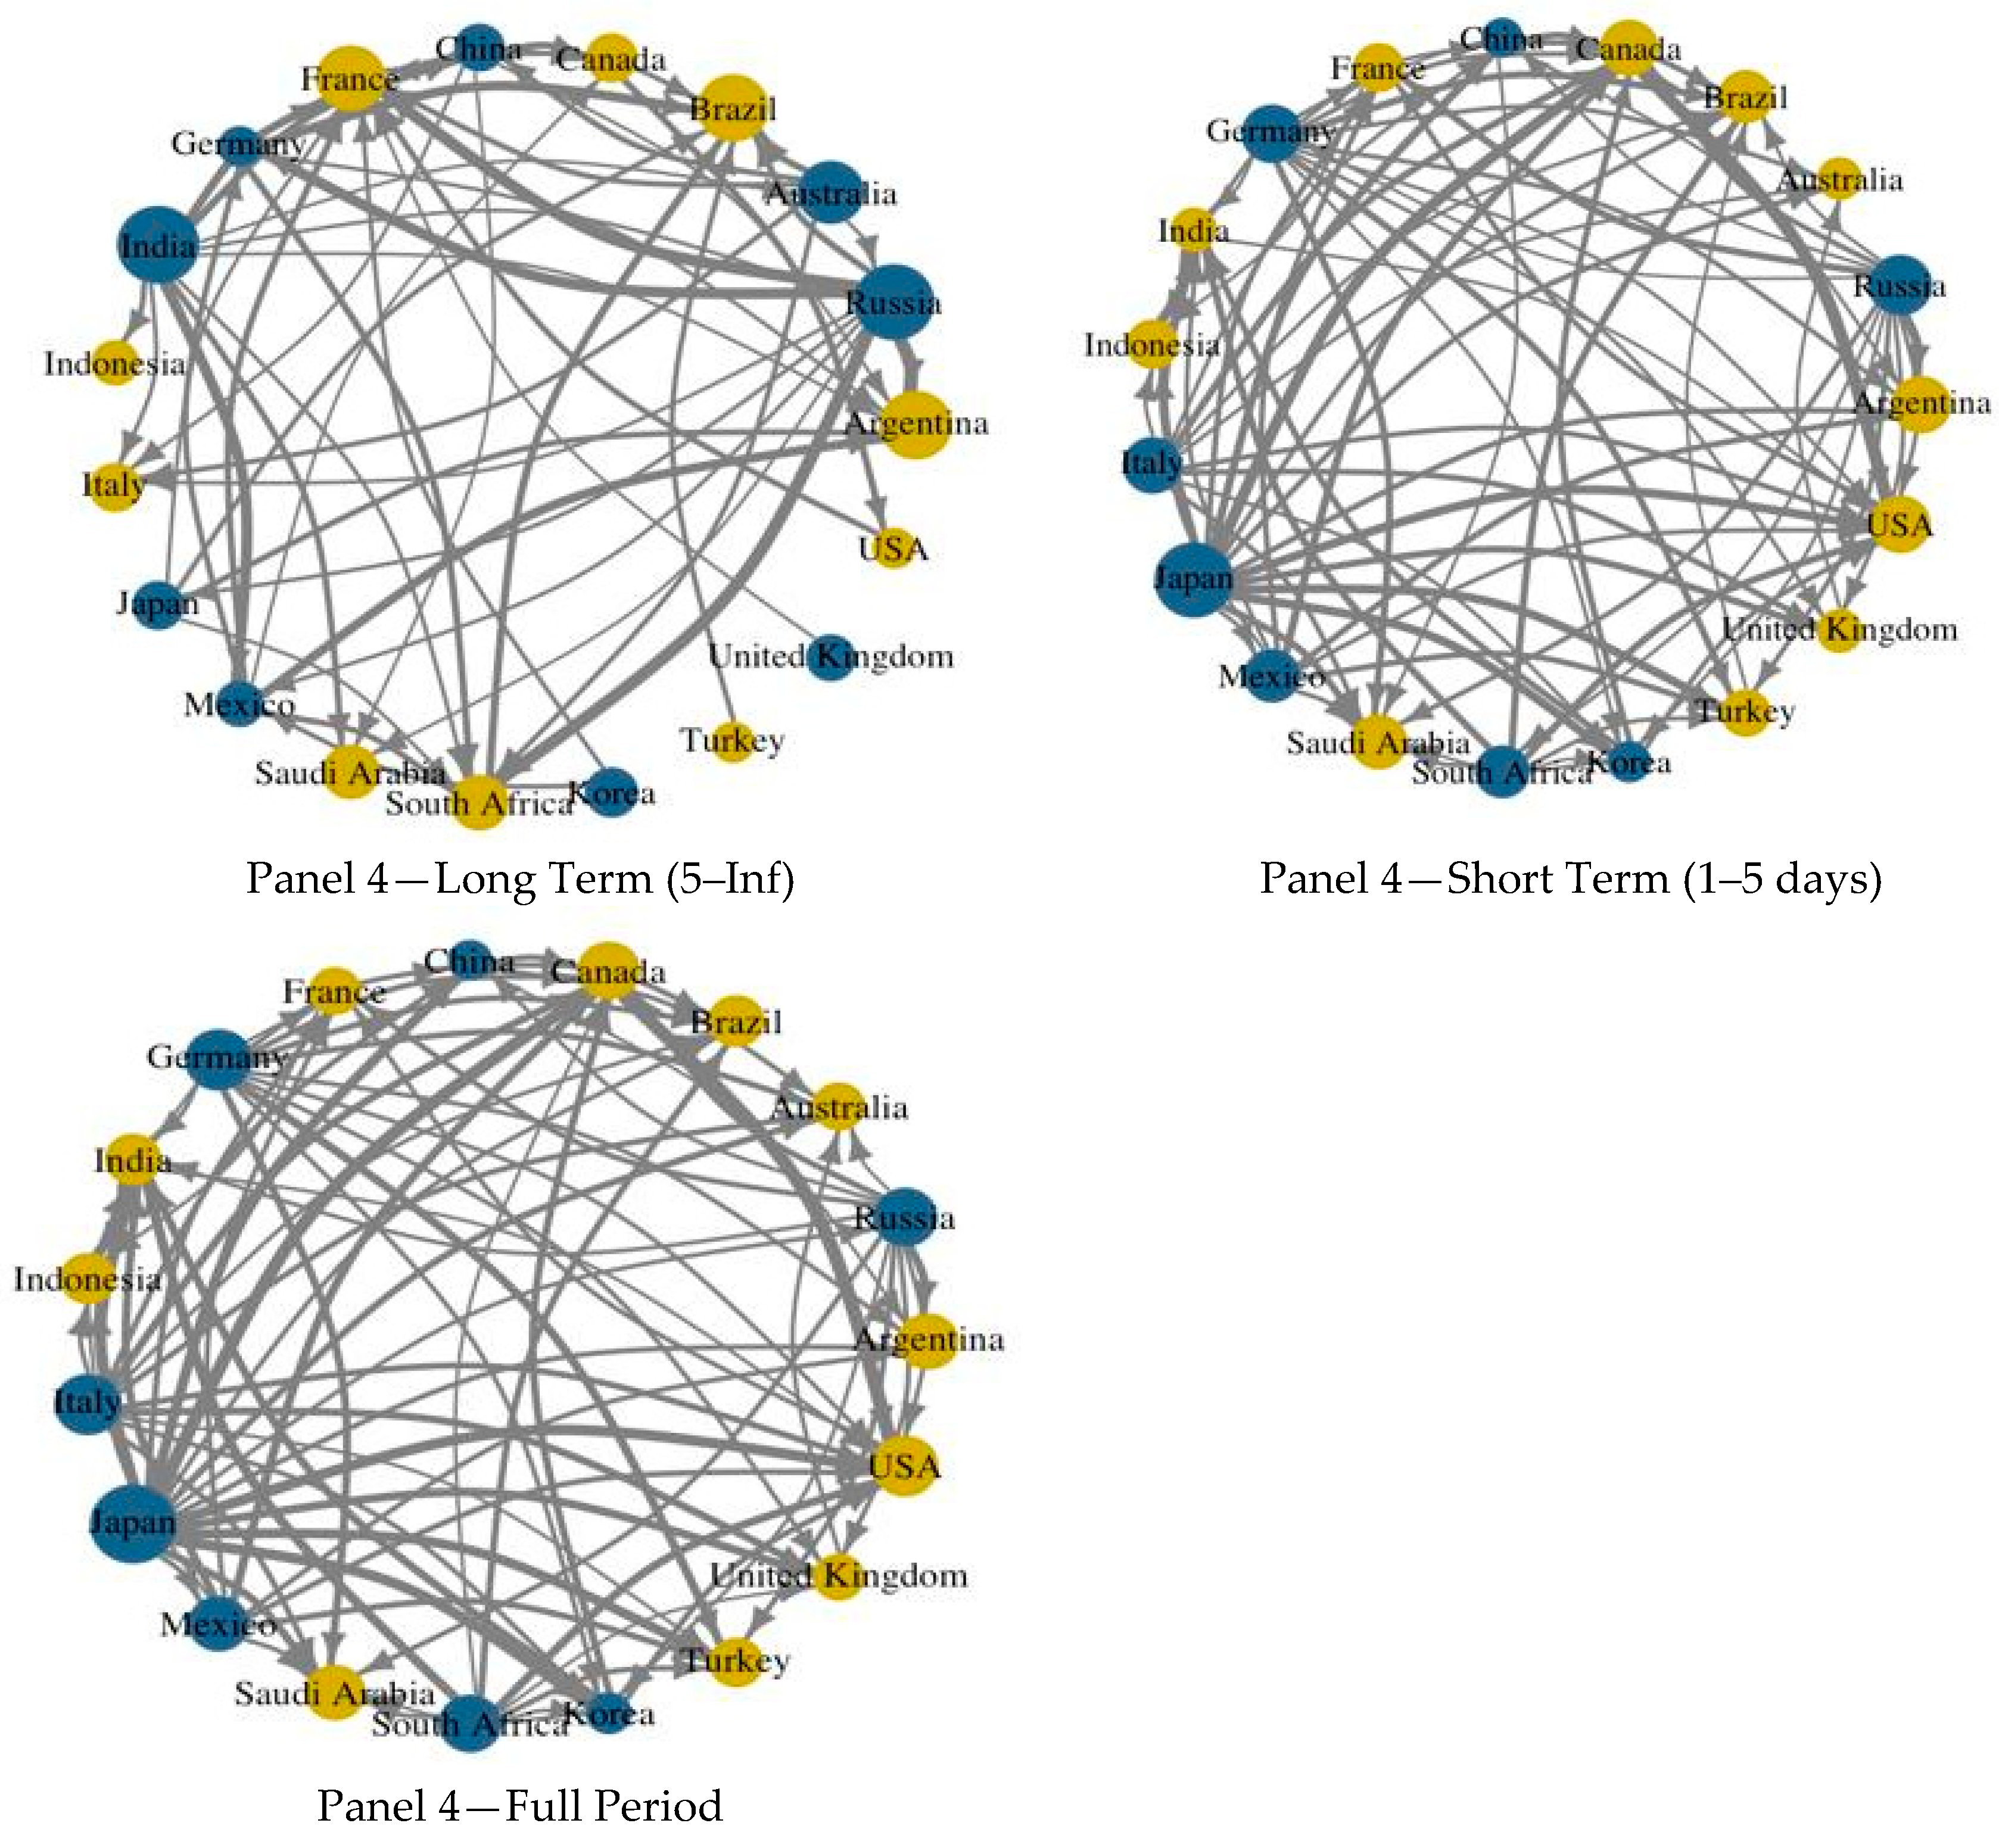
Figure 13 shows the connectivity between the G20 nations across varied sub-periods, i.e., short-term, long-term, and full period.
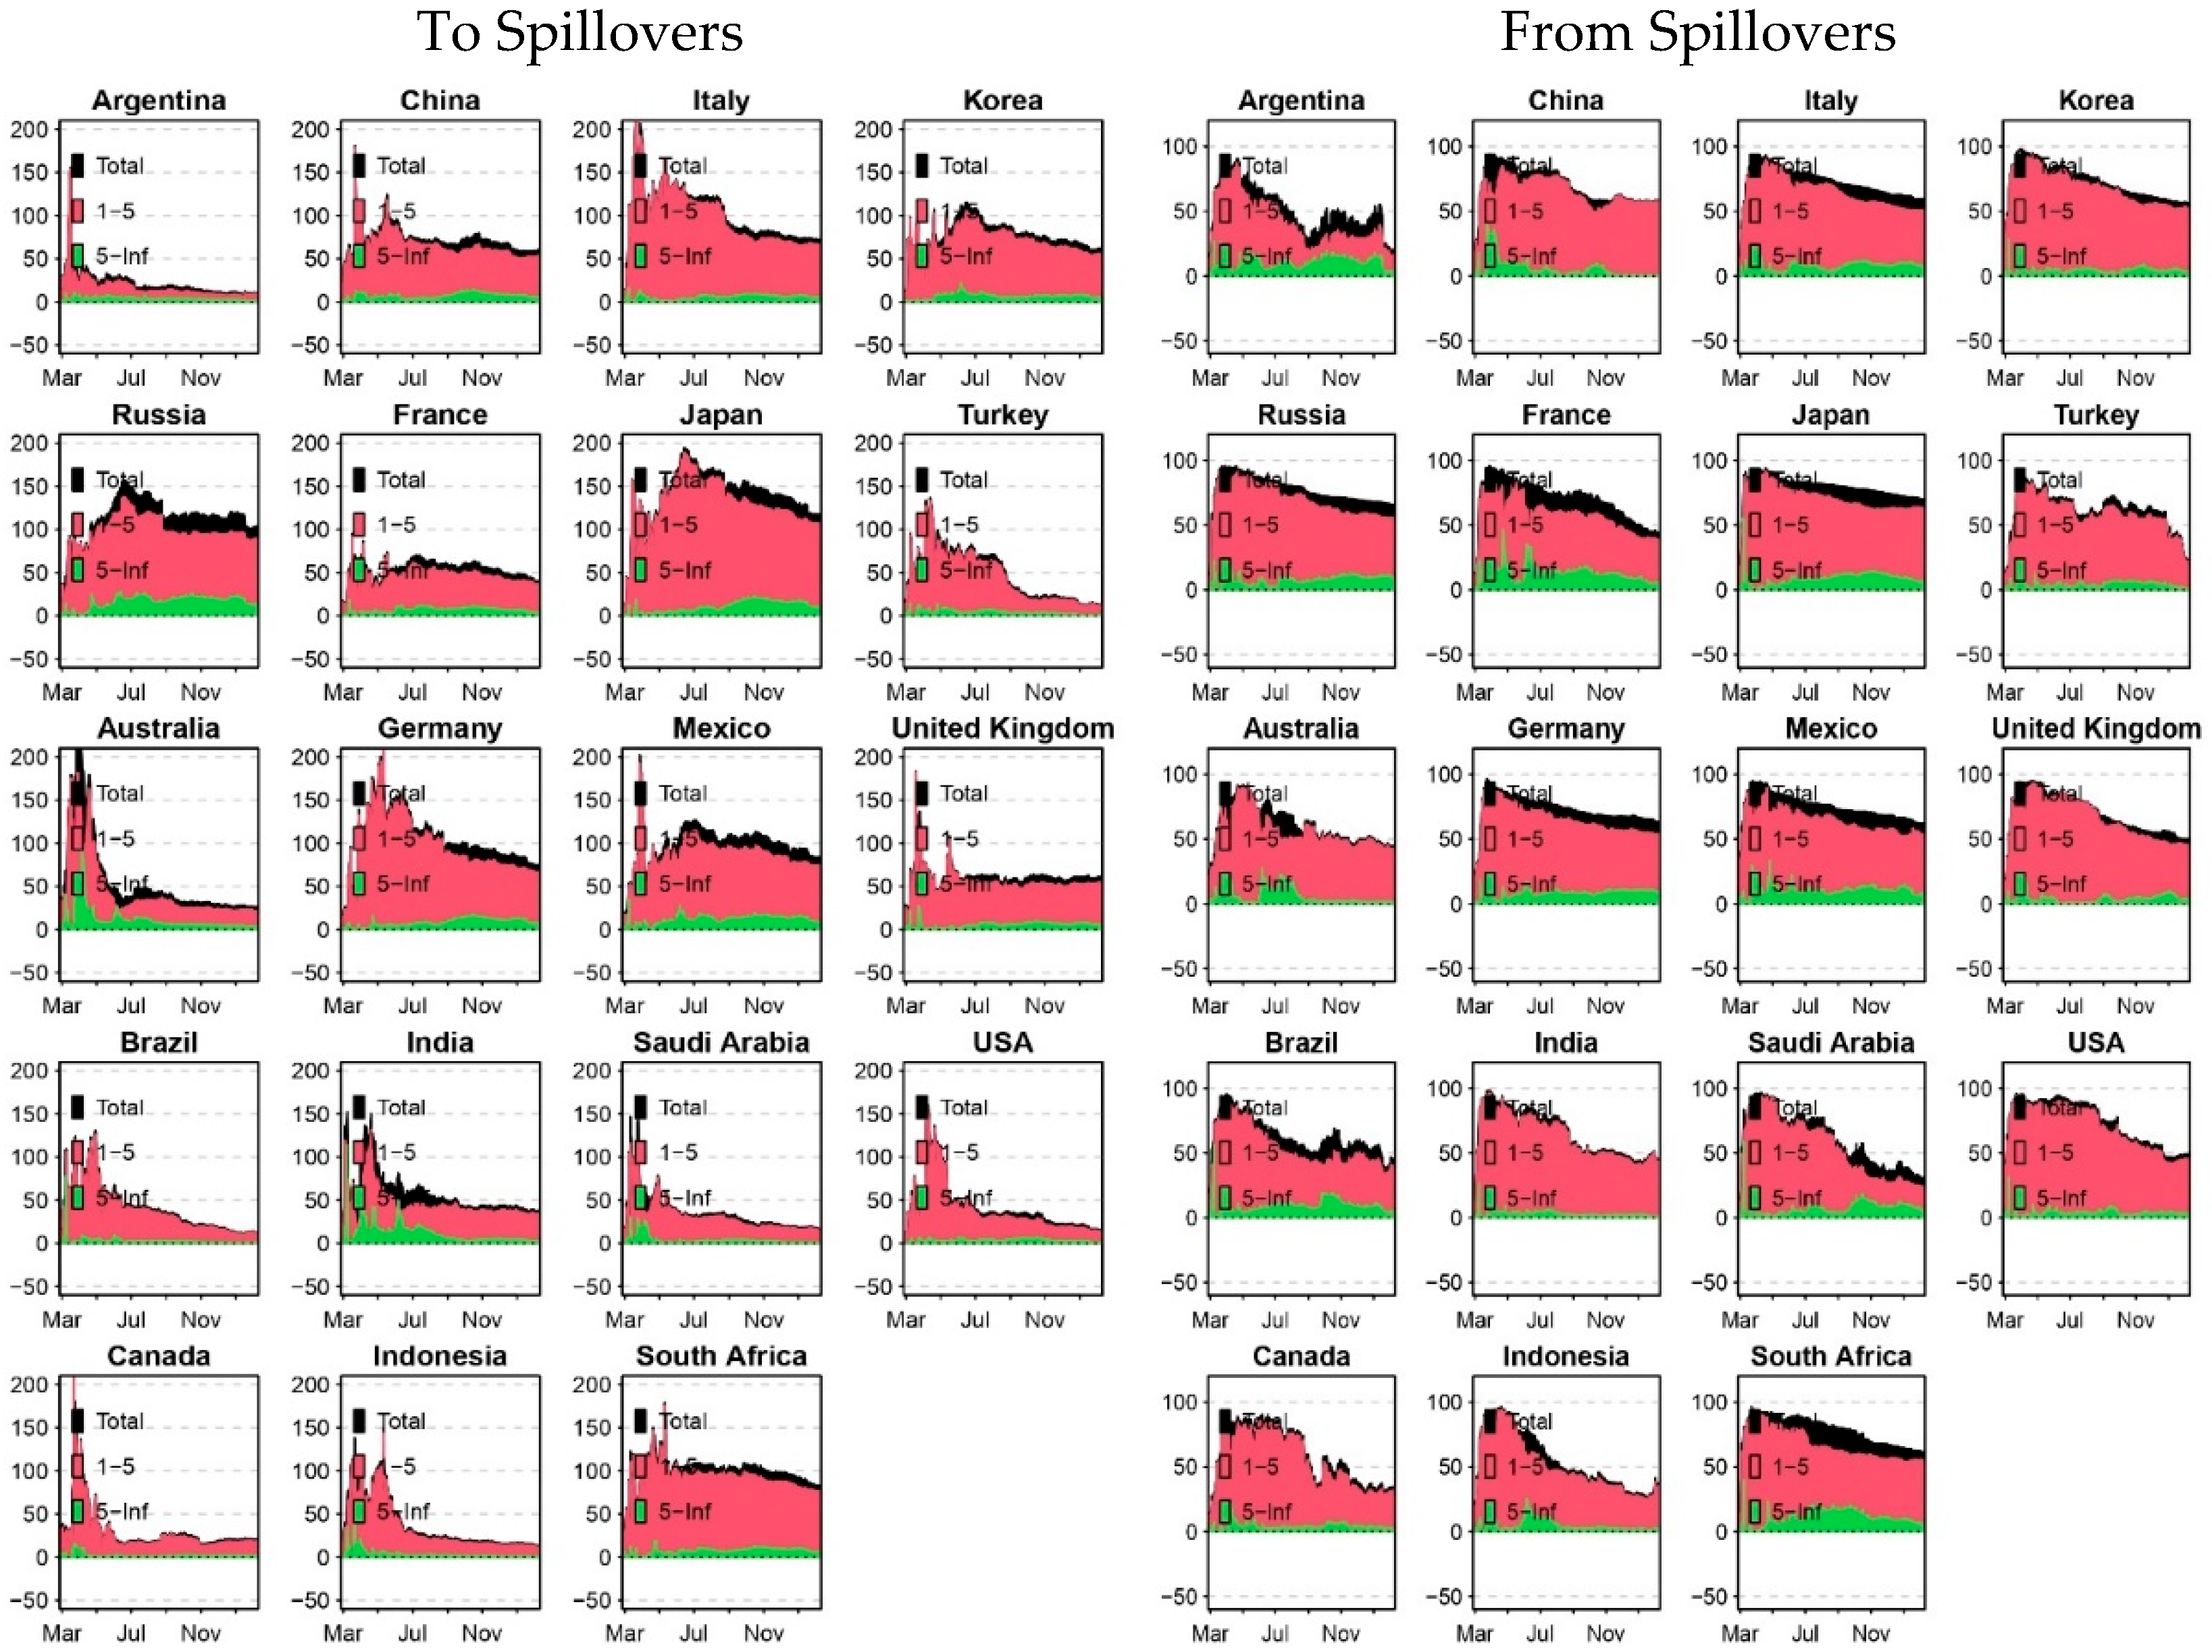
Figure 14 and
Figure 15 show the “To, From, and net spillovers,” respectively.
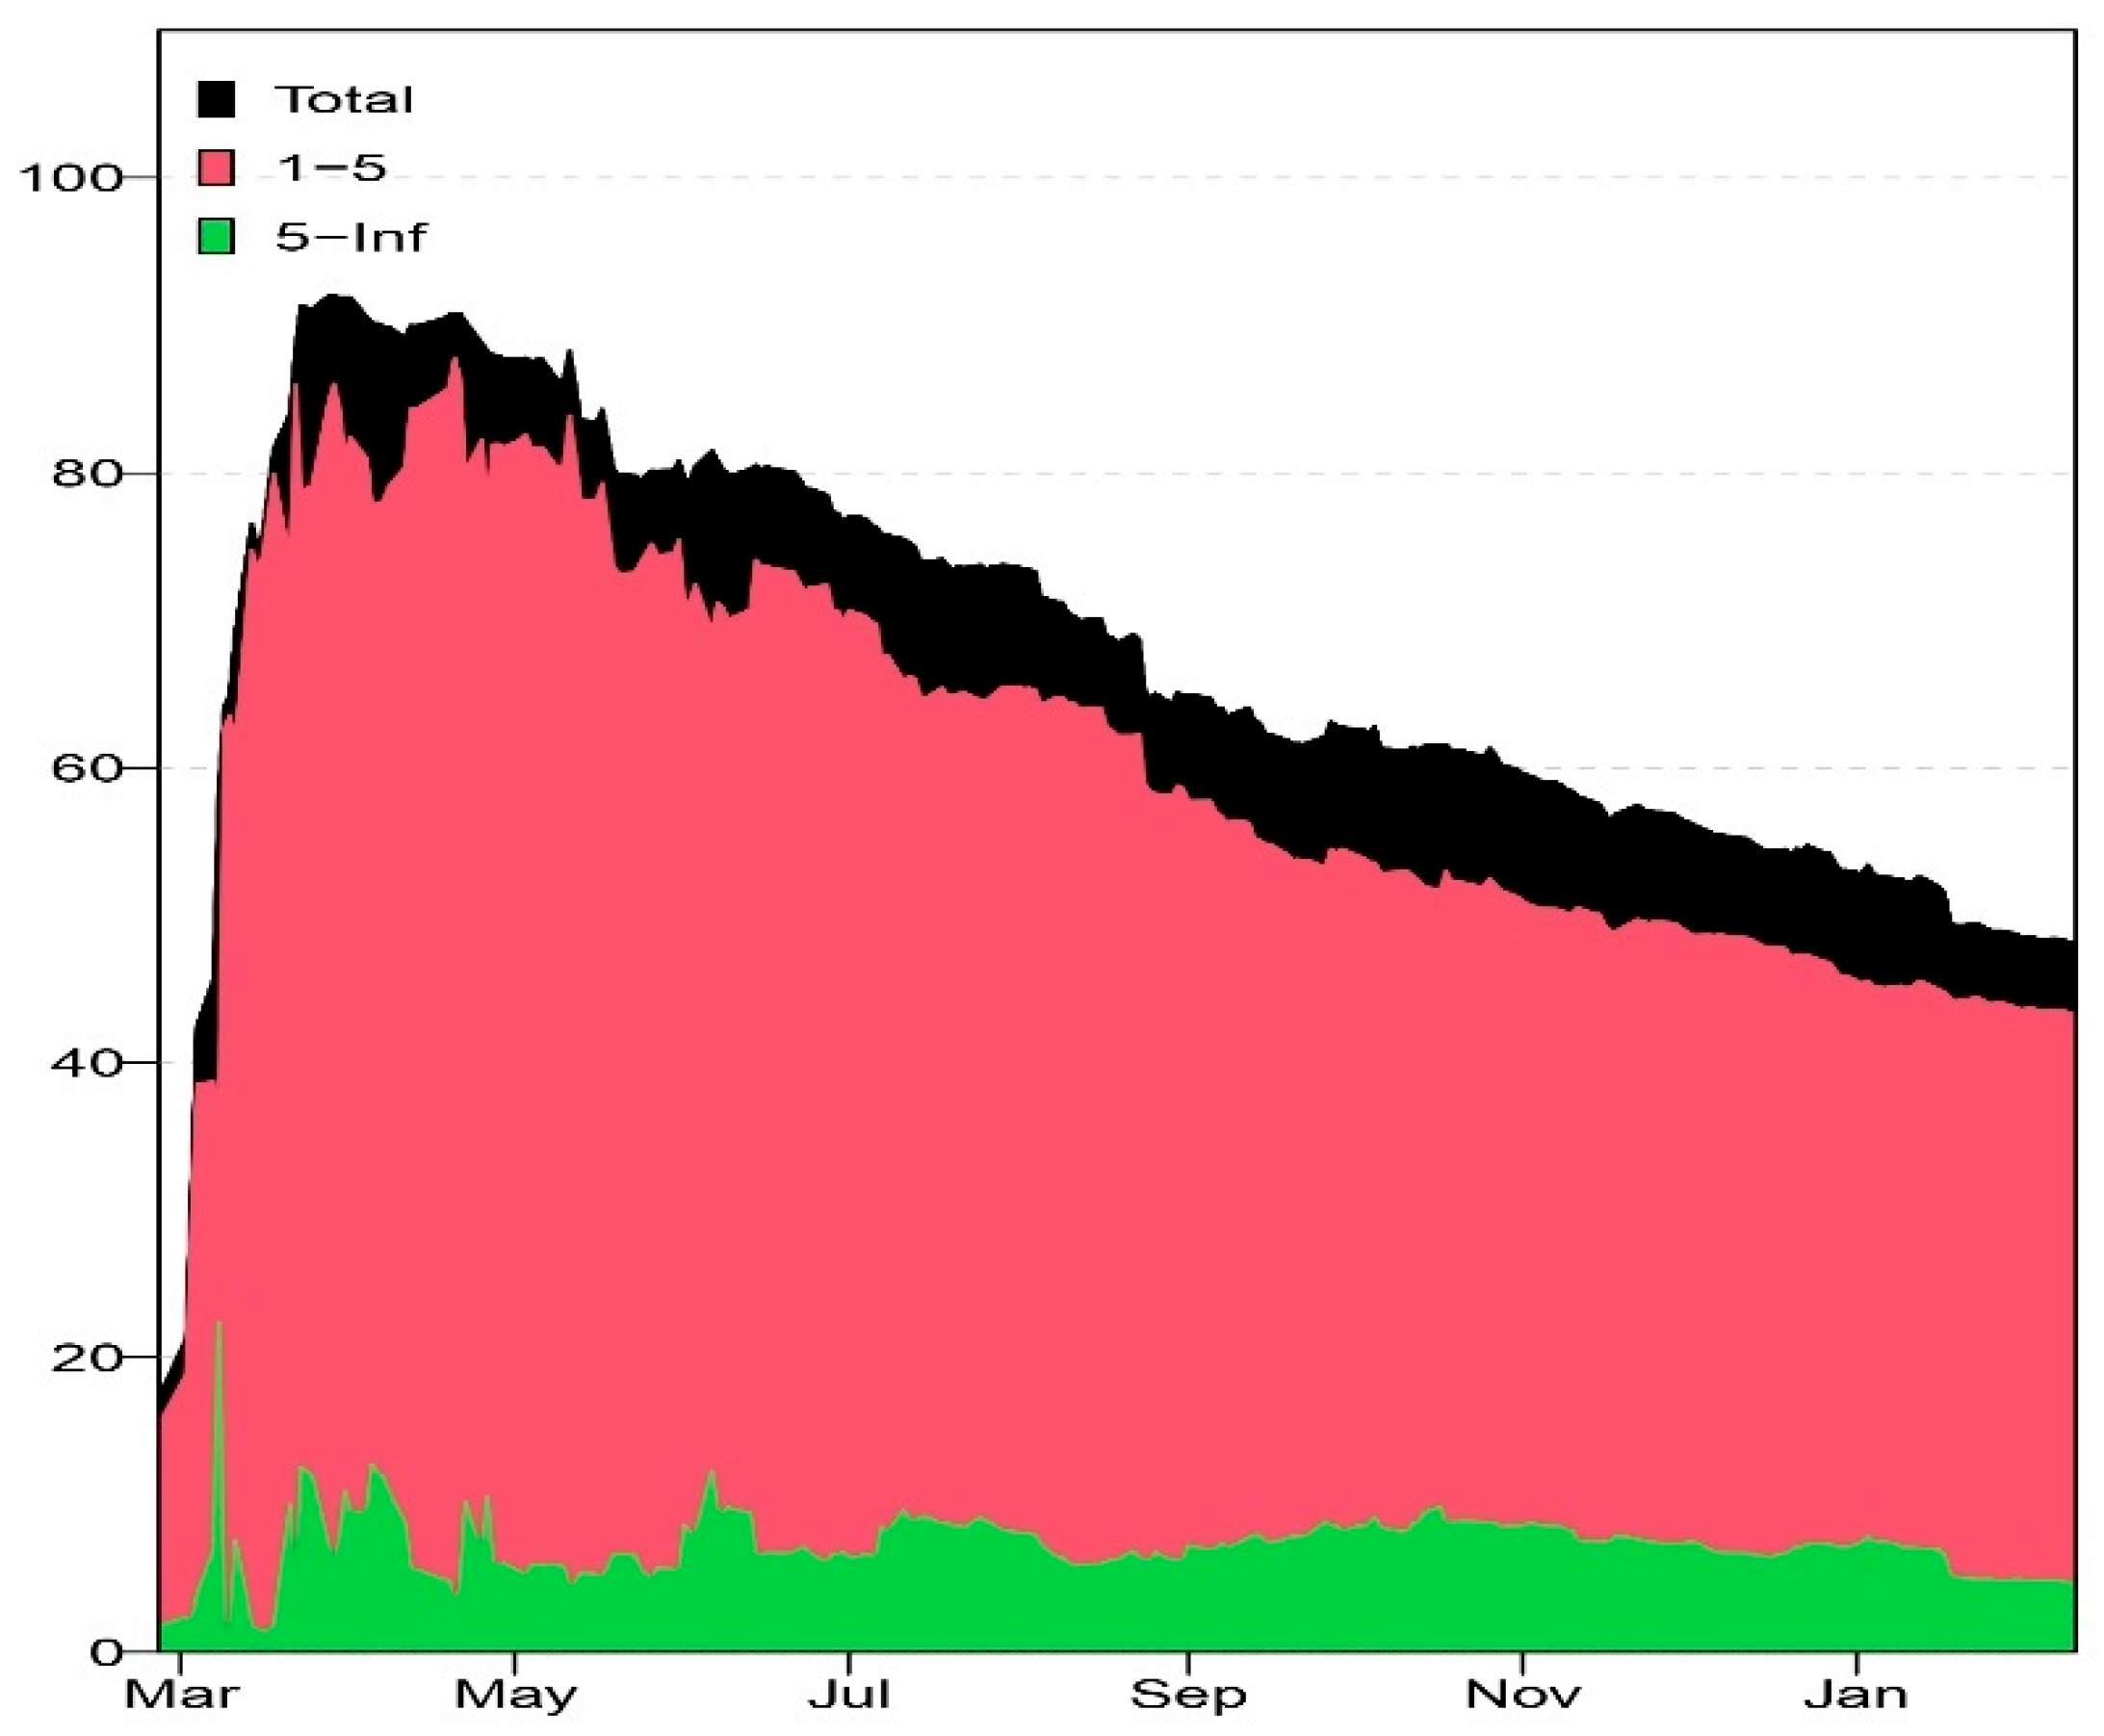
Figure 16 shows the TCI across varied frequencies. The findings of the TVP VAR BK model reveal that the USA (30.49%), Canada (25.81%), Argentina (23.79%), Brazil (17.04%), Indonesia (16.33%), Turkey (14.11), and France (10.72%) emerged as the net recipients of shocks during the Russia Ukraine crisis across the two frequency domains i.e., short term (1–5) and long term (5–Inf) both. US financial markets were significantly impacted by the external factors, and Canada, having close ties with the US, absorbed substantial volatility spillover during the crisis (
Korkusuz et al., 2023). Argentina, Indonesia, and Brazil’s high percentage is due to their vulnerability to external shocks and the emerging market status (
Altınkeski, 2023;
Ahmed Memon et al., 2024). Also, Turkey’s position as a net recipient is due to its economic vulnerability and geographic proximity to the conflict zone (
Akbulut et al., 2024). France, despite being a developed economy, absorbed significant shocks due to energy dependence and trade relations with the affected regions (
Yousaf et al., 2022). On the contrary, Japan (57.53%), Germany (31.83%), Mexico (22.72%), and Russia (27.73%) act as net transmitters of shocks across the varied sub-periods. Japan is a major importer of liquefied natural gas (LNG) and oil. The crisis and subsequent sanctions on Russia led to a sharp increase in global prices (
Pohlkamp, 2023). Thus, it transmits shocks to other G20 nations. Germany, Mexico, and Russia acted as net transmitters of shocks during the Russia-Ukraine crisis due to their central roles in global and regional trade, their importance in key sectors (energy, manufacturing, commodities), and the direct and indirect effects of war, sanctions, and supply disruptions on their economies and their trading partners in the G20 (
Vladimirov et al., 2023). Moreover, the findings also reveal that in the short run, Australia, India, South Africa, and Turkey act as net recipients of shocks, whereas in the long run, these countries become net transmitters of shocks. In the short run, high external exposure, dominance of global markets, and limited immediate response made these countries vulnerable to the crisis (
Hendy & Beckers, 2024). Whereas, in the long run, economic growth and integration, feedback effects, and structural adjustments made these countries act as net transmitters of shocks (
Attílio, 2024). Similarly, Italy and South Africa were the net transmitters of shocks in the short run. However, they became net recipient of shocks in the long run. Italy and South Africa initially amplified and transmitted shocks due to their economic structures and policy responses. Over time, however, their own vulnerabilities and the persistence of global instability made them more susceptible to external shocks, turning them into net recipients in the long run (
Giangrande, 2023). Furthermore, the results show the value of TCI, which reached 60.48% in the short run and 7.17% in the long run. The high short-term TCI value indicates the immediate and significant impact of the Russia-Ukraine crisis on global financial market interconnectedness. Long-term volatility patterns showed greater independence between markets.
Robustness Check
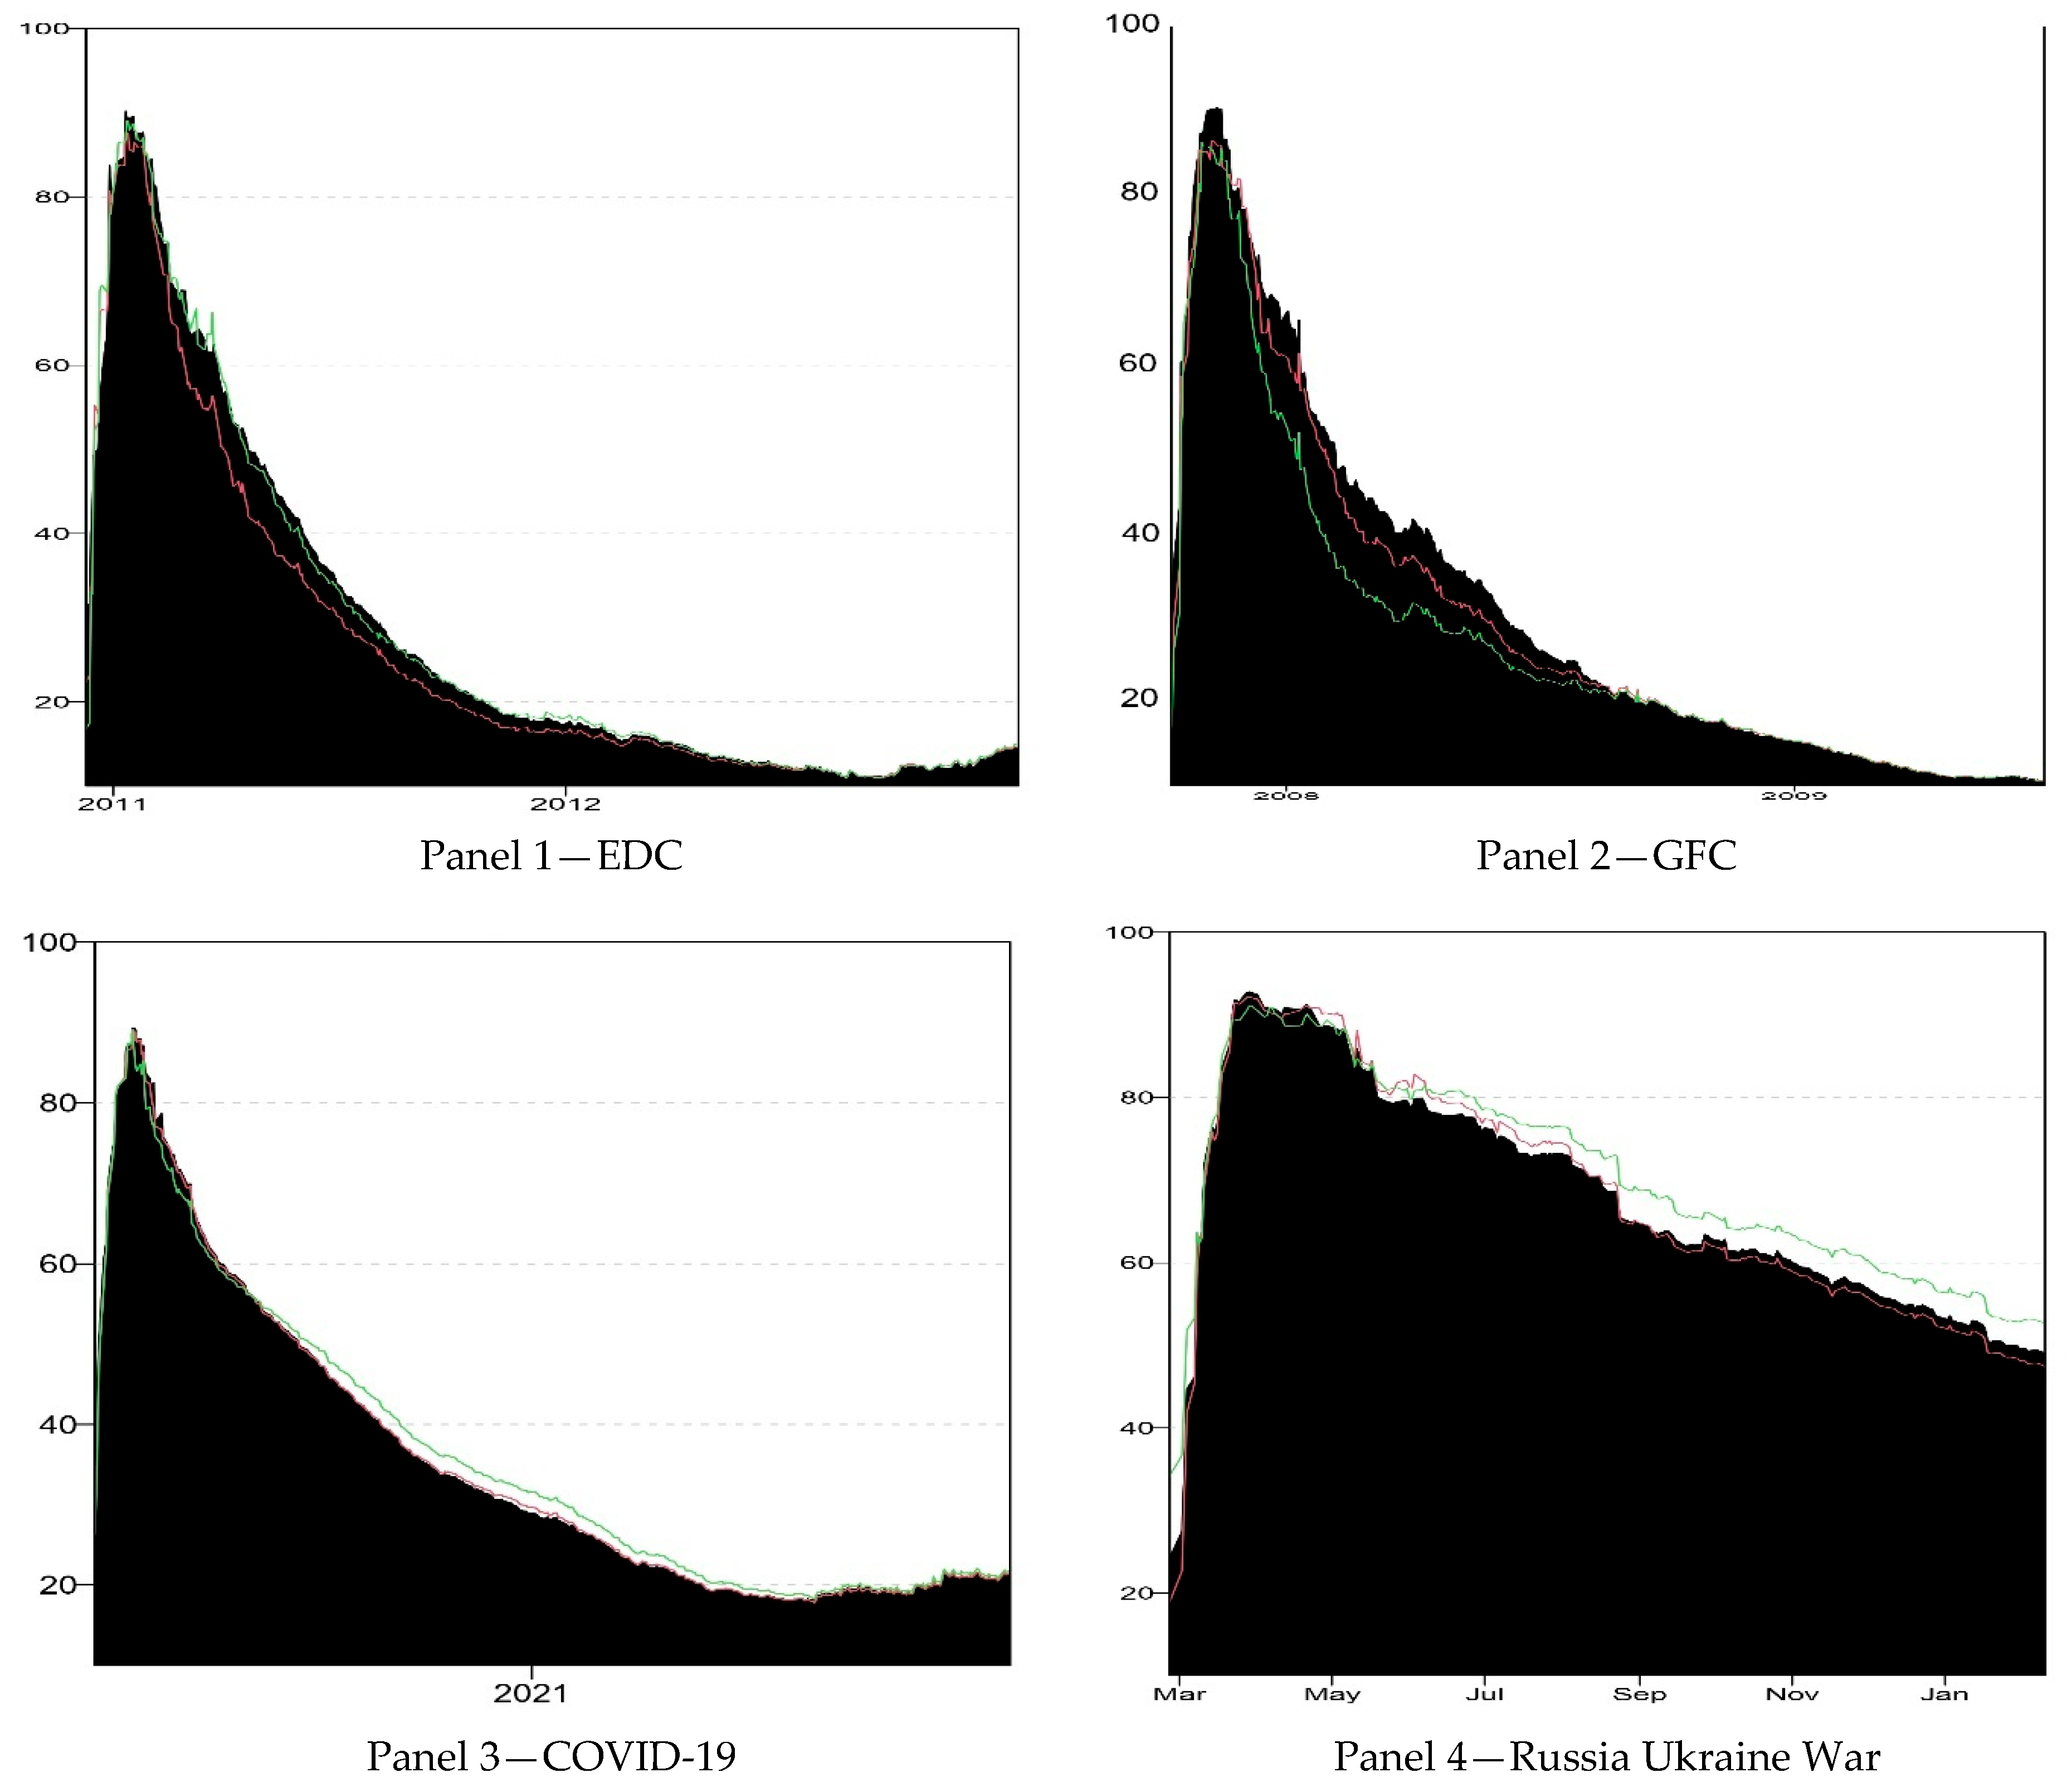
To evaluate the validity of our results, we conducted a robustness check on the spillover impact using various window widths. The research used three rolling window widths of 150, 200, and 250 for EDC, COVID-19, and GFC. Nevertheless, due to the shorter time frame, the rolling window widths for the Russia-Ukraine conflict were set at 100, 150, and 200. An analysis of the spillover curves shown in
Figure 17 reveals that the general trend stays mostly uniform across different rolling window widths. This indicates that the duration of the window has little influence on the results derived from the empirical investigation. Moreover, the green line represents the TCI using 150 days window, the red line represents TCI using 250 days window, and black shaded area represents 200 days window. Similarly, during Russia Ukraine war the green line represents the TCI using 100 days window, the red line represents TCI using 200 days window, and black shaded area represents 150 days window.
5. Conclusions
Our empirical TVP-VAR BK study reveals that volatility spillovers among G20 equity markets exhibited significant variation depending on the crisis episode. The TCI was mild in the GFC and EDC at approximately 25% in the near term, but increased to about 34% during COVID-19 and reached an extraordinary 60% during the Russia-Ukraine conflict. During the 2008-2009 Global Financial Crisis, the United States, as the epicenter, served as the primary transmitter of volatility, alongside other sources of disruption such as Mexico, Argentina, and South Africa, while major markets in North America, Asia, and Europe (e.g., Australia, China, India, Korea, France, Germany) predominantly absorbed the majority of the shocks. During the European Debt Crisis, spillovers were somewhat constrained: short-term net transmitters were Japan, Turkey, South Africa, and the United States, while emerging and developed markets, including Brazil, India, Australia, Germany, and the United Kingdom (along with Italy and Saudi Arabia in the long term), functioned as net receivers.
During the COVID-19 crisis, cross-market contagion escalated (TCI = 33.9%), with the UK, Russia, Canada, Argentina, China, and Italy experiencing significant volatility, while the US, Australia, Saudi Arabia, and South Africa functioned as net shock transmitters. Additionally, countries such as Brazil, India, and Turkey transitioned from short-run transmitters to long-run receivers as the pandemic progressed. The Russia-Ukraine war resulted in the highest level of interconnectedness, with Japan, Germany, Russia, and Mexico emerging as significant exporters of volatility, while the markets in the US, Canada, Brazil, Indonesia, Turkey, and France served as primary recipients. These findings demonstrate distinct crisis-specific patterns, ranging from the moderate, predominantly Europe-North America-centered spillovers in the EDC to the global, commodity-driven contagion resulting from the Russia-Ukraine war, and underscore the significant shifts in “transmission hub” countries and overall market integration (TCI) across crises. Thus, this study adds significantly to the literature on financial market volatility and contagion among G20 economies. It compares dynamic volatility spillovers across four major global crisis episodes, the global financial crisis of 2008, the European debt crisis, the COVID-19 pandemic, and the Russia-Ukraine war, using daily equity returns from all G20 stock markets. The use of advanced econometric techniques, specifically a time-varying parameter VAR (TVP-VAR) in conjunction with BK frequency domain decomposition, represents a methodological advancement that enables a nuanced investigation of both short-term (1–5 days) and long-term (5–Inf days) spillover effects.
The research has several limitations with the study, like the fact that it only uses data from the stock market, daily frequency returns, and summed crisis period windows. These might make it harder to understand how transmission mechanisms work at the sector or high-frequency level. The study also doesn’t look at exogenous factors like policy announcements, macroeconomic shocks, or sentiment data, which could help us understand what causes short- and long-term spillovers better. As our study is mostly about the frequency-based BK spillover index and TVP VAR, future research can focus on new and advanced models such as neural networks, Markov switching copula contagion, and mixed-frequency deep learning. These models may help us understand nonlinear dynamics and regime-dependent contagion patterns better.
