Next Issue
Volume 14, March
Previous Issue
Volume 13, September


Econometrics, Volume 13, Issue 4 (December 2025) – 15 articles

Cover Story (view full-size image): 
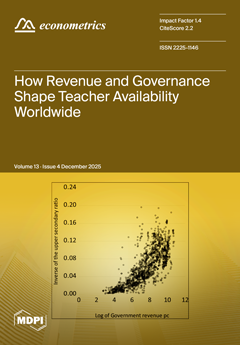
This paper models how government revenue and governance quality affect teacher supply worldwide. Using data from 217 countries (1980–2022), the authors build a nonlinear logistic model linking revenue per capita and governance indicators to the school‑age population‑to‑teacher ratio. They find that higher revenue increases teacher supply, and strong governance amplifies this effect. The model helps predict how fiscal changes could advance progress toward SDG 4.c on expanding qualified teacher numbers. View this paper
  • Issues are regarded as officially published after their release is announced to the table of contents alert mailing list.
  • You may sign up for e-mail alerts to receive table of contents of newly released issues.
  • PDF is the official format for papers published in both, html and pdf forms. To view the papers in pdf format, click on the "PDF Full-text" link, and use the free Adobe Reader to open them.
Order results
Result details
Select all
Export citation of selected articles as:
28 pages, 1813 KB  
Article
Econometric and Python-Based Forecasting Tools for Global Market Price Prediction in the Context of Economic Security
by Dmytro Zherlitsyn, Volodymyr Kravchenko, Oleksiy Mints, Oleh Kolodiziev, Olena Khadzhynova and Oleksandr Shchepka
Econometrics 2025, 13(4), 52; https://doi.org/10.3390/econometrics13040052 - 15 Dec 2025
Viewed by 1249
Abstract
Debate persists over whether classical econometric or modern machine learning (ML) approaches provide superior forecasts for volatile monthly price series. Despite extensive research, no systematic cross-domain comparison exists to guide model selection across diverse asset types. In this study, we compare traditional econometric [...] Read more.
Debate persists over whether classical econometric or modern machine learning (ML) approaches provide superior forecasts for volatile monthly price series. Despite extensive research, no systematic cross-domain comparison exists to guide model selection across diverse asset types. In this study, we compare traditional econometric models with classical ML baselines and hybrid approaches across financial assets, futures, commodities, and market index domains. Universal Python-based forecasting tools include month-end preprocessing, automated ARIMA order selection, Fourier terms for seasonality, circular terms, and ML frameworks for forecasting and residual corrections. Performance is assessed via anchored rolling-origin backtests with expanding windows and a fixed 12-month horizon. MAPE comparisons show that ARIMA-based models provide stable, transparent benchmarks but often fail to capture the nonlinear structure of high-volatility series. ML tools can enhance accuracy in these cases, but they are susceptible to stability and overfitting on monthly histories. The most accurate and reliable forecasts come from models that combine ARIMA-based methods with Fourier transformation and a slight enhancement using machine learning residual correction. ARIMA-based approaches achieve about 30% lower forecast errors than pure ML (18.5% vs. 26.2% average MAPE and 11.6% vs. 16.8% median MAPE), with hybrid models offering only marginal gains (0.1 pp median improvement) at significantly higher computational cost. This work demonstrates the domain-specific nature of model performance, clarifying when hybridization is effective and providing reproducible Python pipelines suited for economic security applications. Full article
Show Figures

Figure 1

26 pages, 2660 KB  
Article
Credit Rationing, Its Determinants and Non-Performing Loans: An Empirical Analysis of Credit Markets in Polish Banking Sector
by Cenap Mengü Tunçay and Elżbieta Grzegorczyk-Akın
Econometrics 2025, 13(4), 51; https://doi.org/10.3390/econometrics13040051 - 8 Dec 2025
Viewed by 1046
Abstract
In a situation where the number of non-performing loans (NPLs) increases, lenders may raise interest rates to compensate for potential losses, and the amount of credit granted in the market may decrease, leading to credit rationing. Such actions may become vital based on [...] Read more.
In a situation where the number of non-performing loans (NPLs) increases, lenders may raise interest rates to compensate for potential losses, and the amount of credit granted in the market may decrease, leading to credit rationing. Such actions may become vital based on their potential consequences for the economy, entrepreneurs and consumers, which makes this topic extremely important. This study, by using an empirical VAR analysis, has strived to determine whether credit rationing by banks operating in the Polish banking sector is driven by risky loans (which are the main determinant of credit rationing and are represented by the ratio of NPLs to total loans). According to the results, it has been found that credit rationing, made by Polish banks, is not statistically significant when the risk in the credit market rises due to non-performing loans. Therefore, it can be claimed that the risky structure due to NPL in the credit market may not be one of the determinant factors of credit rationing in the Polish banking sector. The low sensitivity of the Polish banking sector to the risky structure of the credit market may result from the relatively low share of loans in total assets compared to debt instruments. Furthermore, restrictive lending policies and the predominance of mortgage loans secured directly by real estate limit portfolio risk, which may reduce the need for a risk-sensitive lending strategy. Full article
Show Figures

Figure 1

16 pages, 1350 KB  
Article
Exploring Poverty and SDG Indicators in Italy: An Identity Spline Approach to Partial Least Squares Regression
by Rosaria Lombardo, Jean-François Durand, Ida Camminatiello and Corrado Cuccurullo
Econometrics 2025, 13(4), 50; https://doi.org/10.3390/econometrics13040050 - 8 Dec 2025
Viewed by 484
Abstract
Poverty is a complex global issue, closely linked to economic and social inequalities. It encompasses not only a lack of financial resources but also disparities in access to education, healthcare, employment, and social participation. In alignment with the United Nations’ Sustainable Development Goals—specifically [...] Read more.
Poverty is a complex global issue, closely linked to economic and social inequalities. It encompasses not only a lack of financial resources but also disparities in access to education, healthcare, employment, and social participation. In alignment with the United Nations’ Sustainable Development Goals—specifically SDGs 3 (Good Health and Well-being), 4 (Quality Education), and 8 (Decent Work and Economic Growth)—this study investigates the relationship between poverty and a set of socioeconomic indicators across Italy’s 20 regions. To explore how poverty levels respond to different predictors, we apply an identity spline transformation to simulate controlled changes in the poverty indicator. The resulting scenarios are analyzed using partial least squares regression, enabling the identification of the most influential variables. The findings offer insights into regional disparities and contribute to evidence-based strategies aimed at reducing poverty and promoting inclusive, sustainable development. Full article
Show Figures

Figure 1

23 pages, 5502 KB  
Article
Choosing Right Bayesian Tools: A Comparative Study of Modern Bayesian Methods in Spatial Econometric Models
by Yuheng Ling and Julie Le Gallo
Econometrics 2025, 13(4), 49; https://doi.org/10.3390/econometrics13040049 - 4 Dec 2025
Viewed by 703
Abstract
We compare three modern Bayesian approaches, Hamiltonian Monte Carlo (HMC), Variational Bayes (VB), and Integrated Nested Laplace Approximation (INLA), for two classic spatial econometric specifications: the spatial lag model and spatial error model. Our Monte Carlo experiments span a range of sample sizes [...] Read more.
We compare three modern Bayesian approaches, Hamiltonian Monte Carlo (HMC), Variational Bayes (VB), and Integrated Nested Laplace Approximation (INLA), for two classic spatial econometric specifications: the spatial lag model and spatial error model. Our Monte Carlo experiments span a range of sample sizes and spatial neighborhood structures to assess accuracy and computational efficiency. Overall, posterior means exhibit minimal bias for most parameters, with precision improving as sample size grows. VB and INLA deliver substantial computational gains over HMC, with VB typically fastest at small and moderate samples and INLA showing excellent scalability at larger samples. However, INLA can be sensitive to dense spatial weight matrices, showing elevated bias and error dispersion for variance and some regression parameters. Two empirical illustrations underscore these findings: a municipal expenditure reaction function for Île-de-France and a hedonic price for housing in Ames, Iowa. Our results yield actionable guidance. HMC remains a gold standard for accuracy when computation permits; VB is a strong, scalable default; and INLA is attractive for large samples provided the weight matrix is not overly dense. These insights help practitioners select Bayesian tools aligned with data size, spatial neighborhood structure, and time constraints. Full article
Show Figures

Figure 1

28 pages, 1269 KB  
Article
Construction and Applications of a Composite Model Based on Skew-Normal and Skew-t Distributions
by Jingjie Yuan and Zuoquan Zhang
Econometrics 2025, 13(4), 48; https://doi.org/10.3390/econometrics13040048 - 2 Dec 2025
Viewed by 484
Abstract
Financial return distributions often exhibit central asymmetry and heavy-tailed extremes, challenging standard parametric models. We propose a novel composite distribution integrating a skew-normal center with skew-t tails, partitioning the support into three regions with smooth junctions. The skew-normal component captures moderate central [...] Read more.
Financial return distributions often exhibit central asymmetry and heavy-tailed extremes, challenging standard parametric models. We propose a novel composite distribution integrating a skew-normal center with skew-t tails, partitioning the support into three regions with smooth junctions. The skew-normal component captures moderate central asymmetry, while the skew-t tails model extreme events with power-law decay, with tail weights determined by continuity constraints and thresholds selected via Hill plots. Monte Carlo simulations show that the composite model achieves superior global fit, lower-tail KS statistics, and stable parameter estimation compared with skew-normal and skew-t benchmarks. We further conduct simulation-based and empirical backtesting of risk measures, including Value-at-Risk (VaR) and Expected Shortfall (ES), using generated datasets and 2083 TSLA daily log returns (2017–2025), demonstrating accurate tail risk capture and reliable risk forecasts. Empirical fitting also yields improved log-likelihood and diagnostic measures (P–P, Q–Q, and negative log P–P plots). Overall, the proposed composite distribution provides a flexible theoretically grounded framework for modeling asymmetric and heavy-tailed financial returns, with practical advantages in risk assessment, extreme event analysis, and financial risk management. Full article
Show Figures

Figure 1

21 pages, 373 KB  
Article
Robust Learning of Tail Dependence
by Omid M. Ardakani
Econometrics 2025, 13(4), 47; https://doi.org/10.3390/econometrics13040047 - 20 Nov 2025
Viewed by 524
Abstract
Accurate estimation of tail dependence is difficult due to model misspecification and data contamination. This paper introduces a class of minimum f-divergence estimators for the tail dependence coefficient that unifies robust estimation with extreme value theory. I establish strong consistency and derive [...] Read more.
Accurate estimation of tail dependence is difficult due to model misspecification and data contamination. This paper introduces a class of minimum f-divergence estimators for the tail dependence coefficient that unifies robust estimation with extreme value theory. I establish strong consistency and derive the semiparametric efficiency bound for estimating extremal dependence, the extremal Cramér–Rao bound. I show that the estimator achieves this bound if and only if the second derivative of its generating function at unity equals one, formally characterizing the trade-off between robustness and asymptotic efficiency. An empirical application to systemic risk in the US banking sector shows that the robust Hellinger estimator provides stability during crises, while the efficient maximum likelihood estimator offers precision during normal periods. Full article
Show Figures

Figure 1

18 pages, 2295 KB  
Article
A Model of the Impact of Government Revenue and Quality of Governance on the Pupil/Teacher Ratio for Every Country in the World
by Stephen G. Hall and Bernadette O’Hare
Econometrics 2025, 13(4), 46; https://doi.org/10.3390/econometrics13040046 - 19 Nov 2025
Viewed by 895
Abstract
This study explores the relationship between government revenue per capita, governance quality, and the supply of teachers—an indicator under Sustainable Development Goal 4 (Target 4.c). Using annual data from 217 countries spanning 1980 to 2022, we apply a non-linear panel model with a [...] Read more.
This study explores the relationship between government revenue per capita, governance quality, and the supply of teachers—an indicator under Sustainable Development Goal 4 (Target 4.c). Using annual data from 217 countries spanning 1980 to 2022, we apply a non-linear panel model with a logistic function that incorporates country-specific governance measures. Our findings reveal that increased government revenue is positively associated with teacher supply, and that improvements in governance amplify this effect. The model provides predictive insights into how changes in revenue may influence progress toward education-related SDG targets at the country level. Full article
Show Figures

Figure 1

33 pages, 7513 KB  
Article
Dynamic Volatility Spillovers Among G20 Economies During the Global Crisis Periods—A TVP VAR Analysis
by Himanshu Goel, Parminder Bajaj, Monika Agarwal, Abdallah AlKhawaja and Suzan Dsouza
Econometrics 2025, 13(4), 45; https://doi.org/10.3390/econometrics13040045 - 14 Nov 2025
Viewed by 1468
Abstract
Previous research on financial contagion has mostly looked at volatility spillovers using static or fixed parameter models. These models don’t always take into account how inter-market links change and depend on frequency during big crises. This study fills in that gap by looking [...] Read more.
Previous research on financial contagion has mostly looked at volatility spillovers using static or fixed parameter models. These models don’t always take into account how inter-market links change and depend on frequency during big crises. This study fills in that gap by looking at how changes in volatility in the G20 equity markets affected four big global events: the global financial crisis of 2008, the European debt crisis, the COVID-19 pandemic, and the Russia-Ukraine war. The study uses a Time-Varying Parameter Vector Autoregression (TVP VAR) framework along with the Baruník-Křehlík frequency domain spillover measure to look at how connectedness changes over short-term (1–5 days) and long-term (5–Inf days) time periods. The results show that systemic connectedness changes a lot during crises. For example, the Total Connectedness Index (TCI) was 24–25 percent during the GFC and EDC, 34 percent during COVID-19, and a huge jump to 60 percent during the Russia-Ukraine war. During the global financial crisis and the war between Russia and Ukraine, the US constantly emerged as the largest transmitter. During the European debt crisis, on the other hand, emerging markets like Turkey, South Africa, and Japan acted as net transmitters. During all crisis times, short-term spillovers are the most common. This shows how important high-frequency volatility transmission is. This study is different from others because it uses both time-varying and frequency domain views. This gives us a better idea of how crises change the way global finances are linked. The results are very important for policymakers and investors because they show how important it is to coordinate risk management, improve market safety, and make systemic stress testing better in a global financial world. Full article
Show Figures

Figure 1

31 pages, 1304 KB  
Article
Dual Effects of Education Expenditure on Life Expectancy: An Empirical Assessment of Crowding-Out and Complementarity
by Jayadevan CM, Nam Trung Hoang and Subba Reddy Yarram
Econometrics 2025, 13(4), 44; https://doi.org/10.3390/econometrics13040044 - 14 Nov 2025
Viewed by 1545
Abstract
This study investigates whether public education expenditure crowds out or complements health investment in influencing life expectancy across 158 countries from 1990 to 2023. Graphical analysis shows that in high-income countries, health expenditure consistently exceeds education spending, reflecting mature complementarity between the two [...] Read more.
This study investigates whether public education expenditure crowds out or complements health investment in influencing life expectancy across 158 countries from 1990 to 2023. Graphical analysis shows that in high-income countries, health expenditure consistently exceeds education spending, reflecting mature complementarity between the two sectors. In contrast, in low- and middle-income countries, education spending often surpasses health expenditure, suggesting potential short-term crowding-out risks where fiscal resources are limited. Using Fully Modified Ordinary Least Squares (FMOLS), Two-Stage Least Squares (2SLS), and bootstrap estimation, the results reveal a predominantly crowding-in relationship that varies by income level. Bootstrap estimates from the life expectancy Model indicate that the coefficient of education expenditure (eexp) is −0.003 for high-income countries (HICs), 0.005 for upper-middle-income countries (UMCs), 0.045 *** for lower-middle-income countries (LMCs), and −0.010 for low-income countries (LICs). Bootstrap estimates show that the effect of education expenditure on life expectancy is insignificant in high- and upper-middle-income countries, strongly positive in lower-middle-income countries, and negative but insignificant in low-income countries. The coefficient of government health expenditure (dgghe) is 0.007 ***, 0.007 ***, 0.017 ***, and 0.035 *** for HICs, UMCs, LMCs, and LICs, respectively. Government health expenditure exerts a consistently positive and highly significant effect across all groups, strongest in low- and lower-middle-income countries. Sobel’s z-statistics (9.62, 8.70, 7.68, and 3.07) confirm a significant indirect effect of education on life expectancy through health expenditure. Health expenditure and GDP per capita enhance life expectancy, while inequality and inflation reduce it. Overall, education and health investments are mutually reinforcing but depend on fiscal capacity and governance quality, necessitating coordinated fiscal frameworks for sustainable human development. Full article
Show Figures

Figure 1

10 pages, 302 KB  
Communication
Fractional Probit with Cross-Sectional Volatility: Bridging Heteroskedastic Probit and Fractional Response Models
by Songsak Sriboonchitta, Aree Wiboonpongse, Jittaporn Sriboonjit and Woraphon Yamaka
Econometrics 2025, 13(4), 43; https://doi.org/10.3390/econometrics13040043 - 3 Nov 2025
Viewed by 740
Abstract
This paper introduces a new econometric framework for modeling fractional outcomes bounded between zero and one. We propose the Fractional Probit with Cross-Sectional Volatility (FPCV), which specifies the conditional mean through a probit link and allows the conditional variance to depend on observable [...] Read more.
This paper introduces a new econometric framework for modeling fractional outcomes bounded between zero and one. We propose the Fractional Probit with Cross-Sectional Volatility (FPCV), which specifies the conditional mean through a probit link and allows the conditional variance to depend on observable heterogeneity. The model extends heteroskedastic probit methods to fractional responses and unifies them with existing approaches for proportions. Monte Carlo simulations demonstrate that the FPCV estimator achieves lower bias, more reliable inference, and superior predictive accuracy compared with standard alternatives. The framework is particularly suited to empirical settings where fractional outcomes display systematic variability across units, such as participation rates, market shares, health indices, financial ratios, and vote shares. By modeling both mean and variance, FPCV provides interpretable measures of volatility and offers a robust tool for empirical analysis and policy evaluation. Full article
Show Figures

Figure 1

20 pages, 431 KB  
Article
Counterfactual Duration Analysis
by Miguel A. Delgado and Andrés García-Suaza
Econometrics 2025, 13(4), 42; https://doi.org/10.3390/econometrics13040042 - 30 Oct 2025
Viewed by 851
Abstract
This article introduces new counterfactual standardization techniques for comparing duration distributions subject to random censoring through counterfactual decompositions. The counterfactual distribution of one population relative to another is computed after estimating the conditional distribution, using either a semiparametric or a nonparametric specification. We [...] Read more.
This article introduces new counterfactual standardization techniques for comparing duration distributions subject to random censoring through counterfactual decompositions. The counterfactual distribution of one population relative to another is computed after estimating the conditional distribution, using either a semiparametric or a nonparametric specification. We consider both the semiparametric proportional hazard model and a fully nonparametric partition-based estimator. The finite-sample performance of the proposed methods is evaluated through Monte Carlo experiments. We also illustrate the methodology with an application to unemployment duration in Spain during the period between 2004 and 2007, focusing on gender differences. The results indicate that observable characteristics account for only a small portion of the observed gap. Full article
Show Figures

Figure 1

27 pages, 448 KB  
Article
Consistency of the OLS Bootstrap for Independently but Not-Identically Distributed Data: A Permutation Perspective
by Alwyn Young
Econometrics 2025, 13(4), 41; https://doi.org/10.3390/econometrics13040041 - 23 Oct 2025
Viewed by 717
Abstract
This paper introduces a new approach to proving bootstrap consistency based upon the distribution of permutation statistics, using it to derive results covering fundamentally not-identically distributed groups of data, in which average moments do not converge to anything, with moment conditions that are [...] Read more.
This paper introduces a new approach to proving bootstrap consistency based upon the distribution of permutation statistics, using it to derive results covering fundamentally not-identically distributed groups of data, in which average moments do not converge to anything, with moment conditions that are less demanding than earlier results for either identically distributed or not-identically distributed data. Full article
17 pages, 339 KB  
Review
VAR Models with an Index Structure: A Survey with New Results
by Gianluca Cubadda
Econometrics 2025, 13(4), 40; https://doi.org/10.3390/econometrics13040040 - 22 Oct 2025
Viewed by 1100
Abstract
The main aim of this paper is to review recent advances in the multivariate autoregressive index model [MAI] and their applications to economic and financial time series. MAI has recently gained momentum because it can be seen as a link between two popular [...] Read more.
The main aim of this paper is to review recent advances in the multivariate autoregressive index model [MAI] and their applications to economic and financial time series. MAI has recently gained momentum because it can be seen as a link between two popular but distinct multivariate time series approaches: vector autoregressive modeling [VAR] and the dynamic factor model [DFM]. Indeed, on the one hand, MAI is a VAR model with a peculiar reduced-rank structure that can lead to a significant dimension reduction; on the other hand, it allows for the identification of common components and common shocks in a similar way as the DFM. Our focus is on recent developments of the MAI, which include extending the original model with individual autoregressive structures, stochastic volatility, time-varying parameters, high-dimensionality, and co-integration. In addition, some gaps in the literature are filled by providing new results on the representation theory underlying previous contributions, and a novel model is provided. Full article
(This article belongs to the Special Issue Advancements in Macroeconometric Modeling and Time Series Analysis)
22 pages, 400 KB  
Article
Demonstrating That the Autoregressive Distributed Lag Bounds Test Can Detect a Long-Run Levels Relationship When the Dependent Variable Is I(0)
by Chris Stewart
Econometrics 2025, 13(4), 39; https://doi.org/10.3390/econometrics13040039 - 22 Oct 2025
Viewed by 1903
Abstract
The autoregressive distributed lag bounds t-test and F-test for a long-run relationship that allows level variables to be either I(1) or I(0) is widely used in the literature. However, a long-run levels relationship cannot be detected [...] Read more.
The autoregressive distributed lag bounds t-test and F-test for a long-run relationship that allows level variables to be either I(1) or I(0) is widely used in the literature. However, a long-run levels relationship cannot be detected when the dependent variable is I0, because both tests will always reject their null hypotheses. It has subsequently been argued that a third test determines whether the dependent variable is I(1), such that when all three tests reject their null hypotheses, a cointegrating equation with an I(1) dependent variable is identified. It is argued that all three tests rejecting their null hypotheses rules out the possibility that the dependent variable is I(0), implying that the three tests cannot detect an equilibrium when the dependent variable is I(0). Our first contribution is to demonstrate and explain that rejection of all three tests’ null hypotheses can also indicate an equilibrium when the dependent variable is I(0) and not only when it is I(1). Our second contribution is to produce previously unavailable critical values for the third test in the cases where an intercept or trend is restricted into the equilibrium. Full article
Show Figures

Graphical abstract

56 pages, 1777 KB  
Review
Vis Inertiae and Statistical Inference: A Review of Difference-in-Differences Methods Employed in Economics and Other Subjects
by Bruno Paolo Bosco and Paolo Maranzano
Econometrics 2025, 13(4), 38; https://doi.org/10.3390/econometrics13040038 - 30 Sep 2025
Cited by 1 | Viewed by 2754
Abstract
Difference in Differences (DiD) is a useful statistical technique employed by researchers to estimate the effects of exogenous events on the outcome of some response variables in random samples of treated units (i.e., units exposed to the event) ideally drawn from an infinite [...] Read more.
Difference in Differences (DiD) is a useful statistical technique employed by researchers to estimate the effects of exogenous events on the outcome of some response variables in random samples of treated units (i.e., units exposed to the event) ideally drawn from an infinite population. The term “effect” should be understood as the discrepancy between the post-event realisation of the response and the hypothetical realisation of that same outcome for the same treated units in the absence of the event. This theoretical discrepancy is clearly unobservable. To circumvent the implicit missing variable problem, DiD methods utilise the realisations of the response variable observed in comparable random samples of untreated units. The latter are samples of units drawn from the same population, but they are not exposed to the event under investigation. They function as the control or comparison group and serve as proxies for the non-existent untreated realisations of the responses in treated units during post-treatment periods. In summary, the DiD model posits that, in the absence of intervention and under specific conditions, treated units would exhibit behaviours that are indistinguishable from those of control or untreated units during the post-treatment periods. For the purpose of estimation, the method employs a combination of before–after and treatment–control group comparisons. The event that affects the response variables is referred to as “treatment.” However, it could also be referred to as “causal factor” to emphasise that, in the DiD approach, the objective is not to estimate a mere statistical association among variables. This review introduces the DiD techniques for researchers in economics, public policy, health research, management, environmental analysis, and other fields. It commences with the rudimentary methods employed to estimate the so-called Average Treatment Effect upon Treated (ATET) in a two-period and two-group case and subsequently addresses numerous issues that arise in a multi-unit and multi-period context. A particular focus is placed on the statistical assumptions necessary for a precise delineation of the identification process of the cause–effect relationship in the multi-period case. These assumptions include the parallel trend hypothesis, the no-anticipation assumption, and the SUTVA assumption. In the multi-period case, both the homogeneous and heterogeneous scenarios are taken into consideration. The homogeneous scenario refers to the situation in which the treated units are initially treated in the same periods. In contrast, the heterogeneous scenario involves the treatment of treated units in different periods. A portion of the presentation will be allocated to the developments associated with the DiD techniques that can be employed in the context of data clustering or spatio-temporal dependence. The present review includes a concise exposition of some policy-oriented papers that incorporate applications of DiD. The areas of focus encompass income taxation, migration, regulation, and environmental management. Full article
Show Figures

Figure 1

Previous Issue
Next Issue
Back to TopTop