Abstract
Quality control is one of the industrial tasks most susceptible to be improved by implementing technological innovations. As an innovative technology, machine vision enables reliable and fast 24/7 inspections and helps producers to improve the efficiency of manufacturing operations. The accessible data by vision equipment will be used to identify and report defective products, understand the causes of deficiencies and allow rapid and efficient intervention in smart factories. From this perspective, the proposed machine vision model in this paper combines the identification of defective products and the continuous improvement of manufacturing processes by predicting the most suitable parameters of production processes to obtain a defect-free item. The suggested model exploits all generated data by various integrated technologies in the manufacturing chain, thus meeting the requirements of quality management in the context of Industry 4.0, based on predictive analysis to identify patterns in data and suggest corrective actions to ensure product quality. In addition, a comparative study between several machine learning algorithms, both for product classification and process improvement models, is performed in order to evaluate the designed system. The results of this study show that the proposed model largely meets the requirements for the proper implementation of these techniques.
1. Introduction
Industry 4.0 brought about automation of manufacturing processes by introducing customized and flexible mass production technologies [1]. Therefore, the traditional methods of production are being replaced by new methods and smarter production is taking place as the machines are perceived to have qualities such as self-awareness, self-prediction, self-comparison, self-configuration, self-maintenance, self-organization and resilience [2]. This means that machines will operate independently and will be able to take decisions and improve automatically by a continuous learning process [3].
Nowadays, the fall in the cost of sensors and connectivity has led to a constant increase in the number of industrial objects connected to the internet [4]. Therefore, objects connectivity has become the key component of Industry 4.0, as this connectivity enables the collection of massive amounts of data that are never exploited because they are simply not understood or analyzed. Nevertheless, the optimal exploitation and real-time analysis of these data can increase productivity, improve machine health, enhance production line automation and lead to defect-free manufacturing [5].
In the manufacturing industry, quality control is the process that ensures customers receive products free from defects and which meet their needs. However, when it is performed in the wrong way, it can put consumers at risk and affect the reputation of companies [6]. The issue in the manufacturing industry is that a minor variance in production processes (invisible to the human eye) can distort the whole production. Inspecting the product before it leaves the manufacturer’s premises is an effective way to prevent quality problems and supply chain disruptions. However, there are several drawbacks related to manual inspection. The speed of inspection is slow and limits the throughput of the production line. Scalability is low and it takes a long time to train a qualified inspector. Moreover, it is not uncommon for human performance to be unstable after a long working time. Today, machine vision, which is a relevant subfield of artificial intelligence [7], allows the control of 100% of the production in processes with high cadences and especially with the integration of machine learning algorithms for image identification [8]. Moreover, machine learning can go beyond fault detection and precisely know the causes of failures by examining the data generated by the production chain in real time [9].
The contribution of this paper falls within this framework and proposes an optimal architecture of a machine vision system based on new research results. The model combines the identification of defective products and the continuous improvement of manufacturing processes, by predicting the most suitable process variables to obtain a defect-free item. The model aims to satisfy Industry 4.0 requirements based on the proper exploitation and analysis of generated data by connected objects in the production chain in order to implement faster, more flexible and more efficient processes to deliver higher-quality products at lower costs [10].
This paper is organized as follows. Section 2 outlines the current state of the art and related works. Section 3 overviews the various technologies that are involved in the suggested model. Section 4 provides a detailed description of the proposed model scenario. Section 5 describes the IoT architecture of the proposed model. The experiments performed and the analysis of results are outlined in Section 6 and Section 7.
2. Related Work
In the past few years, various research activities have been carried out in order to propose intelligent machine vision systems for defective product inspection, based on the exploitation of generated data by different integrated technologies into modern manufacturing lines, using a variety of machine learning techniques. What follows are some outstanding accomplishments in this field.
Wang et al. [11] proposed a machine vision model for product defect inspection based on deep learning and the Hough transform. The designed method detects defective products through three main steps: image pre-processing, region of interest (ROI) extraction and image identification. As a first step, a Gaussian filter was performed on the acquired image to limit random noise and obtain a better representation of the raw image. Continuous running of the imaging device inevitably leads to an excessive increase in its temperature. As a result, the captured images will be corrupted by Gaussian noise. Therefore, a Gaussian filter was used as a pre-processing stage in order to enhance image structures and reduce noise. Secondly, the probabilistic Hough transform was employed to extract the ROI from filtered images. Captured images do not guarantee that all contained information is task-related. For example, the background content may occupy a considerable part of the image, resulting in unnecessary calculations in the next identification stage. Therefore, the Hough transform technique was used to isolate features and extract the ROI from filtered images. Finally, the authors used a convolutional neural network to construct the identification module. They constructed the image identification module based on the inverted residual block, which is a good alternative to reduce the model size and computation time. Image identification was performed using the proposed method with a large number of datasets, which consisted of defective and defect-free bottle images. The analysis of the obtained results revealed that the preparation of data is a crucial and decisive step for the success of any model. The application of the probabilistic Hough transform-based ROI extraction method with the assistance of a rectangular light source enabled obtaining the correct bottle region in the original image. Consequently, the required time for image identification was significantly reduced. The considered inspection method spends 47.60 ms on each image identification on average and achieves an accuracy of 99.60%. Evaluation of the results confirmed that the suggested model in this paper is capable of satisfying the needs of most production lines considering that the system has the potential to achieve more accurate results as more defective samples are discovered during production and used for network training.
Ireri et al. [12] proposed a tomato grading machine vision system based on RGB images. Initially, segmentation algorithms were applied to remove the background from the captured images. In this study, a simple image subtraction technique was used to remove the background for the reason that the image acquisition system was stationary. Therefore, the background pixels had lower values than the foreground pixels. Hence, the background was entirely removed by a histogram thresholding technique. Next, calyx and stalk scars were detected and defects were segmented. The schemed system detects calyx and stalk scars for both defected and healthy tomatoes by histogram thresholding based on the mean g-r value of these regions of interest. Third, the color, texture and shape characteristics of all the images were extracted. In this study, the LAB color space was used because of its limited variance capability due to the sensitivity of the sensors [13], textural features were computed from gray-level co-occurrence matrices (GLCM) [14] and the tomato shape asymmetrical value was computed as a measure of shape regularity [15]. Finally, classifiers based on support vector machine (SVM), artificial neural network (ANN) and random forest algorithms were applied for the classification of different tomato categories. The obtained results indicate that the RBF-SVM algorithm outperformed all the other models with the highest accuracy of 97.09% for the healthy and defected categories. However, the accuracy of classification decreased as the number of grading categories increased. The proposed system in this paper can be used as an in-line tomato-grading tool to ensure adherence to quality standards.
Jiang et al. [16] introduced the fundamentals of common computer vision techniques for textile quality control. Initially, the authors listed the difficulties encountered in implementing a computer vision techniques-based method for fabric defect detection in real time. For example, the existence of many kinds of fabrics and the characterization of defects in fabrics that is generally not clearly defined require the employment of many types of algorithms. Further, the algorithms must be efficient and implemented in real time. Next, the authors defined the basic system architecture of an automated fabric inspection system consisting of a set of cameras, frame grabbers, a computer and a lighting system. Two types of camera are used to detect fabric defects: line-scan and area-scan. Line-scan cameras can capture clearer textured images than area-scan cameras, but the cost of a line-scan camera is very high; therefore, a series of area-scan cameras is commonly used for economical detection of fabric defects. The frame grabber is an electronic device that captures individual digital images from a digital video sequence. The host computer performs two functions: defect detection and classification. Defect detection is performed by the corresponding defect detection algorithms and classification is carried out automatically using a defect size-based rule to score the defects. In addition, lighting is also very important for image collection as it determines the quality of the captured images. The authors then divided computer vision-based techniques for fabric defect detection into three types of algorithm: statistical approaches, spectral approaches and model-based approaches. Statistical and spectral approaches use low-level algorithms that operate directly on the data, while model-based approaches focus on the structure of the data. They suggested two models: the autoregressive model, which is a representation, using the linear dependency between the different pixels of a texture to describe the characteristics of the texture, and the Markov random field model, which is successfully applied in texture segmentation and classification. Several problems must be considered for the implementation of fabric defect detection technologies: most of the algorithms applied perform poorly when applied to real-world tissue images and are computationally too expensive for real-time implementation. Further, the cost of implementing an automated visual inspection system is very expensive. Therefore, future research must focus on a cheaper and faster fabric inspection system for real industrial application.
Sahoo et al. [17] suggested a dynamic bottle inspection structure. First, the image of the bottle to be inspected was captured by a high-resolution smart camera. Then, image processing techniques were employed to reduce noise and improve the quality of the captured images. The region of interest (defective parts of the bottle) was selected from the original image by cropping and then converted to a grayscale image. The image of the bottle was segmented from the image background by applying segmentation methods. Next, a dataset was constructed from the estimated adaptive characteristics using mathematical concepts such as the average grayscale two-dimensional feature vector, wavelet transform and principal component analysis (PCA). An artificial neural network (ANN) trained by the back propagation (BP) algorithm, differential evaluation algorithm (DEA) and a support vector machine (SVM) was used to classify the images by considering the extracted characteristics as input variables and the defective bottle types as output variables. During the inspection, there is a risk of insufficient illumination and a change in the position of an object due to various factors, meaning that a sensory arrangement needs to be implemented. The authors of this paper carried out a comparison between the different classification algorithms using three methods of feature extraction (AVG grayscale 2D feature vector, PCA-based features and wavelet-based features) with and without a sensor implementation in the machine vision inspection system. The obtained results revealed that the computational time of the ANN using the DEA is comparatively less than the ANN using BP. The average calculation time of the proposed system without and with the use of sensors is 33.04 and 29.80, respectively. Comparison of the average computational time indicated that the computation time is more important for the classification of bottles without a sensor than for classification with a sensor. The suggested system is capable of classifying bottle imperfections with a classification success ratio of 91.25–97.5%. Eventually, it was concluded that the AI-based machine vision inspection system is most suitable for the inspection of the quality level of imperfections in bottles.
Liqun, W. et al. [18] designed an improved model based on VGG16 [19,20] and introduced the Inception v3 module for vehicle parts defect detection of the six most common categories of front axle left front and middle bolts, transmission shafts, parking locks and shift mechanisms, special steering tools, right headlight positioning bolts and shock absorbers. VGGNet is a deep convolutional neural network model developed by researchers at the Visual Geometry Group and Google DeepMind of the University of Oxford. The VGGNet network model mainly explores the relationship between the depth of the convolutional neural network and its performance by constructing a convolution neural network with a depth of 16 to 19 layers by repeatedly stacking 3 × 3 small convolution kernels and 2 × 2 maximum pooling layers. The Inception v3 method decomposes convolution kernels to integrate a larger two-dimensional convolution into two smaller one-dimensional convolutions. For example, the network of 7 × 7 convolutions is divided into three 3 × 3 convolutions, which produces more parameters than dividing the network of 7 × 7 convolutions into 1 × 7 and 7 × 1 convolutions to reduce the computational time. The experimental samples are divided into a training set and test set and each of the seven categories of vehicle defect detection is divided into positive and negative samples. The experiment in this paper was divided into three parts which use the traditional HOG + SVM method, the unimproved VGG16 network model and the improved VGG16 network model to detect defects of vehicle parts. The obtained results are as follows: firstly, the accuracy rate of the VGG16 network structure model is 94.36%; secondly, the accuracy rate of the VGG16 network structure model improved by introducing the Inception v3 module is 95.29%; and, finally, the accuracy of the traditional HOG + SVM classification method is only 93.88. The VGG16 network structure model that is improved by introducing the Inception v3 module gives better results than other methods.
3. Theoretical Background
Industry 4.0 incorporates various technologies such as the Internet of Things (IoT) [21], cloud computing [22], automation (e.g., intelligent robots in product assembly lines) [23], big data and analytics [24] and artificial intelligence (AI) [25], amongst others. Most of these so-called Industry 4.0 technologies have been around much longer than the Fourth Industrial Revolution, so they are the technical prerequisites of Industry 4.0. However, the innovative character of Industry 4.0 lies in the fact that the components are able to communicate with each other and act autonomously, independently of the intervention of human operators. Therefore, the implementation of a computer vision-based automated system in the manufacturing chain for detecting defective products requires a judicious combination of the following different technologies:
The Internet of Things (IoT) is considered as the backbone of our model. Learning algorithms applied in the model will be fed by the generated data by the different connected components of the production chain. Without big data that is collected from sensors and other used devices to connect industrial objects, the system cannot learn how to identify defective products and predict the correct production processes. The IoT is a network of interconnected objects (the “things”), with varying levels of intelligent functionality: sensing and actuating, control, optimization and autonomy, which are integrated with specific device technologies that help communicate data and interact with these objects [26]. For Industry 4.0, IoT enables the connection of a huge variety of digital and physical resources. Thus, the network formed allows decentralized decision making and real-time reaction at the level of cyberphysical systems (CPS) [27]. Furthermore, IoT has become a great resource of data for industries especially with the massive deployment of sensors and IoT devices in manufacturing systems.
The IoT has several applications in various fields, and the use of this new technology in computer vision would benefit the system because of its diverse possibilities. For instance, a computer vision system includes smart IoT cameras looking at the production line that capture images, which are then algorithmically compared to a predefined image in order to detect defective objects [11]. In addition, integrated sensors in the production line allow gathering data related to the production processes and interacting with the various system components.
Cloud computing is crucial for the proper functioning of the system. Machine learning applications such as computer vision problems require the processing of a massive amount of computing resources (e.g., images). However, cloud computing can satisfy this need with the computing power and storage capacity available and also allows collaboration between image processing environment practitioners [28]. In addition, machine learning is not a baseline proposition and the requirements of such a system change depending on what is being learned. Therefore, local hardware may not handle the surges of the computational demand intrinsic in such a system. However, these issues are largely negated in the cloud because of the computing power that gives us a lot more flexibility. For our solution, cloud technology helps to pool and centralize information while also offering a platform for open source collaboration. Thus, the cloud facilitates a real-time exchange of data, creating and promoting an environment of digital collaboration and integration [25].
Edge computing is a distributed computing architecture characterized by decentralized processing power. Concretely, edge computing enables data to be processed directly by the device that produces them, or by a local server. The aim is to process data directly at the edge of the network where they are generated, instead of transferring them to the cloud or a data center. Industry 4.0 benefits from edge computing as this technology offers several advantages [4,24]. Edge computing reduces the used bandwidth and information processing latency, due to the fact that data flows are processed locally in real time. In addition, the ability to process data without transferring it to a public cloud adds a useful layer of security for sensitive data. Therefore, edge computing is crucial for the integration of product inspection systems into manufacturing lines, as these machine vision systems must process the captured images by vision equipment in real time in order to provide fast responses, without disrupting manufacturing processes.
The implementation of industrial automation and machine automation technologies is decisive to Industry 4.0’s success. Machines have long been used in production to accomplish complex programmed tasks. In the Industry 4.0 paradigm, machines are equipped with new connectivity technologies and become more intelligent, flexible, cooperative and autonomous in decision making. They interact with each other and even operate safely with humans (e.g., cobotics). This automation of work processes will have a direct impact on the productivity of companies and especially in terms of time and cost savings [29]. The proposed model in this paper can only be implemented if the manufacturing line is automated. Thus, it will benefit from the advantages of automation, especially with the convergence of new technologies that have enabled the implementation of new intelligent automated systems.
Big data and analytics is the technology that enables the processing of huge volumes of data from a variety of sources and formats in order to make sense of them and make better decisions. Big data production in the Industrial Internet of Things (IIoT) is evident due to the massive deployment of different technologies such as sensors, enterprise resource planning (ERP) systems, manufacturing execution systems (MES), supervisory control and data acquisition (SCADA) systems, customer relationship management (CRM) systems and machine/IoT devices. Therefore, analytics tools can exploit available big industrial data and help obtain value from it, thereby leading to making fast and better decisions [24]. The use of big data tools enables the machine learning algorithms employed in our image recognition system to analyze an exhaustive number of product images and thus learn to differentiate between defect and defect-free products [30].
Artificial intelligence (AI) technology will allow the system to operate intelligently and to replace human operators in the task of inspecting finished products. AI is “the science of making machines do things that would require intelligence if done by men” [31]. In the context of Industry 4.0, AI can be applied to decision making and promises to change the way manufacturing works today by equipping machines with more intelligence capabilities. Therefore, machines will know when they make mistakes and will correct themselves, which will make production faster and cheaper [25]. AI has been used to develop many sectors, including finance, health, education and transport. AI technologies in terms of machine vision make it possible to identify an image, classify it and consequently launch an associated action [8].
One of the most common applications of AI for manufacturing is machine learning, and most machine vision systems rely on this technique to classify images and formulate predictions. The advantages of machine learning are numerous and can significantly improve system performance. The introduction of machine learning in machine vision systems for the control of defective products represents a great change for quality control in manufacturing companies, which can open up new opportunities and result in better quality control with actionable insights to constantly raise product quality [32]. Machine learning is the ability of the machines to learn by themselves [9]. The idea is to make the machine or computer capable of providing solutions to complicated problems by processing an unlimited amount of information. Big data production and the available computing power in the Industrial Internet of Things are the major factors that have led to great advances in machine learning implemented in different fields of industry [32].
4. Proposed Model
Intelligent machine vision systems enable early error detection in the manufacturing line and help ensure the high quality of the product before it is delivered to the customer. However, designing an optimal machine vision architecture for defective product inspection should consider the appropriate collaboration between the different technologies involved in the production chain from the raw material to the final product. In addition, all the generated data during the manufacturing process must be exploited to strengthen the system and go beyond defect detection to identify the causes of failures and improve product quality. From this perspective, the machine vision scenario we propose, as shown in Figure 1, can be described as follows.
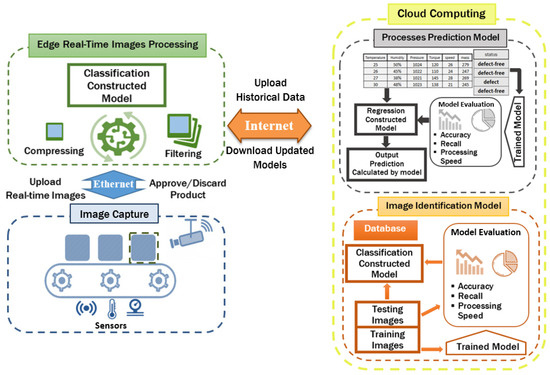
Figure 1.
Intelligent machine vision model for defective product inspection.
Initially, an IoT installed camera at the end of the processing line captures a real high-resolution image of the finished product and sends it to the edge image processing system. There are several parameters to consider when capturing images, for example, the part of the product to be checked must be clearly visible on the image content. Further, lighting is an essential ingredient affecting the quality of the captured images that must be properly adjusted.
Image pre-processing is very necessary to optimize the model and reduce the calculation time. Captured images do not guarantee that all contained information is task-related. For example, the background content may occupy a considerable part of the image, resulting in unnecessary calculations in the next identification stage. Therefore, filtering techniques can improve the quality of captured images and remove unnecessary content [33]. The last step is image compressing, to reduce the redundancy of the data in an image, so that it can be rapidly transmitted to the cloud and stored without taking up a lot of space [34].
The database used by the image identification algorithm contains collected product sample images labeled defect and defect-free, divided randomly into training images and evaluation images. The training phase uses training images to continuously correct parameters with a supervised learning approach in order to minimize prediction errors. Accordingly, model evaluation is important in searching for a good network structure and a suitable training strategy, thereby obtaining a practical identification model and storing it. Finally, the constructed classification model analyzes the processed real-time image and gives feedback (“defect product”, or “defect-free product”).
With the rapid development of deep learning, convolutional neural networks (CNNs) have been, in particular, suggested for automated inspection problems and have shown promising performance. They can automatically extract important features and perform classification in the same network. The results could be close to or even better than human performance [35,36]. CNNs are one typical type of artificial neural network (ANN) that have a similar methodology to traditional supervised learning methods: they receive input images, detect the features of each of them and then train a classifier. However, the features are learned automatically by CNNs, doing all the tedious work of feature extraction and description themselves [37,38]. Achieved results in research during recent years confirm that CNNs remain the best approach to achieve high performance in solving image classification problems [39,40].
There are four types of layers for a CNN: First, the convolutional layer is the key component of CNNs and is always their first layer. Its purpose is to identify the presence of a set of features in the input images. To do this, we perform a filtering by convolution. Then, the pooling layer is often placed between two convolutional layers, it receives as input several feature maps and applies the pooling operation to them. The pooling process consists of reducing the size of images while preserving their important characteristics. Therefore, the pooling layer reduces the number of parameters and calculations in the network, and this improves the efficiency of the network and prevents overfitting. Next, rectified linear units (ReLUs) are the most widely used activation function by adding non-linear transformations to the output response of the convolutional or fully connected layers. The formula of this function is given in Equation (1). It replaces all negative values that are received as inputs with zeros. Finally, the fully connected layer classifies the input image on the network: it returns a vector of size N, where N is the number of classes in our image classification problem [37].
A CNN is simply a stack of several layers of convolution, pooling and ReLU correction that are fully connected, as shown in Figure 2. Each received image as input will be filtered, reduced and corrected several times, to finally form a vector. In the classification problem, this vector contains the class affiliation probabilities.
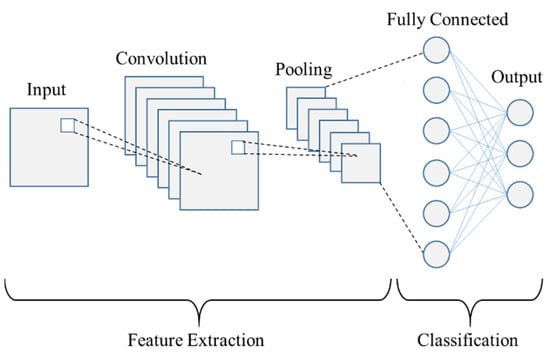
Figure 2.
Common types of layers in convolutional neural networks (CNNs).
Deep learning also provides more flexibility because CNN models and frameworks can be re-trained using a custom dataset for any use case. The principle is to use the knowledge acquired by a neural network when solving a problem to solve a similar one. Thus, transfer learning accelerates network training and prevents overfitting [35].
In the proposed architecture, the training section is managed at the cloud level. The principle benefit of this choice is that the machine learning system is not limited to the local hardware. Traditionally, machine learning required local hardware that could handle the surges of computational demand intrinsic in such a system [40]. The problem with this is that machine learning is not a baseline proposition and the requirements of such a system change depending on what is being learned. However, these issues are largely negated in the cloud because of the computing power that gives us a lot more flexibility and therefore a lot quicker and higher-value computing metrics [28]. In addition, the cloud will strengthen the system with several features such as data sharing, excellent real-time accessibility and back-up and restore data.
After training and updating, the cloud implements the constructed image identification model at the edge, which is responsible for real-time processing of captured product images. This saves the time and energy that are required to transmit data to the remote cloud server by generating inspection results locally, close to the data sources. Communications between the cloud and the edge are performed when the network is not busy. Therefore, running the classification algorithm at the edge instead of in the cloud reduces latency, costs, cloud storage, processing and bandwidth requirements. In addition, edge nodes have the capability to scale up the computational power when necessary, which can provide faster and more accurate results [35,40]. Finally, achievement of the aforementioned scenario requires effective communication between the three component layers of the system. Installation of an edge IoT gateway between the external internet and the local intranet bridges the IoT devices, sensors, equipment, systems and the cloud to facilitate communication between the different layers [41,42].
5. IoT Architecture of the Proposed Model
There are three main sections in the proposed IIoT architecture, as shown in Figure 3. The first section is the production environment, including the manufacturing line with the control system and all connected sensors. The second section is the connection and processing environment, which is an IoT gateway that provides sufficient edge computing resources and maintains an efficient communication and collaboration between the various layers of the system. The last layer is a cloud back-end with massive computational power for computation-intensive tasks (i.e., CNN model training in this case). It is connected remotely via the internet, so it can act as a central server to manage algorithms and to play a crucial role to enable all the functions to be smoothly operated as expected.
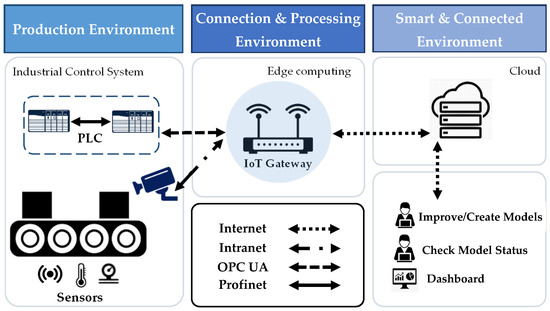
Figure 3.
Internet of Things (IoT) architecture of the proposed model.
The control system receives data from connected sensors that measure the process variables (PVs) and transmits them to the central collection point, which is the IoT gateway. The camera captures the image of the finished product and sends it to the edge for processing. The edge performs the identification of the real captured image via the constructed classification model and communicates the processing results to the control system, which keeps defect-free products and eliminates defective products via a programmable logic controller. PV values and the captured image are sent to the cloud to be stored in databases and used to update models.
The exchanges are multiple between the various components of the system: generated data in the production line are transmitted to the edge and to the cloud via the IoT gateway using a variety of protocols. In addition, the cloud transfers trained and constructed models to the edge to be used for product image processing. Finally, the IoT gateway communicates processing results to the control system to apply the appropriate actions. The role of the IoT gateway is to maintain a permanent and efficient communication between the different layers of the model in order to ensure the integration of the system into manufacturing lines, which requires fast and real-time responses. A real-time and fast connection is necessary to ensure the exchanges between the three layers of the system and not to disturb the execution of the manufacturing processes.
6. Experiments
Considering the large number of different involved techniques in machine learning, a comparative study between several machine learning algorithms for both product classification and process improvement models is elaborated in order to evaluate the proposed system. Results of this study will allow us to know if the suggested model meets the requirements of the proper implementation of these techniques.
The rapid evolution of computer vision and, consequently, image classification has been accelerated by the introduction of transfer learning. Training is very expensive, both in time and in resources. However, transfer learning reduces the cost of training new deep learning models, and since the datasets have been verified, we can be assured of quality. In this paper, we will test three main preformed image classification models that are widely used in the industry and compare them to a simple CNN model. We will analyze the performance of the different models and choose the most suitable one for the image identification model of our proposed system. The three pre-trained models for image classification are presented as follows:
- VGG-16 is one of the most popular pre-trained models for image classification. Developed at the Visual Graphics Group at the University of Oxford, VGG-16 was quickly adopted by researchers and the industry for image classification tasks;
- Inception v3 is a commonly used image recognition model that has demonstrated an accuracy of more than 78.1% on the ImageNet dataset. This model is the result of many ideas developed by several researchers over the years;
- EfficientNetB0 is a convolutional neural network published by Google in 2019, which was designed by an optimization procedure that maximizes the accuracy for a given computational cost using a new scaling method called compound scaling.
In the second experiment, we will evaluate several machine learning regression techniques. Machine learning algorithms are programs that can learn from data and improve from experience. Learning tasks can include learning the function that links input to output, learning the hidden structure in unlabeled data or instance-based learning, where a class label is generated for a new instance by comparing the new instance to instances of the training data, which have been stored in memory. This experiment aims to compare various regression algorithms used in machine learning. In this study, the most popular algorithms were evaluated, such as K-nearest neighbors (K-NN), decision trees, Lasso regression and linear regression, and a big dataset was used to verify the efficiency of each algorithm. Thus, we can choose the best algorithm to use for the processes prediction model of our proposed system.
The dataset used in the first experiment consists of casting manufacturing products [43]. Casting is a manufacturing process in which a liquid material is usually poured into a mold, which contains a hollow cavity of the desired shape, and then allowed to solidify. The objective of collecting these data is to make the task of inspecting casting defects automatic by implementing a deep learning classification model for this problem. This dataset was collected in a stable lighting environment with an extra arrangement. The camera used was the Canon EOS 1300D DSLR. The dataset contains a total of 7348 image data. These are all the size of (300*300) pixel gray-scaled images. In all images, augmentation was already applied. An illustration of the objects to be inspected is presented in Figure 4. The dataset is divided into two parts: training set and testing set, for training and evaluation, respectively.
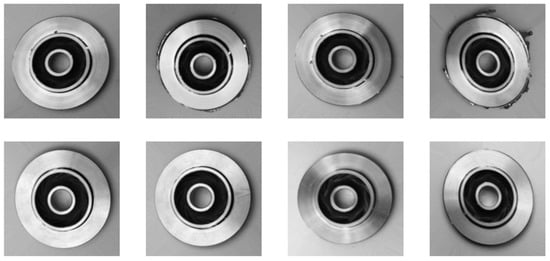
Figure 4.
Defective and defect-free product samples [43].
The dataset used in the second experiment [44] comes from one of the most important parts of the mining process: a flotation plant. The main objective is to use these data to predict the quantity of impurities in the ore concentrate. Since this impurity is measured hourly, if we can predict the quantity of silica (impurity) in the ore concentrate, we can help engineers by giving them early information to take predictive measures. The first column shows the time interval and the date. The second and third columns are measurements of the quality of the iron ore pulp just before it is introduced into the flotation plant. Columns four to eight are the most important variables that have an impact on the quality of the ore at the end of the process. From column nine to column twenty-two, we can see the process data, which also have an impact on the ore quality. The last two columns represent the final measurement of the quality of the iron ore pulp in the laboratory. The input set will be composed of columns 4 to 22, and the output is the value of the quantity of impurities in the ore concentrate. An illustration of the dataset is presented in Table 1.

Table 1.
A portion of the dataset used in the second experiment [44].
The two datasets used were downloaded from the following website: www.kaggle.com. The first one was produced by Ravirajsinh Dabhi, a student at the VVP Engineering College, Rajkot, Gujarat, India, and the second was produced by Eduardo Magalhães Oliveira, a Data Scientist Leader at IHM Stefanini, State of Minas Gerais, Brazil.
This experiment is coded on the Anaconda platform in the Windows environment, using Python language. The computer hardware environment configuration is as follows: the system is 64-bit Windows 10, the processor is the Intel(R) Core(TM) i7-1065G7 CPU @ 1.50 GHz, the memory is 8.00 GBRAM and the graphics card is the NVIDIA GeForce MX230. The machine learning frameworks are TensorFlow 2.3.0 and scikit-learn 0.23.2.
7. Results and Analysis
7.1. Image Identification Model
Once the training was completed, we calculated the performance of the models using new image datasets (i.e., not included in the training dataset), as shown in Table 2. We used two statistical measures to evaluate the models: precision and recall. Precision indicates the fraction of identified classifications that are correct. We checked the percentage of true predictions out of the total obtained predictions for the models. We used the formula given in Equation (2) to calculate the precision of the models. Recall indicates the fraction of actual classifications that are correctly identified. We measured how much the objects are covered by the models for classification. We used the formula given in Equation (3) to calculate the recall of the models.
where FP (false positive) represents the number of negative samples judged to be positive, TP (true positive) is the number of positive samples judged to be positive and FN (false negative) is the number of positive samples judged to be negative.
Table 2.
Accuracy measurement in different models.
The obtained results show a precision of 88% and a recall of 89% for the CNN model, while the precision and recall increase, respectively, to (95–97%) and (88–96%) for the pre-trained models. The pre-trained models achieve high validation accuracy with only 10 epochs and without major model modifications. This proves the power of transfer learning and the utility of pre-trained models for image classification and also illustrates that transfer learning is flexible, allowing the use of preformed models directly for solving entirely new problems. The difference between a simple CNN and pre-trained models is clear even if we are faced with a simple binary classification problem. The difference may be more obvious if we are confronted with a more complex problem, with a large number of classes and huge data to process. Figure 5 shows the performance graph of the results obtained for the classification by different models.
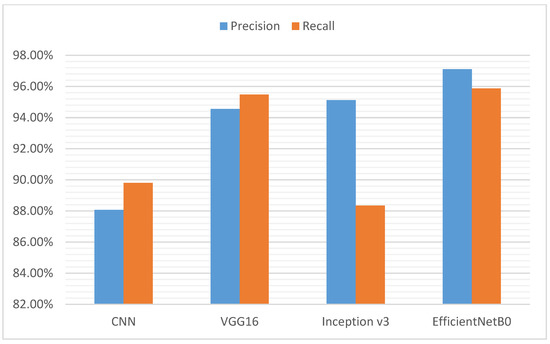
Figure 5.
Data analysis results of trained models.
However, it is important to mention that some pre-trained models take a lot of time to train compared to other models, which can be a disadvantage when dealing with huge datasets. In addition, the cost of implementing the system in high-speed production lines will be expensive, as the system will need large computing resources to function correctly. Figure 6 shows the epoch training time of each model in seconds. The graph indicates that pre-trained models take longer to train, which is normal considering the complex architecture of these models compared to a simple CNN model. It also shows that Inception v3 is much faster than VGG16 and EfficientNetB0. As a result, we can see that Inception v3 is the most suitable for our classification model, since it achieves high accuracy in a relatively acceptable time. In addition, pre-trained models can achieve higher accuracy and recall values if we increase the number of epochs and the amount of training data.
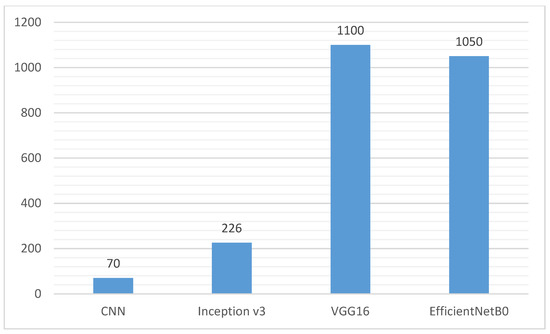
Figure 6.
Epoch training time of each model in seconds.
Related to the proposed model in this article, the obtained results in this experiment confirm the correct choice to manage the training of the image classification model at the cloud level. The cloud has the computational resources required for model training in large amounts of data and within an acceptable time. The results also confirm the introduction of an image filtering and compression step before identifying and transferring images to the cloud, which reduces the required time to train models and identify images. For example, these techniques remove background content that occupies a considerable part of the image, resulting in unnecessary calculations during identification and training.
7.2. Processes Prediction Model
Regression metrics are different from classification metrics because they predict a continuous quantity. To evaluate the four regression models, we used three major metrics. Mean absolute error (MAE) is one of the most common metrics that is used to calculate the prediction error of models. We need to calculate prediction errors for each row of data, get their absolute value and then find the mean of all absolute prediction errors. MAE is calculated by the formula given in Equation (4). Mean squared error (MSE) takes the mean squared difference between the target and predicted values. This value is widely used for many regression problems and larger errors have correspondingly larger squared contributions to the mean error. MSE is calculated by the formula given in Equation (5). The coefficient of determination (R2 score) determines how well the regression predictions approximate the real data points. The value of R2 is calculated with the formula given in Equation (6). R2 can take values from 0 to 1. A value of 1 indicates that the regression predictions perfectly fit the data. Table 3 summarizes the performance of each model.
where represents the predicted value of , and is the mean of observed data, which is calculated as given in Equation (7).
Table 3.
Performance measurement in different models.
The results show that the decision trees and K-NN models significantly outperform the other two models. The (MAE, MSE, R2) values obtained by the linear regression and Lasso regression models are very medium, which shows that these algorithms are not so accurate, but they can still make good predictions. In addition, the results show that these models do not fit the data very well because they cannot explain all the variance, and we have some outliers. The decision trees model remains the best of the four models with perfect scores. Figure 7 shows the performance graph of the different models.
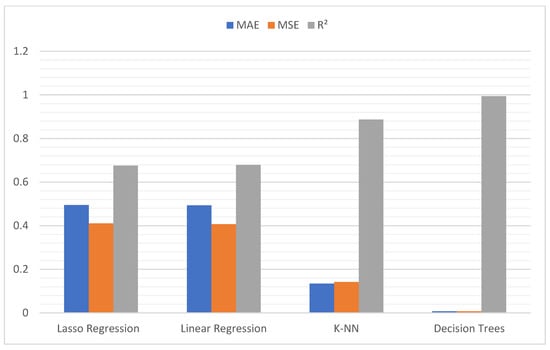
Figure 7.
Data analysis results of trained models.
To further explore the measures and numbers, we plotted our data on the actual versus predicted graph for our test dataset. This is one of the most useful graphs because it can tell us a lot about the performance of our models. The graphs below, shown in Figure 8, use MatPlotLib to perform their visualizations for analyzing residuals versus model fit. On this plot, we can check where the points are located. The decision trees plot shows that most of the points are close to the diagonal and we can conclude that the R2 score for this model will be high. This proves that the model fits the data very well. However, for the other models, we can see that many points are far from the diagonal, and we can conclude that the R2 scores will be low. This shows that the models do not match the data very well.
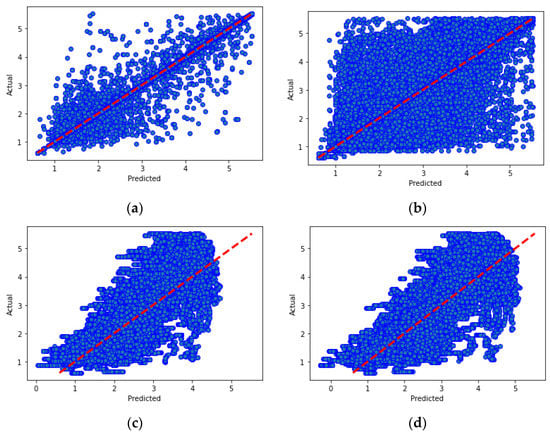
Figure 8.
Actual versus predicted graph for each model: (a) decision trees; (b) K-NN; (c) Lasso regression; (d) linear regression.
The decision trees model takes relatively more time to train. However, since all models have very acceptable training times, we will focus on the quality of prediction in order to choose the most adequate algorithm for our model. Therefore, the decision trees algorithm is the most suitable for our processes prediction model since it achieves a very high R2 score (0.99) and allows us to make predictions with high accuracy.
8. Conclusions
This paper presents a machine vision-based inspection model for product quality control, combining two types of machine learning: a classification model for product inspection and a regression model for processes prediction. The suggested system enables early error detection in the manufacturing processes and helps ensure a high quality of the item before it is moved to the next manufacturing step. In addition, the system helps in gathering historical and production statistics for both defective and defect-free products used to improve manufacturing processes. As a result, it helps in reducing material waste, repair and rework costs, as well as added manufacturing labor time and expenses [11]. Nevertheless, the designed system has some limits related to the implementation of CNNs. These models consume large computational resources, and they need large amounts of training data to optimize their performance.
The obtained results lead us to choose the most appropriate machine learning models for our system in order to optimize its performance. Inception v3 is the most adequate for our image identification model as it achieves an accuracy of 95% within a relatively acceptable time and can improve its performance by increasing the amount of training data and computational resources. The decision trees algorithm is the most suitable for our processes prediction model since it achieves a very high R2 score (0.99) and provides predictions with high accuracy.
The proposed architecture in this paper has several advantages: The implementation of an IoT gateway to maintain a permanent and efficient communication between the different components of the system that communicate with different protocols. Model training is managed at the cloud level, allowing the system to benefit from the available computing power in the cloud. Real-time processing of captured product images at the edge saves the time and energy that are required to transmit data to the cloud server by generating inspection results locally, close to the data sources. Image pre-processing optimizes models and reduces the calculation time. Finally, the proposed architecture can be adapted and used for different use cases, which is very important for the successful integration of the system into real production lines.
Author Contributions
Conceptualization, T.B., M.S., M.A. and S.B.K.; methodology, T.B. and M.A.; software, T.B. and M.S.; validation, T.B. and M.A.; formal analysis, M.A.; investigation, T.B.; resources, T.B.; data curation, T.B.; writing—original draft preparation, T.B. and M.A.; writing—review and editing, T.B. and M.A.; visualization, S.B.K.; supervision, M.A.; project administration, M.A.; funding acquisition, M.A. All authors have read and agreed to the published version of the manuscript.
Funding
This research received no external funding.
Institutional Review Board Statement
Not applicable.
Informed Consent Statement
Not applicable.
Data Availability Statement
Publicly available datasets were analyzed in this study. This data can be found here: [https://www.kaggle.com/ravirajsinh45/real-life-industrial-dataset-of-casting-product] and [https://www.kaggle.com/edumagalhaes/quality-prediction-in-a-mining-process].
Conflicts of Interest
The authors declare no conflict of interest.
References
- Cleverism. Industry 4.0: Definition, Design Principles, Challenges, and the Future of Employment. 2017. Available online: https://www.cleverism.com/industry-4-0/ (accessed on 2 January 2020).
- Lee, J. Smart Factory Systems. Inform. Spektrum 2015, 38, 230–235. [Google Scholar] [CrossRef]
- Zhou, K.; Liu, T.; Liang, L. From cyber-physical systems to Industry 4.0: Make future manufacturing become possible. Int. J. Manuf. Res. 2016, 11, 167. [Google Scholar] [CrossRef]
- Čolaković, A.; Hadžialić, M. Internet of Things (IoT): A review of enabling technologies, challenges, and open research issues. Comput. Netw. 2018, 144, 17–39. [Google Scholar] [CrossRef]
- Cheng, F.-T.; Tieng, H.; Yang, H.-C.; Hung, M.-H.; Lin, Y.-C.; Wei, C.-F.; Shieh, Z.-Y. Industry 4.1 for Wheel Machining Automation. IEEE Robot. Autom. Lett. 2016, 1, 332–339. [Google Scholar] [CrossRef]
- Gunasekaran, A.; Subramanian, N.; Ngai, W.T.E. Quality management in the 21st century enterprises: Research pathway towards Industry 4.0. Int. J. Prod. Econ. 2019, 207, 125–129. [Google Scholar] [CrossRef]
- Intelligent Defect Inspection Powered by Computer Vision and Deep Learning. Available online: https://www.infopulse.com/blog/intelligent-defect-inspection-powered-by-computer-vision-and-deep-learning/ (accessed on 3 February 2020).
- Semeniuta, O.; Dransfeld, S.; Martinsen, K.; Falkman, P. Towards increased intelligence and automatic improvement in industrial vision systems. Procedia CIRP 2018, 67, 256–261. [Google Scholar] [CrossRef]
- Chopra, V.; Priyadarshi, D. Role of Machine Learning in Manufacturing Sector. Int. J. Recent Technol. Eng. 2019, 8, 2320–2328. [Google Scholar] [CrossRef]
- Müller, J.M. Contributions of Industry 4.0 to quality management—A SCOR perspective. IFAC Pap. 2019, 52, 1236–1241. [Google Scholar] [CrossRef]
- Wang, J.; Fu, P.; Gao, R.X. Machine vision intelligence for product defect inspection based on deep learning and Hough transform. J. Manuf. Syst. 2019, 51, 52–60. [Google Scholar] [CrossRef]
- Ireri, D.; Belal, E.; Okinda, C.; Makange, N.; Ji, C. A computer vision system for defect discrimination and grading in tomatoes using machine learning and image processing. Artif. Intell. Agric. 2019, 2, 28–37. [Google Scholar] [CrossRef]
- Shafiee, S.; Minaei, S.; Moghaddam-Charkari, N.; Barzegar, M. Honey characterization using computer vision system and artificial neural networks. Food Chem. 2014, 159, 143–150. [Google Scholar] [CrossRef] [PubMed]
- Moallem, P.; Serajoddin, A.; Pourghassem, H. Computer vision-based apple grading for golden delicious apples based on surface features. Inf. Process. Agric. 2017, 4, 33–40. [Google Scholar] [CrossRef]
- Otsu, N. A Threshold Selection Method from Gray-Level Histograms. IEEE Trans. Syst. Man Cybern. 1979, 9, 62–66. [Google Scholar] [CrossRef]
- Jiang, J.L.; Wong, W.K. Fundamentals of common computer vision techniques for textile quality control. In Applications of Computer Vision in Fashion and Textiles; Wong, W.K., Ed.; Woodhead Publishing: Sawston, UK, 2018; pp. 3–15. [Google Scholar]
- Sahoo, S.K.; Sharma, M.M.; Choudhury, B.B. A Dynamic Bottle Inspection Structure. In Computational Intelligence in Data Mining; Behera, H.S., Nayak, J., Naik, B., Abraham, A., Eds.; Springer: Singapore, 2019; Volume 711, pp. 873–884. [Google Scholar]
- Liqun, W.; Jiansheng, W.; Dingjin, W. Research on Vehicle Parts Defect Detection Based on Deep Learning. J. Phys. Conf. Ser. 2020, 1437, 012004. [Google Scholar] [CrossRef]
- Bayar, B.; Stamm, M.C. A Deep Learning Approach to Universal Image Manipulation Detection Using a New Convolutional Layer. In Proceedings of the 4th ACM Workshop on Information Hiding and Multimedia Security—IH&MMSec ’16, Vigo, Spain, 20–22 June 2016; pp. 5–10. [Google Scholar] [CrossRef]
- Qu, Z.; Shen, J.; Li, R.; Liu, J.; Guan, Q. PartsNet: A Unified Deep Network for Automotive Engine Precision Parts Defect Detection. In Proceedings of the 2018 2nd International Conference on Computer Science and Artificial Intelligence—CSAI ’18, Shenzhen, China, 8–10 December 2018; pp. 594–599. [Google Scholar] [CrossRef]
- Nord, J.H.; Koohang, A.; Paliszkiewicz, J. The Internet of Things: Review and theoretical framework. Expert Syst. Appl. 2019, 133, 97–108. [Google Scholar] [CrossRef]
- Hashem, I.A.T.; Yaqoob, I.; Anuar, N.B.; Mokhtar, S.; Gani, A.; Khan, S.U. The rise of “big data” on cloud computing: Review and open research issues. Inf. Syst. 2015, 47, 98–115. [Google Scholar] [CrossRef]
- Pedersen, M.R.; Nalpantidis, L.; Andersen, R.S.; Schou, C.; Bøgh, S.; Krüger, V.; Madsen, O. Robot skills for manufacturing: From concept to industrial deployment. Robot. Comput. Integr. Manuf. 2016, 37, 282–291. [Google Scholar] [CrossRef]
- Ur Rehman, M.H.; Yaqoob, I.; Salah, K.; Imran, M.; Jayaraman, P.P.; Perera, C. The role of big data analytics in industrial Internet of Things. Future Gener. Comput. Syst. 2019, 99, 247–259. [Google Scholar] [CrossRef]
- Lee, J.; Davari, H.; Singh, J.; Pandhare, V. Industrial Artificial Intelligence for industry 4.0-based manufacturing systems. Manuf. Lett. 2018, 18, 20–23. [Google Scholar] [CrossRef]
- Naveen, S. Study of IoT: Understanding IoT Architecture, Applications, Issues and Challenges. In Proceedings of the International conference on Innovations in Computing & Networking ICICN 16, Bengaluru, India, 12–13 May 2016. [Google Scholar]
- Qin, W.; Chen, S.; Peng, M. Recent advances in industrial internet: Insights and challenges. Digit. Commun. Netw. 2019. [Google Scholar] [CrossRef]
- Altarawneh, M.; Al-qaisi, A. Evaluation of Cloud Computing Platform for Image Processing Algorithms. J. Eng. Sci. Technol. 2019, 14, 2345–2358. [Google Scholar]
- Bi, Z.M.; Miao, Z.; Zhang, B.; Zhang, C.W.J. The state of the art of testing standards for integrated robotic systems. Robot. Comput. Integr. Manuf. 2020, 63, 101893. [Google Scholar] [CrossRef]
- Shanmugamani, R.; Sadique, M.; Ramamoorthy, B. Detection and classification of surface defects of gun barrels using computer vision and machine learning. Measurement 2015, 60, 222–230. [Google Scholar] [CrossRef]
- Marvin Minsky | American Scientist. Encyclopedia Britannica. Available online: https://www.britannica.com/biography/Marvin-Lee-Minsky (accessed on 22 January 2020).
- Wuest, T.; Weimer, D.; Irgens, C.; Thoben, K.-D. Machine learning in manufacturing: Advantages, challenges, and applications. Prod. Manuf. Res. 2016, 4, 23–45. [Google Scholar] [CrossRef]
- Mafi, M.; Martin, H.; Cabrerizo, M.; Andrian, J.; Barreto, A.; Adjouadi, M. A comprehensive survey on impulse and Gaussian denoising filters for digital images. Signal Process. 2019, 157, 236–260. [Google Scholar] [CrossRef]
- Hussain, A.J.; Al-Fayadh, A.; Radi, N. Image compression techniques: A survey in lossless and lossy algorithms. Neurocomputing 2018, 300, 44–69. [Google Scholar] [CrossRef]
- O’Mahony, N.; Campbell, S.; Carvalho, A.; Harapanahalli, S.; Hernandez, G.V.; Krpalkova, L.; Riordan, D.; Walsh, J. Deep Learning vs. Traditional Computer Vision. In Advances in Computer Vision; Springer International Publishing: Cham, Switzerland, 2019; pp. 128–144. [Google Scholar] [CrossRef]
- Joshi, K.D.; Chauhan, V.; Surgenor, B. A flexible machine vision system for small part inspection based on a hybrid SVM/ANN approach. J. Intell. Manuf. 2020, 31, 103–125. [Google Scholar] [CrossRef]
- Krizhevsky, A.; Sutskever, I.; Hinton, G. ImageNet Classification with Deep Convolutional Neural Networks. Neural Inf. Process. Syst. 2012, 25. [Google Scholar] [CrossRef]
- You Only Look Once: Unified, Real-Time Object Detection—IEEE Conference Publication. Available online: https://proxy.univh2c.ma:2291/document/7780460 (accessed on 1 June 2020).
- Wang, T.; Chen, Y.; Qiao, M.; Snoussi, H. A fast and robust convolutional neural network-based defect detection model in product quality control. Int. J. Adv. Manuf. Technol. 2018, 94, 3465–3471. [Google Scholar] [CrossRef]
- Wang, Y.; Liu, M.; Zheng, P.; Yang, H.; Zou, J. A smart surface inspection system using faster R-CNN in cloud-edge computing environment. Adv. Eng. Inform. 2020, 43, 101037. [Google Scholar] [CrossRef]
- Salhaoui, M.; Guerrero-González, A.; Arioua, M.; Ortiz, F.J.; El Oualkadi, A.; Torregrosa, C.L. Smart Industrial IoT Monitoring and Control System Based on UAV and Cloud Computing Applied to a Concrete Plant. Sensors 2019, 19, 3316. [Google Scholar] [CrossRef] [PubMed]
- Salhaoui, M.; Molina-Molina, J.C.; Guerrero-González, A.; Arioua, M.; Ortiz, F.J. Autonomous Underwater Monitoring System for Detecting Life on the Seabed by Means of Computer Vision Cloud Services. Remote Sens. 2020, 12, 1981. [Google Scholar] [CrossRef]
- Casting Product Image Data for Quality Inspection. Available online: https://kaggle.com/ravirajsinh45/real-life-industrial-dataset-of-casting-product (accessed on 25 December 2020).
- Quality Prediction in a Mining Process. Available online: https://kaggle.com/edumagalhaes/quality-prediction-in-a-mining-process (accessed on 25 December 2020).


Publisher’s Note: MDPI stays neutral with regard to jurisdictional claims in published maps and institutional affiliations. |
© 2021 by the authors. Licensee MDPI, Basel, Switzerland. This article is an open access article distributed under the terms and conditions of the Creative Commons Attribution (CC BY) license (http://creativecommons.org/licenses/by/4.0/).