Article

Sensitivity Analysis of Italian Lolium spp. to Glyphosate in Agricultural Environments

1
Institute for Sustainable Plant Protection (IPSP) – CNR, Viale dell’Università 16, 35020 Legnaro (PD), Italy
2
Bayer AG, Industriepark Hoechst, H872, D-65926 Frankfurt am Main, Germany
*
Author to whom correspondence should be addressed.
Plants 2020, 9(2), 165; https://doi.org/10.3390/plants9020165
Submission received: 31 December 2019 / Revised: 27 January 2020 / Accepted: 28 January 2020 / Published: 30 January 2020
(This article belongs to the Special Issue Herbicide Resistance in Plants)

Abstract

:
Empirical observations generally indicate a shifting and decreased Lolium spp. susceptibility to glyphosate in Italy. This is likely due to the long history of glyphosate use and to the sub-lethal doses commonly used. There is, therefore, a need to determine the variability of response of Lolium spp. to glyphosate and identify the optimum field dose. To perform a sensitivity analysis on Lolium spp. populations in an agriculture area, collection sites were mainly chosen where glyphosate had not been applied intensely. Known glyphosate-resistant or in-shifting populations were included. Two outdoor dose-response pot experiments, including eleven doses of glyphosate, were conducted. The dose to control at least 93%–95% of susceptible Lolium spp. was around 450 g a.e. ha−1. However, to preserve its efficacy in the long term, it would be desirable not to have survivors, and this was reached at a glyphosate dose of 560 ± 88 g a.e. ha−1. Taking into account the variability of response among populations, it was established that the optimal dose of glyphosate to control Lolium spp. in Italy up to the stage BBCH 21 has to be at least 700 g a.e. ha−1. As a consequence, it is recommended to increase the label recommended field rate for Lolium spp. control in Italy to a minimum of 720 g a.e. ha−1.

1. Introduction

Lolium rigidum Gaud. (rigid ryegrass, LOLRI) and Lolium multiflorum Lam. (Italian ryegrass, LOLMU) are two self-incompatible species that have a global distribution [1]. According to reported cases [2], they are among the species most prone to evolve herbicide resistance. L. rigidum is one of the most troublesome weeds in grain crops as well as orchards, olive groves and vineyards, where it is also managed as a cover crop [3]. To date, L. rigidum populations resistant to 13 different herbicide Sites of Action (SoA) have been reported [4]. L. multiflorum occurs in several temperate countries and populations resistant to nine different herbicide SoA have been reported [4]. Both species originated from the Mediterranean, have a C3 photosynthetic pathway and produce dense infestations [5]. The two species are often mixed in the field and not always easily identifiable, and in those cases, the population is defined as LOLSS (Lolium species).
The withdrawal of many herbicides from the EU market due to the strict regulation, the lack of herbicides with new SoA [6] and the propensity of Lolium spp. to evolve resistance to the most commonly used post-emergence herbicides have increased the importance of glyphosate for the management of these species in agricultural and in non-agricultural areas [1]. Glyphosate is the most successful herbicide in history [7,8], and its use is higher than any other herbicide SoA [6]. According to the HRAC (International Herbicide Resistance Action Committee) classification [9], which is based on the herbicides’ SoA, it belongs to group G and exerts its action by inhibiting 5-enolpyruvylshikimate-3-phosphate (EPSP) synthase in plants, fungi and microorganisms, the only life forms that possess the shikimate pathway. Therefore, it has no measurable mammalian toxicity at the concentrations used [10]. It acts as a competitive inhibitor to the phosphoenol-pyruvate (PEP) binding site and a non-competitive inhibitor for the shikimate-3-phosphate (S3P) site, thus preventing the formation of EPSP [11].
Glyphosate is a non-selective, systemic, post-emergence herbicide that controls many dicotyledonous and monocotyledonous weeds [12]. It is neither active nor residual in the soil and, therefore, selection pressure for resistance is only exerted on emerged seedlings [13]. Glyphosate-resistant weeds were not found during the first 22 years of glyphosate use, whereas in the last 23 years (1996–2019), glyphosate resistance was documented in 45 weed species in 29 countries [4].
Glyphosate is also commonly used on a frequent basis between tree rows (i.e., olives, hazelnuts and vineyards) and for roadside weed control [14]. In these situations, glyphosate can be used for many years and applied several times per year. The continuous use of glyphosate in perennial crops, such as orchards, has imposed intense selection pressure for resistance evolution and has led to shifts in weed floras as well as towards glyphosate-resistant individuals [15,16]. In particular, in Europe, glyphosate resistance has evolved most often in two genetically diverse, but at the same time, resistance-prone genera, Conyza [17] and Lolium [18].
In Italy, the doses of glyphosate commonly used have become sub-lethal for Lolium spp. [19]. In the past, the rate of 360 g a.e. (acid equivalent) ha−1 gave satisfactory control, but it is likely that a few plants survived each treatment. Exposure to recurrent selection at sub-lethal glyphosate doses can result in a shift towards resistance within a few generations. It was clearly demonstrated by Busi and Powles [20] that in allogamous species, such as Lolium, minor resistance gene trait(s) may be additively enriched through cross-pollination among surviving plants. In Italy, empirical observations indicated a general decrease in susceptibility of Lolium spp. to glyphosate (i.e., relatively poor control at 360 g a.e. ha−1) and the first resistance cases were reported in 2008 [19]. At the moment, 13 municipalities in five Italian regions and five different cropping systems (including orchards, olive groves, vineyards, wheat and no-tillage agriculture) are affected by glyphosate resistance [21].
As part of the herbicide resistance risk analysis and management, the availability of a robust baseline sensitivity for key-target species is critical to discriminate between susceptible (S) and resistant (R) populations and to identify early shifts in susceptibility. From a practical point of view, a population is ascribed as resistant (R) to a herbicide when more than 20% of treated plants survived the recommended herbicide field dose [22]. The identification of a first shift in susceptibility is particularly valuable when resistance evolution is rather slow, as in glyphosate resistance. Only a few herbicide sensitivity analyses are available in the literature [23,24,25,26]. The European and Mediterranean Plant Protection Organization defines the baseline as the mean of natural variability of a target species’ sensitivity before the commercial introduction of an active ingredient and can be taken as a point of reference to be used in decision-making processes. Instead, glyphosate has been on the market for many years, and its selection pressure has been active for a long time. In such a case, the baseline term/approach is not correct, and a sensitivity analysis should instead be performed. The aim of a sensitivity analysis is to determine the average efficacy of an old herbicide on weed populations that may have been treated before with the same compound [27,28]. In other words, this is part of the monitoring procedure of herbicide efficacy. To our knowledge, only one paper in the literature has dealt with the glyphosate baseline sensitivity for L. rigidum in Spain using a quick Petri dishes test [29].
The establishment of a good sensitivity baseline should make it easier to identify any case of evolved herbicide resistance [30] and would have an added value if an effective monitoring program is initiated [29].
The aims of this research were (1) to determine the variability in glyphosate response of Lolium spp. populations collected from Italian agricultural environments and (2) to determine the glyphosate dose that is actually effective on the Lolium spp. populations in field conditions in order to preserve its efficacy in the long term.

2. Results

2.1. Dose-Response Experiments

Two outdoor pot dose-response experiments were performed during spring (March-May) and autumn (September-November) to test the effects of increasing glyphosate dose on plant survival and fresh weight for several Lolium spp. populations collected from Italian agricultural environments. The effective doses—EDs—and growth rates—GRs—causing 50% and 90% reduction in plant survival and fresh weight (ED50-ED90 and GR50-GR90), respectively, were calculated using a regression analysis (see Section 4.3).

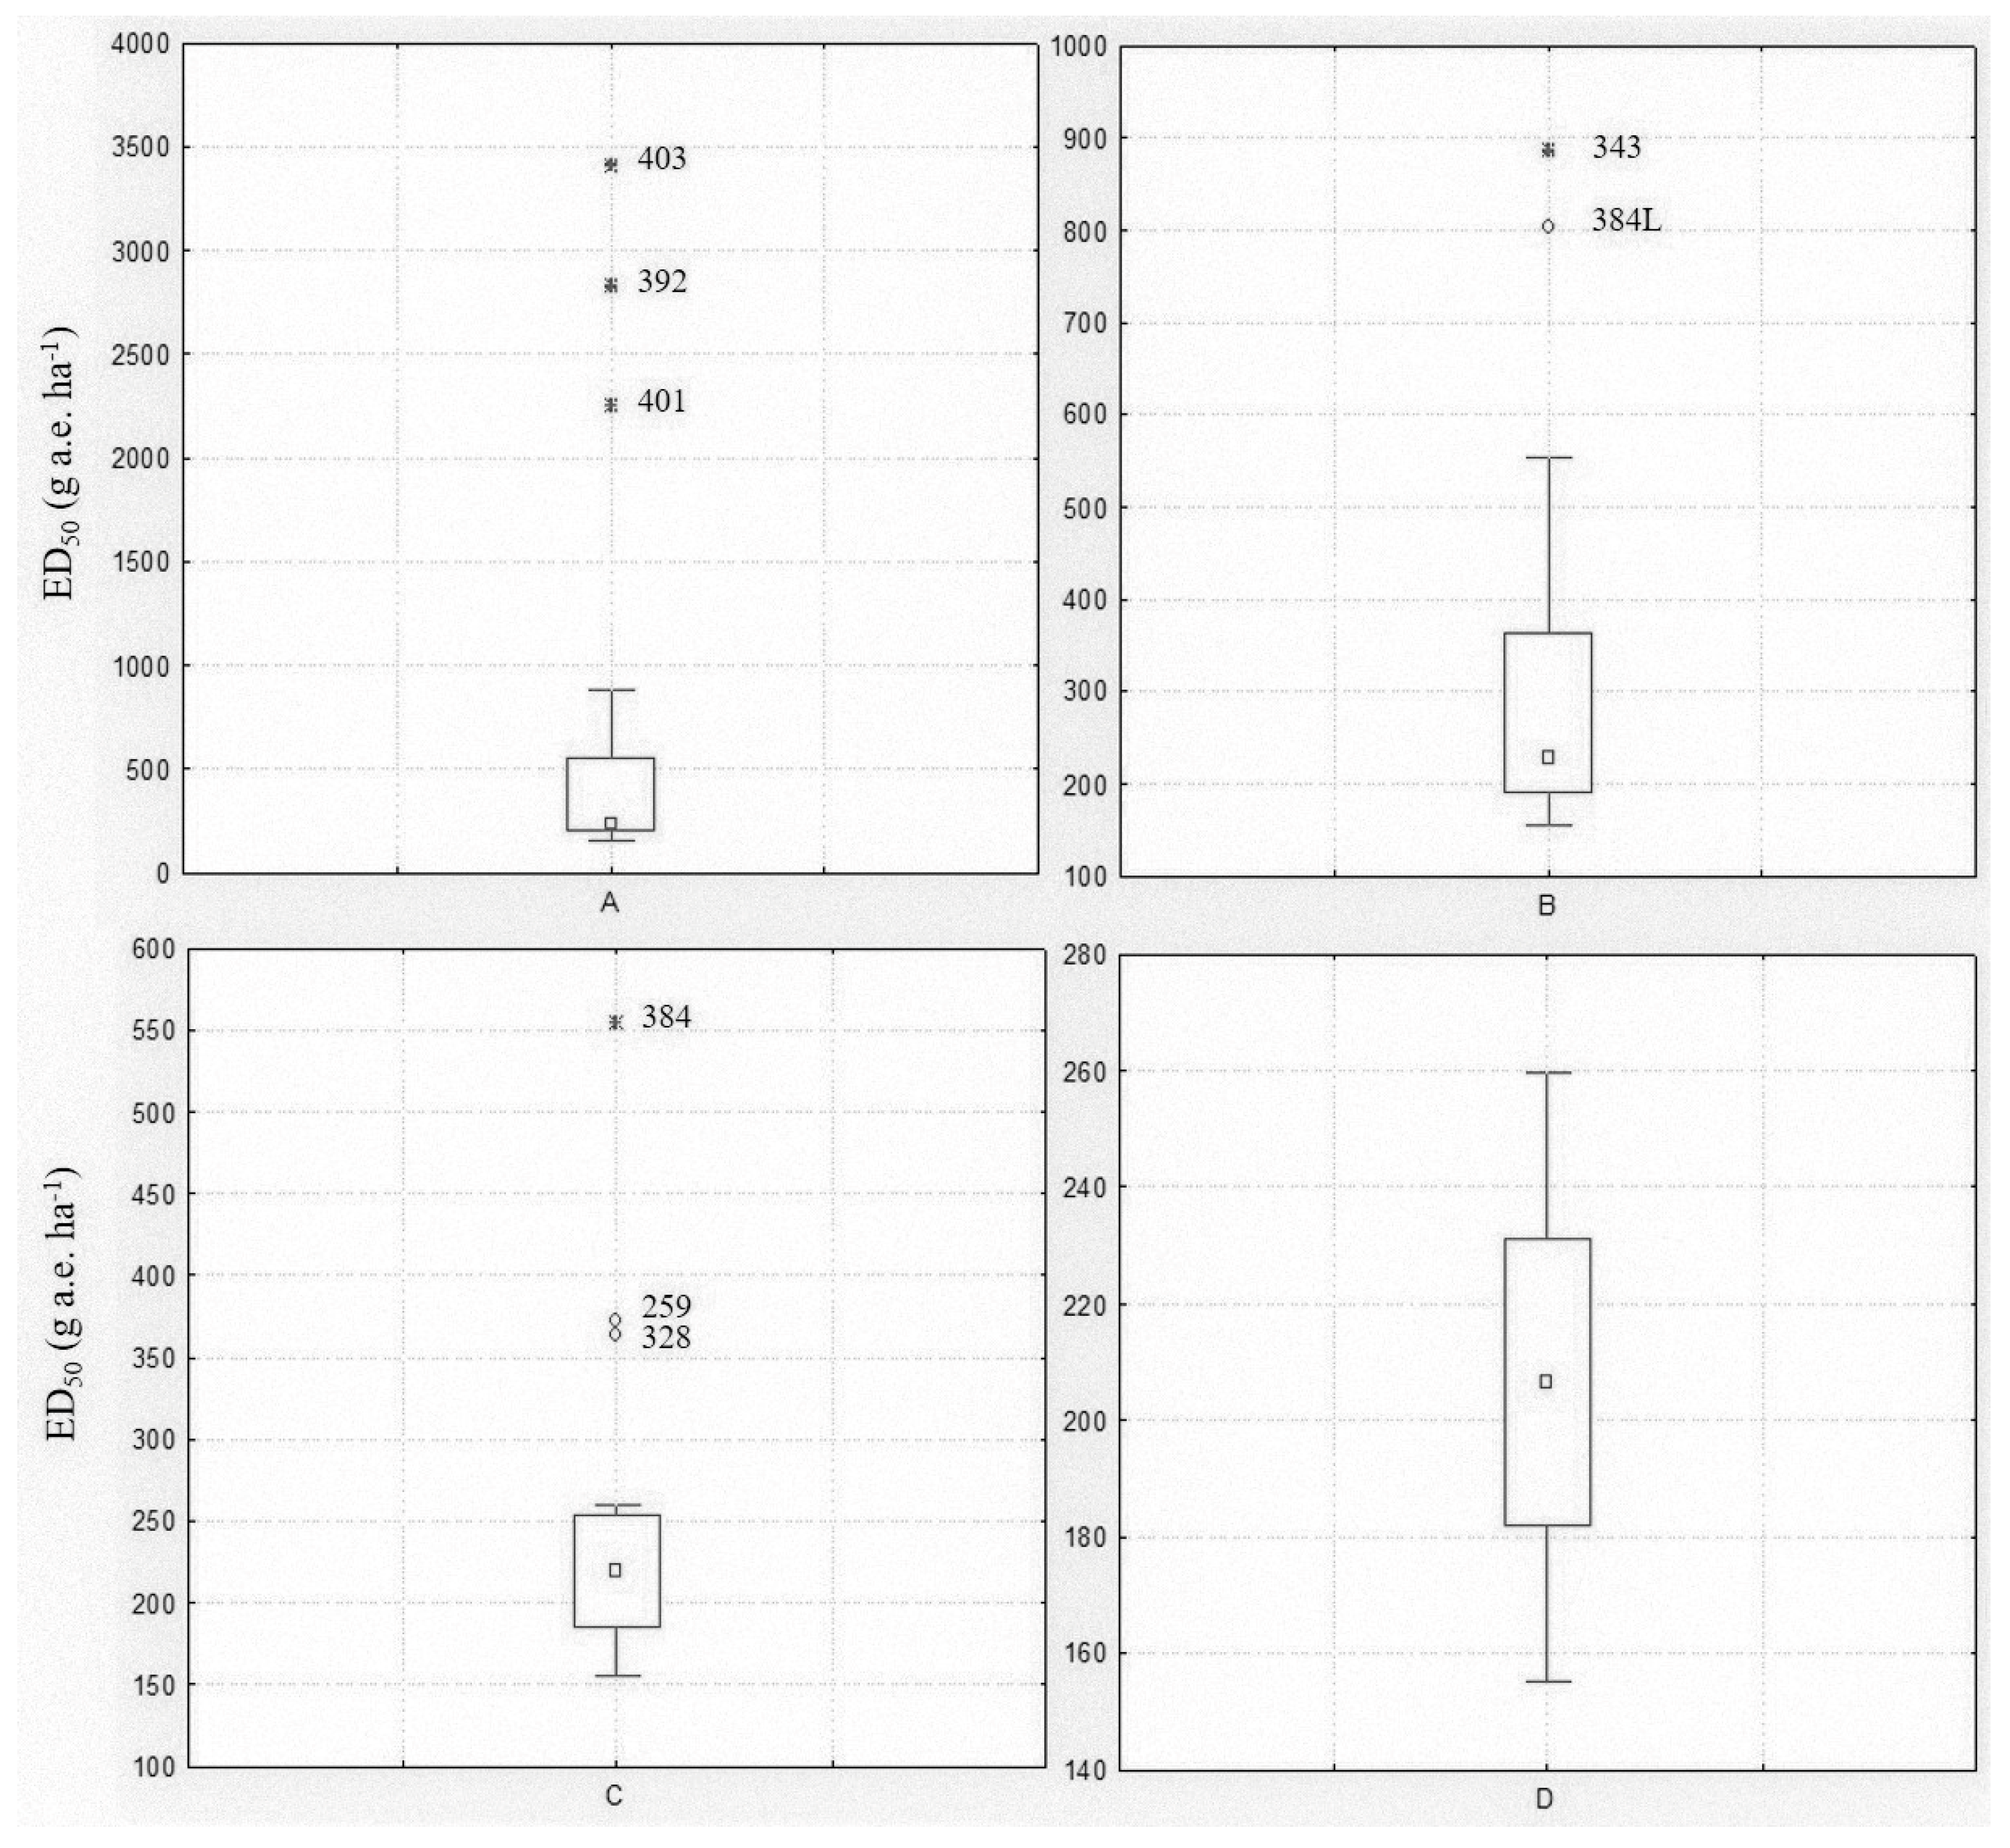
2.1.1. Spring Dose-Response Experiment

Twenty populations were included in the spring experiment (Table 1a). A variance test (F-test) was performed to compare the dose-response curves obtained for the different populations in the experiment. The lack-of-fit F-test on both plant survival and fresh weight indicated that it was not possible to simplify the glyphosate regressions to a model with a common slope for all populations: the slope tended to decrease when EDs (and GRS) increased. The data of each population were, therefore, regressed as individual curves and treated separately.
Among the populations included in the spring experiment, eight were known resistant/shifting populations. A Box and Whisker analysis using the median and 25–75 percentiles was used to statistically exclude outliers. The analysis was performed including all populations, then repeated excluding the outliers until no further outliers were identified (Figure 1). The first analysis revealed three extreme value populations (403, 392 and 401) (Figure 1A), all previously confirmed as resistant (Table 1). The analysis was repeated excluding those populations and limiting the ED50 range to between 155 and 900 g a.e. ha−1. In this second step, two other populations (343 and 384L) were found to be outliers (Figure 1B). The third analysis considered an ED50 range of 155–560 g a.e. ha−1 and highlighted three other outlier populations (384, 259 and 328) (Figure 1C), one included in the experiment as R check (384) and the two shifting populations (Table 1). The fourth analysis with 12 populations and an ED50 range of 155–260 g a.e. ha−1 did not reveal any outlier population (Figure 1D). The Box and Whisker analysis, also repeated for the ED90 and GRs values (data not shown), confirmed that all eight populations included in the experiment as resistant or partially resistant to glyphosate had a reduced sensitivity or resistance to this herbicide.
Considering the data of the other twelve populations resulted as being sensitive to glyphosate, it was highlighted that glyphosate ED50 ranged from 155 ± 5.9 to 260 ± 6.7 with a mean value of 206 g a.e. ha−1 and ED90 from 243 ± 20.8 to 506 ± 79.1 with a mean value of 342 g a.e. ha−1. Concerning fresh weight, GR50 varied from 31 ± 8.8 to 98 ± 14.7 with a mean value of 64 g a.e. ha−1, GR90 from 144 ± 15.7 to 272 ± 26.3 with a mean value of 198 g a.e. ha−1.

2.1.2. Autumn Dose-Response Experiment

Twelve susceptible populations selected in the spring experiment were also tested in the autumn experiment, together with another eighteen populations reported in Table 1b. In this second experiment, the Box and Whisker analysis did not highlight any outliers among populations.
As for the spring experiment, the lack-of-fit F-test on both plant survival and fresh weight in the autumn experiment indicated that it is not possible to simplify the regressions to a model with a common slope for all populations, so a single-curve analysis was preferred.
Furthermore, an ad hoc lack-of-fit F-test performed on the data of each population included in both experiments comparing the dose-response curves obtained in the two experiments showed that most of the curves were significantly different at p < 0.05, so the two experiments cannot be merged (data not shown). Populations data could not be pooled considering both plant survival and fresh weight, so it was decided to consider the two experiments separately.
ED50 based on the autumn dose-response experiment ranged from 108 ± 10.1 to 282 ± 7.1 with a mean value of 186 g a.e. ha−1 (Figure 2a) and ED90 from 189 ± 16.7 to 561 ± 87.7 g a.e. ha−1 with a mean value of 317 g a.e. ha−1 (Figure 2b); concerning fresh weight, GR50 varied from 37 ± 4.8 to 148 ± 8.4 with a mean value of 78 g a.e. ha−1, GR90 from 136 ± 10.3 to 295 ± 37.6 g a.e. ha−1 with a mean value of 199 g a.e. ha−1 (data not shown).
Cluster analyses were used to determine whether correlations were present between the calculated parameters (i.e., EDs and GRs) and the collection sites or geographical origin as well as species of the different populations. A cluster analysis based on the ED50 highlighted two clusters (Figure 2a), whereas the data were divided into four clusters when ED90 were considered (Figure 2b). In both cases, no correspondence was detected among these divisions and geographical origin of the populations, Lolium species or cropping system/collection site. Similar results were obtained considering GRs; therefore, data are not reported.

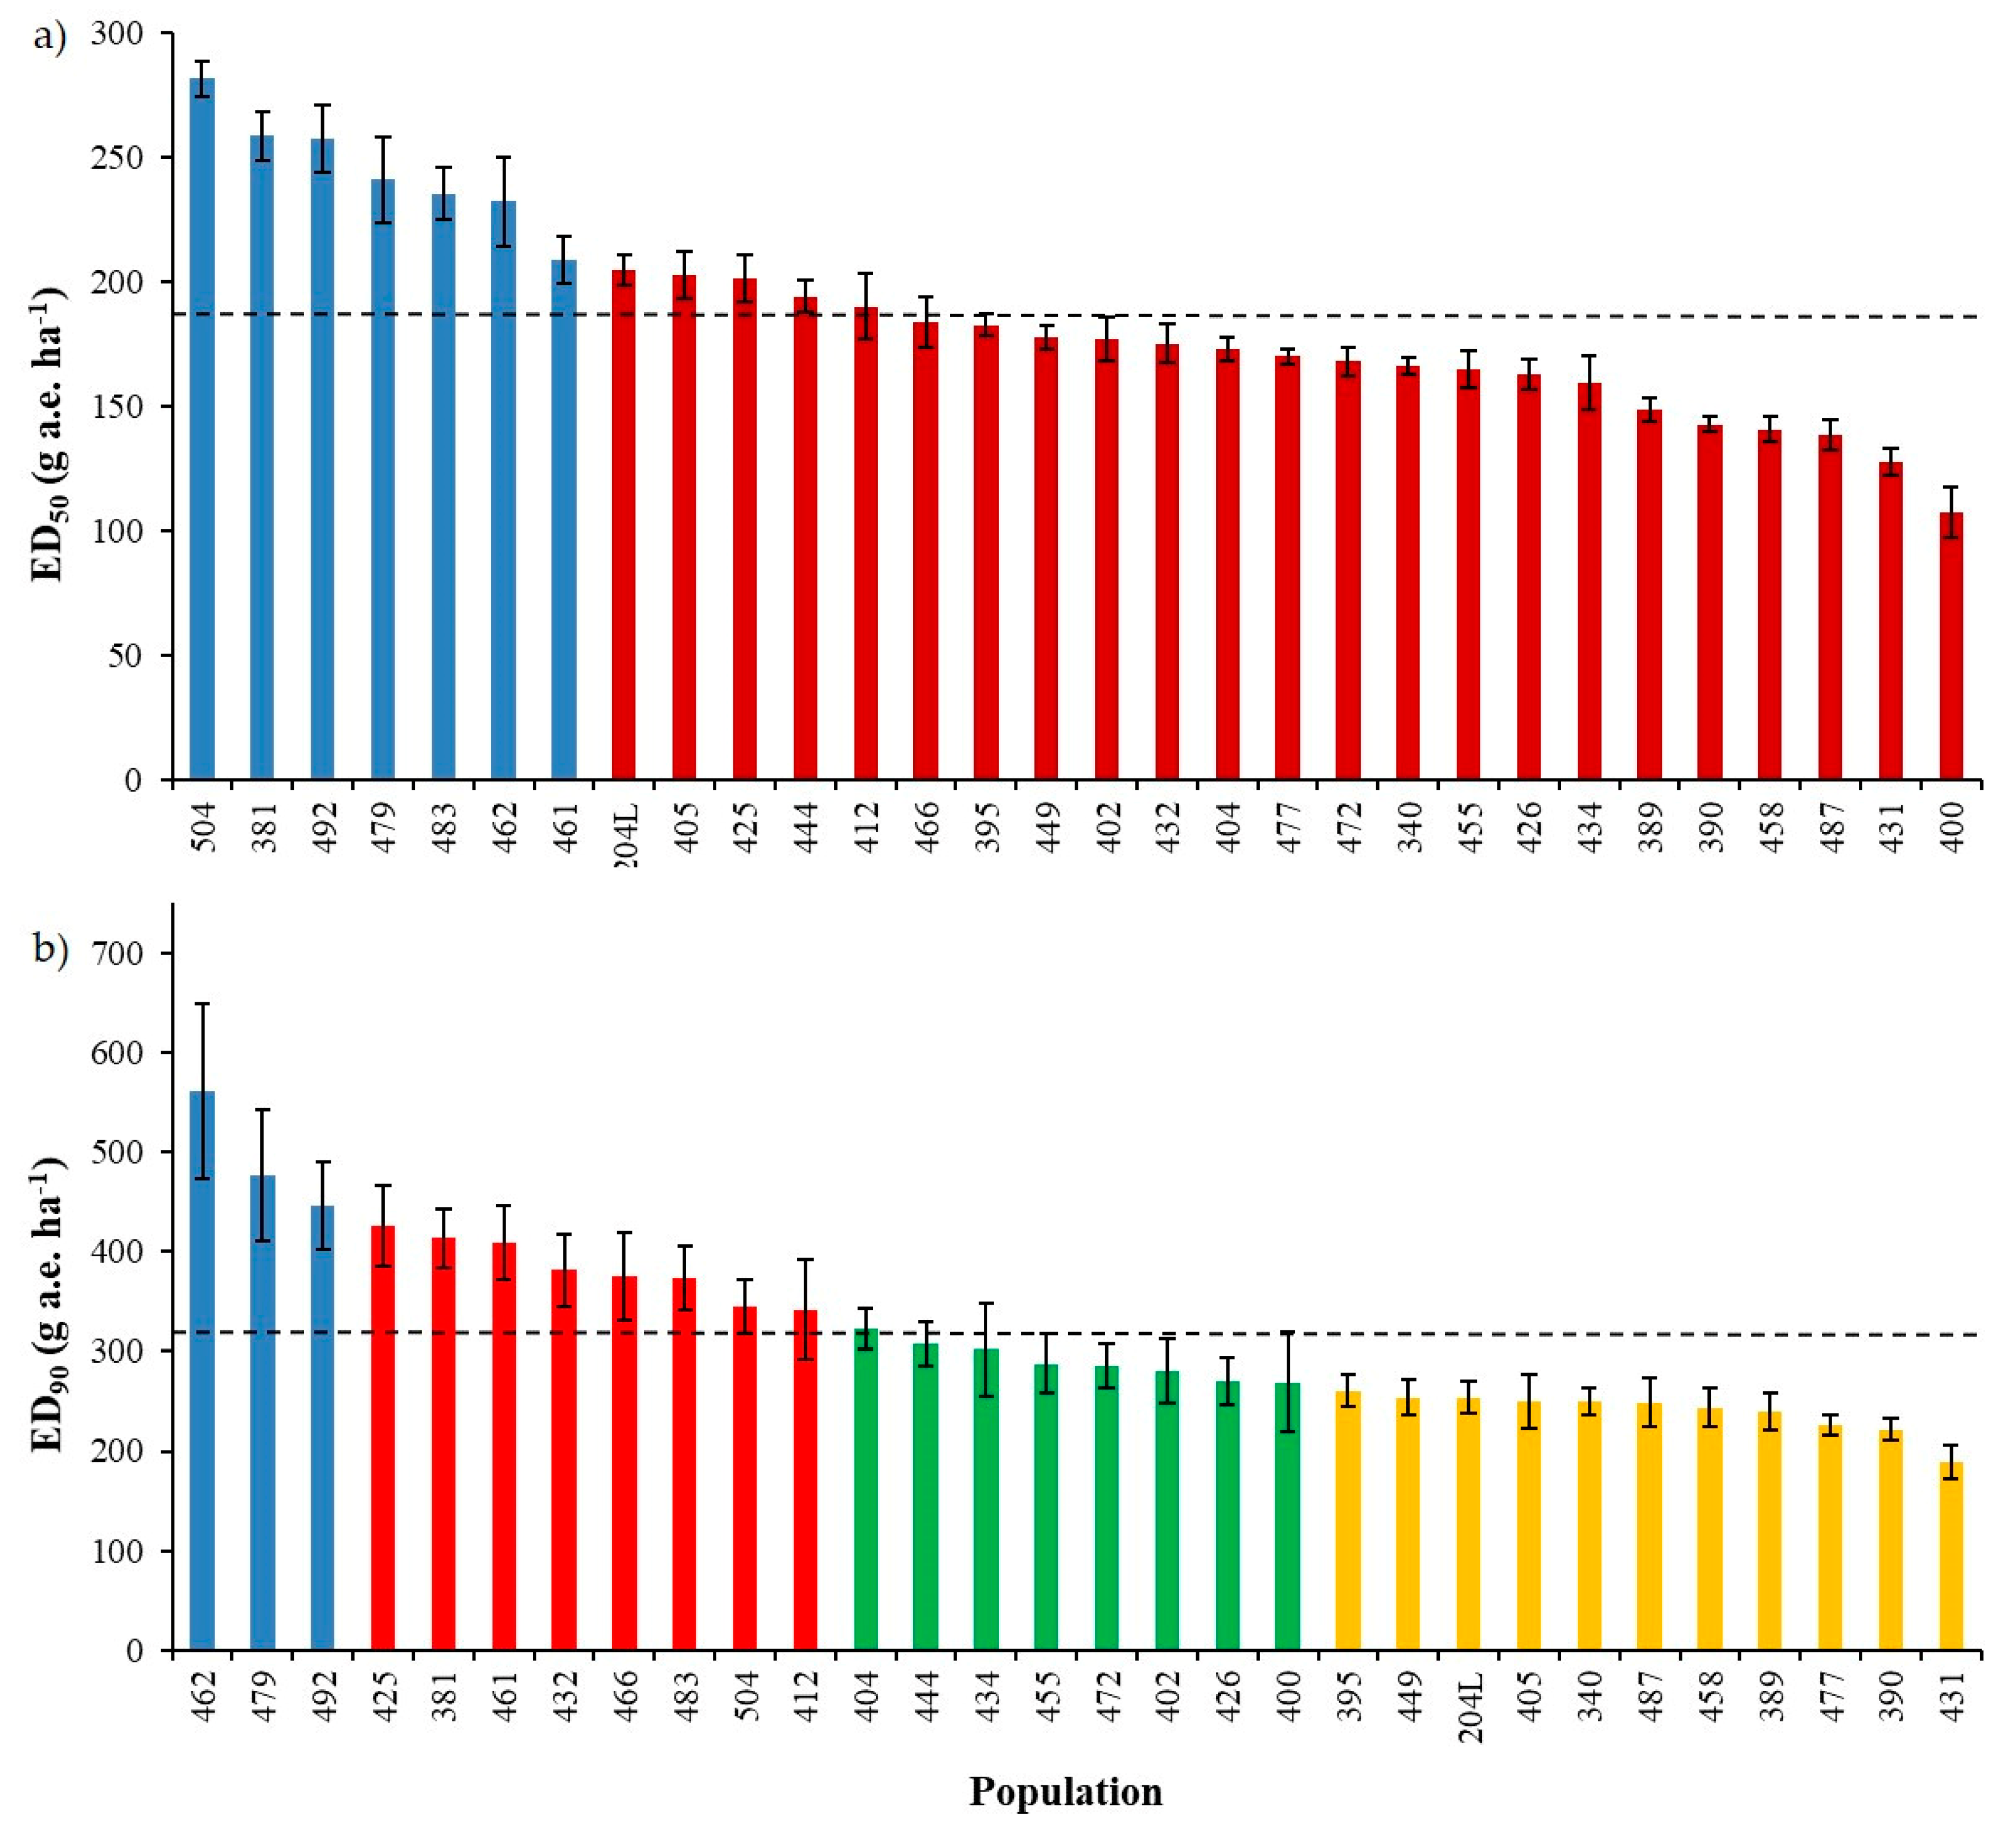
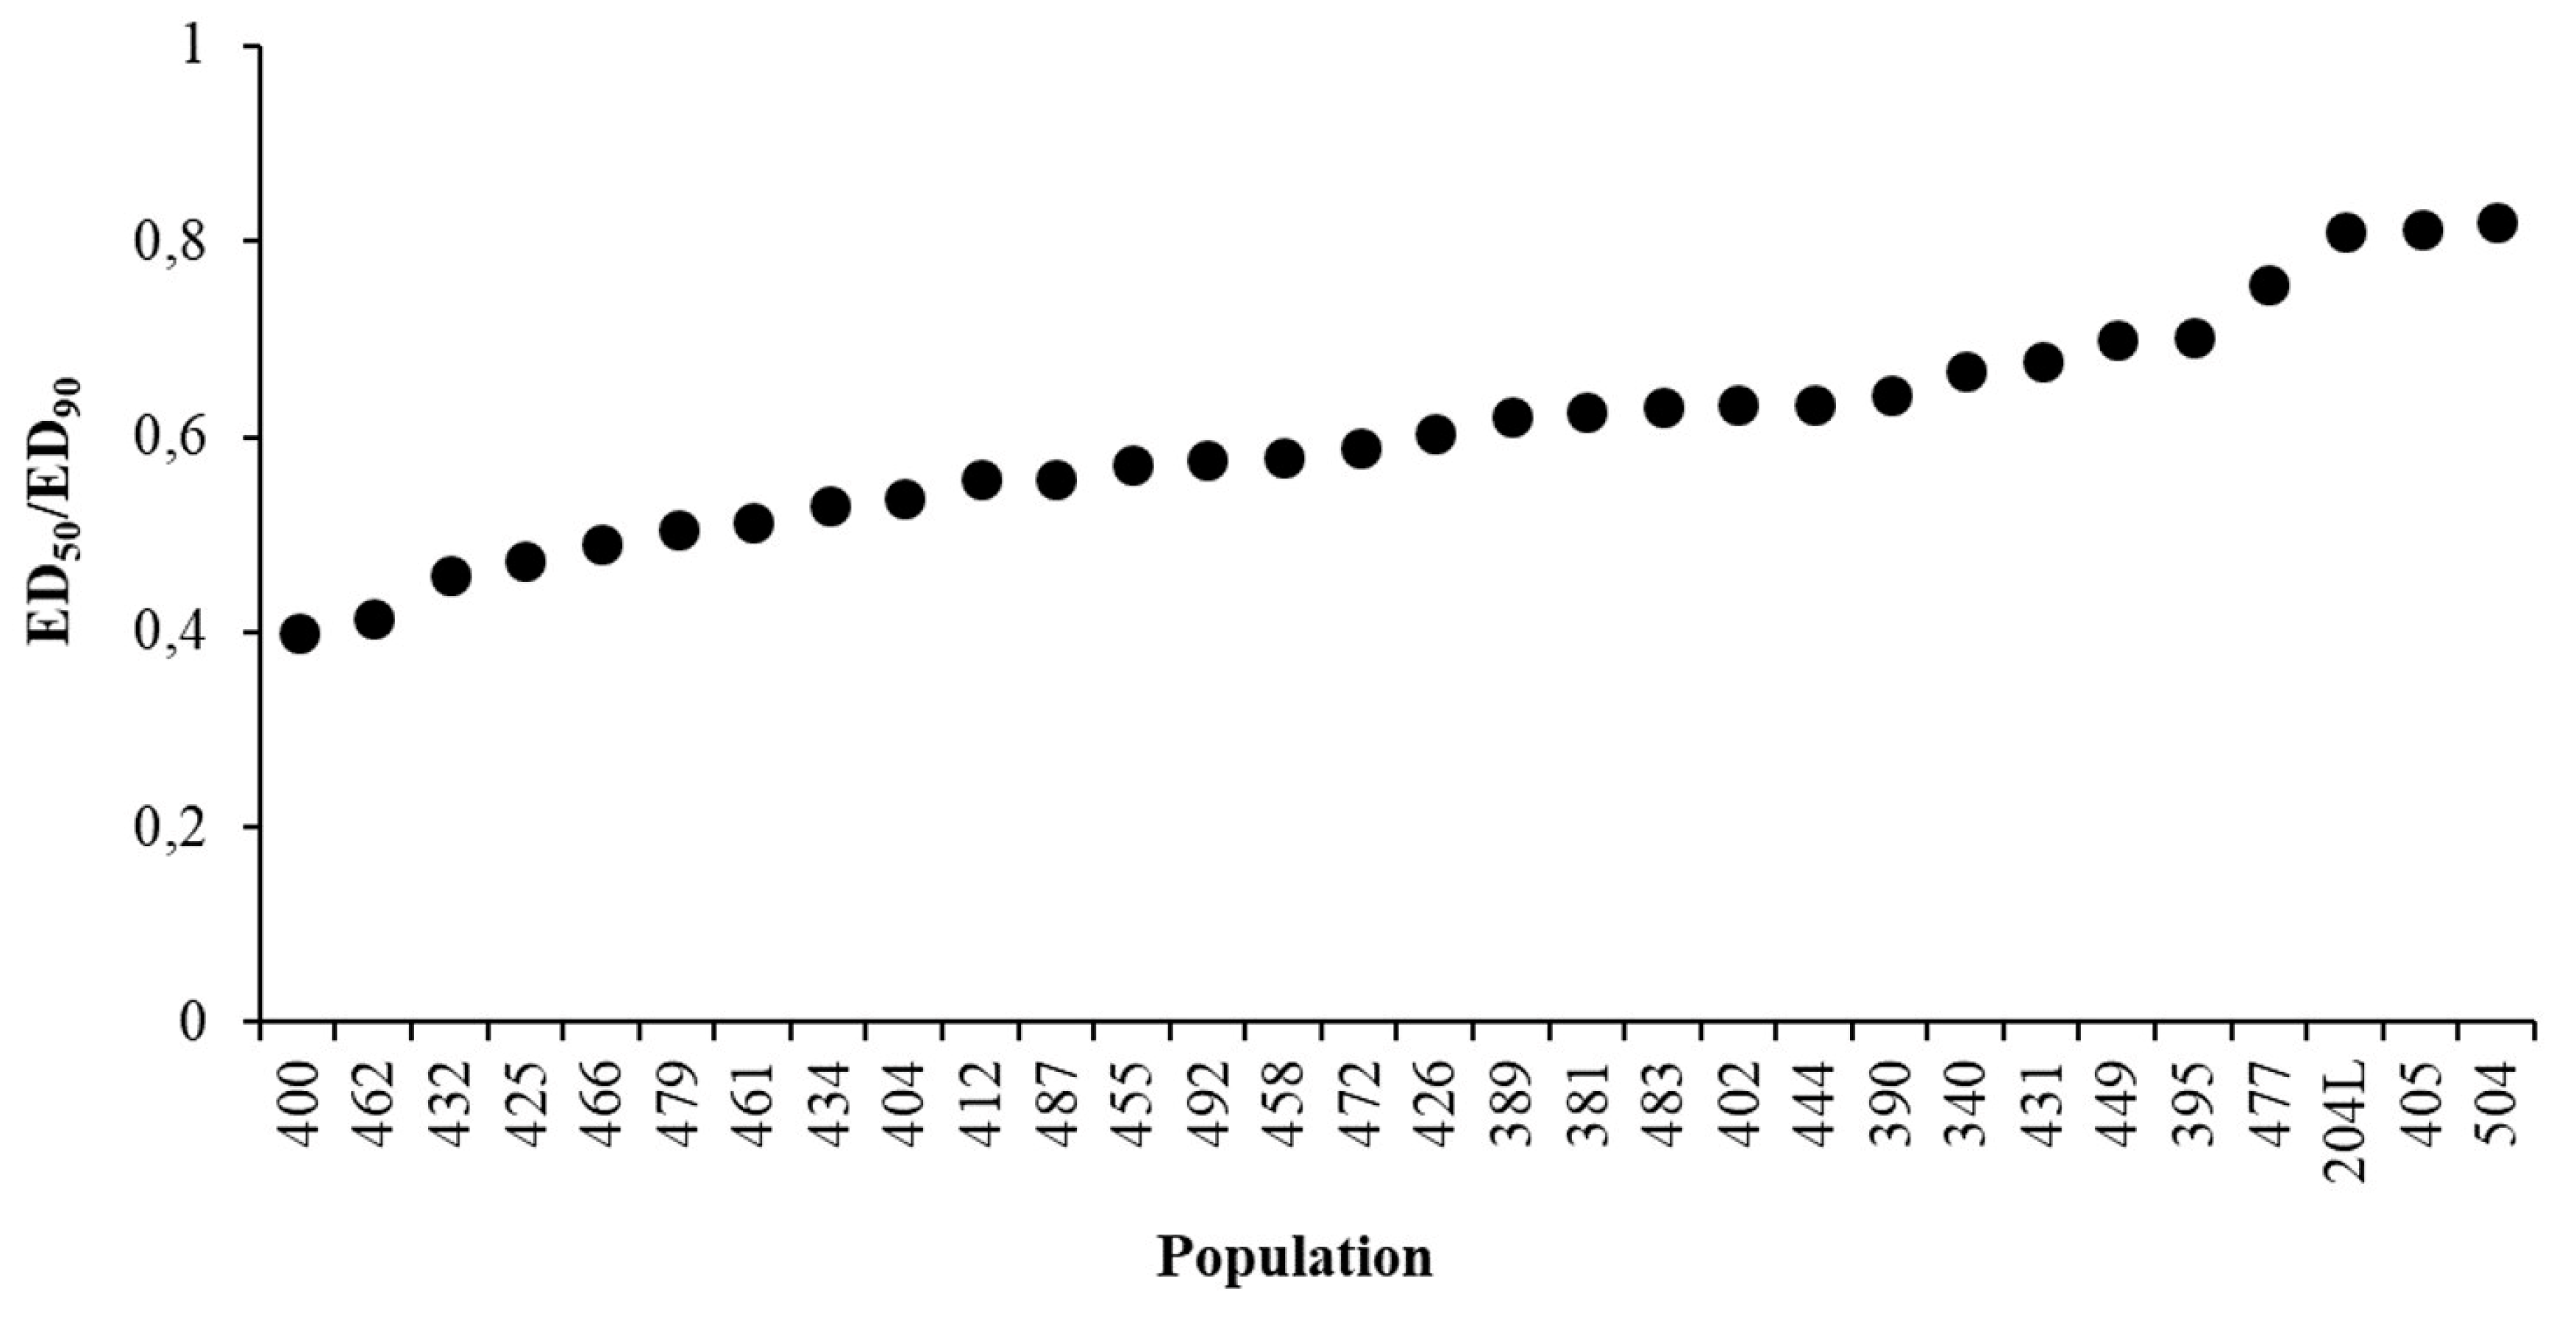
2.2. Sensitivity Line Calculation

Based on the results obtained through the dose-response experiments, the range of glyphosate susceptibility of L. multiflorum and L. rigidum sampled in Italian agricultural environments was established, a sensitivity line was calculated and the dose of glyphosate to fully control Lolium spp. in agronomic conditions was proposed.
The paired t-test proved that no significant differences were found between the mean EDs and mean GRs of the two experiments (considering only the common populations), so for calculation of the threshold value of the sensitivity analysis, only the data of the autumn experiment, having a higher number of populations, were considered.
Based on the mean value of ED90 as well as the variability across and within populations (Figure 2b), it was established that an agronomically suitable dose (i.e., at least 93%–95% of control) to adequately control susceptible Lolium species was around 450 g a.e. ha−1 of glyphosate. Therefore, the current dose indicated in Italy (480 g a.e. ha−1) is enough to adequately control susceptible plants, confirming that the old dose (360 g a.e. ha−1) was sub-lethal for many populations. As an anti-resistance measure, it is important to keep efficacy at or near 100% to avoid, or at least slow down, the selection and eventually the evolution of glyphosate resistance under tough climatic conditions or weed growth stages that can affect glyphosate efficacy level.
Figure 3 demonstrates how the sensitivity analyses data can be used to identify potentially resistant populations. The range of ED90 for the autumn experiment was 189-561 g a.e. ha−1, with a mean sensitivity line of 317 g a.e. ha−1. A population can, therefore, be considered as shifting (or partially resistant) if the difference between the threshold value and population is greater than 2x (634 g a.e. ha−1) [26] (e.g., populations 259 and 328 included in the spring experiment). A population can be considered as resistant if the difference between threshold value and population is greater than 3x (951 g a.e. ha−1) (e.g., populations 384, 384L, 343, 392, 403 and 401 included in the spring experiment, plus populations 332 and 336 [31]) (Figure 3).
Two parameters that illustrate the variability of the response of populations to glyphosate were calculated (see Section 4.4). ED50/90 variations do not fully explain the overall variability, and slope also has to be taken into account (Figure 4). When the ratio is close to one the slope tends to be vertical, i.e., small variations of glyphosate dose around EDs cause large variations in weed control. However, we did not observe any relation between collection site and slope. The Sensitivity Index (S.I.) proved to be three, demonstrating that there is a three-fold difference in sensitivity to glyphosate between Lolium spp. populations harvested across Italian agricultural environments.

3. Discussion

Glyphosate is an efficient herbicide, and the evolution of resistant weeds is a big hindrance to efficient control in many circumstances [7]. Given that no herbicides with truly new molecular target sites have been marketed in the past 30 years and that there is no silver bullet chemistry ready to enter the marketplace [32], glyphosate efficacy should be preserved in the long term, especially in those cropping systems where there is a shortage of post-emergence herbicides (i.e., targeting grasses) or as a tool in weed resistance management. For these reasons, efficacy of herbicide treatments should be kept at or near 100% to avoid or at least slow down the selection and eventually the evolution of glyphosate resistance.
The two dose-response experiments performed to calculate the sensitivity line of glyphosate in Italian agricultural environments could not be pooled together for several reasons. First of all, in the second experiment, a larger number of populations coming from different parts of Italy and different agricultural systems were included in order to give a higher impact to the study. Secondly, it is very rare that two experiments conducted in outdoor conditions can be considered together because there are too many uncontrollable variables (e.g., variation in temperature, rainfall). In particular, this was expected using glyphosate because its performance is known to vary seasonally [18,33].
On the basis of ED50, GR50, ED90, GR90 and slope, it was not possible to discriminate L. multiflorum, L. rigidum or intermediates, and neither a difference related to geographical areas nor collection site was found. Most probably, if a correlation is present among these values and the variables considered, a more specific study with a larger number of populations needs to be assessed. An example was reported for 80 accessions of Echinochloa spp. where E. crus-galli was found to be more sensitive than other Echinochloa species when sprayed with azimsulfuron or cyhalofop-butyl [23].
On average, GR50 and GR90 (78 and 199 g a.e. ha−1, respectively) were lower than ED50 and ED90 (186 and 317 g a.e. ha−1, respectively) indicating that a significant proportion of surviving plants had a low fitness and likely a low competitivity with the crop. However, it cannot be excluded that they could produce some seeds [34]. Therefore, in order to not underestimate this aspect, the ED values were used to calculate the sensitivity line.
The Box and Whisker analysis indicated that the selection of populations was adequate for the purpose of the study; in fact, only the populations included in the spring experiment as resistant or partially resistant checks were excluded through the analyses (Figure 2), whereas no outliers were found in the autumn experiment.
Data variability increased with EDs, which may indicate that less susceptible populations are also less homogeneous in terms of glyphosate susceptibility. The proposed field dose also considers this variability and was calculated excluding the eight outlier populations identified through the Box and Whisker analysis in the spring experiment. The eight outliers correspond to the resistant and partially resistant (i.e., in-shifting) populations included for comparison (Table 1a) and for which the resistance mechanisms have been described elsewhere (Table 1a [19,31]). In this study, it was demonstrated that the optimal glyphosate dose to control Lolium spp. in Italy at the growth stage of first shoot visible (i.e., using the Extended BBCH scale at growth stage 21 [35]) should be 700 g a.e. ha−1 of glyphosate or higher. Indeed, in our experimental conditions no survivors were recorded for any susceptible population treated with 560 g a.e. ha−1 of glyphosate, whereas to completely control the shifting populations, 720 g a.e. ha−1 was necessary. This indicates that slightly higher doses, while remaining abundantly within the label recommendations, may be useful to control and hopefully reduce the evolution of resistance to this herbicide.
Guidelines for future herbicide-resistant weed management globally should focus on avoiding a general use of reduced herbicide, especially glyphosate [36]. Successful integrated weed management strategies should aim at decreasing weed seed banks and reducing herbicide use. This involves adjusting the herbicide doses applied to achieve both a reduction in the number of treatments as well as an increase in the number of weeds controlled by the treatments. In this context, this research provides useful information to avoid or slow down the selection of glyphosate resistance in Lolium spp. by establishing a threshold for identifying future shifts of susceptibility.

4. Materials and Methods
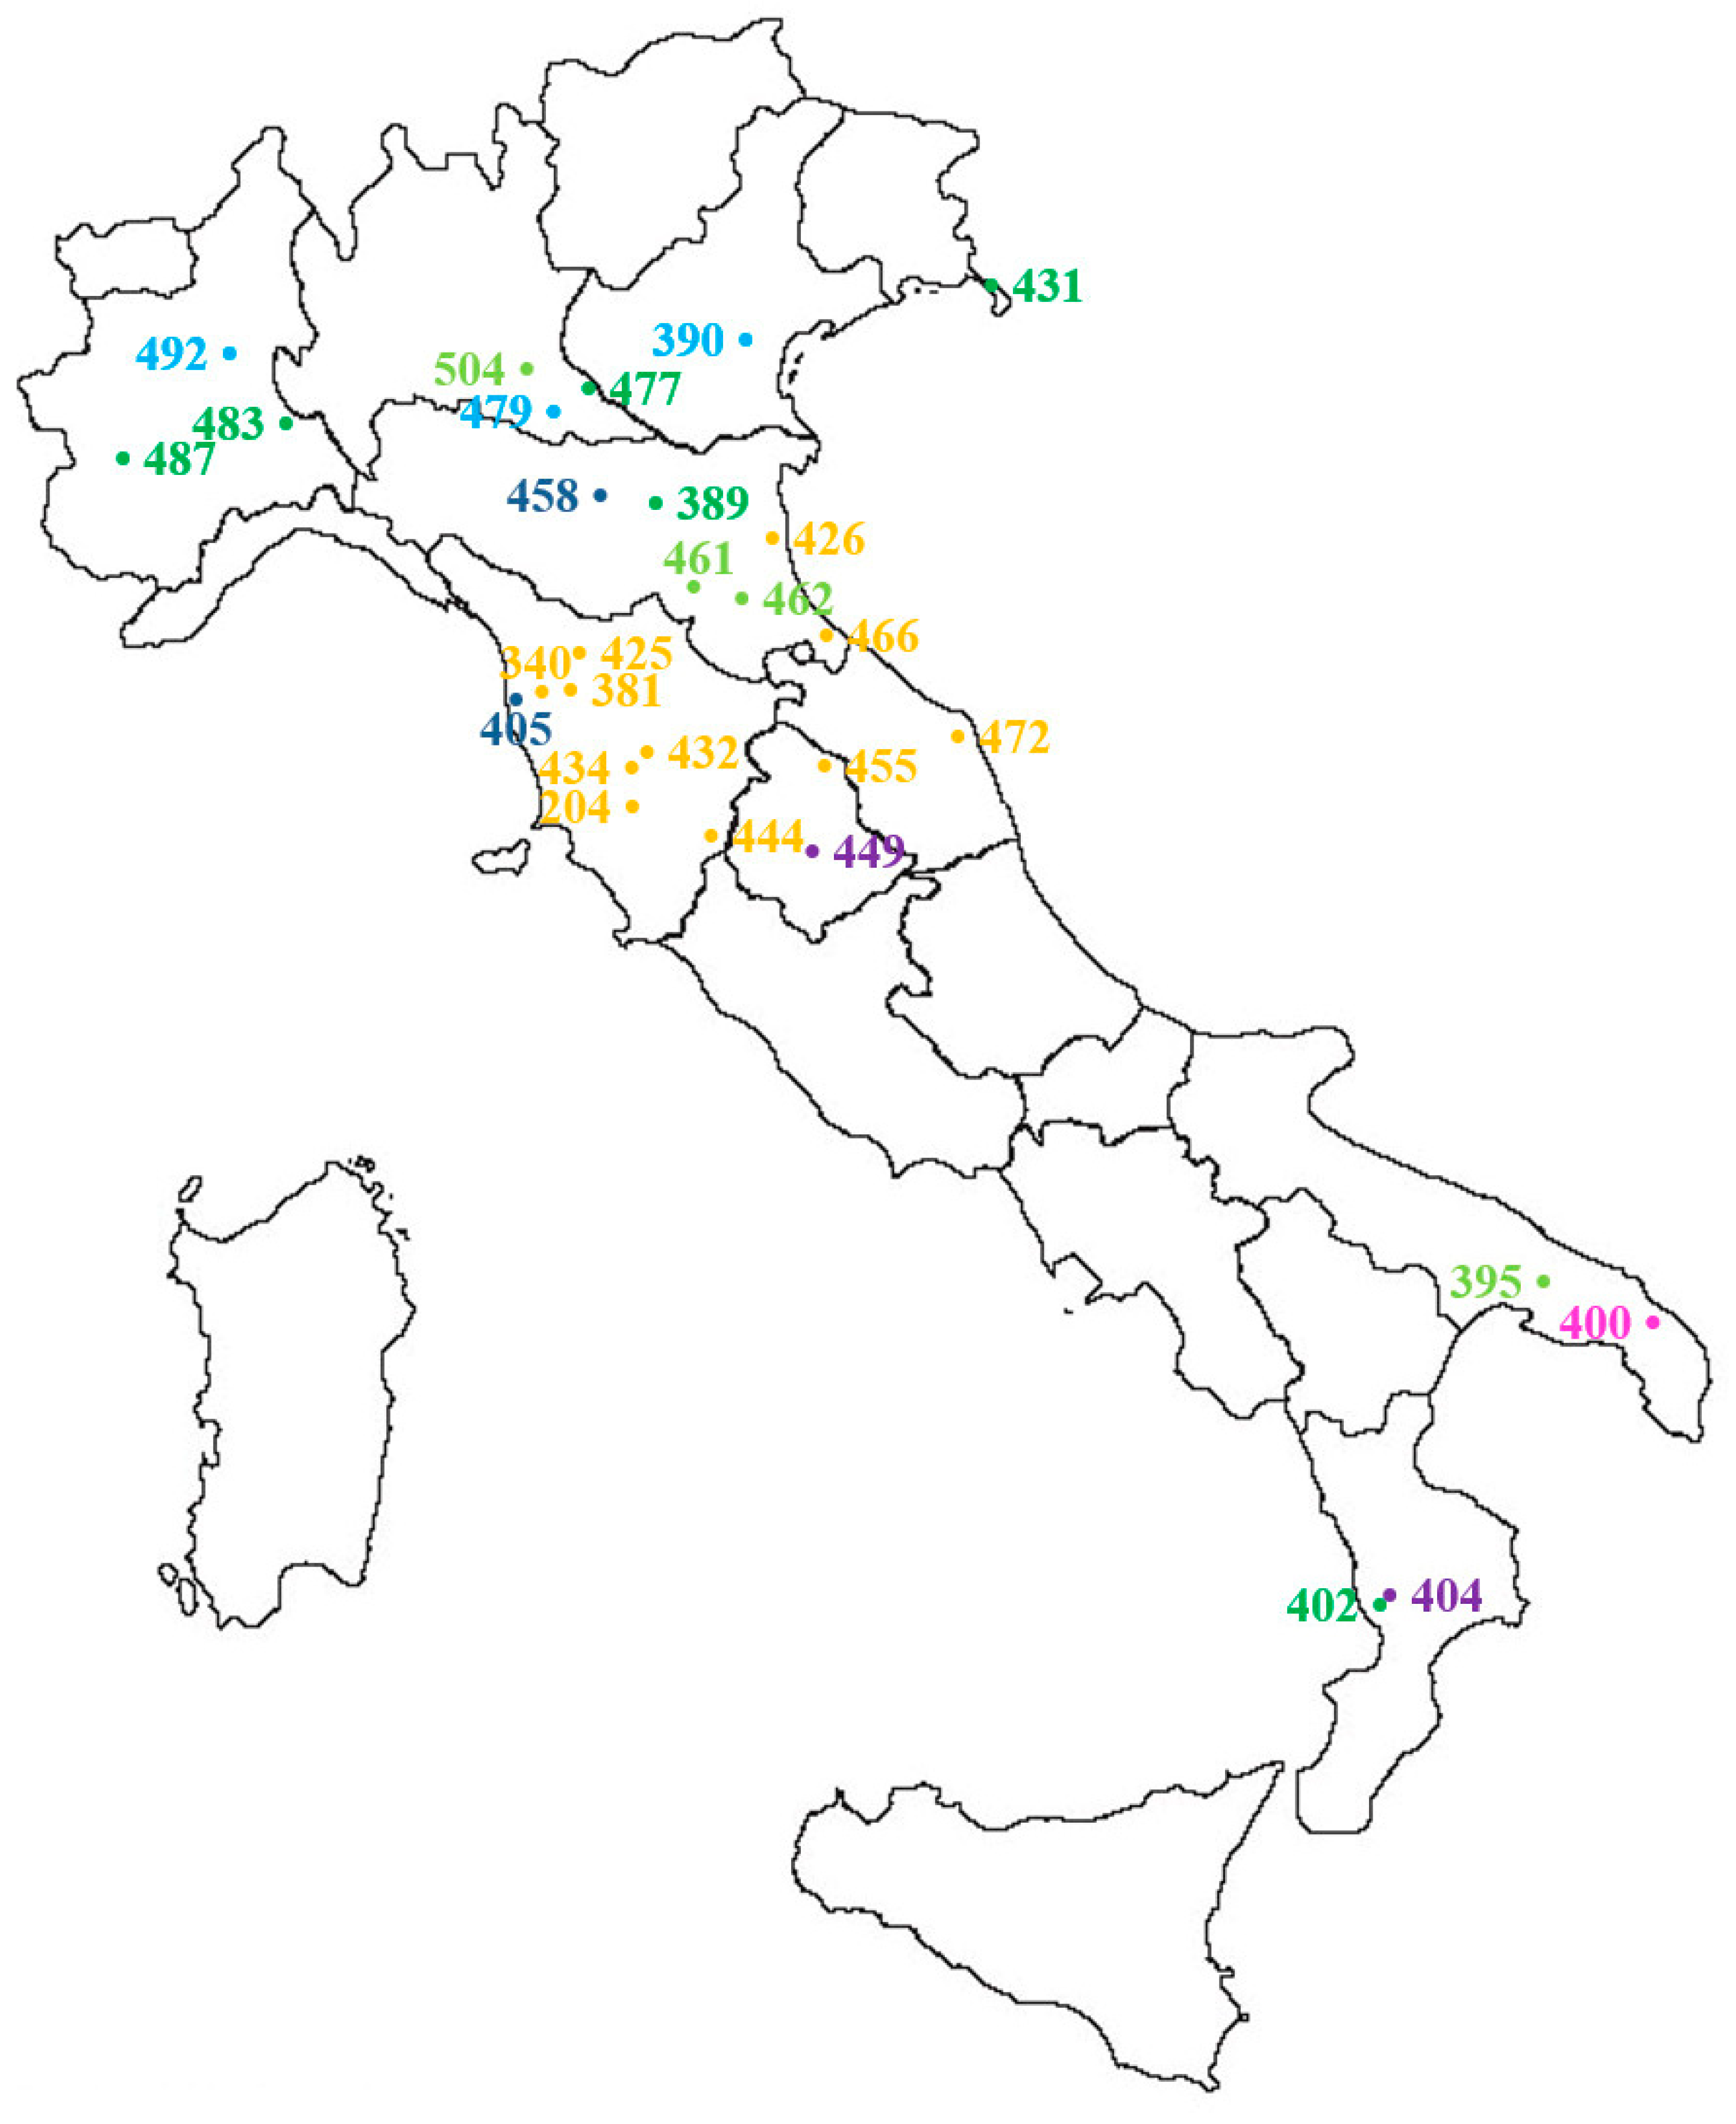
4.1. Plant Material

Seeds of Lolium spp. were collected in agricultural and non-agricultural sites including field margins, organic farms (winter cereals), conventional farms (winter cereals, sunflower and perennial crops) and roadsides (Table 1). When available, details of historical herbicide use on the sampled fields were recorded. Sampling sites covered all major Italian agricultural areas and were chosen according to the absence or moderate application of glyphosate during the last decade. Areas where glyphosate-resistant Lolium spp. had been already reported were excluded [21]. Preference was given to regions where Lolium spp. are widespread and potentially cause severe economic losses. In each site, seeds were randomly collected from at least 30 plants spatially distributed in a sampling area of about 400 m2. Although morphological traits showed a high variability among and within populations, all of them were classified as L. rigidum or L. multiflorum or intermediates between the two species (LOLSS) (Table 1). The standard susceptible population S-204L, collected more than 15 years ago and reproduced in the greenhouse of the Institute for Sustainable Plant Protection (IPSP)- CNR (45°21′ N, 11°58′ E) was also tested.
After ripening, seeds were kept in paper bags and then stored in a cool chamber at 4 °C until use.

4.2. Dose-Response Experiments

4.2.1. Spring Dose-Response Experiment

Twenty populations were included in the spring experiment (Table 1a), twelve putative susceptible populations, six known resistant and two “shifting” populations [19,31]. To break dormancy, seeds were vernalized at 4 °C in Petri dishes on wet filter paper, in darkness for three days. They were then placed in transparent plastic dishes on 0.6% (wt/V) agar medium and placed in a germination cabinet at the following conditions: temperature (day/night) 25/15 °C, 12 h photoperiod with neon tubes providing a Photosynthetic Photon Flux Density (PPFD) of 15–30 μmol m−2 s−1. Nine germinated seedlings at similar growth stage were transplanted into pots (15 × 15 × 20 cm) filled with a standard potting mix (60% silty loam soil, 15% sand, 15% perlite and 10% peat). To better mimic field conditions, pots were kept outside in a semi-controlled environment, and the soil water content was maintained at or near field capacity. Temperature ranged day/night from 18.8 °C to 7.9 °C. The experimental layout was a completely randomized design of three replicates per dose (a total of 27 plants per dose). Eleven doses (geometrically distributed) of glyphosate (MON 79351) 480 g a.e. L−1 were considered: 45, 90, 135, 180, 270, 360, 450, 540, 720, 1080 and 1440 g a.e. ha−1. An untreated control was included for each population. Herbicide was sprayed when plants reached the stage BBCH 21 using a precision bench sprayer according to the following conditions: spray volume 200 L ha−1, pressure 215 kPa, speed 0.75 m s−1 using TeeJet nozzles TP11001-VH. Plant survival and fresh weight were recorded four weeks after the treatment.

4.2.2. Autumn Dose-Response Experiment

Thirty populations sampled as described in Section 4.1 in different Italian agricultural environments (Figure 5) were included in the autumn experiment (Table 1, a in bold and b). All populations were putatively susceptible to glyphosate in order to calculate the threshold value of the sensitivity analysis. To compare the data of the two experiments, 12 susceptible populations (in bold in Table 1a) selected for the spring experiment were also included in the autumn experiment. Seeds preparation, seedlings transplanting and growth conditions, as well as treatment conditions, were as described in Section 4.2.1. Temperature ranged day/night from 20.3 °C to 11.2 °C. Plant survival and fresh weight were recorded four weeks after treatment.

4.3. Statistical Analyses

The mean survival and fresh weight per dose were expressed as a percentage of the untreated control. The ED50, GR50, ED90, GR90 and relative standard errors for the mean percentage of plant survival and fresh weight were calculated by non-linear regression analysis performed using the macro BIOASSAY® developed by Onofri (2005) [37] and running in Windows Excel®. The macro is based on a log-logistic equation to fit the data: Y = C + {(D − C)/[1 + (x/I50)b]} where Y is the fresh weight or survival, C and D are the lower and upper asymptotes at higher and zero doses, respectively, I50 (or I90) is the herbicide dose resulting in a 50% (or 90%) reduction in plant biomass or survival, i.e., ED50 and GR50, respectively (or ED90 and GR90, respectively), b is the slope. The procedure estimates the standard error of the parameters and performs the Box-Cox power transformation family. For biological reasons and to improve the estimates of other parameters, the upper and lower asymptotes of survival data were forced to 100 and zero, respectively, whereas no parameters were constraints considering fresh weight data. Data of each population were first analyzed as a single curve to estimate the parameters and then all curves were regressed together. The data of the two experiments were analyzed separately. No parameters were fixed in the first analyses, and this complex model was then compared with progressively simplified models having common parameters among curves. The lack-of-fit F-test was performed at each step, and the simplification stopped when a significant lack of fit occurred.
The Box and Whisker plot analysis was used to identify possible outliers and extreme values described as the values greater, or lower, than 1.5 and 3 times the value of the Box, respectively [38]. The analysis was repeated excluding the outlier values at each step until no outliers were detected.
In order to determine if the data of the two experiments could be compared, an ad hoc lack-of-fit F-test was applied to the data of each population included in both experiments by comparing data singularly.
R software 3.2.5 and, in particular, the package NbClust [39] was applied to cluster ED50 and ED90 data. The package compares 30 different clustering methods and chooses as best the partition proposed by the majority of the methods.

4.4. Sensitivity Line Calculation

The mean values of EDs and GRs of the two experiments were compared using a paired t-test at p < 0.05 (excluding populations with extreme or outlier values in the Box and Whisker analyses).
The threshold value of the sensitivity analysis (sensitivity line) was calculated as the mean of the ED90 values with a slight modification compared to the method used by Paterson et al. [26] across biologically relevant populations and experiments. A population can be considered as shifting if the difference between the sensitivity line and population is greater than 2x and resistant if the difference between the sensitivity line and population is greater than 3x. To illustrate the variability of the response of populations to glyphosate, the ED50/90 variation among populations and the S.I. were calculated as the ratio between ED50 and ED90 of each population and the ED90 of the most tolerant and most sensitive populations, respectively.

Author Contributions

The authors contributed equally to the research, in particular: conceptualization, A.C., M.S. and S.P.; methodology, A.C., M.S. and S.P.; formal analysis, S.P. and A.C.; investigation, S.P. and A.C.; data curation, S.P. and A.C.; writing—original draft preparation, S.P. and A.C.; writing—review and editing, S.P., M.S. and A.C.; supervision, M.S.; project administration, M.S.; funding acquisition, M.S. All authors have read and agreed to the published version of the manuscript.

Funding

The research was jointly funded by the National Research Council of Italy (CNR) and Monsanto International Srl.

Acknowledgments

The authors are grateful to Alison Garside for revising the English text, Ivo Brants (Monsanto Europe S.A.) for helpful discussions and Erica Manesso for the advice regarding statistical analyses.

Conflicts of Interest

The authors declare no conflict of interest. The funders had no role in the design of the study; in the collection, analyses, or interpretation of data; in the writing of the manuscript, or in the decision to publish the results.

References

  1. Preston, C.; Wakelin, A.M.; Dolman, F.C.; Bostamam, Y.; Boutsalis, P. A Decade of Glyphosate-Resistant Lolium around the world: Mechanisms, genes, fitness, and agronomic management. Weed Sci. 2009, 57, 435–441. [Google Scholar] [CrossRef]
  2. Heap, I.; Duke, S.O. Overview of glyphosate-resistant weeds worldwide. Pest Manag. Sci. 2018, 74, 1040–1049. [Google Scholar] [CrossRef]
  3. Fernández-Moreno, P.T.; Bastida, F.; De Prado, R. Evidence, mechanism and alternative chemical seedbank-level control of glyphosate resistance of a rigid ryegrass (Lolium rigidum) biotype from Southern Spain. Front. Plant Sci. 2017, 8, 1–16. [Google Scholar] [CrossRef] [Green Version]
  4. Heap, I.M. The International Survey of Herbicide Resistant Weeds. Available online: http://weedscience.org/ (accessed on 24 January 2020).
  5. Barroso, A.A.; de S Costa, M.G.; Neto, N.J.; dos Santos, J.I.; Balbuena, T.S.; Carbonari, C.A.; Alves, P.L. Protein identification before and after glyphosate exposure in Lolium multiflorum genotypes. Pest Manag. Sci. 2018, 74, 1125–1133. [Google Scholar] [CrossRef]
  6. Duke, S.O. Why have no new herbicide modes of action appeared in recent years? Pest Manag. Sci. 2012, 68, 505–512. [Google Scholar] [CrossRef] [Green Version]
  7. Duke, S.O. The history and current status of glyphosate. Pest Manag. Sci. 2018, 74, 1027–1034. [Google Scholar] [CrossRef]
  8. Duke, S.; Powles, S. Glyphosate: A once-in-a-century herbicide. Pest Manag. Sci. 2008, 64, 319–325. [Google Scholar] [CrossRef]
  9. Mallory-Smith, C.; Retzinger, J. Revised classification of herbicides by site of action for weed resistance. Weed Technol. 2003, 17, 605–619. [Google Scholar] [CrossRef]
  10. Solomon, K.R. Estimated exposure to glyphosate in humans via environmental, occupational, and dietary pathways: An updated review of the scientific literature. Pest Manag. Sci. 2019. [Google Scholar] [CrossRef] [PubMed]
  11. Schönbrunn, E.; Eschenburg, S.; Shuttleworth, W.A.; Schloss, J.V.; Amrhein, N.; Evans, J.N.; Kabsch, W. Interaction of the herbicide glyphosate with its target enzyme 5-enolpyruvylshikimate 3-phosphate synthase in atomic detail. PNAS 2001, 98, 1376–1380. [Google Scholar] [CrossRef] [PubMed] [Green Version]
  12. Baylis, A.D. Why glyphosate is a global herbicide: Strengths, weaknesses and prospects. Pest Manag. Sci. 2000, 56, 299–308. [Google Scholar] [CrossRef]
  13. Neve, P.; Diggle, A.J.; Smith, F.P.; Powles, S.B. Simulating evolution of glyphosate resistance in Lolium rigidum I: Population biology of a rare resistance trait. Weed Res. 2003, 43, 404–417. [Google Scholar] [CrossRef]
  14. Powles, S.B. Evolved glyphosate-resistant weeds around the world: Lessons to be learnt. Pest Manag. Sci. 2008, 64, 360–365. [Google Scholar] [CrossRef]
  15. Owen, M.D.K. Weed species shifts in glyphosate-resistant crops. Pest Manag. Sci. 2008, 64, 377–387. [Google Scholar] [CrossRef]
  16. Gonzalez-Torralva, F.; Gil-Humanes, J.; Barro, F.; Dominguez-Valenzuela, J.; De Prado, R. First evidence for a target site mutation in the EPSPS2 gene in glyphosate-resistant Sumatran fleabane from citrus orchards. Agron. Sustain. Dev. 2014, 34, 553–560. [Google Scholar] [CrossRef] [Green Version]
  17. Urbano, J.M.; Borrego, A.; Torres, V.; Leon, J.M.; Jimenez, C.; Dinelli, G.; Barnes, J. Glyphosate-resistant Hairy Fleabane (Conyza bonariensis) in Spain. Weed Technol. 2007, 21, 396–401. [Google Scholar] [CrossRef]
  18. Powles, S.B.; Lorraine-colwill, D.F.; Dellow, J.J.; Preston, C. Evolved resistance to glyphosate in rigid ryegrass (Lolium rigidum) in Australia. Weed Sci. 1998, 46, 604–607. [Google Scholar] [CrossRef]
  19. Collavo, A.; Sattin, M. Resistance to glyphosate in Lolium rigidum selected in Italian perennial crops: Bioevaluation, management and molecular bases of target-site resistance. Weed Res. 2012, 52, 16–24. [Google Scholar] [CrossRef]
  20. Busi, R.; Powles, S.B. Evolution of glyphosate resistance in a Lolium rigidum population by glyphosate selection at sublethal doses. Heredity 2009, 103, 318–325. [Google Scholar] [CrossRef]
  21. GIRE—Gruppo Italiano Resistenza Erbicidi. Available online: www.resistenzaerbicidi.it (accessed on 24 January 2020).
  22. Panozzo, S.; Scarabel, L.; Collavo, A.; Sattin, M. Protocols for robust herbicide resistance testing in different weed species. J. Vis. Exp. 2015, 101, 1–10. [Google Scholar] [CrossRef] [Green Version]
  23. Vidotto, F.; Tesio, F.; Tabacchi, M.; Ferrero, A. Herbicide sensitivity of Echinochloa spp. accessions in Italian rice fields. Crop Prot. 2007, 26, 285–293. [Google Scholar] [CrossRef]
  24. Loddo, D.; Kudsk, P.; Costa, B.; Dalla Valle, N.; Sattin, M. Sensitivity analysis of Alisma plantago-aquatica L., Cyperus difformis L. and Schoenoplectus mucronatus (L.) Palla to Penoxsulam. Agronomy 2018, 8, 220. [Google Scholar] [CrossRef] [Green Version]
  25. Davies, L.R.; Hull, R.; Moss, S.; Neve, P. The first cases of evolving glyphosate resistance in UK poverty brome (Bromus sterilis) populations. Weed Sci. 2018, 67, 41–47. [Google Scholar] [CrossRef] [Green Version]
  26. Paterson, E.A.; Shenton, Z.L.; Straszewski, A.E. Establishment of the baseline sensitivity and monitoring response of Papaver rhoeas populations to florasulam. Pest Manag. Sci. 2002, 58, 964–966. [Google Scholar] [CrossRef] [PubMed]
  27. Russell, P.E. Sensitivity Baseline in Fungicide Resistance Research And Management; Crop Life International: Brussels, Belgium, 2002; pp. 1–56. [Google Scholar]
  28. Russell, P. Resistance management and the registration of pesticide products in Europe. Pestic. Outlook 2001, 12, 56–59. [Google Scholar] [CrossRef]
  29. Barroso, J.; Loureiro, I.; Escorial, M.C.; Chueca, M.C. The response of Bromus diandrus and Lolium rigidum to dalapon and glyphosate I: Baseline sensitivity. Weed Res. 2010, 50, 312–319. [Google Scholar]
  30. Moss, S.R. Baseline sensitivity to herbicides: A guideline to methodologies. In Proceedings of the British Crop Protection Conference—Weeds, Brighton, UK, 2001; pp. 769–774. [Google Scholar]
  31. Collavo, A.; Sattin, M. First glyphosate-resistant Lolium spp. biotypes found in a European annual arable cropping system also affected by ACCase and ALS resistance. Weed Res. 2014, 54, 325–334. [Google Scholar] [CrossRef]
  32. Dayan, F.E. Current status and future prospects in herbicide discovery. Plants 2019, 8, 341. [Google Scholar] [CrossRef] [Green Version]
  33. Sammons, R.D.; Gaines, T.A. Glyphosate resistance: State of knowledge. Pest Manag. Sci. 2014, 70, 1367–1377. [Google Scholar] [CrossRef] [Green Version]
  34. Pedersen, B.P.; Neve, P.; Andreasen, C.; Powles, S.B. Ecological fitness of a glyphosate-resistant Lolium rigidum population: Growth and seed production along a competition gradient. Basic Appl. Ecol. 2007, 8, 258–268. [Google Scholar] [CrossRef]
  35. Hess, M.; Barralis, G.; Bleiholder, H.; Buhr, L.; Eggers, T.H.; Hack, H.; Stauss, R. Use of the extended BBCH scale-general for the descriptions of the growth stages of mono and dicotyledonous weed species. Weed Res. 1997, 37, 433–441. [Google Scholar] [CrossRef]
  36. Beckie, H.J.; Ashworth, M.B.; Flower, K.C. Herbicide resistance management: Recent developments and trends. Plants 2019, 8, 161. [Google Scholar] [CrossRef] [PubMed] [Green Version]
  37. Onofri, A. Bioassay97: A new Excel VBA macro to perform statistical analyses on herbicide dose-response data. Riv. Ital. di Agrometeorol. 2005, 3, 40–45. [Google Scholar]
  38. Tukey, J.W. Exploratory data analysis. In The Future of Data Analysis; Addison-Wesley: New York, NY, USA, 1977; p. 688. [Google Scholar]
  39. Charrad, M.; Ghazzali, N.; Boiteau, V.; Niknafs, A. NbClust: An R package for determining the relevant number of clusters in a data set. J. Stat. Softw. 2014, 61, 1–36. [Google Scholar] [CrossRef] [Green Version]
Figure 1. Box and Whisker plots illustrating the range of plant control (ED50) for the twenty Lolium spp. populations included in the spring experiment: (A) all populations were included; (B) extreme values of Box Plot A were excluded; (C) extreme and outlier values of Box Plot B were excluded; (D) extreme and outlier values of Box Plot C were excluded. The central point is the median, the box represents the 25–75 percentiles and bars the non-outlier range, ○ and * represent outliers and extreme values, respectively. Population codes excluded during the analysis are reported.
Plants 09 00165 g001
Figure 2. Response of thirty Lolium spp. populations included in the autumn experiment estimated by (a) the dose controlling 50% of plants (ED50) and (b) 90% of plants (ED90). Bars indicate standard errors (SE). Dashed horizontal lines represent the mean values of ED50 and ED90 in graphs (a) and (b), respectively. Different colours represent the subdivision of the populations obtained with the cluster analysis: (a) two clusters, (b) four clusters.
Plants 09 00165 g002
Figure 3. ED90 of different Lolium spp. populations: ♦ S populations tested in the autumn dose-response experiment, ▲ shifting populations tested in the spring dose-response experiment, ■ resistant populations tested in the spring dose-response experiment and/or discussed in [19] and [31]. Continuous line at 317 g a.e. ha−1 represents the sensitivity line calculated in this research, dashed lines represent 2x and 3x the sensitivity line value.
Plants 09 00165 g003
Figure 4. Variations of the ED50/ED90 ratio among populations.
Plants 09 00165 g004
Figure 5. Distribution and origin of Lolium spp. populations included in the autumn dose-response experiment (see also Table 1b and populations in bold in Table 1a): yellow = wheat, dark blue = Lucerne, light blue = field margin, dark green = meadow, light green = roadside, purple = perennial, pink = set aside. For IPSP S check 204L, the origin of the original population is reported (Civitella Paganico, GR). Population 412 is not included because it comes from a commercial seed stock.
Plants 09 00165 g005
Table 1. Details of the populations tested in the spring (a) and autumn (a in bold and b) dose-response experiments: species (LOL = Lolium, RI = rigidum, MU = multiflorum, SS = multi-species), sampling year, population code (progressive number, which, together with the sampling year, uniquely identifies a population), geographical origin and crop or collection site, where available. S = susceptible and R = resistant (i.e., plant survival >20% at the field dose); L = population reproduced in Legnaro greenhouse.
SpeciesPopulation CodeOrigin
(Municipality)
Crop or Collection SiteNotes
(a)
LOLRI07328Santo Stefano BelbovineyardPartially R [19]
LOLRI08204LLegnarowheatS check used by IPSP-CNR
LOLSS08259CortonawheatPartially R [31]
LOLSS08340Collesalvettiwheat
LOLSS08343PomarancewheatR pop. [31]
LOLSS10381Pontederawheat
LOLSS10384CascinawheatR pop. [31]
LOLSS11384LCascina Reproduced from glyphosate-resistant plants of pop. 10–384
LOLSS10389Castenasomeadow
LOLMU11390Legnarofield margin
LOLSS11392Palo del Colleolive groveR pop. (unpublished data)
LOLRI11395Acquaviva delle Fontiroadside
LOLRI11400Torchiaroloset aside
LOLSS11401Lamezia Termeolive groveR pop. (unpublished data)
LOLRI11402Lamezia Termemeadow
LOLSS11403CascinasunflowerR pop. [31]
LOLRI11404Lamezia Termeolive grove
LOLSS11405Livornolucerne
LOLMU11412 Commercial turf seed
LOLSS11425Cascinawheat
(b)
LOLMU12426Ravennawheat
LOLSS12431Duino Aurisinameadow
LOLSS12432Sienawheat
LOLSS12434Sovicillewheat
LOLSS12444San Casciano dei Bagniwheat
LOLMU12449Marscianovineyard
LOLSS12455Gubbiowheat
LOLMU12458Montecchio Emilialucerne
LOLSS12461Brisighellaroadside
LOLMU12462Forlìroadside
LOLMU12466Corianowheat
LOLSS12472Osimowheat
LOLSS12477Pozzolengomeadow
LOLSS12479Cremonafield margin (maize)
LOLMU12483Alessandriameadow
LOLSS12487Saluzzomeadow
LOLSS12492Ciglianofield margin
LOLSS12504Pontoglioroadside

