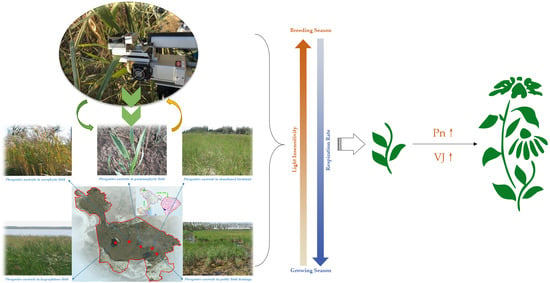
Comparison of the Photosynthetic Capacity of Phragmites australis in Five Habitats in Saline‒Alkaline Wetlands


Abstract
1. Introduction
2. Results
2.1. Characteristics of Light Response Curve
2.1.1. Characteristics of Light Response Curve in the Growing Season
2.1.2. Characteristics of Light Response Curve in the Breeding Season
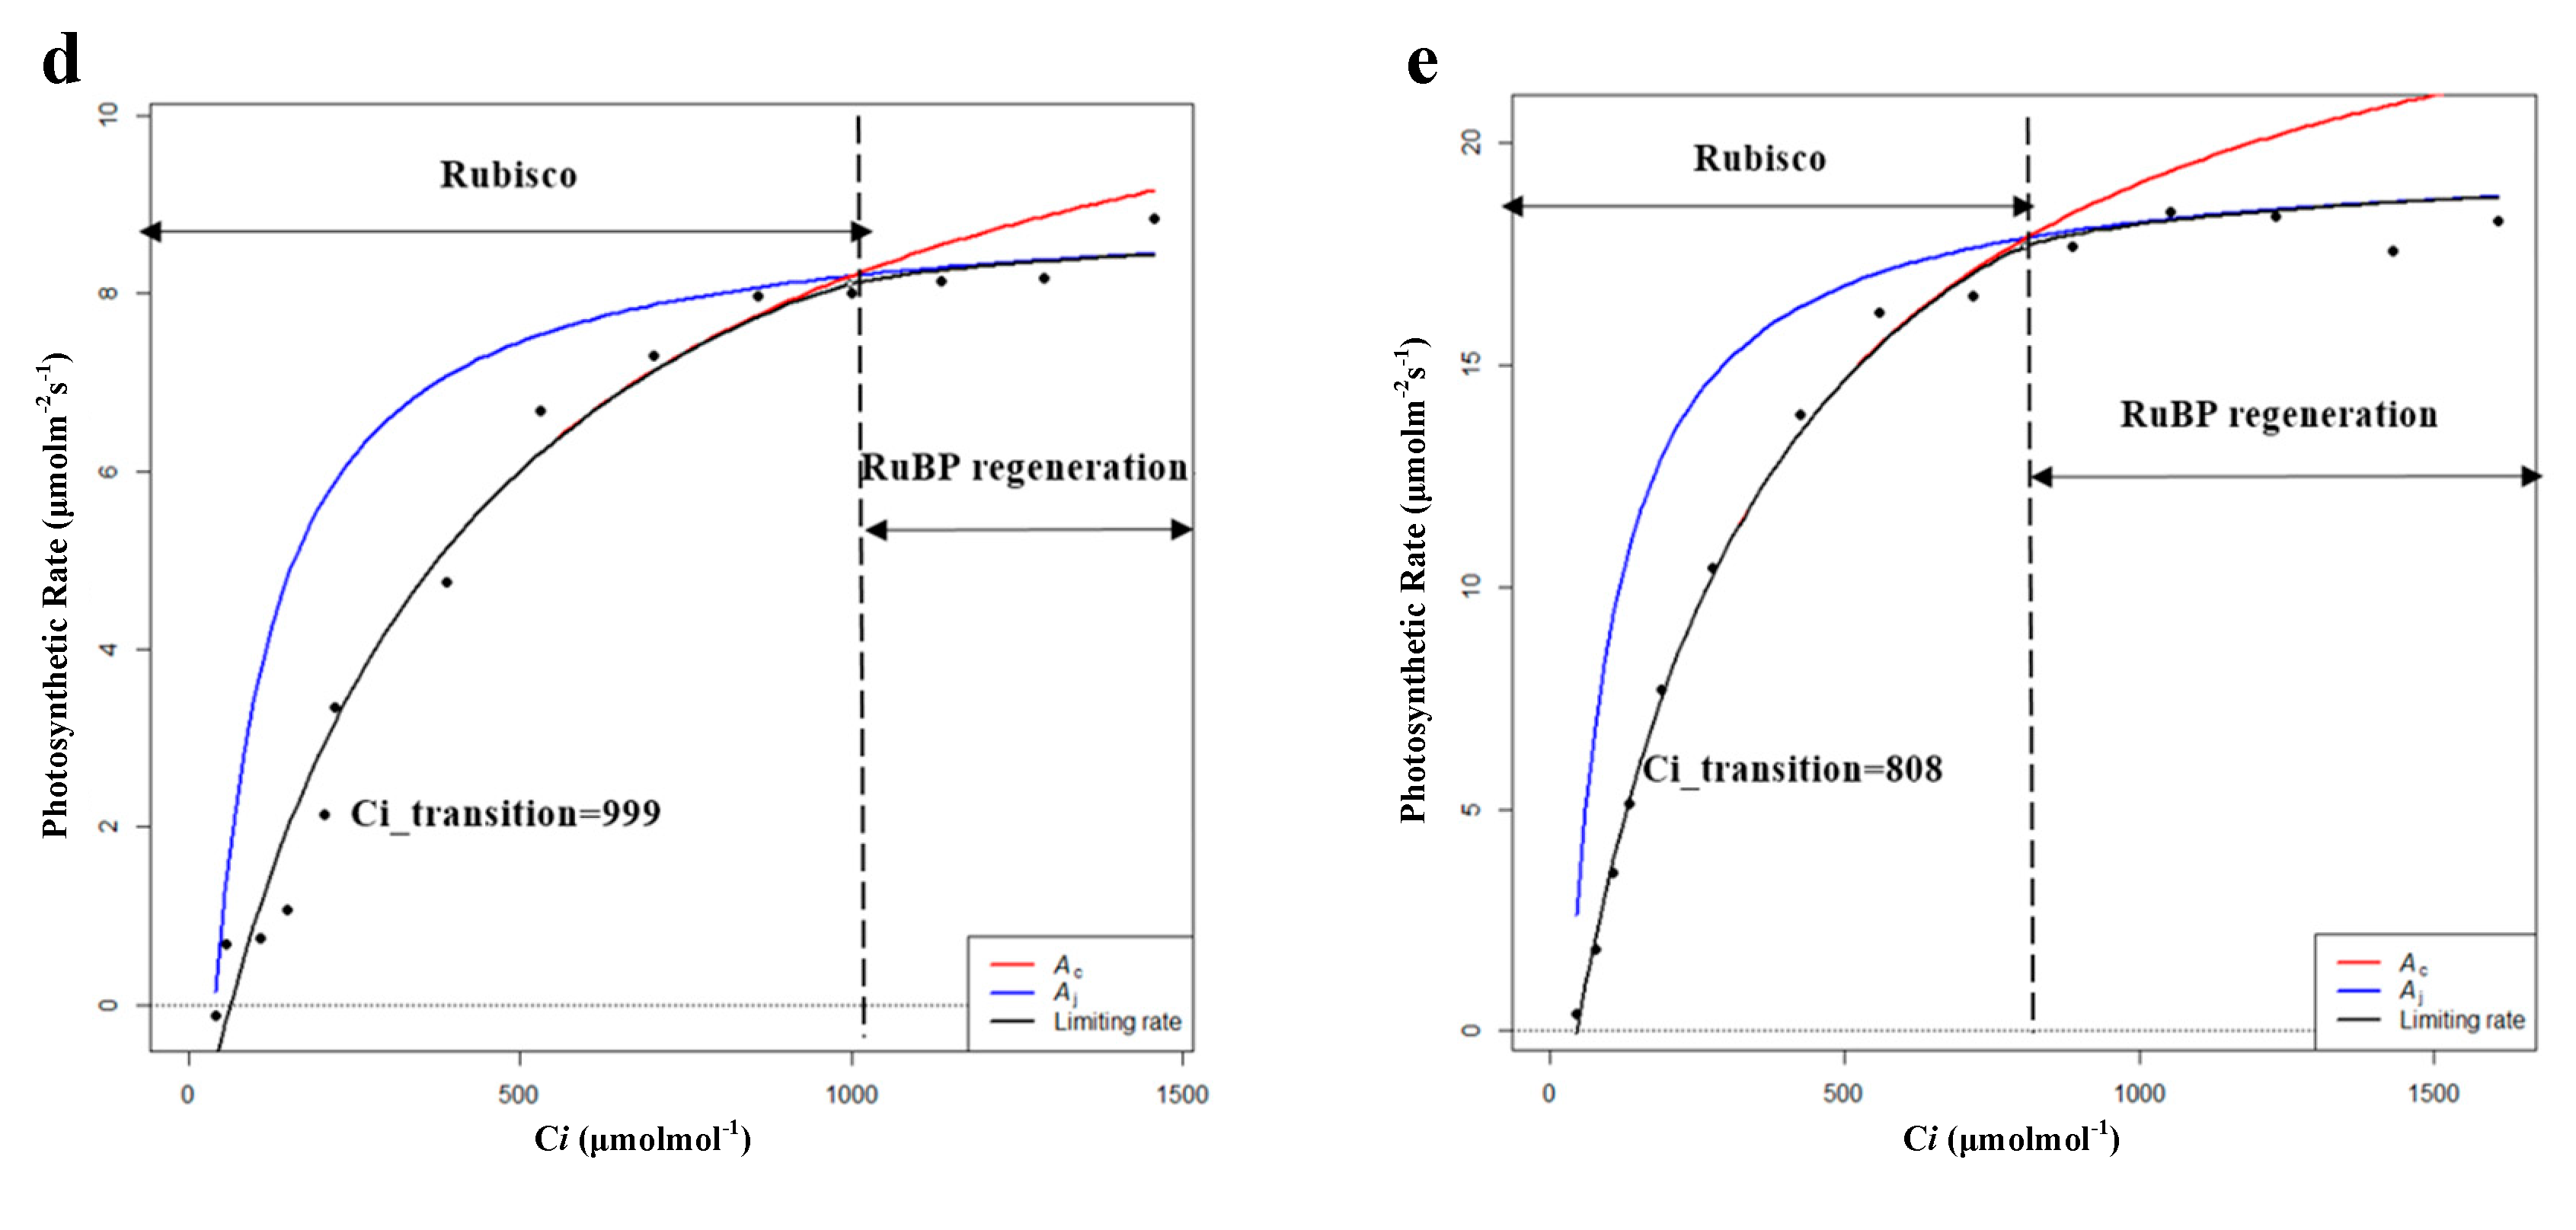
2.2. Characteristics of CO2 Response Curve
2.2.1. Characteristics of CO2 Response Curve in the Growing Season
2.2.2. Characteristics of CO2 Response Curve in the Breeding Season
3. Discussion
3.1. Photosynthetic Characteristics of P. australis in the Growing Season
3.2. Photosynthetic Characteristics of P. australis in the Breeding Season
4. Materials and Methods
4.1. Study Area
4.2. Experimental Design
4.2.1. Biomass Collection
4.2.2. Measurement of Light Response Curve
4.2.3. Measurement of CO2 Response Curve
4.3. Data Calculation and Analysis
4.3.1. Fitting Light Response Curve
4.3.2. Fitting the CO2 Response Curve
4.3.3. Statistical Analysis
5. Conclusions
Author Contributions
Funding
Acknowledgments
Conflicts of Interest
References
- Gabler, C.A.; Osland, M.J.; Grace, J.B.; Stagg, C.L.; Day, R.H.; Hartley, S.B.; Enwright, N.M.; From, A.S.; McCoy, M.L.; McLeod, J.L. Macroclimatic change expected to transform coastal wetland ecosystems this century. Nat. Clim. Chang. 2017, 7, 142–147. [Google Scholar] [CrossRef]
- Chen, Y.C.; Shih, C.H. Sustainable Management of Coastal Wetlands in Taiwan: A Review for Invasion, Conservation, and Removal of Mangroves. Sustainability 2019, 11, 4305. [Google Scholar] [CrossRef]
- Willson, K.G.; Perantoni, A.N.; Berry, Z.C.; Eicholtz, M.I.; Tamukong, Y.B.; Yarwood, S.A.; Baldwin, A.H. Title: Influences of reduced iron and magnesium on growth and photosynthetic performance of Phragmites australis subsp americanus (North American common reed). Aquat. Bot. 2017, 137, 30–38. [Google Scholar] [CrossRef]
- Zhou, J.; Xiang, J.; Wang, L.; Zhong, G.; Zhu, G.; Liu, C.; Huang, M.; Feng, W.; Li, Q.; Xue, D.; et al. The Impacts of Groundwater Chemistry on Wetland Vegetation Distribution in the Northern Qinghai–Tibet Plateau. Sustainability 2019, 11, 5022. [Google Scholar] [CrossRef]
- Yin, X.L.; Zhang, J.; Hu, Z.; Xie, H.J.; Guo, W.S.; Wang, Q.S.; Ngo, H.H.; Liang, S.; Lu, S.Y.; Wu, W.Z. Effect of photosynthetically elevated pH on performance of surface flow-constructed wetland planted with Phragmites australis. Environ. Sci. Pollut. Res. 2016, 23, 15524–15531. [Google Scholar] [CrossRef]
- Sun, X.L.; Xu, Y.; Zhang, Q.Q.; Li, X.Z.; Yan, Z.Z. Combined effect of water inundation and heavy metals on the photosynthesis and physiology of Spartina alterniflora. Ecotoxicol. Environ. Saf. 2018, 153, 248–258. [Google Scholar] [CrossRef]
- Thornley, J.H.M. Dynamic model of leaf photosynthesis with acclimation to light and nitrogen. Ann. Bot. 1998, 81, 421–430. [Google Scholar] [CrossRef]
- Fang, L.; Zhang, S.; Zhang, G.; Liu, X.; Xia, X.; Zhang, S.; Xing, W.; Fang, X. Application of Five Light-Response Models in the Photosynthesis of Populus x Euramericana cv. ‘Zhonglin46’ Leaves. Appl. Biochem. Biotechnol. 2015, 176, 86–100. [Google Scholar] [CrossRef]
- Waring, E.F.; Maricle, B.R. Photosynthetic variation and carbon isotope discrimination in invasive wetland grasses in response to flooding. Environ. Exp. Bot. 2012, 77, 77–86. [Google Scholar] [CrossRef]
- Li, S.H.; Ge, Z.M.; Xie, L.N.; Chen, W.; Yuan, L.; Wang, D.Q.; Li, X.Z.; Zhang, L.Q. Ecophysiological response of native and exotic salt marsh vegetation to waterlogging and salinity: Implications for the effects of sea-level rise. Sci. Rep. 2018, 8, 2441. [Google Scholar] [CrossRef]
- Xu, J.T.; Zhang, J.A.; Xie, H.J.; Li, C.; Bao, N.; Zhang, C.L.; Shi, Q.Q. Physiological responses of Phragmites australis to wastewater with different chemical oxygen demands. Ecol. Eng. 2010, 36, 1341–1347. [Google Scholar] [CrossRef]
- Han, J.Q.; Zhou, Y.M.; Li, D.D.; Zhai, G.Q. Effects of Short-Term High-Salt Stresses on Photosynthetic Characteristics, Activities of Protective Enzyme and Copper Uptake of Acorus Calamus in Microcosm Submerged Wetlands. Fresenius Environ. Bull. 2018, 27, 982–988. [Google Scholar]
- Zhang, G.X.; Deng, C.N. Gas exchange and chlorophyll fluorescence of salinity-alkalinity stressed Phragmites australis seedlings. J. Food Agric. Environ. 2012, 10, 880–884. [Google Scholar]
- Zhang, C.; Kellomäki, S.; Zhong, Q.; Wang, K.; Gong, J.; Qiao, Y.; Zhou, X.; Gao, W. Seasonal biomass allocation in a boreal perennial grass (Phalaris arundinacea L.) under elevated temperature and CO2 with varying water regimes. Plant Growth Regul. 2014, 74, 153–164. [Google Scholar] [CrossRef]
- Yu, W.Y.; Ji, R.P.; Jia, Q.Y.; Feng, R.; Wu, J.W.; Zhang, Y.S. Vertical distribution characteristics of photosynthetic parameters for Phragmites australis in Liaohe River Delta wetland, China. J. Freshw. Ecol. 2017, 32, 557–573. [Google Scholar] [CrossRef]
- Li, X.Y.; Li, X.J.; Lin, J.X.; Wen, B.L. Effects of sub-soiling and fertilization on growth restoration of Phragmites australis population in saline marsh of northeast China. Fresenius Environ. Bull. 2017, 26, 1453–1460. [Google Scholar]
- Ye, Z.P. A new model for relationship between irradiance and the rate of photosynthesis in Oryza sativa. Photosynthetica 2007, 45, 637–640. [Google Scholar] [CrossRef]
- Flexas, J.; Bota, J.; Escalona, J.M.; Sampol, B.; Medrano, H. Effects of drought on photosynthesis in grapevines under field conditions: An evaluation of stomatal and mesophyll limitations. Funct. Plant Biol. 2002, 29, 461–471. [Google Scholar] [CrossRef]
- Vona, V.; Rigano, V.D.; Andreoli, C.; Lobosco, O.; Caiazzo, M.; Martello, A.; Carfagna, S.; Salbitani, G.; Rigano, C. Comparative analysis of photosynthetic and respiratory parameters in the psychrophilic unicellular green alga Koliella antarctica, cultured in indoor and outdoor photo-bioreactors. Physiol. Mol. Biol. Plants 2018, 24, 1139–1146. [Google Scholar] [CrossRef]
- Mahmud, K.; Medlyn, B.E.; Duursma, R.A.; Campany, C.; De Kauwe, M.G. Inferring the effects of sink strength on plant carbon balance processes from experimental measurements. Biogeosciences 2018, 15, 4003–4018. [Google Scholar] [CrossRef]
- Tho, B.T.; Lambertini, C.; Eller, F.; Brix, H.; Sorrell, B.K. Ammonium and nitrate are both suitable inorganic nitrogen forms for the highly productive wetland grass Arundo donax, a candidate species for wetland paludiculture. Ecol. Eng. 2017, 105, 379–386. [Google Scholar] [CrossRef]
- Zhang, Z.; Rengel, Z.; Meney, K. Interactive effects of N and P on growth but not on resource allocation of Canna indica in wetland microcosms. Aquat. Bot. 2008, 89, 317–323. [Google Scholar] [CrossRef]
- Holaday, A.S.; Schwilk, D.W.; Waring, E.F.; Guvvala, H.; Griffin, C.M.; Lewis, O.M. Plasticity of nitrogen allocation in the leaves of the invasive wetland grass, Phalaris arundinacea and co-occurring Carex species determines the photosynthetic sensitivity to nitrogen availability. J. Plant Physiol. 2015, 177, 20–29. [Google Scholar] [CrossRef]
- Holmes, G.D.; Hall, N.E.; Gendall, A.R.; Boon, P.I.; James, E.A. Using Transcriptomics to Identify Differential Gene Expression in Response to Salinity among Australian Phragmites australis Clones. Front. Plant Sci. 2016, 7, 432. [Google Scholar] [CrossRef] [PubMed]
- Li, L.; Qiu, S.J.; Chen, Y.P.; Xu, X.L.; Zhao, X.M.; Christie, P.; Xu, M.G. Allocation of photosynthestically-fixed carbon in plant and soil during growth of reed (Phragmites australis) in two saline soils. Plant Soil 2016, 404, 277–291. [Google Scholar] [CrossRef]
- Lessmann, J.M.; Brix, H.; Bauer, V.; Clevering, O.A.; Comin, F.A. Effect of climatic gradients on the photosynthetic responses of four Phragmites australis populations. Aquat. Bot. 2001, 69, 109–126. [Google Scholar] [CrossRef]
- Shoukat, E.; Abideen, Z.; Ahmed, M.Z.; Gulzar, S.; Nielsen, B.L. Changes in growth and photosynthesis linked with intensity and duration of salinity in Phragmites karka. Environ. Exp. Bot. 2019, 162, 504–514. [Google Scholar] [CrossRef]
- Guo, X.; Yu, T.; Li, M.; Guo, W. The effects of salt and rainfall pattern on morphological and photosynthetic characteristics of Phragmites australis (Poaceae). J. Torrey Bot. Soc. 2018, 145, 212–224. [Google Scholar] [CrossRef]
- Abideen, Z.; Qasim, M.; Hussain, T.; Rasheed, A.; Gul, B.; Koyro, H.; Ansari, R.; Khan, M.A. Salinity improves growth, photosynthesis and bioenergy characteristics of Phragmites karka. Crop Pasture Sci. 2018, 69, 944–953. [Google Scholar] [CrossRef]
- Gu, L.; Pallardy, S.G.; Tu, K.; Law, B.E.; Wullschleger, S.D. Reliable estimation of biochemical parameters from C-3 leaf photosynthesis-intercellular carbon dioxide response curves. Plant Cell Environ. 2010, 33, 1852–1874. [Google Scholar] [CrossRef]
- Sharkey, T.D.; Bernacchi, C.J.; Farquhar, G.D.; Singsaas, E.L. Fitting photosynthetic carbon dioxide response curves for C-3 leaves. Plant Cell Environ. 2007, 30, 1035–1040. [Google Scholar] [CrossRef] [PubMed]
- Waring, E.F.; Holaday, A.S. High growth temperatures and high soil nitrogen do not alter differences in CO2 assimilation between invasive Phalaris arundinacea (reed canarygrass) and Carex stricta (tussock sedge). Am. J. Bot. 2017, 104, 999–1007. [Google Scholar] [CrossRef] [PubMed]
- Nackley, L.L.; Kim, S.H. A salt on the bioenergy and biological invasions debate: Salinity tolerance of the invasive biomass feedstock Arundo donax. Glob. Chang. Biol. Bioenergy 2015, 7, 752–762. [Google Scholar] [CrossRef]
- Guo, W.Y.; Lambertini, C.; Guo, X.; Li, X.Z.; Eller, F.; Brix, H. Phenotypic traits of the Mediterranean Phragmites australis M1 lineage: Differences between the native and introduced ranges. Biol. Invasions 2016, 18, 2551–2561. [Google Scholar] [CrossRef]
- Zhu, X.Y.; Wang, S.M.; Zhang, C.L. Composition and characteristic differences in photosynthetic membranes of two ecotypes of reed (Phragmites communis L.) from different habitats. Photosynthetica 2003, 41, 97–104. [Google Scholar] [CrossRef]
- Zhu, X.Y.; Chen, G.C.; Zhang, C.L. Photosynthetic electron transport, photophosphorylation, and antioxidants in two ecotypes of reed (Phragmites communis Trin.) from different habitats. Photosynthetica 2001, 39, 183–189. [Google Scholar] [CrossRef]
- Nada, R.M.; Khedr, A.H.A.; Serag, M.S.; El-Nagar, N.A. Growth, photosynthesis and stress-inducible genes of Phragmites australis (Cav.) Trin. ex Steudel from different habitats. Aquat. Bot. 2015, 124, 54–62. [Google Scholar] [CrossRef]
- Li, X.Y.; Wen, B.L.; Yang, F.; Hartley, A.; Li, X.J. Effects of alternate flooding-drought conditions on degenerated Phragmites australis salt marsh in Northeast China. Restor. Ecol. 2017, 25, 810–819. [Google Scholar] [CrossRef]
- Wen, B.L.; Li, X.Y.; Yang, F.; Lu, X.R.; Li, X.J.; Yang, F.Y. Growth and physiology responses of Phragmites australis to combined drought-flooding condition in inland saline-alkaline marsh, Northeast China. Ecol. Eng. 2017, 108, 234–239. [Google Scholar] [CrossRef]
- Mashaly, I.A.; El-Habashy, I.E.; El-Halawany, E.F.; Omar, G. Habitat and plant communities in the Nile Delta of Egypt. II. Irrigation and drainage canal bank habitat. Pak. J. Biol. Sci. 2009, 12, 885–895. [Google Scholar] [CrossRef] [PubMed]
- Marcaccio, J.V.; Chow-Fraser, P. Mapping Options to Track Invasive Phragmites australis in the Great Lakes Basin in Canada. In Water Resources and Wetlands; Gastescu, P., Bretcan, P., Eds.; Romanian Limnogeographical Assoc: Targoviste, Romania, 2016; pp. 75–82. [Google Scholar]
- Tuominen, J.; Lipping, T. Spectral Characteristics of Common Reed Beds: Studies on Spatial and Temporal Variability. Remote Sens. 2016, 8, 181. [Google Scholar] [CrossRef]
- Luo, J.; Ma, R.; Feng, H.; Li, X. Estimating the Total Nitrogen Concentration of Reed Canopy with Hyperspectral Measurements Considering a Non-Uniform Vertical Nitrogen Distribution. Remote Sens. 2016, 8, 789. [Google Scholar] [CrossRef]
- Thevs, N.; Beckmann, V.; Akimalieva, A.; Köbbing, J.F.; Nurtazin, S.; Hirschelmann, S.; Piechottka, T.; Salmurzauli, R.; Baibagysov, A. Assessment of ecosystem services of the wetlands in the Ili River Delta, Kazakhstan. Environ. Earth Sci. 2017, 76, 30. [Google Scholar] [CrossRef]
- Zhu, L.; Chen, Z.; Wang, J.; Ding, J.; Yu, Y.; Li, J.; Xiao, N.; Jiang, L.; Zheng, Y.; Rimmington, G.M. Monitoring plant response to phenanthrene using the red edge of canopy hyperspectral reflectance. Mar. Pollut. Bull. 2014, 86, 332–341. [Google Scholar] [CrossRef]
- Zheng, X.M.; Song, P.L.; Li, Y.Y.; Zhang, K.Y.; Zhang, H.J.; Liu, L.; Huang, J.F. Monitoring Locusta migratoria manilensis damage using ground level hyperspectral data. In Proceedings of the 2019 8th International Conference on Agro-Geoinformatics, Istanbul, Turkey, 16–19 July 2019. [Google Scholar]
- Yuan, Q.; Alpert, P.; An, J.; Gao, J.; Han, G.; Yu, F. Clonal integration in Phagmites australis mitigates effects of oil pollution on greenhouse gas emissions in a coastal wetland. Sci. Total Environ. 2020, 739, 140007. [Google Scholar] [CrossRef]
- Song, U. Improvement of soil properties and plant responses by compost generated from biomass of phytoremediation plant. Environ. Eng. Res. 2020, 25, 638–644. [Google Scholar] [CrossRef]
- Cronin, J.T.; Johnston, J.; Diaz, R. Multiple Potential Stressors and Dieback of Phragmites australis in the Mississippi River Delta, USA: Implications for Restoration. Wetlands 2020. [Google Scholar] [CrossRef]
- Van Tran, G.; Unpaprom, Y.; Ramaraj, R. Methane productivity evaluation of an invasive wetland plant, common reed. Biomass Convers. Biorefinery 2020, 10, 689–695. [Google Scholar] [CrossRef]
- Xia, S.; Song, Z.; Van Zwieten, L.; Guo, L.; Yu, C.; Hartley, I.P.; Wang, H. Silicon accumulation controls carbon cycle in wetlands through modifying nutrients stoichiometry and lignin synthesis of Phragmites australis. Environ. Exp. Bot. 2020, 175, 104058. [Google Scholar] [CrossRef]
- Liu, Y.; Ding, Z.; Bachofen, C.; Lou, Y.; Jiang, M.; Tang, X.; Lu, X.; Buchmann, N. The effect of saline-alkaline and water stresses on water use efficiency and standing biomass of Phragmites australis and Bolboschoenus planiculmis. Sci. Total Environ. 2018, 644, 207–216. [Google Scholar] [CrossRef]
- Leverenz, J.W.; Jarvis, P.G. Photosynthesis in Sitka Spruce. VIII. The Effects of Light Flux Density and Direction on the Rate of Net Photosynthesis and the Stomatal Conductance of Needles. J. Appl. Ecol. 1979, 16, 919–932. [Google Scholar] [CrossRef]
- Marshall, B.; Biscoe, P.V. A Model for C3 Leaves Describing the Dependence of Net Photosynthesis on Irradiance. J. Exp. Bot. 1980, 31, 29–39. [Google Scholar] [CrossRef]
- Medlyn, B.E.; Dreyer, E.; Ellsworth, D.; Forstreuter, M.; Harley, P.C.; Kirschbaum, M.U.F.; Le Roux, X.; Montpied, P.; Strassemeyer, J.; Walcroft, A.; et al. Temperature response of parameters of a biochemically based model of photosynthesis. II. A review of experimental data. Plant Cell Environ. 2002, 25, 1167–1179. [Google Scholar] [CrossRef]
- Farquhar, G.D.; Caemmerer, S.V.; Berry, J.A. A biochemical model of photosynthetic CO2 assimilation in leaves of C3 species. Planta 1980, 149, 78–90. [Google Scholar] [CrossRef] [PubMed]
- Duursma, R.A. Plantecophys—An R Package for Analysing and Modelling Leaf Gas Exchange Data. PLoS ONE 2015, 10, e0143346. [Google Scholar] [CrossRef] [PubMed]


| Photosynthetic Physiological Characteristics | HP | XP | SP | FP | PP |
|---|---|---|---|---|---|
| Im | 1046.9 ± 12.3a | 1118.7 ± 5.7a | 1261.3 ± 11.2b | 2165.3 ± 21.7c | 2278.1 ± 20.3d |
| AQE | 0.029 ± 0.004a | 0.021 ± 0.003a | 0.039 ± 0.002b | 0.047 ± 0.004c | 0.031 ± 0.003a |
| Rd | −0.65 ± 0.02a | −0.45 ± 0.01b | −0.55 ± 0.03c | −0.45 ± 0.07b | −0.29 ± 0.02d |
| Pmax | 11.70 ± 0.13a | 11.30 ± 0.25b | 13.00 ± 0.24c | 9.30 ± 0.11d | 19.60 ± 0.17e |
| Bm | 137.0 ± 2.7a | 133.3 ± 3.5b | 144.5 ± 5.4c | 75.2 ± 6.8d | 218.3 ± 5.9e |
| Photosynthetic Physiological Characteristics | HP | XP | SP | FP | PP |
|---|---|---|---|---|---|
| Im | 2086.7 ± 11.4a | 1810.2 ± 4.9b | 1838.3 ± 11.9c | 2186.3 ± 12.5d | 924.1 ± 9.2e |
| AQE | 0.011 ± 0.003a | 0.017 ± 0.004b | 0.033 ± 0.003c | 0.007 ± 0.002d | 0.025 ± 0.005e |
| Rd | −0.15 ± 0.06a | −0.14 ± 0.03a | −0.05 ± 0.02b | −0.35 ± 0.01c | −0.20 ± 0.04d |
| Pmax | 11.50 ± 0.26a | 14.30 ± 0.19b | 19.50 ± 0.27c | 9.00 ± 0.14d | 9.50 ± 0.24d |
| Bm | 448.3 ± 3.1a | 250.0 ± 2.3b | 166.7 ± 7.4c | 365.0 ± 8.6d | 665.3 ± 7.5e |
| Photosynthetic Parameters | HP | XP | SP | FP | PP |
|---|---|---|---|---|---|
| Cm | 2195.7 ± 11.9a | 1708.2 ± 4.0b | 1678.9 ± 11.2c | 3782.7 ± 12.0d | 1334.9 ± 6.2e |
| Cc | 13.8 ± 2.1a | 12.5 ± 2.2b | 6.3 ± 0.4c | 48.6 ± 3.6d | 12.2 ± 0.5b |
| φCO2 | 0.037 ± 0.004a | 0.045 ± 0.002b | 0.067 ± 0.001c | 0.025 ± 0.001d | 0.097 ± 0.005e |
| Rl | −0.50 ± 0.02a | −0.05 ± 0.01b | −0.40 ± 0.03a | −1.20 ± 0.02c | −1.30 ± 0.04c |
| Pa | 26.70 ± 0.23a | 26.30 ± 0.32b | 26.60 ± 0.17a | 28.10 ± 0.34c | 30.70 ± 0.37d |
| Photosynthetic Parameters | HP | XP | SP | FP | PP |
|---|---|---|---|---|---|
| Cm | 3417.9 ± 11.2a | 2791.7 ± 4.6b | 1486.4 ± 11.2c | 5465.8 ± 17.5d | 2363.1 ± 9.0e |
| Cc | 12.9 ± 0.7a | 15.2 ± 1.3b | 5.9 ± 0.3c | 59.7 ± 8.8d | 35.4 ± 2.7e |
| φCO2 | 0.021 ± 0.003a | 0.039 ± 0.002b | 0.017 ± 0.003c | 0.011 ± 0.002d | 0.049 ± 0.003e |
| Rl | −0.05 ± 0.006a | −1.1 ± 0.05b | −0.85 ± 0.03c | −0.65 ± 0.03d | −1.75 ± 0.1e |
| Pa | 25.10 ± 0.70a | 28.60 ± 0.23b | 28.70 ± 0.37b | 26.20 ± 0.45c | 29.40 ± 0.68d |
| Photosynthetic Parameters | HP | XP | SP | FP | PP |
|---|---|---|---|---|---|
| Vcmax | 94.53 ± 2.61a | 41.47 ± 2.04b | 53.76 ± 3.23c | 70.59 ± 1.62d | 138.99 ± 3.93e |
| Jmax | 148.28 ± 2.51a | 107.29 ± 1.32b | 111.57 ± 3.91b | 115.13 ± 2.10b | 195.75 ± 2.85c |
| Ci_transition | 530 | 787 | 519 | 828 | 308 |
| Photosynthetic Parameters | HP | XP | SP | FP | PP |
|---|---|---|---|---|---|
| Vcmax | 86.91 ± 6.54a | 61.85 ± 2.26b | 94.26 ± 3.19c | 30.21 ± 0.89d | 82.90 ± 1.69a |
| Jmax | 120.02 ± 4.77a | 116.62 ± 3.53a | 154.89 ± 3.08b | 59.58 ± 1.43c | 146.62 ± 2.19b |
| Ci_transition | 405 | 815 | 428 | 999 | 808 |
| Habitats | Density of Reed | Water Level (cm) | Soil Moisture (%) | Area (km2) |
|---|---|---|---|---|
| HP | 131 | 20–40 | 43.12 | 2.48 |
| XP | 179 | 0 | 36.25 | 6.35 |
| SP | 25 | 0 | 18.29 | 2.93 |
| FP | 54 | 0 | 29.33 | 3.23 |
| PP | 126 | 30–60 | 54.72 | 2.87 |
© 2020 by the authors. Licensee MDPI, Basel, Switzerland. This article is an open access article distributed under the terms and conditions of the Creative Commons Attribution (CC BY) license (http://creativecommons.org/licenses/by/4.0/).
Share and Cite
An, S.; Liu, X.; Wen, B.; Li, X.; Qi, P.; Zhang, K. Comparison of the Photosynthetic Capacity of Phragmites australis in Five Habitats in Saline‒Alkaline Wetlands. Plants 2020, 9, 1317. https://doi.org/10.3390/plants9101317
An S, Liu X, Wen B, Li X, Qi P, Zhang K. Comparison of the Photosynthetic Capacity of Phragmites australis in Five Habitats in Saline‒Alkaline Wetlands. Plants. 2020; 9(10):1317. https://doi.org/10.3390/plants9101317
Chicago/Turabian StyleAn, Subang, Xingtu Liu, Bolong Wen, Xiaoyu Li, Peng Qi, and Kun Zhang. 2020. "Comparison of the Photosynthetic Capacity of Phragmites australis in Five Habitats in Saline‒Alkaline Wetlands" Plants 9, no. 10: 1317. https://doi.org/10.3390/plants9101317
APA StyleAn, S., Liu, X., Wen, B., Li, X., Qi, P., & Zhang, K. (2020). Comparison of the Photosynthetic Capacity of Phragmites australis in Five Habitats in Saline‒Alkaline Wetlands. Plants, 9(10), 1317. https://doi.org/10.3390/plants9101317