Abstract
UV-B radiation has been previously reported to induce protective or deleterious effects on plants depending on the UV-B irradiation doses. To elucidate how these contrasting events are physiologically coordinated, we exposed sweet basil plants to two UV-B doses: low (8.5 kJ m−2 day−1, 30 min exposure) and high (68 kJ m−2 day−1, 4 h exposure), with the plants given both doses once continuously in a single day. Physiological tests during and after both UV-B exposures were performed by comparing the stress-induced damage and adverse effects on photosynthetic activity, the concentration and composition of photosynthetic and non-photosynthetic pigments, and stress-related hormones biosynthesis in basil plants. Our results showed that upon receiving a high UV-B dose, a severe inactivation of oxygen evolving complex (OEC) activity at the PSII donor side and irreversible PSII photodamage caused primarily by limitation of the acceptor side occurred, which overloaded protective mechanisms and finally led to the death of the plants. In contrast, low UV-B levels did not induce any signs of UV-B stress injuries. The OEC partial limitation and the inactivation of the electron transport chain allowed the activation of photoprotective mechanisms, avoiding irreversible damage to PSII. Overall results indicate the importance of a specific response mechanisms regulating photoprotection vs irreversible photoinhibition in basil that were modulated depending on the UV-B doses.
1. Introduction
The formation of a stratospheric ozone layer has established a kind of solar radiation filter to absorb completely harmful wavelengths such as UV-C (<280 nm) and much of the UV-B (280–315 nm) emitted by the sun. During the 20th century an increase in UV-B radiation was detected to reach the earth’s surface, caused by the depletion of the ozone layer triggered by chlorofluorocarbons release [1]. Currently, however, predictions suggest the beginnings of a recovery of stratospheric ozone, with some areas that will likely show a decrease of UV radiation to levels lower than those before the 1960s, while other regions will experience enhanced levels of UV-radiation [2]. In the light of these new indications, UV-B radiation effects on plant behaviors are of increasing interest in the plant science community. In fact, considering that solar radiation is the primary energy source for plants, understanding the mechanisms which might regulate UV-induced injurious and protective responses could potentially lead to improved plant productivity and quality. Due to its high energy, UV-B is potentially deleterious to many organisms, including plants. An enhancement of UV-B can determine a diverse range of plant responses depending on the fluence rate, dose, duration, and wavelength of the UV-B treatment, though generally in the literature, plant UV-B responses are defined by low or high dose radiations [3,4,5,6,7,8,9,10]. The ecologically relevant low UV-B radiation around the ambient level can act as an important environmental cue by inducing regulatory effects on plant morphology, physiology, and biochemistry to stimulate UV-B protection mechanisms and/or amelioration of UV-B damage, and these effects do not impede necessarily growth and development of plants [2,4,11,12]. On the other hand, a high dose of UV-B, above ambient level, may cause exceptionally high biological damage to the photosynthetic organism, leading to severe UV-B distress with a massive production of ROS, damage to DNA, proteins, and membranes, the inhibition of protein synthesis, destruction of photosynthetic pigments and photosynthetic reactions which can induce programmed cell death (PCD), and lastly the death of plants [13,14,15,16].
The main target of UV-B radiation in photosynthetic organisms, since exposure to such high energy light causes inhibition of the photosynthetic machinery, is represented by the PSII complex [17]. However, the vulnerable targets and the physiological responses in UV-induced damage in PSII (PSII photodamage) have been difficult and controversial to explain. Previous reports suggested that the primary cause for the UV-induced inhibition of the PSII function is the blockage of electron transport water-oxidizing complex (OEC) at Mn cluster on the donor side, while others reported evidence for inactivation at quinone electron acceptors (QA and Q B) on the acceptor side [18,19].
Hence, the present study was conducted to probe and compare the protective versus deleterious effects of two different UV-B doses, low (8.5 kJ m−2 d−1) and high (68 kJ m−2 d−1), considering the differential responses of the photosynthetic machinery of sweet basil (Ocimum basilicum L.). With this aim, chlorophyll fluorescent transients followed by the JIP-test, concentration and composition of photosynthetic and non-photosynthetic pigments, and stress-related hormones biosynthesis were evaluated. Sweet basil is one of the most economically important cultivated herb belonging to the Lamiacae family, which has been extensively used by many cultures worldwide as a culinary herb and also has been exploited by cosmetic, food, and pesticides industries for its high natural content in polyphenols [20]. A deeper understanding of the temporal patterns involved in different UV-B responses will help to dissect protective from irreversible damage-related events, and may potentially lead to improved agronomic crop performance and industrial applications.
2. Results
2.1. Visual Effects of UV-B Exposures
Sweet basil plants grown in a “in vitro-vivo system”, which was recently described [10], were UV-B irradiated using two different UV-B doses, low and high dose, in order to depict the overall effects of UV radiations on photosynthesis using parameters derived from chlorophyll a fluorescence measurements, on physiological (hormones) and biochemical (photosynthetic pigments and phenolic acids) traits. In the low UV-B dose model, sweet basil plants were UV-B irradiated for 30 min, obtaining a daily UV-B dose flux of 8.5 (kJ m−2 d−1). The UV-B dosage experienced by these sweet basil plants is slightly higher compared to the UV-B regimes (2.3–7 kJ m−2 d−1) encountered at mid latitudes (35°–45°N) during the growing period (spring season) in the northern hemisphere [21,22]. In the other model, the plants were UV-B irradiated for 4 h reaching a fluence rate of 68 kJ m−2 d−1, which is a high UV-B dose. After the UV-B exposures, plants subjected to the two different experimental models were placed in a light regime along with the already present control plants for up to 72 h (recovery period). An overview of experimental design regarding the conditions of plant growth, UV-B irradiation, and recovery is reported in Figure 1. Glossy-light green leaves were observed after 24 days of high UV-B treatment, and leaf-browning and necrosis/wilting were also induced later (over 48 and 72 h) by a high UV-B dose (Figure 2A). Glossy leaves were not observed after low UV-B irradiation, and the treated plants appeared to be similar to the control ones until 48 h was reached. Then, the basil plants exhibited leaf curling at the end of recovery period (Figure 2). At the end of recovery period (72 h) a staining with Evans Blue, a dye that is readily taken up specifically by dead cells was used to confirm the involvement of high UV-B dose induced cell death in O. basilicum leaves. Positive staining was clearly observed in cells of leaves exposed to high UV-B radiation [Figure 2B]. In contrast, no Evans Blue staining was observed in cells of leaves exposed to low UV-B radiation, similarly to in leaves not exposed to UV-B (control).

Figure 1.
Schematic representation of overall experimental design from plant growing, UV-B irradiation to recovery conditions of sweet basil.
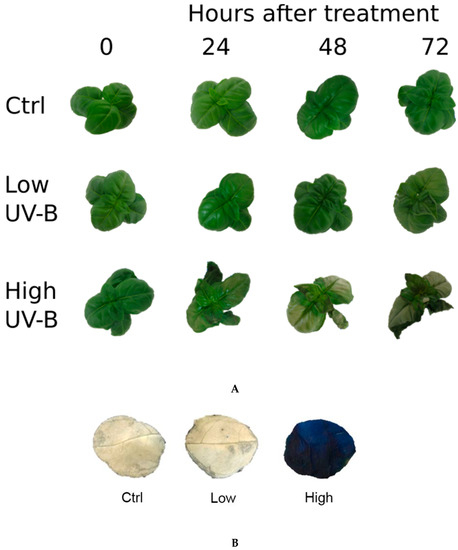
Figure 2.
(A) Appearance of sweet basil plants over 72 h, after low and high UV-B exposures and control (Ctrl) condition (not UV-B exposed); (B) Leaf disks of sweet basil cv. Genovese irradiated with low UV-B light (30 min: 8.5 kJ m−2 day−1), high UV-B light (4hours: 68 kJ m−2 day−1) or not UV-B exposed (control). Cell death was monitored by staining the leaves with Evans blue after 72 h from the beginning of exposure. The pattern presented is representative of at least 10 replicates.
2.2. The Impact of UV-B Radiation on PSII Photochemistry
The effect of high and low UV-B dose on the photosynthetic machinery of O. basilicum leaves was investigated by measuring the fast Chlorophyll a fluorescence transient at 0, 24, 48, and 72 h after UV-B exposures (low and high doses). The mean values of measured and calculated fluorescence parameters [Table 1, Table 2], suggest possible differences in energy fluxes at the donor as well as at the acceptor side of PSII [23,24].

Table 1.
List of the OJIP test parameters with explanations and formulae used for calculation according to Kalaji et al. [25,26].
Table 2.
Effect of UV-B exposures (low: 8.5 kJ m−2 day−1; high: 68 kJ m−2 day−1; ctrl: not UV-B exposure) at different recovery time (0, 24, 48, and 72 h) on selected chlorophyll a fluorescence parameters of O. basilicum leaves. Means within each column (time after UV-B exposure) and within each chlorophyll a fluorescence parameter assessed followed by different letters are significantly different (P < 0.05; Tukey’s multiple range test, n ≥ 5). Arrows indicate the direction of the effects (P < 0.05) for each parameter under UV-B exposures (↑ red highlighted: the parameter has a higher value in UV-B treated leaves compared to ctrl ones; ↓ blue highlighted: the parameter has a lower value).
Compared with controls, leaves exposed to high UV-B radiation showed a significant decrease in the maximal fluorescence intensity (Fm) and in the efficiency of the water-splitting complex on the donor side of PSII (Table 2) at almost any time after UV-B exposure, whereas the initial fluorescence (Fo) was much higher (Table 2). The increase of Fo was observed at a high UV-B dose already after 24 h of exposure. Moreover, the effects of high UV-B radiations on the inactivation of the electron transport at the donor side of PSII were noticed through a significant increase over recovery time in the Fk/Fj ratio, Vj, and Vk (Table 2). Immediately after high UV-B radiations (0 h), time needed to reach Fm (Tfm) and energy necessary for the closure of all reaction centers (Sm) highly increased and then gradually decreased before drastically dropping after 72 h of UV-B exposure. Furthermore, leaves exposed to high UV-B dose demonstrated a more rapid accumulation of closed RCs, with increasing Mo values at 48 and 72 h.
UV-induced changes were studied on the basis of flux ratios like ϕP0, ϕE0, and ΨE0, which affect electron transport at the acceptor side of PSII, and δR0, δD0, and ϕR0, which are indirectly associated with PSI. The quantum yield of primary photochemistry (ϕpo) decreased significantly, when plants were exposed to high UV-B doses from 24 h to 72 h, and both the quantum yield for electron transport (ϕEo) and the efficiency per trapped excitation (Ψo) showed almost comparable changes (Table 2). The efficiency with which an electron can move from the reduced intersystem electron acceptors to the PSI end-electron acceptors (δR0), promptly increased after high UV-B exposure (at 0 h) but at the end of the recovery time (72 h) the value was strongly reduced compared to the control and low UV-B exposure. Compared to the control, high UV-B exposed leaves had a significantly decreased quantum yield for the reduction of end acceptors of PSI per photon absorbed (ϕR0) after 48 and 72 h.
2.3. Overall Effects of UV Radiations on Photosynthetic Pigments
The chlorophyll and related pigments such as carotenoids were measured since these molecules have important role in leaf functionality, and are involved in light perception and protection against photooxidation. To measure the changes in pigments concentration of leaves, HPLC analysis of isolated photosynthetic pigments during low and high UV-B radiations, as well as after these exposures over a period of 72 h, was carried out. The results are shown in Figure 3A–F. The overall changes in the levels of chlorophyll a and chlorophyll b showed a similar trend (Figure 3A,B). In leaves exposed to high UV-B radiation, the chlorophyll levels began to decrease after 24 h of recovery and still remained significantly lower compared to both control and low UV-B treated leaves over the 72 h recovery period (Figure 3A). Meanwhile, in control and low UV-B exposed leaves, the chlorophyll content was unaffected, resulting in a non-statistically significant difference of p < 0.005 between ctrl and low for both chlorophyll a and chlorophyll b.
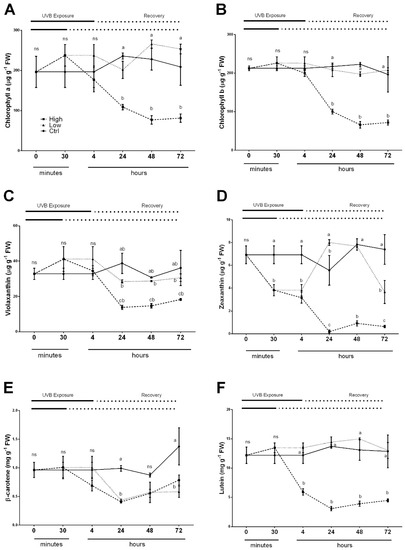
Figure 3.
Time course of Chlorophyll a (A), Chlorophyll b (B), Violaxanthin (C), Zeaxanthin (D), β-Carotene (E) and Lutein (F) in sweet basil cv. Genovese irradiated with low UV-B light (30 min: 8.5 m−2 day−1), high UV-B light (4hours: 68 kJ m−2 day−1) or not exposed (control). Data are shown as mean with at least five independent biological replicates. The measurements are carried out at 0, 30 min, 4, 6, 24, 48 and 72 h from the beginning of exposure. Data were subjected to analysis of variance and differences between UV-B doses were analyzed by a Tukey’s multiple comparisons test. Different letters within the same time-point denote significant differences at P < 0.05. The thick line above the graph indicates the time of UV-B exposures (low: 30 min, high: 4 h, from bottom to top, respectively) and the dot line indicates the recovery period under normal light (low: 30 min, high: 4 h, from bottom to top, respectively).
A slightly different trend was observed for all carotenoids measured (Figure 3C–F). Again, in control leaves of sweet basil plants, the contents of violaxanthin, zeaxanthin, lutein and β-carotene did not change throughout the experimental time. On the other hand, the exposure of basil leaves to high UV-B dose led to a general decrease in all carotenoids tested. In detail, the violaxanthin and β-carotene contents were reduced 24 h after the treatment during the recovery period (Figure 3C,E). The content of zeaxanthin showed a decline during UV-B exposure starting from 30 min (Figure 3D), whereas lutein content decreased immediately after 4 h UV-B exposure (Figure 3F). Low UV-B dose exposure did not influence violaxanthin content (Figure 3C), showing a similar trend in untreated control plants (Figure 3C). A rapid and significant decrease of zeaxanthin (Figure 3D) was observed at the end of UV-B treatment (30 min) and after 4 h from the beginning of experiments. Subsequently, a transient increase at 24 h (slightly higher than in the control plants) and at 48 h was reported, and then at 72 h, the content dropped significantly compared to the value of control plants but showed a significantly higher content related to high UV-B treated plants. After 4 h from the beginning of the experiment, a generalized significant decrease of β-carotene in low UV-B exposed plants was observed and this reduction was prolonged during the entire recovery period, with no statistical differences compared to plants treated with high UV-B dose (Figure 3E). In low UV-B treated plants, the lutein content did not show any significant differences among the different time points compared to the control (Figure 3F).
2.4. Overall Effects of UV Radiations on Phenolic Acid Accumulation
Among the nine phenolic acids evaluated (of interest), only rosmarinic acid (RA) was found in considerable concentrations in all analyzed samples, while the other metabolites were present in trace quantities or below the detection limits (0.05 mg g−1 DW). The typical chromatogram of an extract of basil sample is reported in Figure 4A and showed one main peak that was identified as RA by means of LC-MS analysis. The rosmarinic acid (RA) content after 48 h drastically increased in UV-B treated plants exposed to high dose and its content remained significantly high until the end of experiment (Figure 4B). During the experiment, the RA content in control plants and in low-doses UV-B treated plants did not change among the different time points (Figure 3B).
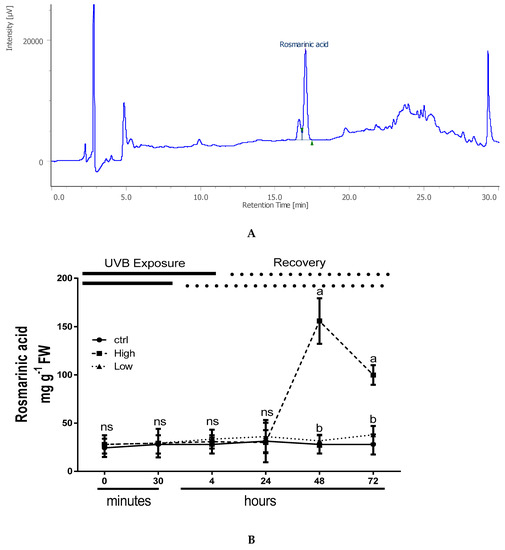
Figure 4.
(A) Typical HPLC chromatogram of HCl-methanolic extract of sweet basil leaves (O. basilicum L.), showing a main peak that was identified as RA by means of LC-MS analysis; (B) Time course of changes in rosmarinic acid, in sweet basil cv. Genovese irradiated with low UV-B light (30 min: 8.5 kJ m−2 day−1), high UV-B light (4hours: 68 kJ m−2 day−1) or not-exposed plants (control). Data are shown as mean with at least 5 independent biological replicates. The measurements are carried out at 0, 30 min, 4 h, 24 h, 48 h, and 72 h from the beginning of exposure. Data were subjected to analysis of variance and differences between UV-B doses were analyzed by a Tukey’s multiple comparisons test. Different letters within the same time-point denote significant differences at P < 0.05. The thick line above the graph indicates the time of UV-B exposures (low: 30 min, high: 4 h, from bottom to top, respectively) and the dot line indicates the recovery period under normal light (low: 30 min, high: 4 h, from bottom to top, respectively).
2.5. Endogenous Hormones Were Affected Differently by Low and High UV-B Light Conditions
Endogenous content of ABA increased significantly in UV-B treated plants compared to the untreated ones after 15 min and 30 min during both (low and high) UV-B exposures. Then the high UV-B exposure led to an increase of ABA content at 24h and its level remained significantly higher compared to the control until the end of the experiment (Figure 5A). On the other hand, plant exposed to low UV-B did not change endogenous ABA content during the whole recovery period, in a similar manner of control plants. A biphasic response to UV-B has been observed for ethylene evolution (Figure 5B). In UV-B treated plants, there was a first high peak after 30 min, in both high and low UV-B exposure treatments (Figure 5B). Then, the evolution of ethylene again increased with a second peak after 6 h under low UV-B exposure with levels similar to the leaves exposed to high dose. However, in high UV-B dose exposed plants ethylene continued to increase reaching the highest peak after 24 h and then declined but maintained higher values compared to the control until 72 h (Figure 5B). In contrast, in low UV-B exposed leaves, the ethylene production did not show any significant differences from control ones from 24 to 72 h of recovery time (Figure 5B).
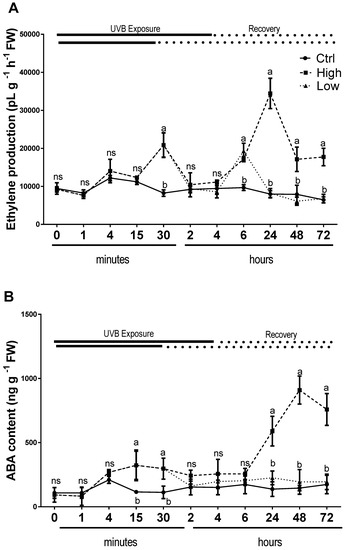
Figure 5.
Time course of ethylene (A) emission and ABA content (B), in sweet basil cv. Genovese irradiated with low UV-B light (30 min: 8.5 kJ m−2 day−1), high UV-B light (4hours: 68 kJ m−2 day−1) or not exposed (control). Data are shown as mean with at least 5 independent biological replicates. The measurements are carried out at 0 1, 4, 15, and 30 min, as well as 2, 4, 6, 24, 48, and 72 h from the beginning of exposure. Data were subjected to analysis of variance and differences between UV-B doses were analyzed by a Tukey’s multiple comparisons test. Different letters within the same time-point denote significant differences at P < 0.05. The thick line above the graph indicates the time of UV-B exposures (low: 30 min, high: 4 h, from bottom to top, respectively) and the dot line indicates the recovery period under normal light (low: 30 min, high: 4 h, from bottom to top, respectively).
3. Discussion
Light is the essential component to drive photosynthesis, but it is intrinsically harmful to the photosynthetic machinery [27]. Exposure of crops to strong visible or UV light, results in light-induced inactivation of photosystem II (PSII), which may cause the death of the photosynthetic organism, when the rate of damage exceeds the rate of repair process [17]. Data presented in our study offer a clear picture of the two response modes, adaptation versus death, using two contrasting UV-B doses (low UV-B: 8.5 kJ m−2 day−1, and high UV-B: 68 kJ m−2 day−1), by comparing the stress-induced damage and adverse effects on photosynthetic activity (mainly related to PSII), concentration, and composition of photosynthetic and non-photosynthetic pigments, and stress-related hormones biosynthesis in sweet basil plants.
In our system, stress effects occurred mainly at high doses of UV-B which lead to the death of the plants at the end of the recovery period. The leaves of these plants were permeable to Evans blue staining and therefore were considered to be dead as their plasma membrane was no longer semipermeable. On the other hand, low levels of UV-B did not induce any signs of stress injuries. Under these conditions, high UV-B intensity was proposed to be associated with a state of distress leading to a ROS burst which resulted in PCD, whereas low UV-B intensity was considered as a sort of positive stress (eustress), allowing the plants to cope against adversity [9].
Under UV-B light, the photoinhibitory process is dependent on the time and fluence rate which can lead to partial or complete disintegration of chlorophyll protein complexes, resulting in an increase in ROS production and finally to death of the photosynthetic organism. Previous reports reviewed by Kataria et al. [18], showed that photoinactivation by UV light possibly affects two targets, the water-oxidizing manganese (Mn) cluster which results in the inactivation of the electron transport chain and alterations at the acceptor side of PSII. However, the results reported did not give a clear-cut indication as to which one was the primary cause for the UV-induced inhibition of the PSII function. In the present report, UV-B induced inhibition of the PSII function affected two targets in two distinct phases, first damage occurred in the water-oxidizing manganese (Mn) cluster and resulted in the inactivation of the electron transport chain, and then the limitation at the acceptor side of PSII was observed. This last event exerted a strong influence on the repair mechanism leading to plant death, due to harmfully high UV-B dose, according to the unified model of photodamage recently proposed by Zafer et al. [19]. These authors showed that the loss of activity of the Mn cluster is attributed to the first event of photodamage, and it is a consequence of photodamage, since the addition of electron acceptors slowed down the loss of PSII activity, clearly indicating the acceptor side limitations as an effective cause of photoinactivation under high light illumination. In the first phase (immediately after UV-B exposure), only high UV-B exposed leaves manifested severe PSII damage through the primary inactivation oxygen-evolving complex (OEC) activity inhibiting the electron transfer at the donor side. Damage, limitation, and inactivation of the OEC was assessed through the increase in relative variable fluorescence at 300 µs (K-step), Vk [28] and Fk/Fj ratio as a quantitative measure for the inactivation of the PSII donor side [29]. The Fv/Fo ratio was also used to evaluate the efficiency of the water-splitting complex on the donor side of PSII [30], where a decrease of the value of Fv/Fo has been clearly associated with damage caused by light stress [31]. Under a high UV-B dose, the OEC was the most UV-B sensitive component of PSII. The Fk/Fj ratio increased immediately after high UV-B exposure and continued to increase markedly during recovery, indicating that UV-B stress inactivated the OEC activity. Similarly, the prompt and progressive decrease in Fv/Fo indicated that the water-splitting system of the donor side of PSII might be seriously impacted by high UV-B radiation, leading to OEC inactivation. From the data calculated by JIP-test and shown in Table 2, a slight and retarded alteration in Fk/Fj and Fo/Fv ratios and no significant change in Vk after low UV-B dose, indicated that OEC was less affected than with high UV-B dose and that the electron transport from PSII donor side to PSII reaction center was partly limited. Under this condition (i.e., basil plants exposed to low UV-B dose), it appears clear that low UV-B dose did not lead to PCD, conversely to what was observed under high UV-B doses (Figure 2), which resulted in the death of plants at the end of the recovery period. This was possibly caused by reactive oxygen species (ROS) generation and downstream damages to biomolecules, such as oxidation of lipid and protein, and DNA, as well as an enhancement in lipid peroxidation [32,33,34].
However, the cause of irreversible photoinactivation observed under high UV-B was attributed to a second and later phase during recovery (from 24 to 72 h), which involved the limitations of the acceptor side and greatly retarded electron transfer between QA- and QB, showing a strong influence on the loss of PSII efficiency (Fv/Fm), as previously reported by Mosadegh et al. [10]. In fact, when UV-B-induced changes (i.e., adaptation in basil plants exposed to low UV-B dose and death in basil plants exposed to high UV-B doses) were compared on the basis of the flux ratio (Table 2), only the highest UV-B dose significantly affected electron transport parameters at the acceptor side of PSII. ϕP0 corresponds to the maximum quantum yield of primary photochemistry. A decrease in ϕP0 under high UV-B dose indicated that the trapping probability of the reaction center (RC) was blocked, decreasing the rates of electron transport beyond QA-, and thus the photosynthetic efficiency was inhibited. Similar reductions were observed in the quantum yield of electron transport ϕE0. ΨE0 represents the probability of a trapped exciton moving an electron further than QA-, thus it is the efficiency of electron transfer from QA- to QB [23]. The high UV-B radiation caused a decrease in ΨE0, ϕE0, and ϕP0, reflecting a less efficient electron transfer after QA- to QB. Moreover, the increase in both Mo (which represents the net rate of closed RCs accumulation) and Vj (which reflects a measure of the fraction of the primary quinone electron acceptor of PSII in reduced state) further confirmed that high UV-B exposure could result in QA- accumulation. The damage to the PSII inflicted by UV-B radiations appears to be initially located at the water-oxidizing Mn cluster. However, irreversible photodamage of PSII leading to cell death was primarily caused by limitations of the acceptor side under high UV-B radiation.
Irradiation with high UV-B destroyed photosynthetic pigments through inhibition of their biosynthetic pathways and downregulation of genes associated with photosynthesis is causing its subsequent inhibition [35,36,37]. Chlorophyll degradation is the most common form of damage that can be observed after UV exposure [38,39] with consequence on the crop recovery. Similarly, high UV-B dose exposure in basil induced inhibition of photosynthesis resulting from chlorophylls degradation (Figure 3A,B). In addition, carotenoids contents were also significantly reduced in basil plants subjected to higher UV-B irradiation, and their reduction was previously reported to have serious consequences on chlorophyll protection from photoxidative destruction [18]. Lutein and other xanthophylls, constituents of the photosynthetic protein pigment LHCII complexes, are essential in photoprotection mechanisms to avoid the light-induced damage of the photosynthetic apparatus due to the formation of ROS under excess light [40]. A lower level of lutein, zeaxanthin and a significant decrease in violaxanthin availability were observed in high UV-B dose treated plants and may result from a serious degradation of LHCII. This effect was probably caused by the excessive and inefficient excitation energy transfer from antenna to the PSII RC through the physical separation of the PSII RC from associated pigment antennae, and the inhibition of electron flow reflecting the accumulation of the reduced form of QA- [41,42]. According to this effect, the increase in Fo was observed only in basil plants exposed to high UV-B. The increase of Fo in high UV-B model indicated that PSII was already impaired after 24 h as well as the electron transfer chain. In contrast, basil plants exposed to low UV-B dose (8.5 kJ m−2 day−1) did not show any effect on the photosynthetic pigments such as chlorophylls and lutein; however, the levels of zeaxanthin and beta-carotene were slightly reduced by UV-B suggesting the involvement of protective or repair mechanisms that can be modulated by this light quality. Consistently, the decrease in Fm may indicate a sustained engagement of zeaxanthin for energy dissipation, and thus stimulation of a photoprotective mechanism known as the xanthophyll cycle [43]. In addition, the decreased retention of β-carotene after low UV-B treatment might be useful during repair of PSII, since β-carotene seems to be released from the reaction center and has been shown to be essential for the assembly of PSII [44,45,46].
Another mechanism of photoprotection from UV-B radiation is the activation of the secondary metabolism and in particular, the phenylpropanoids pathway, which induces the biosynthesis of a wide range of phenolic compounds [47]. The increase of total phenolic content was previously observed in basil showing a UV-B dose-response trend [10]. These molecules with their conjugated double bonds can remove the ROS concentration reducing the cell damage. The accumulation of these molecules usually occurs during and after the UV exposure [48]. In our experiments, rosmarinic acid (RA), the main phenolic compound contained in the tissues of several plant species belonging to the Lamiaceae [20] was present at high concentrations only in basil plants exposed to high UV-B dose during 48 and 72 h of recovery. In agreement with a previous work on different basil growing systems [49], apart from RA, no other caffeic acid derivates were detected at a significant level in any of the analyzed samples. In basil, different UV-B doses might differentially modulate pathways between non-photosynthetic and photosynthetic pigments, playing an important antioxidant role in the photoprotection. A profound effect of oxidative stress which may be related to severe ROS overproduction has been shown to strongly elicit the biosynthesis of RA as reviewed in Trivellini et al. [20] and reported in Dewanjee et al. [50], and this situation probably occurred in basil exposed to high UV-B dose. In contrast under a low UV-B dose, light-induced damage of the photosynthetic apparatus could be ameliorated with the sustained engagement of the xanthophyll cycle as discussed above.
Effects of UV-B on plants are largely dependent on the control of hormonal pathways and as reviewed in Vanhaelewyn et al. [51] can be roughly classified as photomorphogenic effects and stress effects. In the present study, the modulation of hormonal pathway affecting the biosynthesis of ABA and ethylene was monitored during and after high and low UV-B exposure to provide a more detailed and comprehensive picture of the role of these hormones in injured/died and acclimated basil plants. ABA and ethylene are widely known as stress phytohormones, and their concentrations change facilitating plants to survive and grow well under a broad range of stress conditions [52,53,54,55,56,57]. The mechanisms controlling hormone dose-dependent protective/injurious response are largely unexplored in UV-B stress. When basil plants were exposed to low UV-B radiation, a rise in ABA accumulation occurred as a first and active response after 15 min, ethylene evolution showed a biphasic time course with its enhancement after 30 min and occurred concomitantly with the increased endogenous level of ABA, which continued after 6 h in the recovery process. On the other hand, in response to high UV-B dose, both ABA and ethylene considerably changed their concentrations, reaching the highest values during recovery. These behaviors might suggest differential phytohormone-regulative responses to UV stress which depend on hormonal concentrations: protective (at relatively low concentration) vs injurious (at high concentration) responses. An endogenous increase of ABA has been reported to cause a photoprotective effect as ABA biosynthesis mutants are more sensitive to UV-B [58]. Moreover, exogenous application ameliorates the impact of excessive excitation energy on PSII, through the de-epoxidation of xanthophyll-cycle components and preserves the photosynthetic pigments [59,60]. The increase of ABA after 6 h up to 72 h can be also induced by the degradation of carotenoids in particular violaxanthin, which contributes to the indirect ABA biosynthesis route. Regarding ethylene, few data have been published on the interaction between this hormone and UV-B stress. UV-B radiation mainly at high intensities stimulates ethylene biosynthesis acting as promoter of cell death in ROS-dependent PCD [59,60,61,62,63]. However, a physiologically relevant concentration of exogenously applied ethylene has been reported to regulate protection of photosynthesis against Ni- and Zn-induced heavy metal stress in Brassica juncea plants [64]. Therefore, taking into account that both ABA and ethylene are a part of a UV-B stress response mechanism that is also involved in the response of photosynthetic machinery to abiotic stresses [56], this study proposes that their different level of concentration in response to low and high UV-B dose could potentially be a sensitive regulator of appropriate physiological switching between protection mechanisms and PCD propagation.
In conclusion, our studies showed how basil plants respond differently to high and low UV-B irradiations by exploring the behavior of PSII activity, photosynthetic and non-photosynthetic pigments, and stress-related hormones as a targets, thereby deducing precise physiological mechanisms controlling protective vs injurious/destructive/harmful responses. There are different mechanisms of UV-B responses acting in basil as a function of the time and fluence rate (low and high). Low UV-B dose induces a sort of positive stress (eustress) through a partial limitation of OEC and the inactivation of the electron transport chain. This condition allows the activation of photoprotective mechanisms to counteract ROS and avoid irreversible damage to PSII. High UV-B dose leads to a state of catastrophe which starts with the primary and severe inactivation of OEC activity inhibiting the electron transfer at the PSII donor side, and finally shifts to irreversible photodamage of PSII caused by a limitation of the acceptor side. High UV-B intensity overloads the protective and repair mechanisms of photosynthetic protein pigment complexes and causes oxidative stress manifested with a peak in RA and subsequent ROS burst resulting in PCD. Basil plants exposed to low and high UV-B intensity differ in their ABA and ethylene accumulation, which could act as a sensitive regulator of appropriate physiological switching between protection mechanisms and PCD propagation, showing a relatively low concentration during low UV-B dose exposure for both hormones, and a high hormonal increase during recovery after high UV-B dose exposure.
4. Materials and Methods
4.1. Plant Material and Growing Condition
Seeds of Ocimum basilicum L. (cv. Genovese) were obtained from GBIS/I (Genebank Information System of the IPK Gatersleben, Germany). Seeds were surface sterilized by soaking in a solution of sodium hypochlorite 20% plus 0.01% Triton X-I00 for 10 min and rinsing four times with sterile water. The seeds were plated on MS agar media (Murashige and Skoog, 1962) with 3% (w/v) sucrose and 1.2% (w/v), Gelrite™ (Duchefa, NL), pH 5.7. Seeds were put at 4 °C for 48 h to synchronize germination. Then the plates were transferred under a 16 h photoperiod, at a constant 22 °C with a light level of 100 μmol m−2 s−1. Seven days old seedlings were transferred on Falcon™ (BD Bioscience, Belgium) tubes including agarized MS medium without sucrose and growth regulators. The Falcon containers were suitably modified to allow the growth of two individual basil plantlets with root apparatus inside the “in vitro” medium and the aerial part “in air” condition to avoid interference of the plastic lids with the UV-B treatments [Figure 1] [10]. Basil-plants grown in tubes for two weeks were used for all experiments. Plants were grown under a 16 h photoperiod, at a constant temperature of 22 °C and 65% humidity. Cool white light in the growth chamber was provided by L 36 W/76 florescence tubes (Osram, Munich, Germany). The light level was measured using a Field Scout ™ Light Sensor Reader equipped with a Quantum Light Sensor (Spectrum Technologies, Inc. Painfield, Illinois USA) and was 100 μmol m−2 s−1 during seedling growth and after irradiation (recovery stage). A spectrum of the light emission provided by the Osram company is provided as supplementary material (Figure S1A). The plants within the growth chamber were arranged randomly on one shelf.
4.2. UV-B Treatments
The UV-B-exposure was performed in absence of light, in the dark. For the UV-B light treatments was used a completely shielded cabinet placed inside the growth chamber. The cabinet walls were covered with a 6 mm black polyethylene sheeting to ensure a maximum light blockage from the growth chamber. In addition, the cabinet was equipped with UV-B lamps (UV-B GL20 SE, Sankyo Denki, Tokyo, Japan), whose emission spectrum ranged λ from 280 to 400 nm, resulting in a maximum peak at 325 nm. A spectrum of the UV-B light emission by the Sankyo Denki company is provided as supplementary material (Figure S1B). The “fluence” (UV dose) expressed as kJ m−2 d−1 was obtained by the “fluence rate” (µmol m−2 sec−1) measured with a Light Sensor Reader equipped with a UV Sensor (Field Scout ™ Spectrum Technologies, Inc. Painfield, Illinois USA), converted in W m-2 and multiplied by the exposure time in a day. Two UV doses were tested: 8.5 kJ m−2 d−1 (30 min UV-B exposure, low dose) and 68 kJ m−2 d−1 (4 h UV-B exposure, high dose) while the control plants were exposed to cool white light at 100 μmol m−2 s−1 provided by fluorescence tubes (L 36 W/76 florescence tubes (OSRAM, Munich, Germany). UV-B doses were given once continuously in a single day (day zero). The Falcon tubes plants of low and high UV-B were placed at the same time inside the UV-B cabinet and arranged randomly within the shelf at 40 cm from the UV-B light source. Then, low and high dose irradiated plants were moved from the cabinet after 30 min and 4 h from the beginning of UV-B exposure, respectively, to the shelf where the control plants grew under a 16 h photoperiod, (100 µmol−1 m−2 s−1 white light), at a constant temperature of 22 °C, 65% RU, for 72 h. The UV-B treatments was repeated five times.
4.3. Chlorophyll a Fluorescence Transient Analysis and Parameters
The chlorophyll a fluorescence transient was measured using portable fluorimeter (Handy PEA - Hansatech Instruments Ltd., UK). Fully developed leaves from O. basilicum, which entirely filled the area of the sensor, were selected for the measurements, after adaptation in the dark for 30 min using leaf clips. After adaptation, the fluorescence parameters were measured using a saturating light pulse of 3000 µmol photon m-2 s-1, which closed all RCs. Chlorophyll a fluorescence transient obtained from the dark-adapted sample was analyzed with the OJIP-test [23,25,26]. The description and calculation formula of the parameters considered in this study are reported in Table 1.
4.4. Photosynthetic Pigments Quantification by HPLC
The extraction of the photosynthetic pigments was performed on disks of leaves frozen in liquid nitrogen and stored at -80 °C. Disks were extracted with 100% HPLC-grade methanol (1:10, w: v) overnight at 4 °C. HPLC grade solvents were used for the analyses of the extracts and the HPLC equipment (Jasco, Tokyo, Japan) included a PU-2089 four-solvent low-pressure gradient pump and a MD-4010 diode array detector. The HPLC separation was performed using a Macherey–Nagel C18 250/4.6 Nucleodur® 100-5 Isis column equipped with a guard column, at a flow rate of 1 mL min-1. Methanol (solvent A), acetonitrile (solvent B), and ethyl acetate (solvent C) were used for elution, with the following gradient: 0–15 min, A 25%, B 75%; 15–17.5 min, A 70%, C 30%; 38 min, A 70%, C 30%; 41 min, A 25%, B 75%; 48 min, A 25%, B 75%. Detection was made in the wavelength range 270–700 nm. Standards of violaxanthin, neoxanthin, zeaxanthin, chlorophyll a and chlorophyll b (DHI, Hørsholm, Denmark) in a range of 0.78 to 5 mg L−1 and lutein and β-carotene (Sigma-Aldrich, Milano, Italy) in a range of 30 to 500 mg L−1 were used. Calibration curves, correlating the peak area to pigment concentration (R2 > 0.97), were performed.
4.5. Determination of Phenolic Acids by HPLC Analysis
The concentration of phenolic acids in each sample was determined using 300 mg frozen tissue, which was ground in a mortar with 5 mL extraction solvent (EtOH:H2O:HCl 80:19:1 v/v) and transferred into plastic tubes. Samples were sonicated for 1 h on 4 periods of time with ice and stored overnight at −20 °C, then they were centrifuged for 5 min at 3000 rpm. The supernatant was collected in plastic tubes and the pellet was extracted again with 5 mL fresh solvent. Samples were sonicated as in the previous extraction step and stored overnight at -20 °C. After centrifugation, the two supernatants were combined for analysis. All extracts were filtered with Chromafil® 0.45 μm cellulose mixed esters membrane; 25 mm diameter syringe filters (Macherey-Nagel, Düren, Germany) prior to HPLC separations. HPLC grade solvents were used for the analyses, which were performed with the same apparatus used for pigments determination, at a flow rate of 1 mL min−1. Acetonitrile (solvent A) and aqueous 0.1% phosphoric acid (solvent B) were used for elution, with the following gradient: 0–0.4 min, A 5%; 0.4–10 min, A 5%–50%; 10-15 min, A 50%–95%; 15–17 min, A 95%; 17–19 min, A 95%–5%; followed by 5 min equilibration (A 5%). Detection was made in the wavelength range 220–450 nm. The injection volume was 20 μL and the analyses were performed at room temperature (23–24 °C). Phenolic acids were identified by comparing the retention times and absorption maxima of peaks obtained with analytically pure standards. For this purpose, ferulic, caffeic, chlorogenic, caftaric, p-coumaric and t-cinnamic acids (Sigma-Aldrich, Milano, Italy), and rosmarinic acid (Phytolab GmbH, Westenbergsgreuth, Germany) were used. The detection limit of the analytical protocol was on the order of 0.05 mg g−1 DW.
4.6. Hormone Analysis
ABA was determined by an indirect ELISA based on the use of DBPA1 monoclonal antibody raised against S (+)-ABA. Briefly, leaf samples (100 mg FW) were collected, weighted, frozen in liquid nitrogen, and then stored at −80 °C until analysis. ABA was measured after extraction in distilled water (water: tissue ratio = 10: 1 v: w) overnight at 4 °C according to the method previously described [65]. Ethylene production was measured by enclosing two Falcon tubes in each air-tight containers (1000 mL). Two mL gas samples were taken from the headspace of the containers after 1 h incubation at room temperature. The ethylene concentration in the sample was measured by a gas chromatograph (HP5890, Hewlett-Packard, Menlo Park, California) using a flame ionization detector (FID), a stainless steel column (150 × 0.4 cm ø packed with Hysep T), a column, and detector temperatures of 70 °C and 350 °C, respectively, as well as nitrogen carrier gas at a flow rate of 30 mL min−1.
4.7. Evans Blue Staining
To obtain a visual detection of cell death, the leaves were stained using Evans blue dye according to the methods previously described [66]. Leaves were taken at the end of the experiment (after 72 h) and soaked in 10 mL of 0.25% Evans blue. They were then washed briefly in 10 mL water. Leaves were de-stained in boiling 96% ethanol for 10 min. Then the leaves were transferred to a 60% glycerol solution.
4.8. Experimental Design and Statistical Analysis
To measure the biological variation in our data, we used 30 falcon-tubes (each falcon-tube contained two plants) for each treatment. The whole experiment counting the treatments and control was independently repeated five times. By repeating the whole UV-B treatment experiment independently several times, biological replicates were obtained. To obtain independent data from the experimental design, we performed and applied a formal procedure of statistical inference (e.g., statistical significance testing), and a biological replicate from each independent experiment was used for downstream analysis as described below. A fluorescence measurement using chlorophyll was carried out immediately after UV-B exposures (0 h), at 24, 48, and 72 h of recovery time (number of biological replicates, n=5). Pigments and phenolic acids were analyzed during UV-B exposures (0, 30 min and 4 h) and during recovery period of 72 h (24, 48, and 72 h), (n = 5, each replication was created by pooling together three leaves from different falcon-tube plants). Hormones analysis were performed during UV-B exposures (0, 15, 30 min and 4 h) and during a recovery period of 72 h (6, 24, 48, and 72 h), (n=5, each replication was created by pooling together three leaves from different Falcon-tube plants or by using plants from two Falcon tubes inside a container for ABA and ethylene, respectively). Data were analyzed within each sampling time using one-way ANOVA. Significant differences among means were estimated at the 5% (P < 0.05) level, using Tukey’s test (GraphPad Prism6, GraphPad Software, Inc., CA USA).
Supplementary Materials
The following are available online at https://www.mdpi.com/2223-7747/8/10/396/s1, Figure S1A: Spectrum of white light emission from fluorescence tubes (L 36 W/76, Osram, Munich, Germany) provided by the Osram company, Figure S1B: Spectrum of UV-B light emission from UV-B lamps (UV-B GL20 SE, Sankyo Denki, Tokyo, Japan) provided by the Sankyo Denki company.
Author Contributions
H.M., A.T., M.L., R.M. and A.F. contributed to the experimental work. A.T. and A.M.S. designed the research. H.M., A.T., M.L., A.F., R.M., P.V. and A.M.S. analyzed the data. A.T. wrote and reviewed the article with contributions of all coauthors.
Funding
This research received no external funding.
Conflicts of Interest
The authors declare no conflict of interest.
References
- Moan, J. Visible light and UV radiation. In Radiation at Home, Out- Doors and in the Workplace; Brune, D., Hellborg, R., Persson, B.R.R., Pääkkönen, R., Eds.; Scandinavian Science Publisher: Oslo, Norway, 2001; pp. 69–85. [Google Scholar]
- Bais, A.F.; Lucas, R.M.; Bornman, J.F.; Williamson, C.E.; Sulzberger, B.; Austin, A.T.; Wilson, S.R.; Andrady, A.L.; Bernhard, G.; McKenzie, R.L.; et al. Environmental effects of ozone depletion, UV radiation and interactions with climate change: UNEP environmental effects assessment panel, update 2017. Photochem. Photobiol. Sci. 2018, 17, 127–179. [Google Scholar] [CrossRef] [PubMed]
- Frohnmeyer, H.; Staiger, D. Ultraviolet-B radiation-mediated responses in plants. Balancing damage and protection. Plant Physiol. 2003, 133, 1420–1428. [Google Scholar] [CrossRef] [PubMed]
- Casati, P.; Walbot, V. Rapid transcriptome responses of maize (Zea mays) to UV-B in irradiated and shielded tissues. Genome Biol. 2004, 5, R16. [Google Scholar] [CrossRef] [PubMed]
- Blanding, C.R.; Simmons, S.J.; Casati, P.; Walbot, V.; Stapleton, A.E. Coordinated regulation of maize genes during increasing exposure to ultraviolet radiation: Identification of ultraviolet-responsive genes, functional processes and associated potential promoter motifs. Plant Biotechnol. J. 2007, 5, 677–695. [Google Scholar] [CrossRef]
- Brown, B.A.; Jenkins, G.I. UV-B signaling pathways with different fluence-rate response profiles are distinguished in mature Arabidopsis leaf tissue by requirement for UVR8, HY5, and HYH. Plant Physiol. 2008, 146, 576–588. [Google Scholar] [CrossRef]
- Jenkins, G.I. Signal transduction in responses to UV-B radiation. Annu. Rev. Plant Biol. 2009, 60, 407–431. [Google Scholar] [CrossRef]
- Pontin, M.A.; Piccoli, P.N.; Francisco, R.; Bottini, R.; Martinez-Zapater, J.M.; Lijavetzky, D. Transcriptome changes in grapevine (Vitis vinifera L.) cv. Malbec leaves induced by ultraviolet-B radiation. BMC Plant Biol. 2010, 10, 224. [Google Scholar] [CrossRef]
- Hideg, E.; Jansen, M.A.; Strid, A. UV-B exposure, ROS, and stress: Inseparable companions or loosely linked associates? Trends Plant Sci. 2013, 18, 107–115. [Google Scholar] [CrossRef]
- Mosadegh, H.; Trivellini, A.; Ferrante, A.; Lucchesini, M.; Vernieri, P.; Mensuali, A. Applications of UV-B lighting to enhance phenolic accumulation of sweet basil. Sci. Hortic. 2018, 229, 107–116. [Google Scholar] [CrossRef]
- Caldwell, M.M.; Bornman, J.F.; Ballaré, C.L.; Flint, S.D.; Kulandaivelue, G. Terrestrial ecosystems, increased solar ultraviolet radiation and interactions with other climatic change factors. Photochem. Photobiol. Sci. 2003, 2, 29–38. [Google Scholar] [CrossRef]
- Jansen, M.; Bornman, J.F. UV-B radiation: From generic stressor to specific regulator. Physiol. Plant. 2012, 145, 501–504. [Google Scholar] [CrossRef] [PubMed]
- Jansen, M.A.K.; Gaba, V.; Greenberg, B.M. Higher plants and UV-B radiation: Balancing damage, repair and acclimation. Trends Plant. Sci. 1998, 3, 131–135. [Google Scholar] [CrossRef]
- Surabhi, G.K.; Reddy, K.R.; Singh, S.K. Photosynthesis, fluorescence, shoot biomass and seed weight responses of three cowpea (Vigna unguiculata (L.) Walp.) cultivars with contrasting sensitivity to UV-B radiation. Environ. Exp. Bot. 2009, 66, 160–171. [Google Scholar] [CrossRef]
- Nawkar, G.M.; Maibam, P.; Park, J.H.; Sahi, V.P.; Lee, S.Y.; Kang, C.H. UV-Induced cell death in plants. Int. J. Mol. Sci. 2013, 14, 1608–1628. [Google Scholar] [CrossRef] [PubMed]
- Rusaczonek, A.; Czarnocka, W.; Kacprzak, S.; Witoń, D.; Ślesak, I.; Szechyńska-Hebda, M.; Karpiński, S. Role of phytochromes A and B in the regulation of cell death and acclimatory responses to UV stress in Arabidopsis thaliana. J. Exp. Bot. 2015, 66, 6679–6695. [Google Scholar] [CrossRef]
- Melis, A. Photosystem-II damage and repair cycle in chloroplasts: What modulates the rate of photodamage in vivo? Trends Plant. Sci. 1999, 4, 130–135. [Google Scholar] [CrossRef]
- Kataria, S.; Jajoo, A.; Guruprasad, K.N. Impact of increasing Ultraviolet-B (UV-B) radiation on photosynthetic processes. J. Photochem. Photobiol. B 2014, 137, 55–66. [Google Scholar] [CrossRef]
- Zavafer, A.; Koinuma, W.; Chow, S.W.; Cheah, M.H.; Mino, H. Mechanism of photodamage of the oxygen evolving Mn cluster of photosystem II by excessive light energy. Sci. Rep. 2017, 7, 7604. [Google Scholar] [CrossRef]
- Trivellini, A.; Lucchesini, M.; Maggini, R.; Mosadegh, H.; Villamarin, T.S.S.; Vernieri, P.; Mensuali-Sodi, A.; Pardossi, A. Lamiaceae phenols as multifaceted compounds: Bioactivity, industrial prospects and role of “positive-stress”. Ind. Crops Prod. 2016, 83, 241–254. [Google Scholar] [CrossRef]
- Benca, J.P.; Duijnstee, I.A.P.; Looy, C.V. UV-B–induced forest sterility: Implications of ozone shield failure in Earth’s largest extinction. Sci. Adv. 2018, 4, e1700618. [Google Scholar] [CrossRef]
- Nigel, P. Plant responses to UV-B: Time to look beyond stratospheric ozone depletion? New Phytol. 2001, 150, 1–8. [Google Scholar]
- Strasser, R.J.; Tsimilli-Michael, M.; Srivastava, A. Analysis of the Chlorophyll a Fluorescence Transient. In Chlorophyll a Fluorescence; Papageorgiou, G.C., Govindjee, Eds.; Springer: Dordrecht, The Netherlands, 2004; pp. 321–362. [Google Scholar]
- Zivcak, M.; Brestic, M.; Kalaji, H.M. Govindjee Photosynthetic responses of sun- and shade-grown barley leaves to high light: Is the lower PSII connectivity in shade leaves associated with protection against excess of light? Photosynth. Res. 2014, 119, 339–354. [Google Scholar] [CrossRef] [PubMed]
- Kalaji, M.H.; Govindjee; Bosa, K.; Kos’cielniak, J.; Zuk-Gołaszewska, K. Effects of salt stress on photosystem II efficiency and CO2 assimilation of two Syrian barley landraces. Environ. Exp. Bot. 2011, 73, 64–72. [Google Scholar] [CrossRef]
- Kalaji, H.M.; Schansker, G.; Brestic, M.; Bussotti, F.; Calatayud, A.; Ferroni, L.; Goltsev, V.; Guidi, L.; Jajoo, A.; Li, P.; et al. Frequently asked questions about in vivo chlorophyll fluorescence: The sequel. Photosynth. Res. 2017, 132, 13–66. [Google Scholar] [CrossRef]
- Van Gorkom, H.; Schelvis, J. Kok’s oxygen clock: What makes it tick? The structure of P680 and consequences of its oxidizing power. Photosynth. Res. 1993, 38, 297–301. [Google Scholar] [CrossRef]
- Srivastava, A.; Guisséa, B.; Greppin, H.; Strasser, R.J. Regulation of antenna structure and electron transport in Photosystem II of Pisum sativum under elevated temperature probed by the fast polyphasic chlorophyll a fluorescence transient: OKJIP. Biochim. Biophys. Acta 1997, 1320, 95–106. [Google Scholar] [CrossRef]
- Kalaji, H.M.; Jajoo, A.; Oukarroum, A.; Brestic, M.; Zivcak, M.; Samborska, I.A.; Cetner, M.D.; Łukasik, I.; Goltsev, V.; Ladle, R.J. Chlorophyll a fluorescence as a tool to monitor physiological status of plants under abiotic stress conditions. Acta Physiol. Plant 2016, 38, 102. [Google Scholar] [CrossRef]
- Govindachary, S.; Bukhov, N.G.; Joly, D.; Carpentier, R. Photosystem II inhibition by moderate light under low temperature in intact leaves of chilling-sensitive and – tolerant plants. Physiol. Plant 2004, 121, 322–333. [Google Scholar]
- Kalaji, M.H.; Carpentier, R.; Allakhverdiev, S.I.; Bosa, K. Fluorescence parameters as an early indicator of light stress in barley. J. Photochem. Photobiol. B 2012, 112, 1–6. [Google Scholar] [CrossRef]
- Kliebenstein, D.J.; Lim, J.E.; Landry, L.G.; Last, R.L. Arabidopsis UVR8 regulates ultraviolet-B signal transduction and tolerance and contains sequence similarity to human regulator of chromatin condensation 1. Plant Physiol. 2001, 130, 234–243. [Google Scholar] [CrossRef]
- Jain, K.; Kataria, S.; Guruprasad, K.N. Changes in antioxidant defenses of cucumber cotyledons in response to UV-B and to the free radical generating compound AAPH. Plant Sci. 2003, 165, 551–557. [Google Scholar] [CrossRef]
- Hollosy, F. Effects of ultraviolet radiation on plant cells. Micron 2002, 33, 179–197. [Google Scholar] [CrossRef]
- Jordan, B.R.; James, P.E.; Strid, A.; Anthony, R.G. The effect of ultraviolet-B radiation on gene expression and pigment composition in etiolated and green pea leaf tissue UV-B induced changes are gene-specific and dependent upon the developmental stage. Plant Cell Environ. 1994, 17, 45–54. [Google Scholar] [CrossRef]
- Sztatelman, O.; Grzyb, J.; Gabryś, H.; Banaś, A.K. The effect of UV-B on Arabidopsis leaves depends on light conditions after treatment. BMC Plant Biol. 2015, 15, 281. [Google Scholar] [CrossRef] [PubMed]
- Huarancca Reyes, T.; Scartazza, A.; Castagna, A.; Cosio, E.G.; Ranieri, A.; Guglielminetti, L. Physiological effects of short acute UV-B treatments in Chenopodium quinoa Willd. Sci Rep. 2018, 8, 371. [Google Scholar] [CrossRef] [PubMed]
- Golaszewska, Z.K.; Upadhyaya, M.K.; Golaszewski, J. The effect of UV-B radiation on plant growth and development. Plant Soil Environ. 2003, 49, 135–140. [Google Scholar] [CrossRef]
- Zvezdanović, J.; Cvetić, T.; Veljović-Jovanović, S.; Marković, D. Chlorophyll bleaching by UV-irradiation in vitro and in situ: Absorption and fluorescence studies. Radiation Phys. Chem. 2009, 78, 25–32. [Google Scholar] [CrossRef]
- Jahns, P.; Holzwarth, A.R. The role of the xanthophyll cycle and of lutein in photoprotection of photosystem II. Biochim. Biophys. Acta 2012, 1817, 182–193. [Google Scholar] [CrossRef]
- Mathur, S.; Mehta, P.; Jajoo, A.; Bharti, S. Analysis of elevated temperature induced inhibition of Photosystem II using Chl a fluorescence induction kinetics. Plant Biol. 2011, 13, 1–6. [Google Scholar] [CrossRef]
- Fujii, R.; Yamano, N.; Hashimoto, H.; Misawa, N.; Ifuku, K. Photoprotection vs. Photoinhibition of Photosystem II in Transplastomic Lettuce (Lactuca sativa) Dominantly Accumulating Astaxanthin. Plant Cell Physiol. 2016, 57, 1518–1529. [Google Scholar] [CrossRef]
- Wingler, A.; Marès, M.; Pourtau, N. Spatial patterns and metabolic regulation of photosynthetic parameters during leaf senescence. New Phytol. 2004, 161, 781–789. [Google Scholar] [CrossRef]
- Sozer, O.; Komenda, J.; Ughy, B.; Domonkos, I.; Laczkó-Dobos, H.; Malec, P.; Gombos, Z.; Kis, M. Involvement of carotenoids in the synthesis and assembly of protein subunits of photosynthetic reaction centers of Synechocystis sp. PCC 6803. Plant Cell Physiol. 2010, 51, 823–835. [Google Scholar] [CrossRef] [PubMed]
- Santabarbara, S.; Casazza, A.P.; Ali, K.; Economou, C.K.; Wannathong, T.; Zito, F.; Redding, K.E.; Rappaport, F.; Purton, S. The requirement for carotenoids in the assembly and function of the photosynthetic complexes in Chlamydomonas reinhardtii. Plant Physiol. 2013, 161, 535–546. [Google Scholar] [CrossRef] [PubMed]
- Toth, T.N.; Chukhutsina, V.; Domonkos, I.; Knoppová, J.; Komenda, J.; Kis, M.; Lénárt, Z.; Garab, G.; Kovács, L.; Gombos, Z.; et al. Carotenoids are essential for the assembly of cyanobacterial photosynthetic complexes. Biochim. Biophys. Acta 2015, 1847, 1153–1165. [Google Scholar] [CrossRef]
- Dao, T.T.H.; Linthorst, H.J.M.; Verpoorte, R. Chalcone synthase and its functions in plant resistance. Phytochem. Rev. 2011, 10, 397. [Google Scholar] [CrossRef]
- Czarnocka, W.; Karpiński, S. Friend or foe? Reactive oxygen species production, scavenging and signaling in plant response to environmental stresses. Free Radic. Biol. Med. 2018, 122, 4–20. [Google Scholar] [CrossRef]
- Kiferle, C.; Lucchesini, M.; Mensuali Sodi, A.; Maggini, R.; Raffaelli, A.; Pardossi, A. Rosmarinic acid content in basil plants grown in vitro and in hydroponics. Cent. Eur. J. Biol. 2011, 6, 946–957. [Google Scholar] [CrossRef]
- Dewanjee, S.; Gangopadhyay, M.; Das, U.; Sahu, R.; Samanta, A.; Banerjee, P. Signal transducer and oxidative stress mediated modulation of phenylpropanoid pathway to enhance rosmarinic acid biosynthesis in fungi elicited whole plant culture of Solenostemon scutellarioides. Enzyme Microb. Technol. 2014, 66, 1–9. [Google Scholar] [CrossRef]
- Vanhaelewyn, L.; Prinsen, E.; VanDerStraeten, D.; Vandenbussche, F. Hormone-controlled UV-B responses in plants. J. Exp. Bot. 2016, 67, 4469–4482. [Google Scholar] [CrossRef]
- Cutler, S.R.; Rodriguez, P.L.; Finkelstein, R.R.; Abrams, S.R. Abscisic acid: Emergence of a core signaling network. Annu. Rev. Plant Biol. 2010, 61, 651–679. [Google Scholar] [CrossRef]
- Pellegrini, E.; Trivellini, A.; Campanella, A.; Francini, A.; Lorenzini, G.; Nali, C.; Vernieri, P. Signaling molecules and cell death in Melissa officinalis plants exposed to ozone. Plant Cell Rep. 2013, 32, 1965–1980. [Google Scholar] [CrossRef] [PubMed]
- Trivellini, A.; Lucchesini, M.; Ferrante, A.; Carmassi, G.; Scatena, G.; Vernieri, P.; Mensuali-Sodi, A. Survive or die? A molecular insight into salt-dependant signaling network. Env. Exp. Bot. 2016, 132, 140–153. [Google Scholar] [CrossRef]
- Valluru, R.; Davies, W.J.; Reynolds, M.P.; Dodd, I.C. Foliar abscisic acid-to-ethylene accumulation and response regulate shoot growth sensitivity to mild drought in wheat. Front. Plant Sci. 2016, 7, 461. [Google Scholar] [CrossRef] [PubMed]
- Gururani, M.A.; Venkatesh, J.; Tran, L.S.P. Regulation of photosynthesis during abiotic stress-induced photoinhibition. Mol. Plant 2015, 8, 1304–1320. [Google Scholar] [CrossRef] [PubMed]
- Iqbal, N.; Khan, N.A.; Ferrante, A.; Trivellini, A.; Francini, A.; Khan, M.I.R. Ethylene Role in Plant Growth, Development and Senescence: Interaction with Other Phytohormones. Front. Plant Sci. 2017, 8, 475. [Google Scholar] [CrossRef] [PubMed]
- Tossi, V.; Lamattina, L.; Cassia, R. An increase in the concentration of abscisic acid is critical for nitric oxide-mediated plant adaptive responses to UV-B irradiation. New Phytol. 2009, 181, 871–879. [Google Scholar] [CrossRef]
- Zhu, S.Q.; Chen, M.W.; Ji, B.H.; Jiao, D.M.; Liang, J.S. Roles of xanthophylls and exogenous ABA in protection against NaCl- induced photodamage in rice (Oryza sativa L) and cabbage (Brassica campestris). J. Exp. Bot. 2011, 62, 4617–4625. [Google Scholar] [CrossRef]
- Barickman, T.C.; Kopsell, D.A.; Sams, C.E. Abscisic acid increases carotenoid and chlorophyll concentrations in leaves and fruit of two tomato genotypes. J. Am. Soc. Hort. Sci. 2014, 139, 261–266. [Google Scholar] [CrossRef]
- Mackerness, S.A.H.; Surplus, S.L.; Blake, P.C.; John, F.; Buchanan-Wollaston, V.; Jordan, B.R.; Thomas, B. Ultraviolet-B-induced stress and changes in gene expression in Arabidopsis thaliana: Role of signaling pathways controlled by jasmonic acid, ethylene and reactive oxygen species. Plant Cell Env. 1999, 22, 1413–1423. [Google Scholar] [CrossRef]
- Nara, A.; Takeuchi, Y. Ethylene evolution from tobacco leaves irradiated with UV-B. J. Plant Res. 2002, 115, 247–253. [Google Scholar] [CrossRef]
- McLeod, A.R.; Fry, S.C.; Loake, G.J.; Messenger, D.J.; Reay, D.S.; Smith, K.A.; Yun, B.W. Ultraviolet radiation drives methane emissions from terrestrial plant pectins. New Phytol. 2008, 180, 124–132. [Google Scholar] [CrossRef] [PubMed]
- Khan, M.I.R.; Khan, N.A. Ethylene reverses photosynthetic inhibition by nickel and zinc in mustard through changes in PS II activity, photosynthetic nitrogen use efficiency, and antioxidant metabolism. Protoplasma 2014, 251, 1007–1019. [Google Scholar] [CrossRef] [PubMed]
- Ferrante, A.; Trivellini, A.; Malorgio, F.; Carmassi, G.; Vernieri, P.; Serra, G. Effect of seawater aerosol on leaves of six plant species potentially useful for ornamental purposes in coastal areas. Sci. Hortic. 2011, 128, 332–341. [Google Scholar] [CrossRef]
- Liu, H.; Wang, Y.; Xu, J.; Su, T.; Liu, G.; Ren, D. Ethylene signaling is required for the acceleration of cell death induced by the activation of AtMEK5 in Arabidopsis. Cell Res. 2008, 18, 422–432. [Google Scholar] [CrossRef] [PubMed]


© 2019 by the authors. Licensee MDPI, Basel, Switzerland. This article is an open access article distributed under the terms and conditions of the Creative Commons Attribution (CC BY) license (http://creativecommons.org/licenses/by/4.0/).