Article

MaxEnt-Based Distribution Modeling of the Invasive Species Phragmites australis Under Climate Change Conditions in Iraq

by
Nabaz R. Khwarahm
Department of Biology, College of Education, University of Sulaimani, Sulaimani 334, Kurdistan Region, Iraq
Plants 2025, 14(5), 768; https://doi.org/10.3390/plants14050768
Submission received: 15 February 2025 / Revised: 26 February 2025 / Accepted: 28 February 2025 / Published: 2 March 2025
(This article belongs to the Section Plant Response to Abiotic Stress and Climate Change)

Abstract

Phragmites australis (common reed), a recently introduced invasive species in Iraq, has swiftly established itself as a vigorous perennial plant, significantly impacting the biodiversity and ecosystem functions of Iraqi ecoregions with alarming consequences. There is an insufficient understanding of both the current distribution and possible future trends under climate change scenarios. Consequently, this study seeks to model the current and future potential distribution of this invasive species in Iraq using machine learning techniques (i.e., MaxEnt) alongside geospatial tools integrated within a GIS framework. Land-cover features, such as herbaceous zones, wetlands, annual precipitation, and elevation, emerged as optimal conditioning factors for supporting the species’ invasiveness and habitat through vegetation cover and moisture retention. These factors collectively contributed by nearly 85% to the distribution of P. australis in Iraq. In addition, the results indicate a net decline in high-suitability habitats for P. australis under both the SSP126 (moderate mitigation; 5.33% habitat loss) and SSP585 (high emissions; 6.74% habitat loss) scenarios, with losses concentrated in southern and northern Iraq. The model demonstrated robust reliability, achieving an AUC score of 0.9 ± 0.012, which reflects high predictive accuracy. The study area covers approximately 430,632.17 km2, of which 64,065.66 km2 (14.87% of the total region) was classified as the optimal habitat for P. australis. While climate projections indicate an overall decline (i.e., SSP126 (5.33% loss) and SSP585 (6.74% loss)) in suitable habitats for P. australis across Iraq, certain localized regions may experience increased habitat suitability, reflecting potential gains (i.e., SSP126 (3.58% gain) and SSP585 (1.82% gain)) in specific areas. Policymakers should focus on regions with emerging suitability risks for proactive monitoring and management. Additionally, areas already infested by the species require enhanced surveillance and containment measures to mitigate ecological and socioeconomic impacts.

1. Introduction

Invasive species are organisms that are introduced, either intentionally or accidentally, into ecosystems outside their natural range through environmental factors or human activities [1]. These species can adapt, spread aggressively, and dominate new habitats, leading to the displacement or extinction of native flora and fauna and causing significant ecological imbalances [2,3]. To address the threats posed by non-native species, analyzing their spatial spread is critical. The expansion of these organisms is shaped by interspecies dynamics, environmental adaptability, and variables like climate patterns, soil composition, water systems, and landscape features, with temperature and precipitation playing a pivotal role [4]. The Sixth Assessment Report of the Intergovernmental Panel on Climate Change (IPCC) highlights that average planetary temperatures have risen by nearly 1.2 °C over the last century due to human-driven warming, with projections indicating continued increases [5]. Furthermore, local and regional studies have reported that certain areas may experience varying degrees of temperature increases in the coming decades [6,7,8,9]. As such, evidence indicates that global climate change may enhance the resilience of invasive populations, enabling them to colonize broader territories and establish more dominant communities [10,11,12]. Investigating how shifting climatic conditions influence the future ranges of invasive plant species provides vital insights for designing science-backed strategies to protect ecosystems and biodiversity. Iraq has experienced significant environmental shifts linked to shifting climatic conditions, marked by frequent water shortages [13], destructive wildfires [14], land-use and land-cover change [15,16], reduced native species populations [17,18], and the increased emergence of illnesses [19]. Understanding how shifting climate patterns alter invasive species movement and developing strategies to safeguard woodland areas from their impacts is vital. Therefore, examining the causal relationship between environmental drivers and alien invasive plant species is key to evaluating broader ecosystem stability and resilience.
Phragmites australis is a persistent water-based grass found globally, often forming dense, single-species clusters in riverbanks and marsh ecosystems [20,21]. Recognized as an aggressive colonizer, it disrupts natural habitats in coastal zones and marshlands, though it adapts to semi-arid conditions [21]. P. australis aggressively outcompetes native plants for resources like moisture and soil nutrients. Thriving in shallow waters and deeper aquatic zones, it encroaches on shorelines and submerged areas. In regions like Iraq, environmental shifts and water scarcity have amplified its dominance in protected wetlands and semi-wet areas, where it exhibits remarkable salt resistance and adaptability to fluctuating hydration levels [22,23]. Its proliferation in marsh systems is altering native plant and animal habitats, threatening the ecological balance. The key ecological impacts of P. australis in Iraq and globally include its tendency to form monocultures in disturbed or reflooded marshes [24]. These dense stands often reduce plant diversity by outcompeting native vegetation [3,25]. Conversely, the species’ extensive root system stabilizes soil and mitigates erosion [22,23]. However, its high evapotranspiration rates may lower local water tables, though this effect remains poorly documented in Iraq. Socioeconomically, while local communities traditionally use P. australis for constructing homes, boats, and handicrafts, its overgrowth can impede fishing, navigation, and agricultural practices by blocking irrigation channels.
Previous studies in Iraq on P. australis have focused on measuring heavy metal uptake by the species [26,27] and identifying the optimal conditions for biogas production [28]. Studies on the spatial distribution of P. australis in Iraq are non-existent or scant; consequently, this study aims to fill this research gap. Its findings provide essential foundational data for the further investigation of alien invasive species. In this context, management actions and interventions targeting the most vulnerable landscapes could be implemented more effectively. Currently, Iraq’s approach to addressing non-native and invasive species lacks sufficient priority, and is further complicated by a limited understanding of their geographical distribution. Urgent and comprehensive research is essential to evaluate the spread of P. australis and the challenges posed by its proliferation to native biodiversity and ecosystem stability.
Species distribution models (SDMs), are extensively employed to evaluate the effects of environmental conditions on alien invasive species. For instance, these models utilize climatic, topographic, and edaphic drivers to estimate ecological niches under future environmental scenarios. Among these models, the maximum entropy algorithm (MaxEnt) has emerged as a prominent machine learning algorithm for simulating species–environment relationships due to its capacity to handle incomplete data and produce robust predictions [29,30]. A central question in ecological research revolves around identifying the drivers that shape species presence across specific regions. Predictive models, e.g., MaxEnt, enable the exploration of relationships between target species and their ecological requirements. They also help identify key environmental conditions that influence species occurrence in defined areas. As such, this manuscript focuses on three primary objectives: (i) mapping the current distribution of P. australis in Iraq and predicting its potential habitats, (ii) modeling its future distribution patterns under global climate change scenarios using MRI-ESM2.0 (SSP126 and SSP585), and (iii) identifying the key ecological factors that most significantly influence its spatial distribution.

2. Results

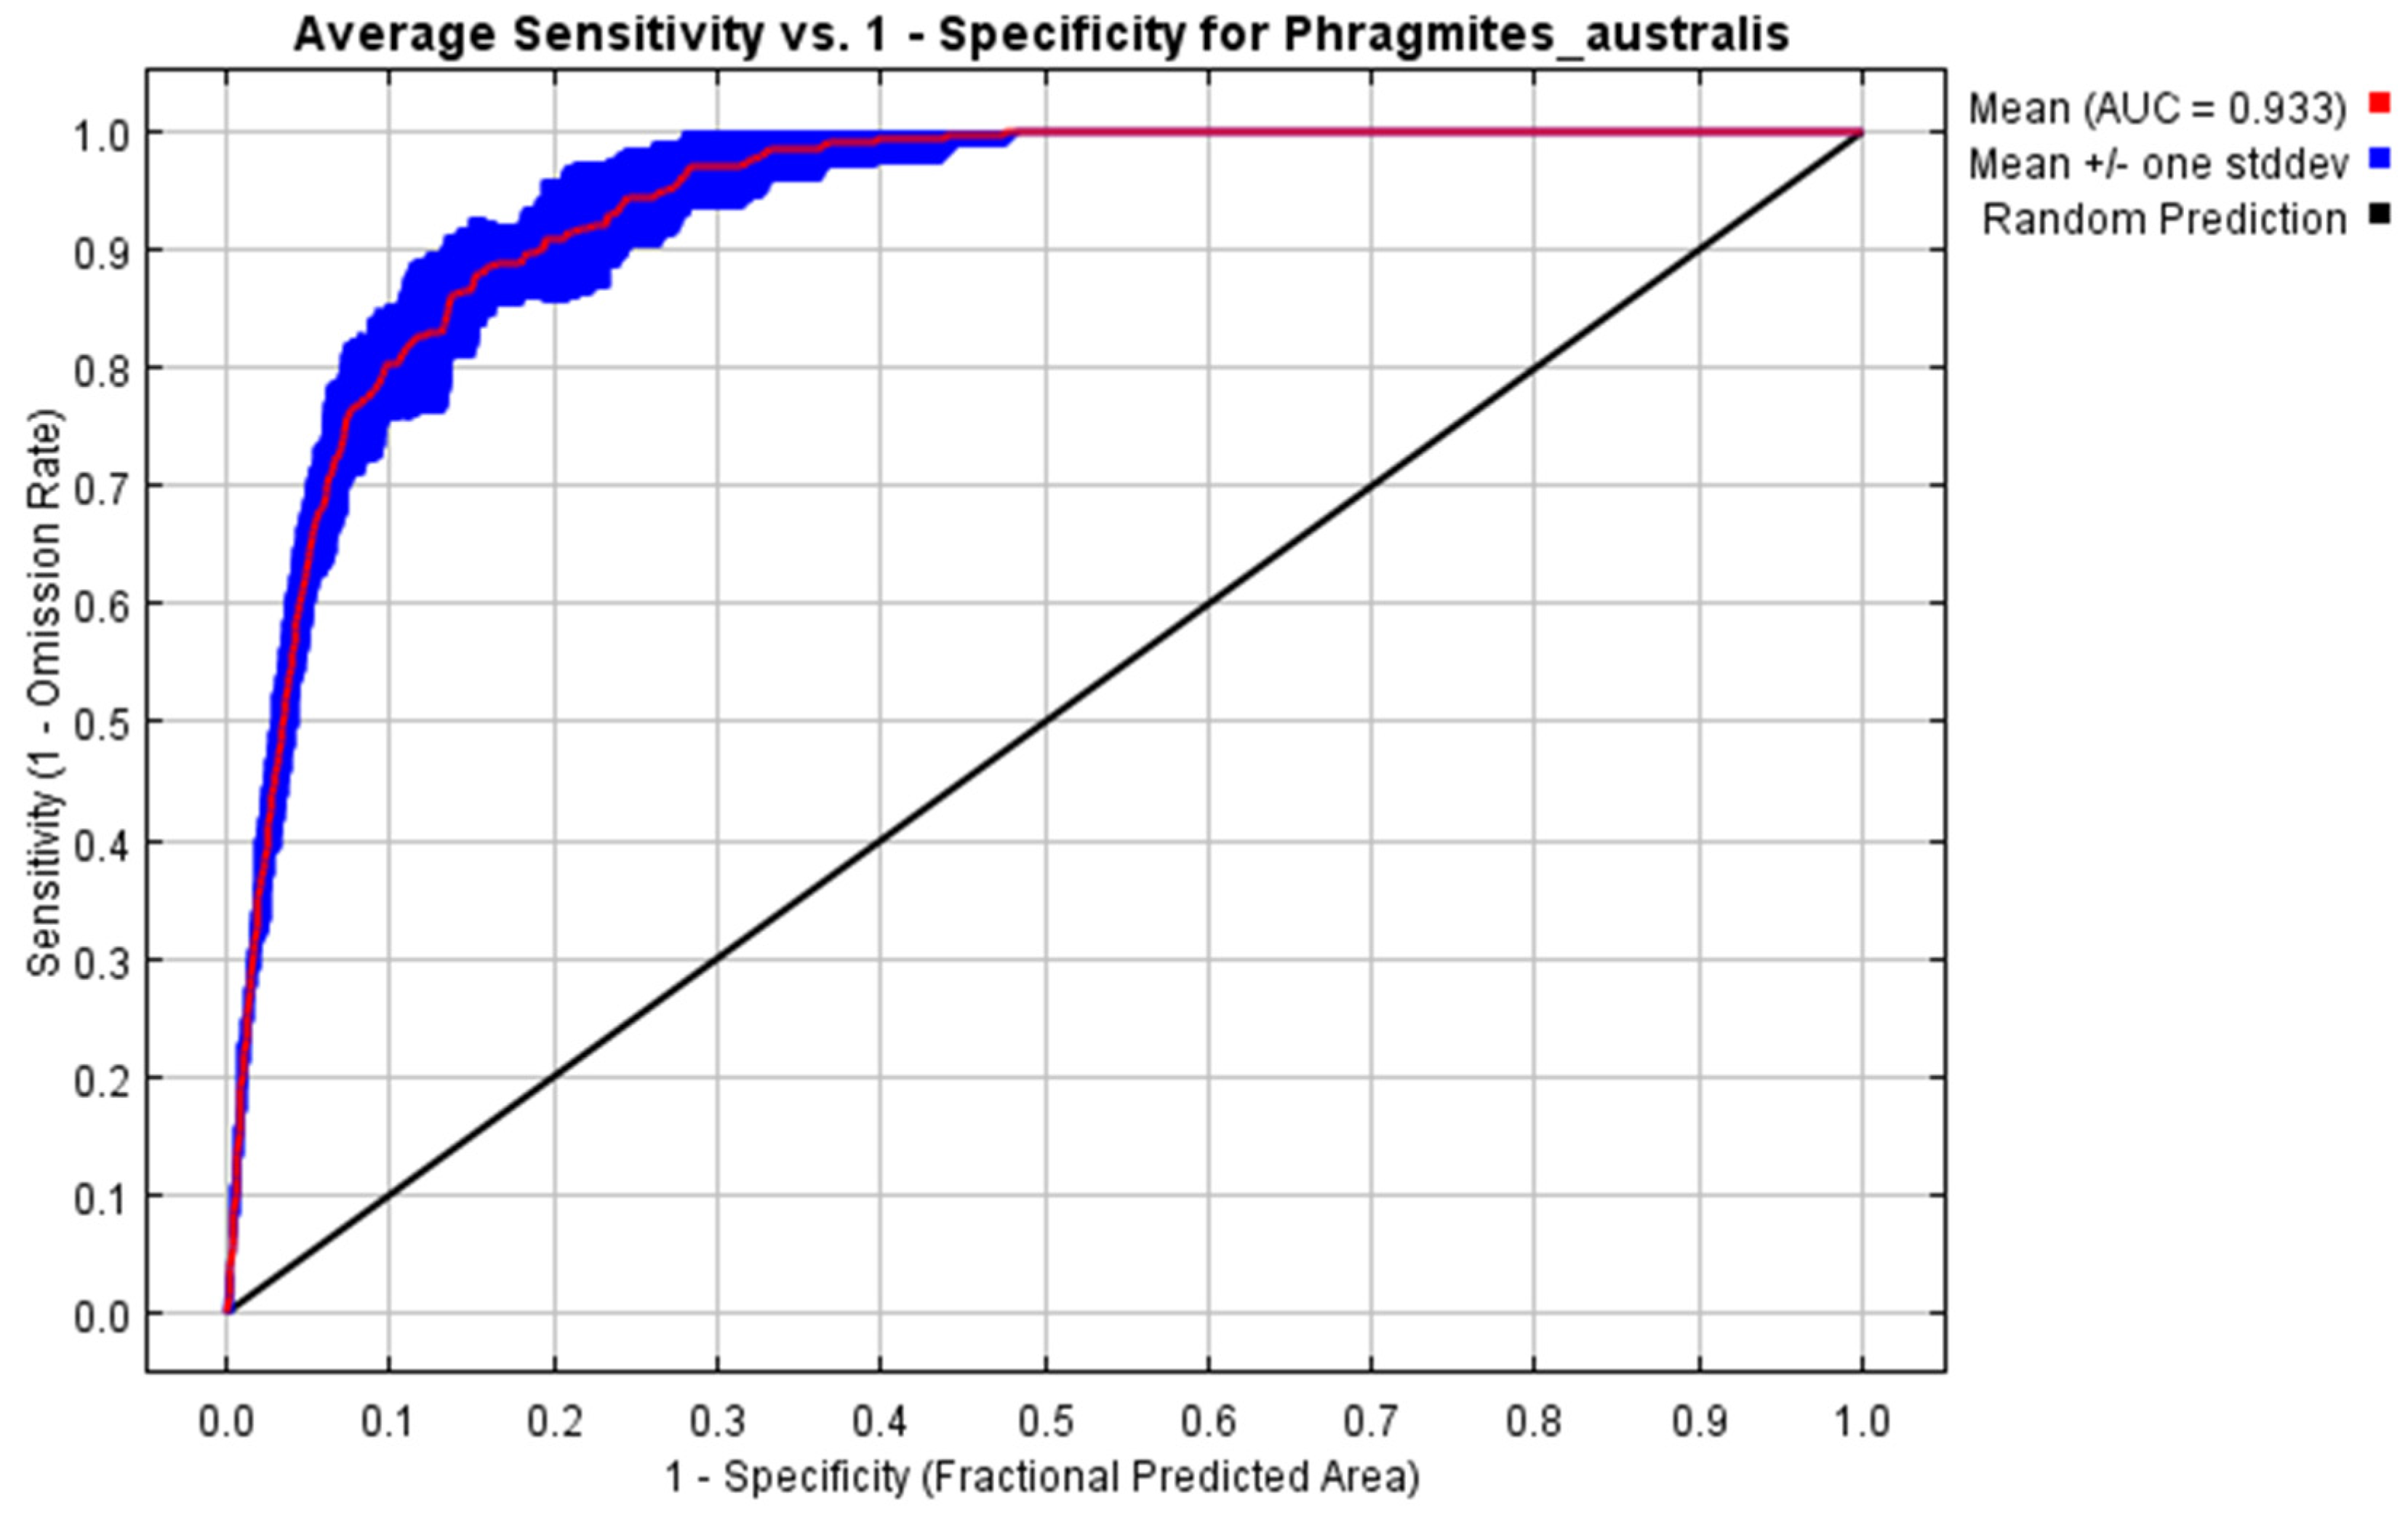
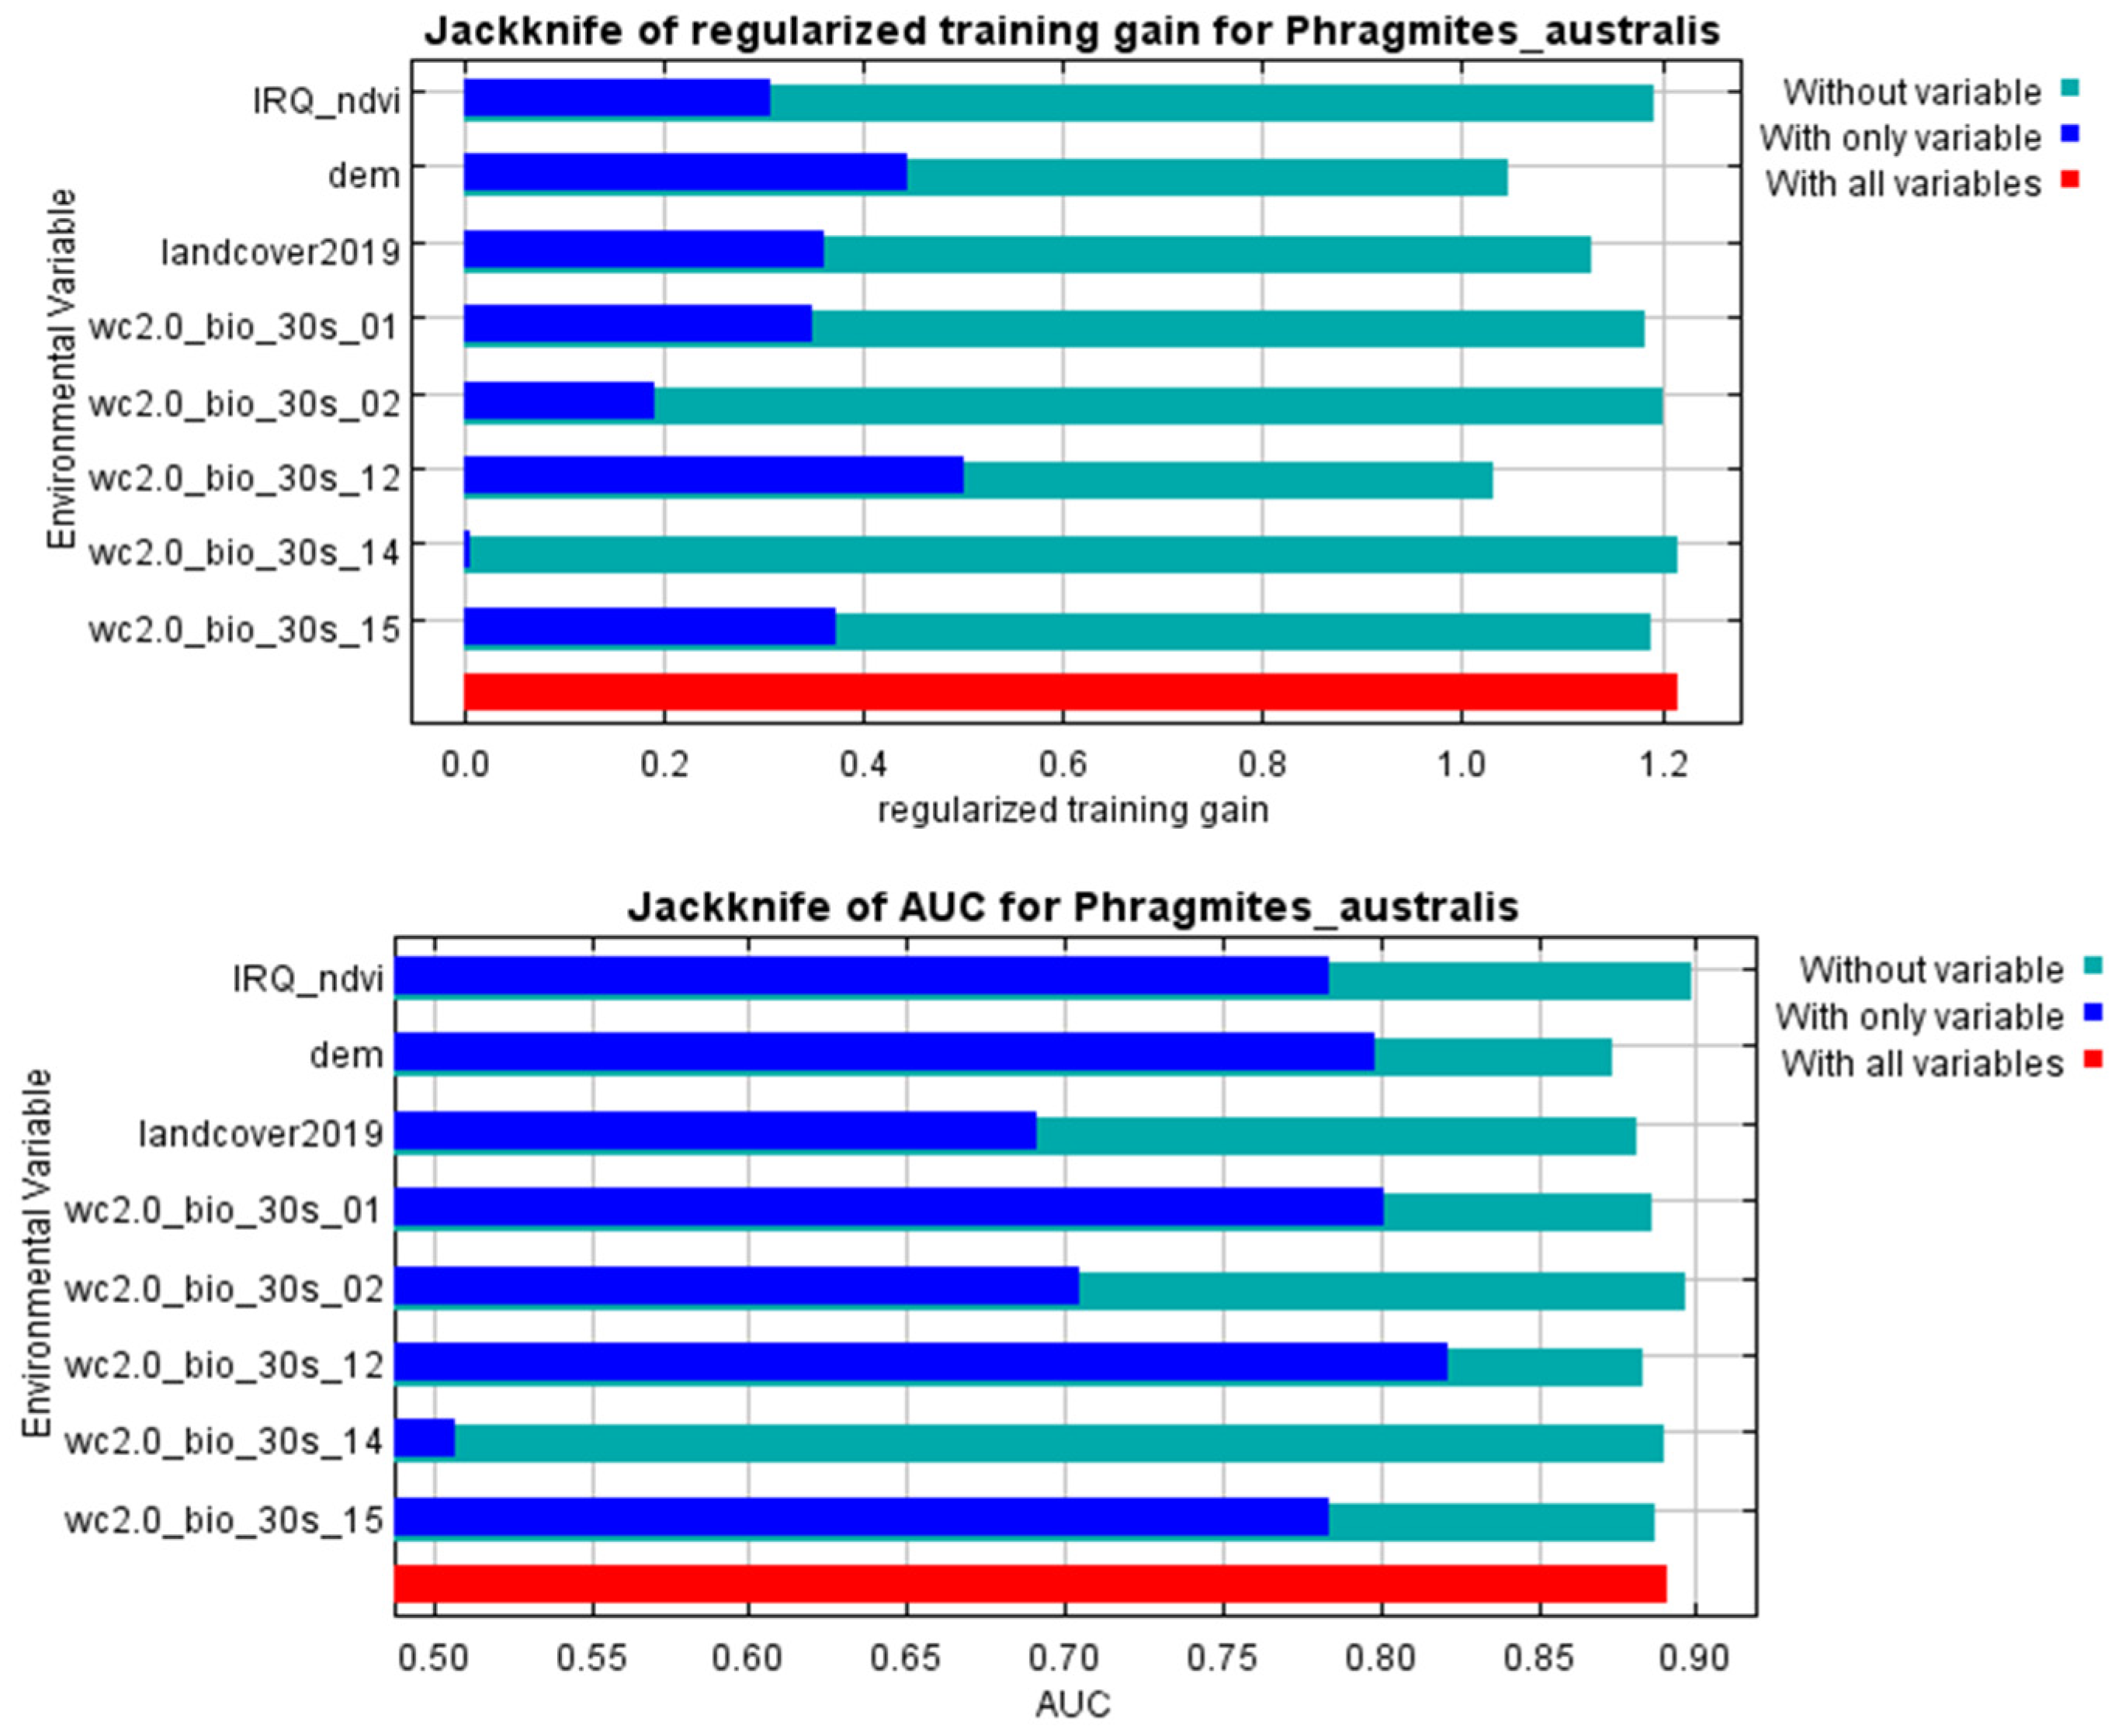
2.1. Model Performance

The assessment of habitat suitability for P. australis using the AUC–ROC metric demonstrated a strong performance in distinguishing favorable and unfavorable environments. Across repeated model iterations, the mean AUC value reached 0.9, with a narrow deviation of ±0.012, reflecting consistent reliability in the analysis. These outcomes, derived from 10 computational trials, highlight the model’s precision in evaluating ecological niches for P. australis in Iraq (Figure 1).

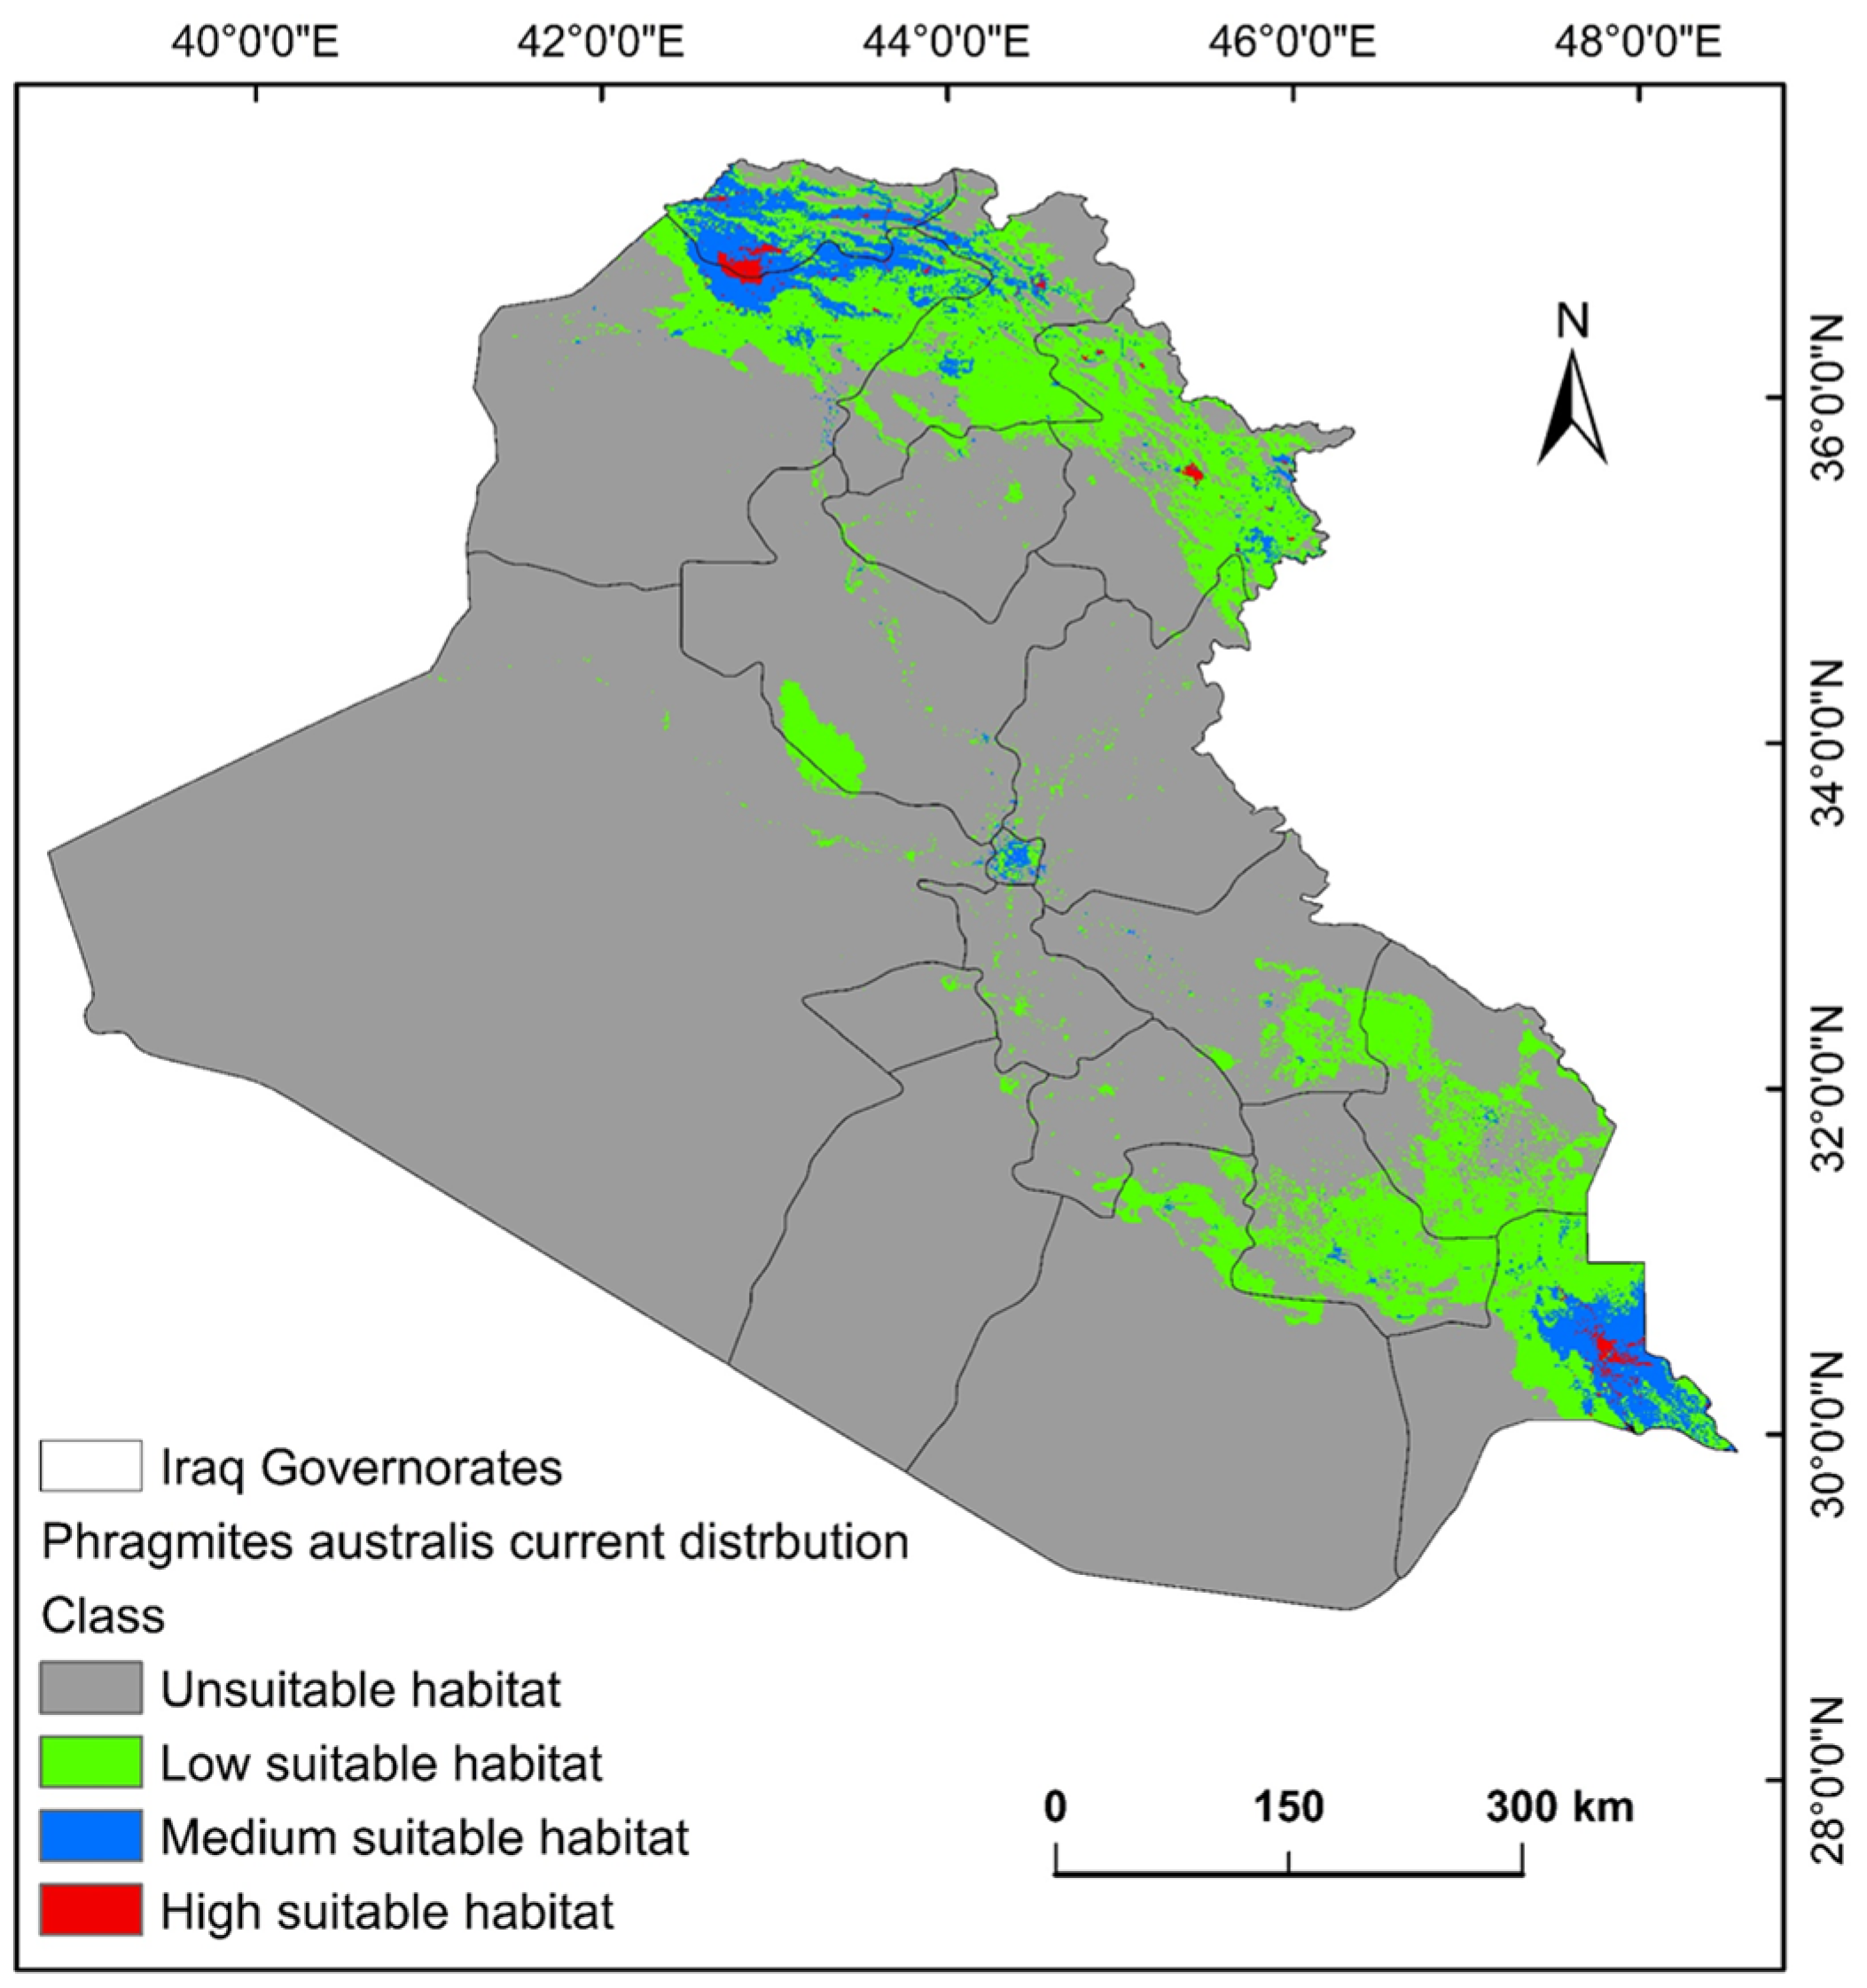
2.2. Suitability Distribution of P. australis and Conditioning Factors

The ecological presence of P. australis in Iraq is shaped by a combination of environmental variables. Elevation and bio12 (annual precipitation) emerged as the predominant drivers, responsible for 33.2% and 31.7% of habitat distribution of P. australis. Secondary influences included land-cover and land-use, bio15 (precipitation seasonality), and bio1 (annual mean temperature). In addition, bio2 (mean diurnal range) and NDVI further contributed to distribution patterns, as outlined in Table 1. Cross-validation analyses using iterative testing methods reinforced these findings (Figure 2), with elevation and annual precipitation showing the strongest predictive power. In contrast, NDVI and bio14 (precipitation of driest month) exhibited a negligible influence on the habitat distribution of P. australis.

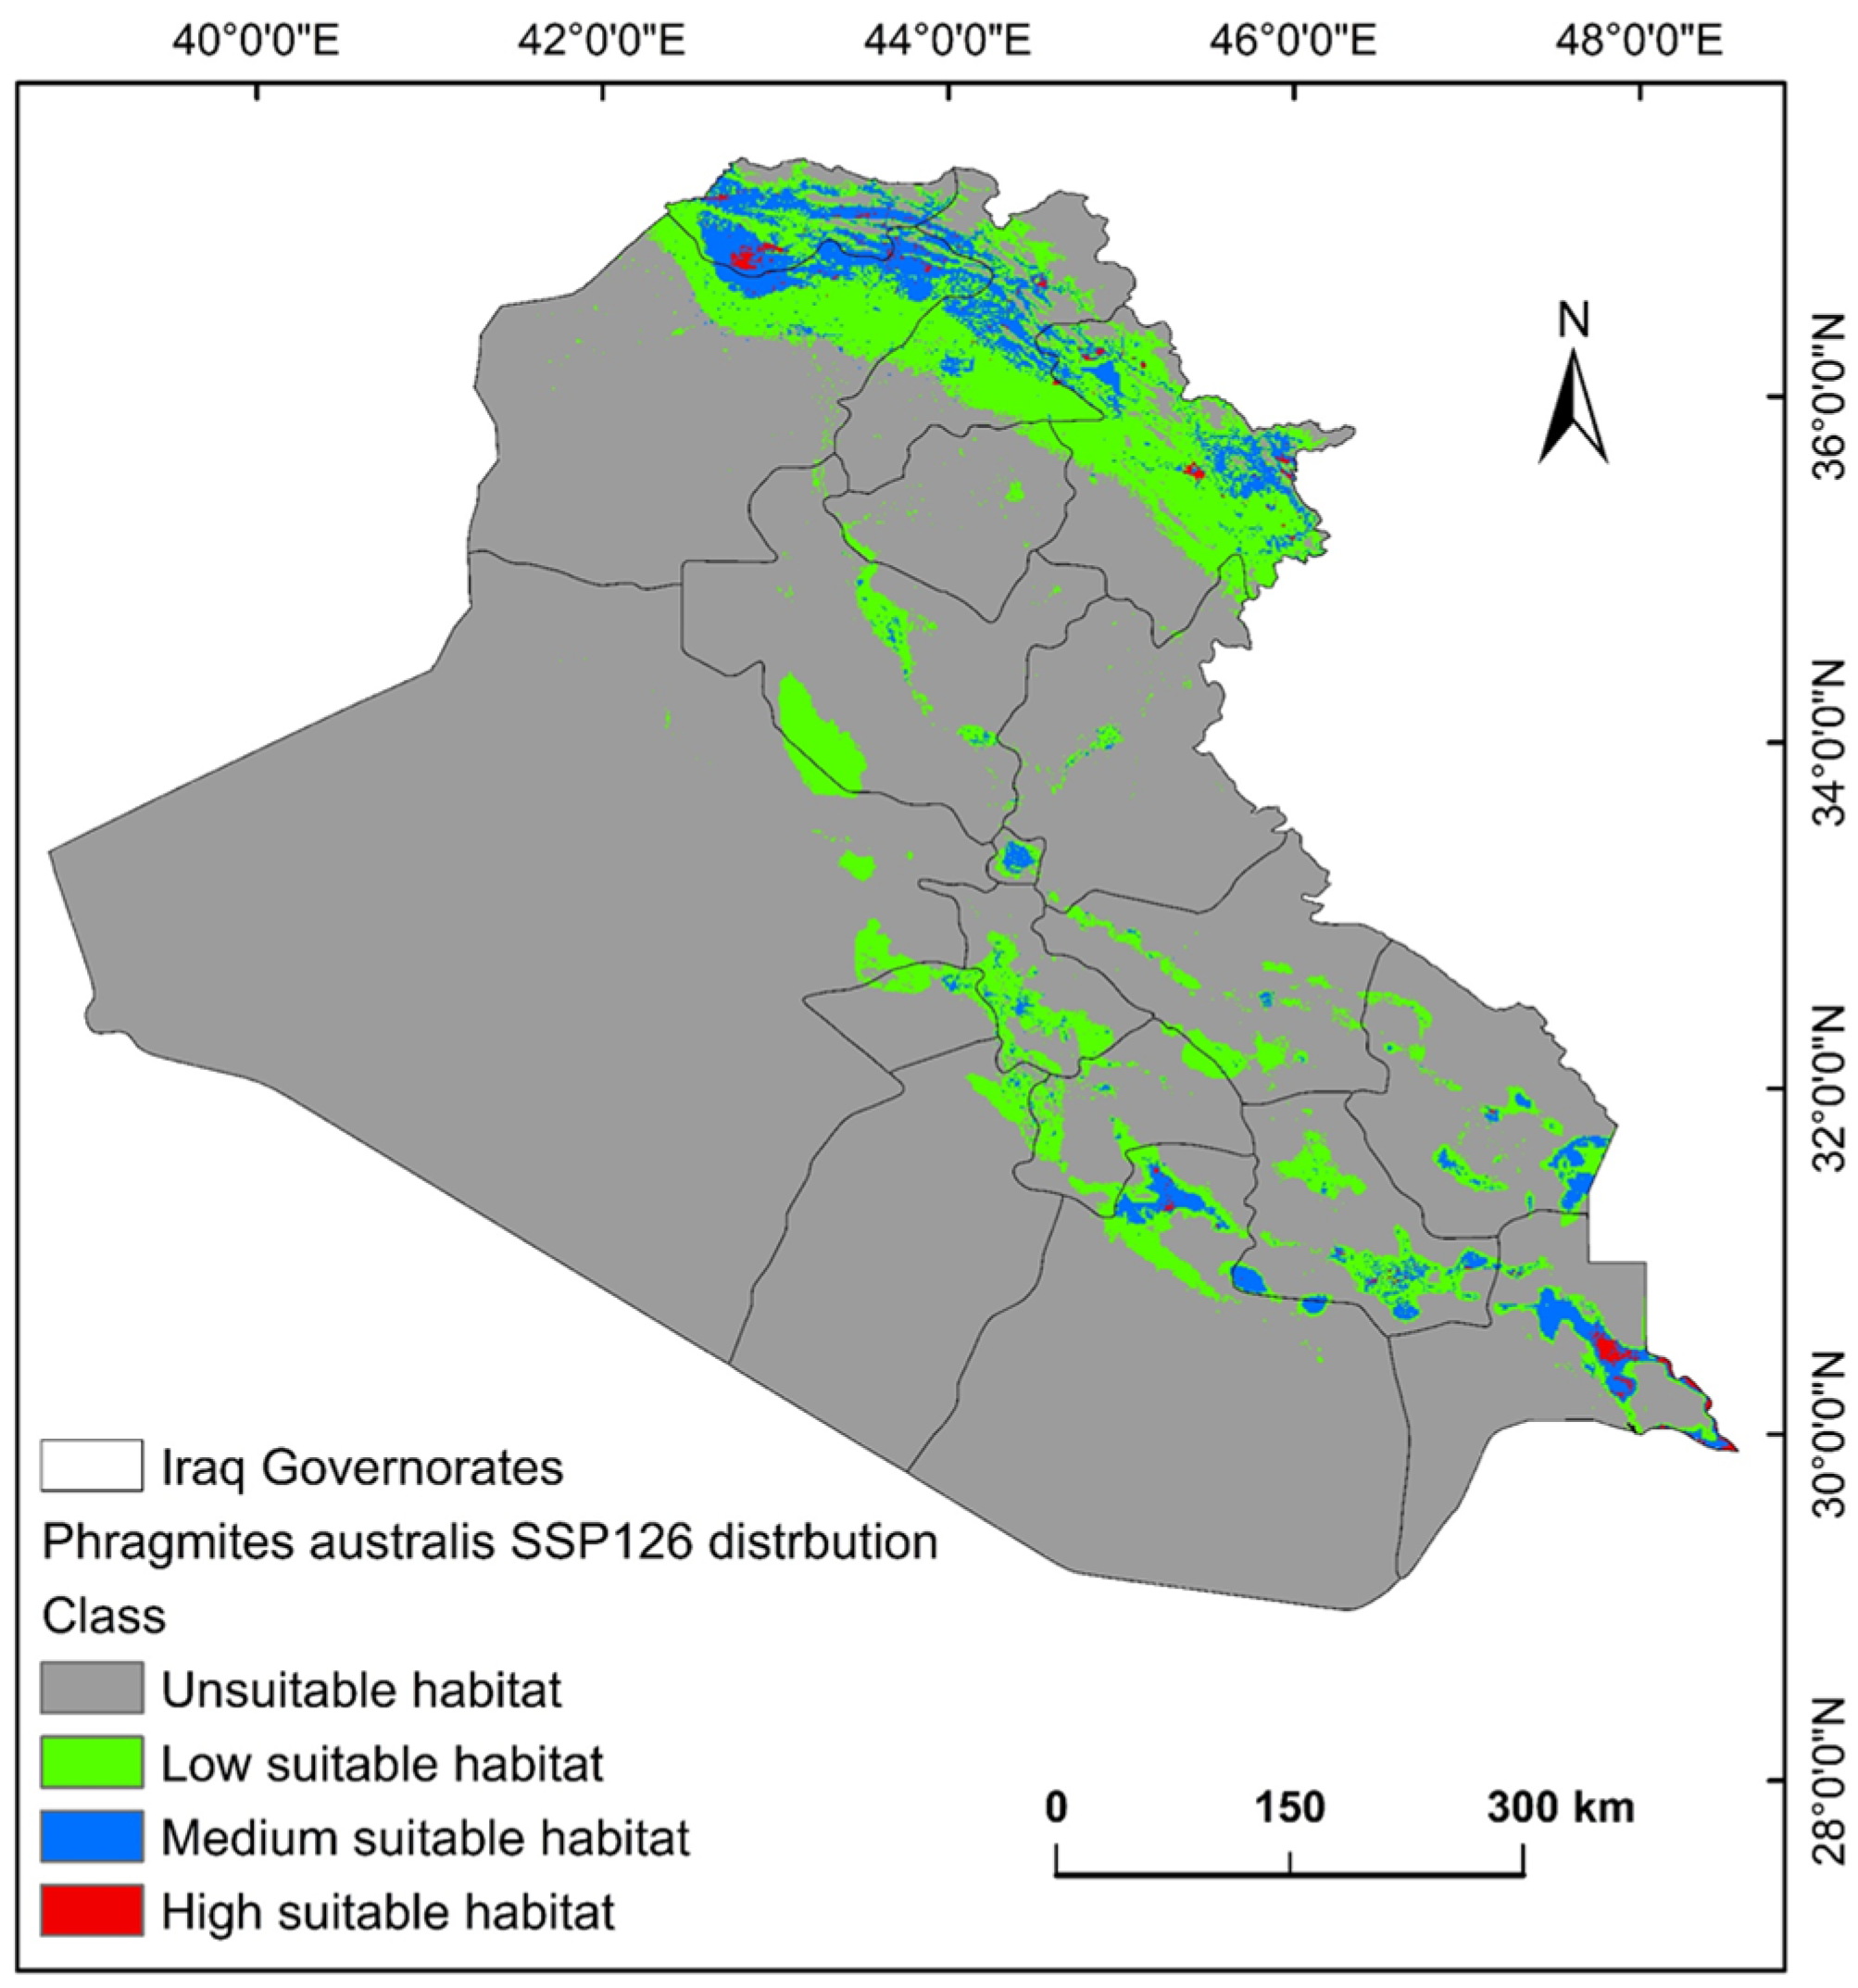
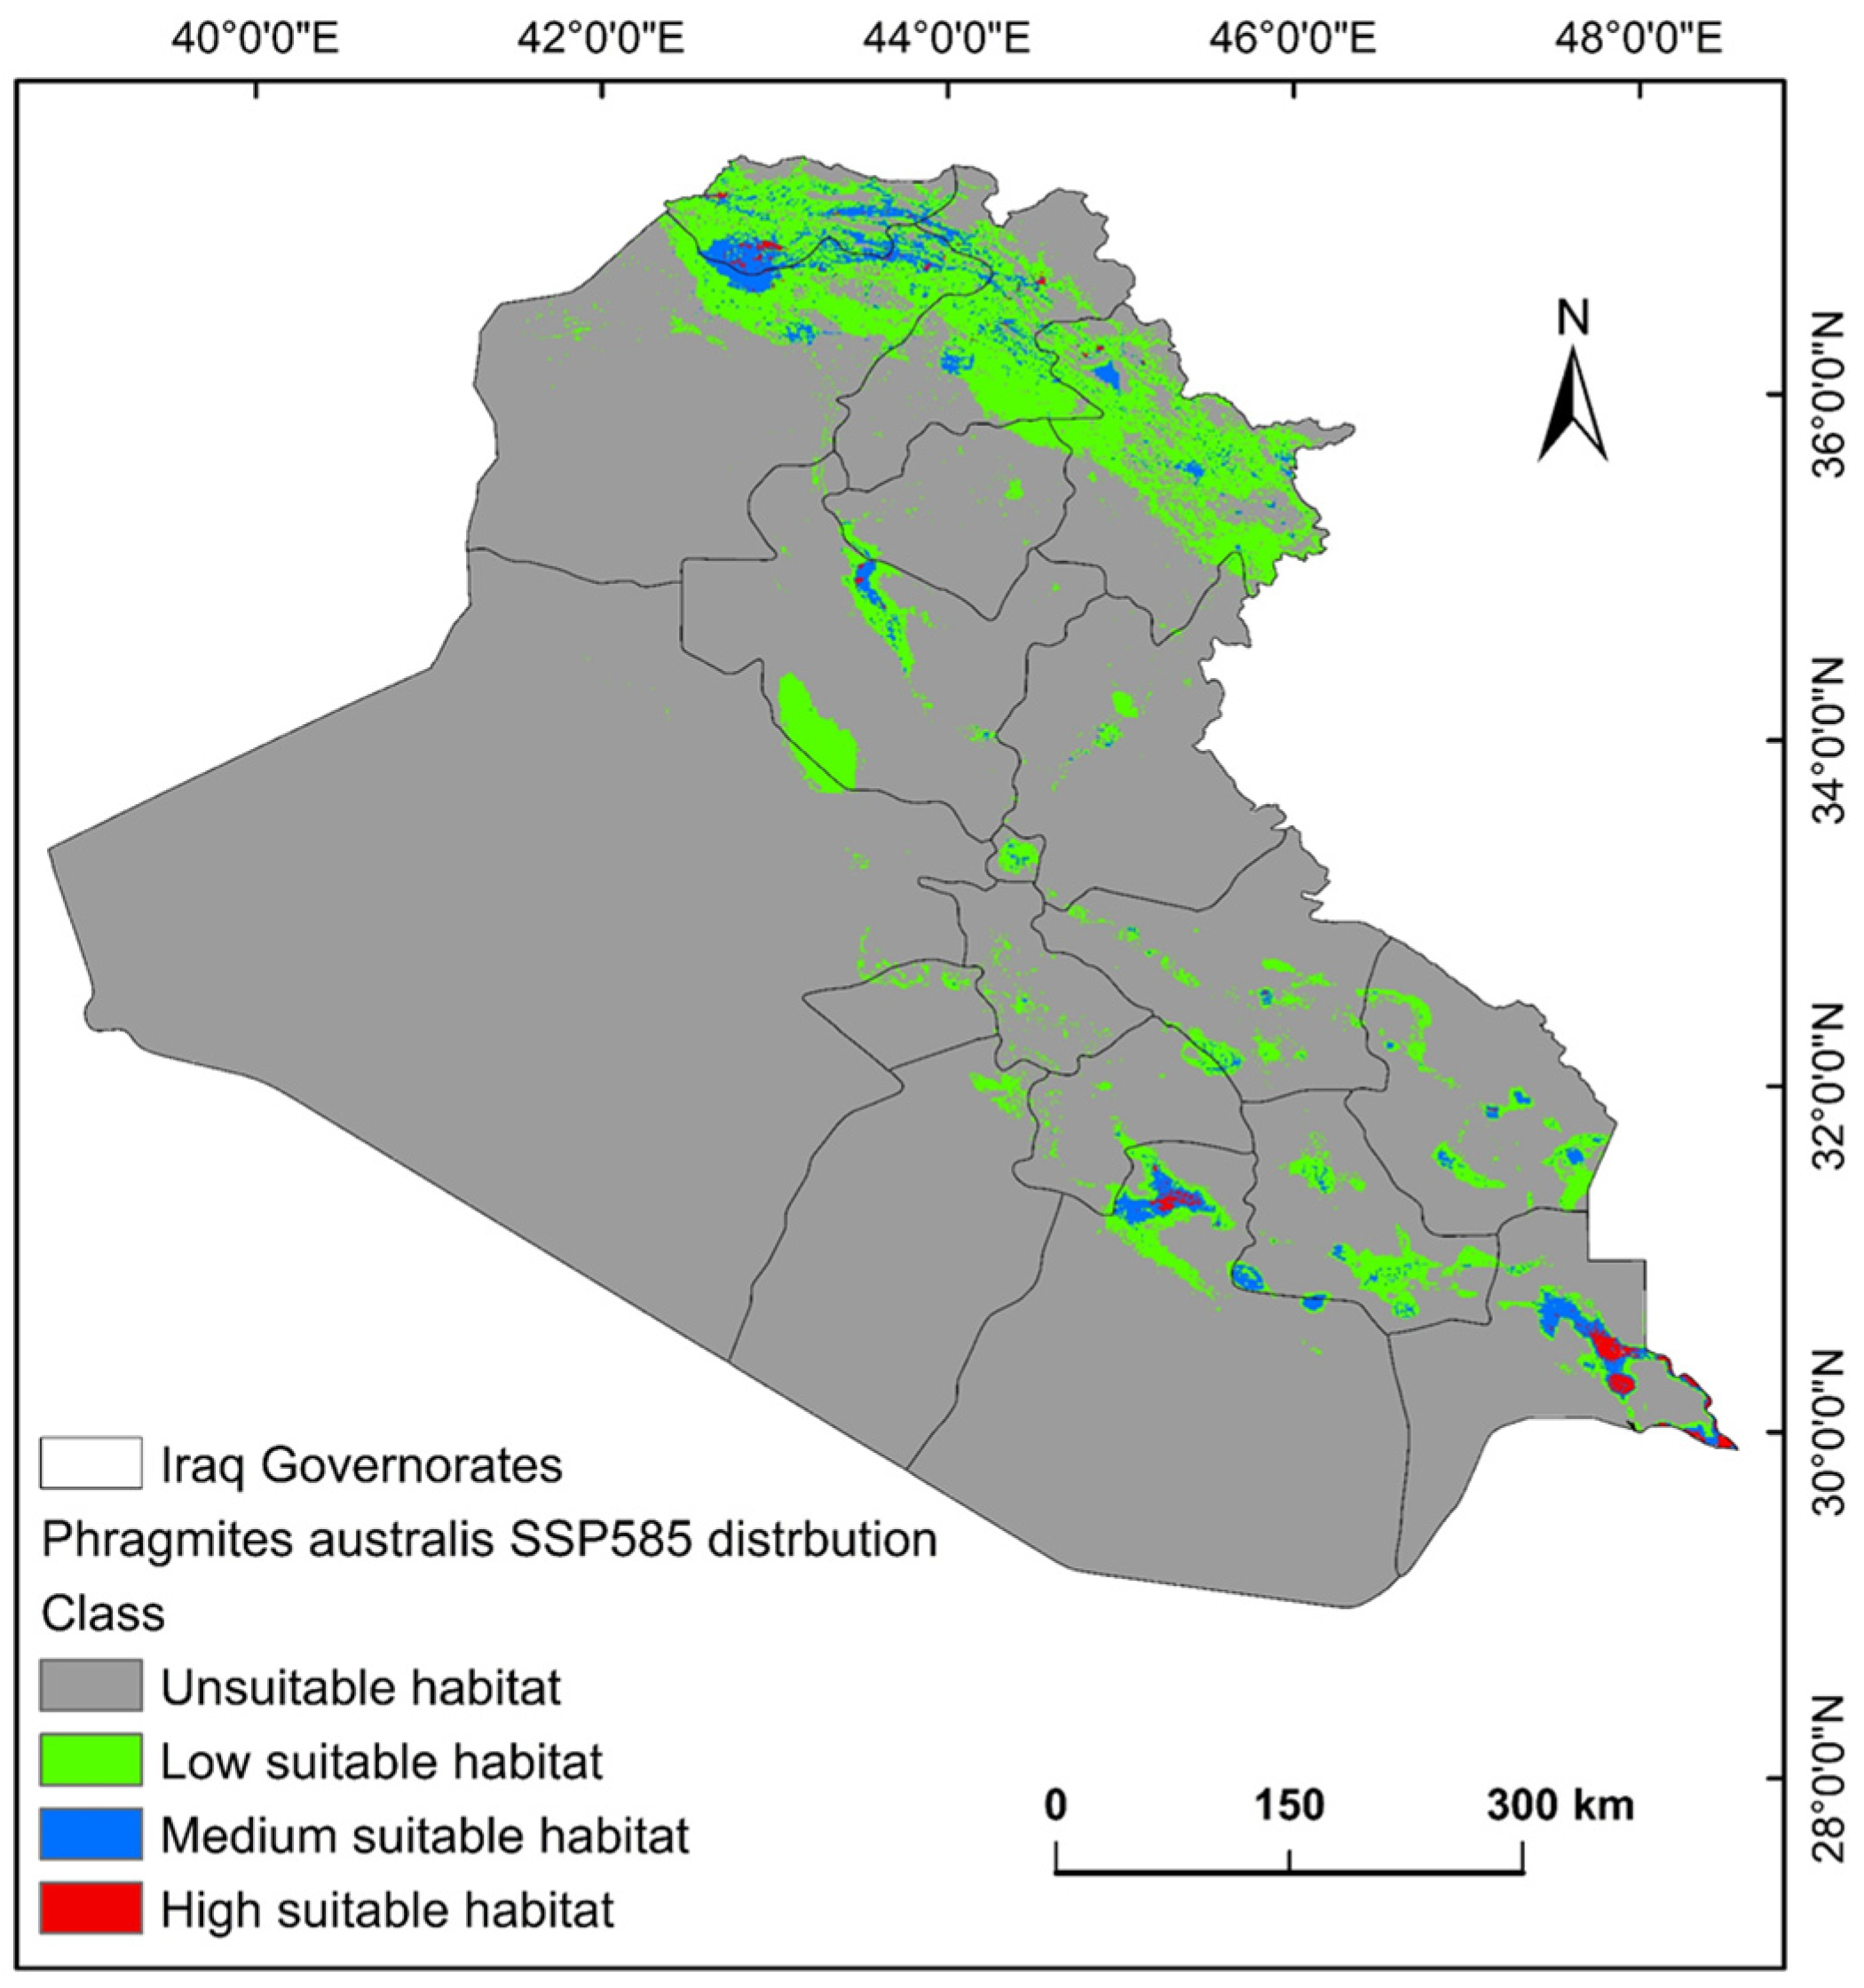
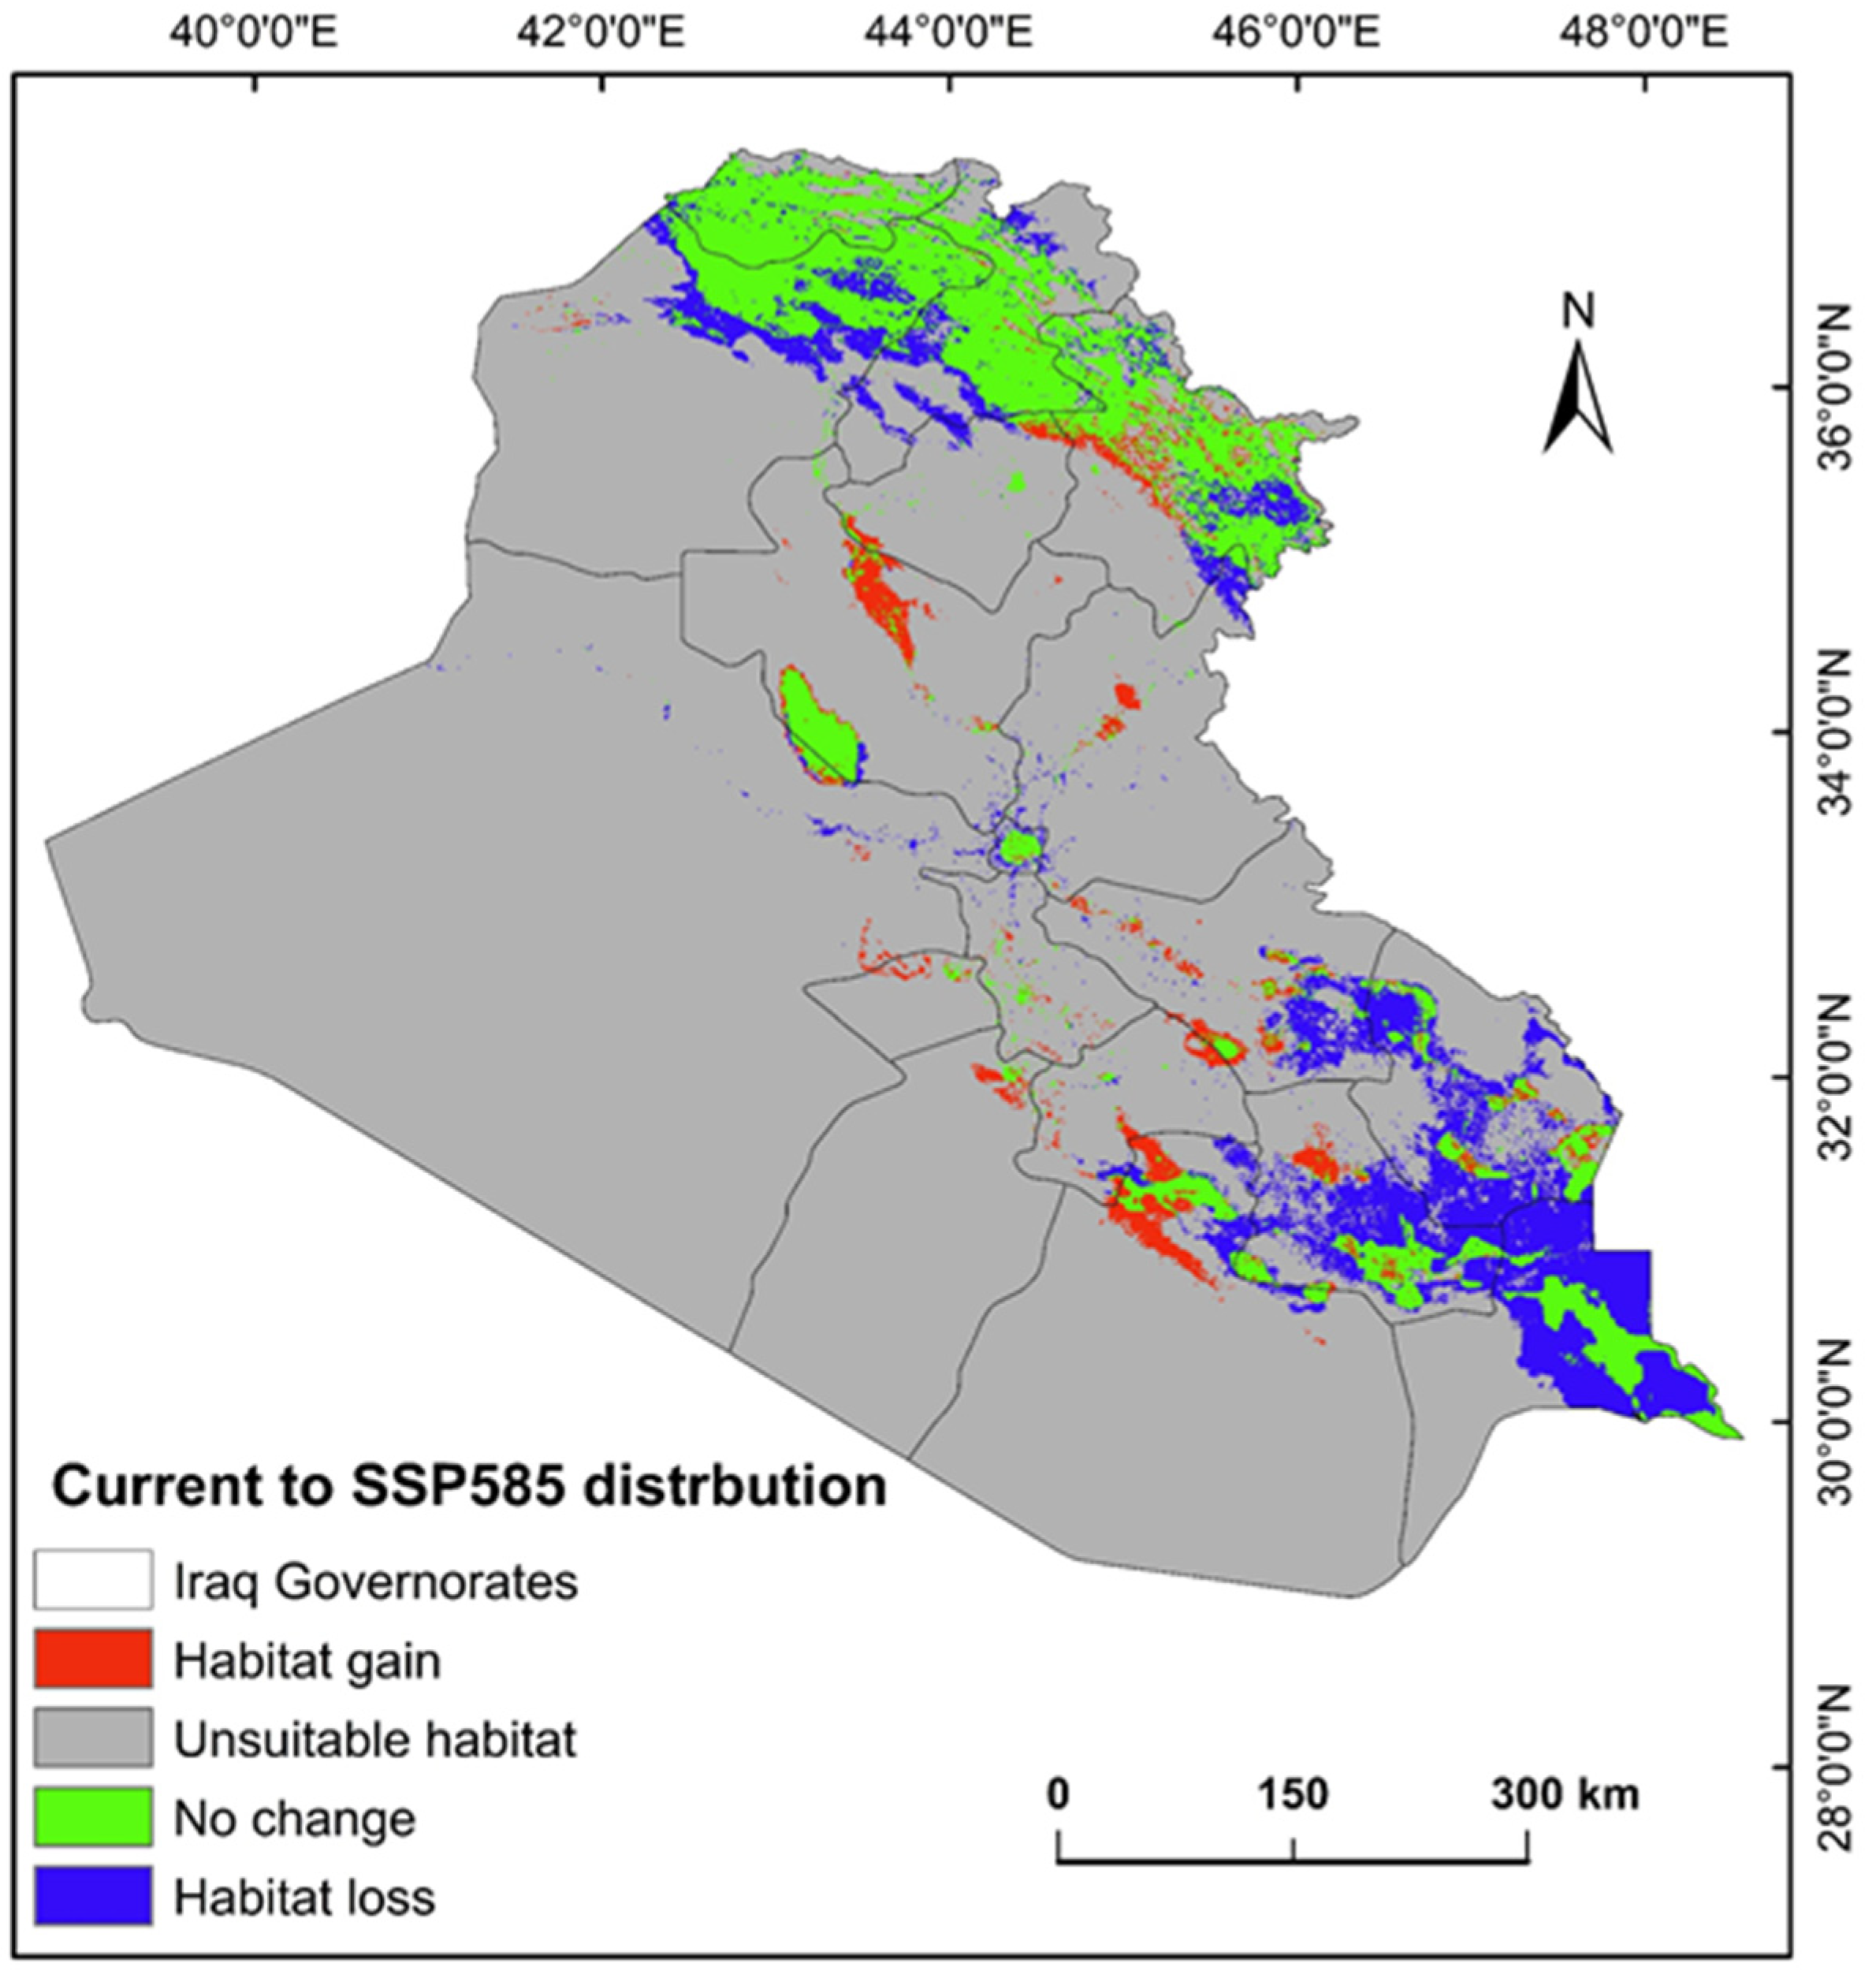
2.3. Shifts in Habitat Distribution of P. australis over Time in Iraq

The ecological conditions supporting P. australis in Iraq cover roughly 64,065.66 km2 (14.87%) of the total 43,0632.17 km2 of the national territory of Iraq. Within suitable zones, the majority (11.96% or 51,504.06 km2) were classified as low-probability regions, while moderate suitability accounted for 2.68% (11,540.41 km2), and high suitable areas constituted less than 1% (0.23% or 1021.17 km2). The risk zones for P. australis thriving are concentrated in southern Iraq, particularly across the Basra province, as well as localized sections of the Duhok, Erbil, and Sulaimani provinces in the north. Areas with moderate risk span parts of Duhok, Sulaimani, Erbil, Baghdad, and along scattered pockets of the Tigris and Euphrates waterways (Figure 3, Figure 4 and Figure 5). Conversely, extensive northern, northeastern, and western territories, including Anbar province, were deemed inhospitable for sustaining P. australis (Table 2). Future trends under the SSP126_2041–2060 (moderate mitigation) and SSP585_2041–2060 (high emissions) climate scenarios indicate a projected decline in suitable habitat zones for P. australis across Iraq. Specifically, high-suitability habitats are expected to diminish from their current coverage of 0.24% (1021.18 km2) to 0.23% (1008.66 km2) under SSP126 and 0.21% (923.09 km2) under SSP585 by mid-century. This contraction reflects a broader pattern of habitat degradation under intensified climatic stressors. Medium- and low-suitability zones follow analogous trajectories, with reductions in both spatial extent and ecological viability, as detailed in Table 2 and Table 3. Spatially, these shifts manifest as habitat losses and habitat gains, redistributing the species’ range across Iraq. For instance, P. australis is projected to recede from historically suitable areas in the south and north, while dispersing to newly viable regions in the central and northeastern parts of the country. Under the SSP126 scenario, habitat gain is estimated at 3.58% (15,403.22 km2), compared to a more modest 1.82% (7823.69 km2) under SSP585. Conversely, habitat loss is far more pronounced, reaching 5.33% (22,934.75 km2), under SSP126 and escalating to 6.74% (29,013.12 km2) under SSP585. These disparities highlight the disproportionate impact of higher emissions scenarios on habitat erosion. Visualizations of these spatial patterns, including maps of habitat loss, habitat gain, are provided in Table 3 and Figure 6 and Figure 7.

3. Discussion

3.1. Distribution of P. australis in Iraq

In Iraq, roughly 64,065.66 km2 (14.87%) of the whole territory offers viable conditions for P. australis. Within this habitable zone, high-risk areas or high suitable areas cover only 3994 km2 (0.9%) of the country, which are mostly located in the upper south and north (Figure 3) regions. The spatio-temporal variations are most likely due to the interesting adaptive capacity of the species to different elevations across the country. Wet regions appear conducive to the P. australis lifecycle. Identifying regions where the invasive species thrives is critical for forecasting outbreaks of invasion. P. australis survival and behavior is closely tied to localized environmental conditions, such as temperature, alongside annual precipitation (i.e., moisture levels), and land-cover in a given area. The significant contribution (nearly 85%) of precipitation, land-cover, and elevation to the distribution of P. australis in Iraq is demonstrated by this study. Herbaceous zones and wetlands emerged as optimal habitats, supporting the species’ invasiveness through vegetation cover and moisture retention. These findings, partly underscore the vulnerability of P. australis to climate change while highlighting its resilience through habitat redistribution. The interplay of CO₂ fertilization, temperature stress, and hydrological dynamics will shape its ecological impact in Iraq. By synthesizing insights from global case studies, this study advocates for a nuanced approach that balances Phragmites invasive threats with its ecosystem benefits, leveraging adaptive strategies to safeguard both biodiversity and wetland functionality [31,32]. These findings concur with other studies in which standard bioclimatic variables and topographic features have been used [33,34]. In addition, land-use changes caused by human activities, such as coastal development and the creation of artificial shorelines, facilitate the spread of P. australis. These alterations may enable different genetic variants of the reed to mix and thrive, accelerating its expansion into new areas. Simultaneously, climate change and human-induced land modifications interact to create the ideal conditions for P. australis growth. This, in turn, makes it more challenging to protect and restore natural wetlands, which support diverse plant and animal life [35].

3.2. Habitat Loss and Gain and Climate-Driven Redistribution

The results indicate a net decline in high-suitability habitats for P. australis under both the SSP126 (moderate mitigation; 5.33% loss) and SSP585 (high emissions; 6.74% loss) scenarios, with losses concentrated in southern and northern Iraq. This aligns with global observations of invasive Phragmites retreating from regions experiencing extreme aridity or salinization, as seen in North American coastal wetlands under rising temperatures [31,36]. For instance, studies [24,37] on Great Lakes wetlands found that Phragmites dominance declines in areas with reduced freshwater inflows, mirroring this study’s projected habitat losses in southern Iraq, where water scarcity and salinity are intensifying [24]. Conversely, the dispersal of P. australis to central and northeastern Iraq likely reflects adaptive colonization in regions with moderated climatic stressors, such as higher soil moisture, a pattern observed in Mediterranean and Yangtze River estuaries under similar scenarios [37]. In contrast, the disparity in habitat gains between SSP126 (3.58%) and SSP585 (1.82%) underscores the dual role of CO2 and temperature. Elevated CO2 can enhance photosynthetic efficiency and mitigate salinity stress in Phragmites, as demonstrated in controlled phytotron experiments [31]. However, under SSP585, extreme temperature increases may counteract these benefits, accelerating evapotranspiration and soil desiccation in newly colonized areas. This aligns with findings from Chesapeake Bay wetlands, where rising temperatures suppressed CO2-driven growth gains, leading to fragmented habitat viability. This study’s findings suggest that moderate mitigation (SSP126) better supports Phragmites expansion, likely due to reduced temperature stress on the species.

3.3. Implications for Biodiversity and Limitations

The projected habitat losses in southern Iraq could destabilize wetland ecosystems where P. australis plays a dual role as an invasive species and ecological engineer. While its monocultures often reduce native plant diversity [24], Phragmites also stabilizes sediments, sequesters carbon, and buffers against erosion—services critical for Iraq’s floodplain resilience [38]. The net loss of 5.33–6.74% of habitat area under both scenarios raises concerns about trade-offs: regions losing Phragmites may face heightened erosion, while newly colonized zones could experience biodiversity declines. Similar conflicts have been documented in the Blackwater National Wildlife Refuge, where eradication efforts improved native plant recovery but compromised shoreline stability [38]. As such, adaptive management strategies are challenging, particularly in the Tigris–Euphrates basin.
Predictive ecological maps generated by MaxEnt models come with built-in limitations including, but not limited to, input climatic drivers (both current and future global climate models) and species records quality. Moreover, temporal disparities in the input data, such as LULC, NDVI, and climate variables, may introduce bias to the results (e.g., underestimating climate-driven shifts in habitat suitability). These gaps are usually minimized by checking model boundaries, thinning species data, and carefully parameterizing the algorithm used for modeling. Uncertainties may still exist despite these fixes, especially when data are scarce. The MaxEnt model is known to work well with minimal data, but its predictions still depend on how well species records match the areas being modeled. In this study, we tackled these issues by rigorously testing geographic accuracy and using representative data.

4. Materials and Methods

4.1. Study Area

Iraq (Figure 8), encompassing approximately 430,632.17 km2 in the Middle East, lies between latitudes 29° N and 38° N and longitudes 39° E and 49° E. Bordered by Turkey, Iran, Kuwait, Saudi Arabia, Jordan, and Syria, the country is geographically divided into four zones: mountainous northeastern highlands, southern marsh ecosystems, western arid plains, and central transitional plateaus bridging desert and upland areas [39]. Climatic conditions vary regionally: hyper-arid in western and southern zones, semi-arid to continental in central areas, and Mediterranean in northern mountainous regions. Winter averages 16 °C, while summer extremes exceed 43 °C during daytime, cooling to 26 °C at night. Precipitation occurs mainly from December to February, though northern highlands experience rainfall from November to April [39].

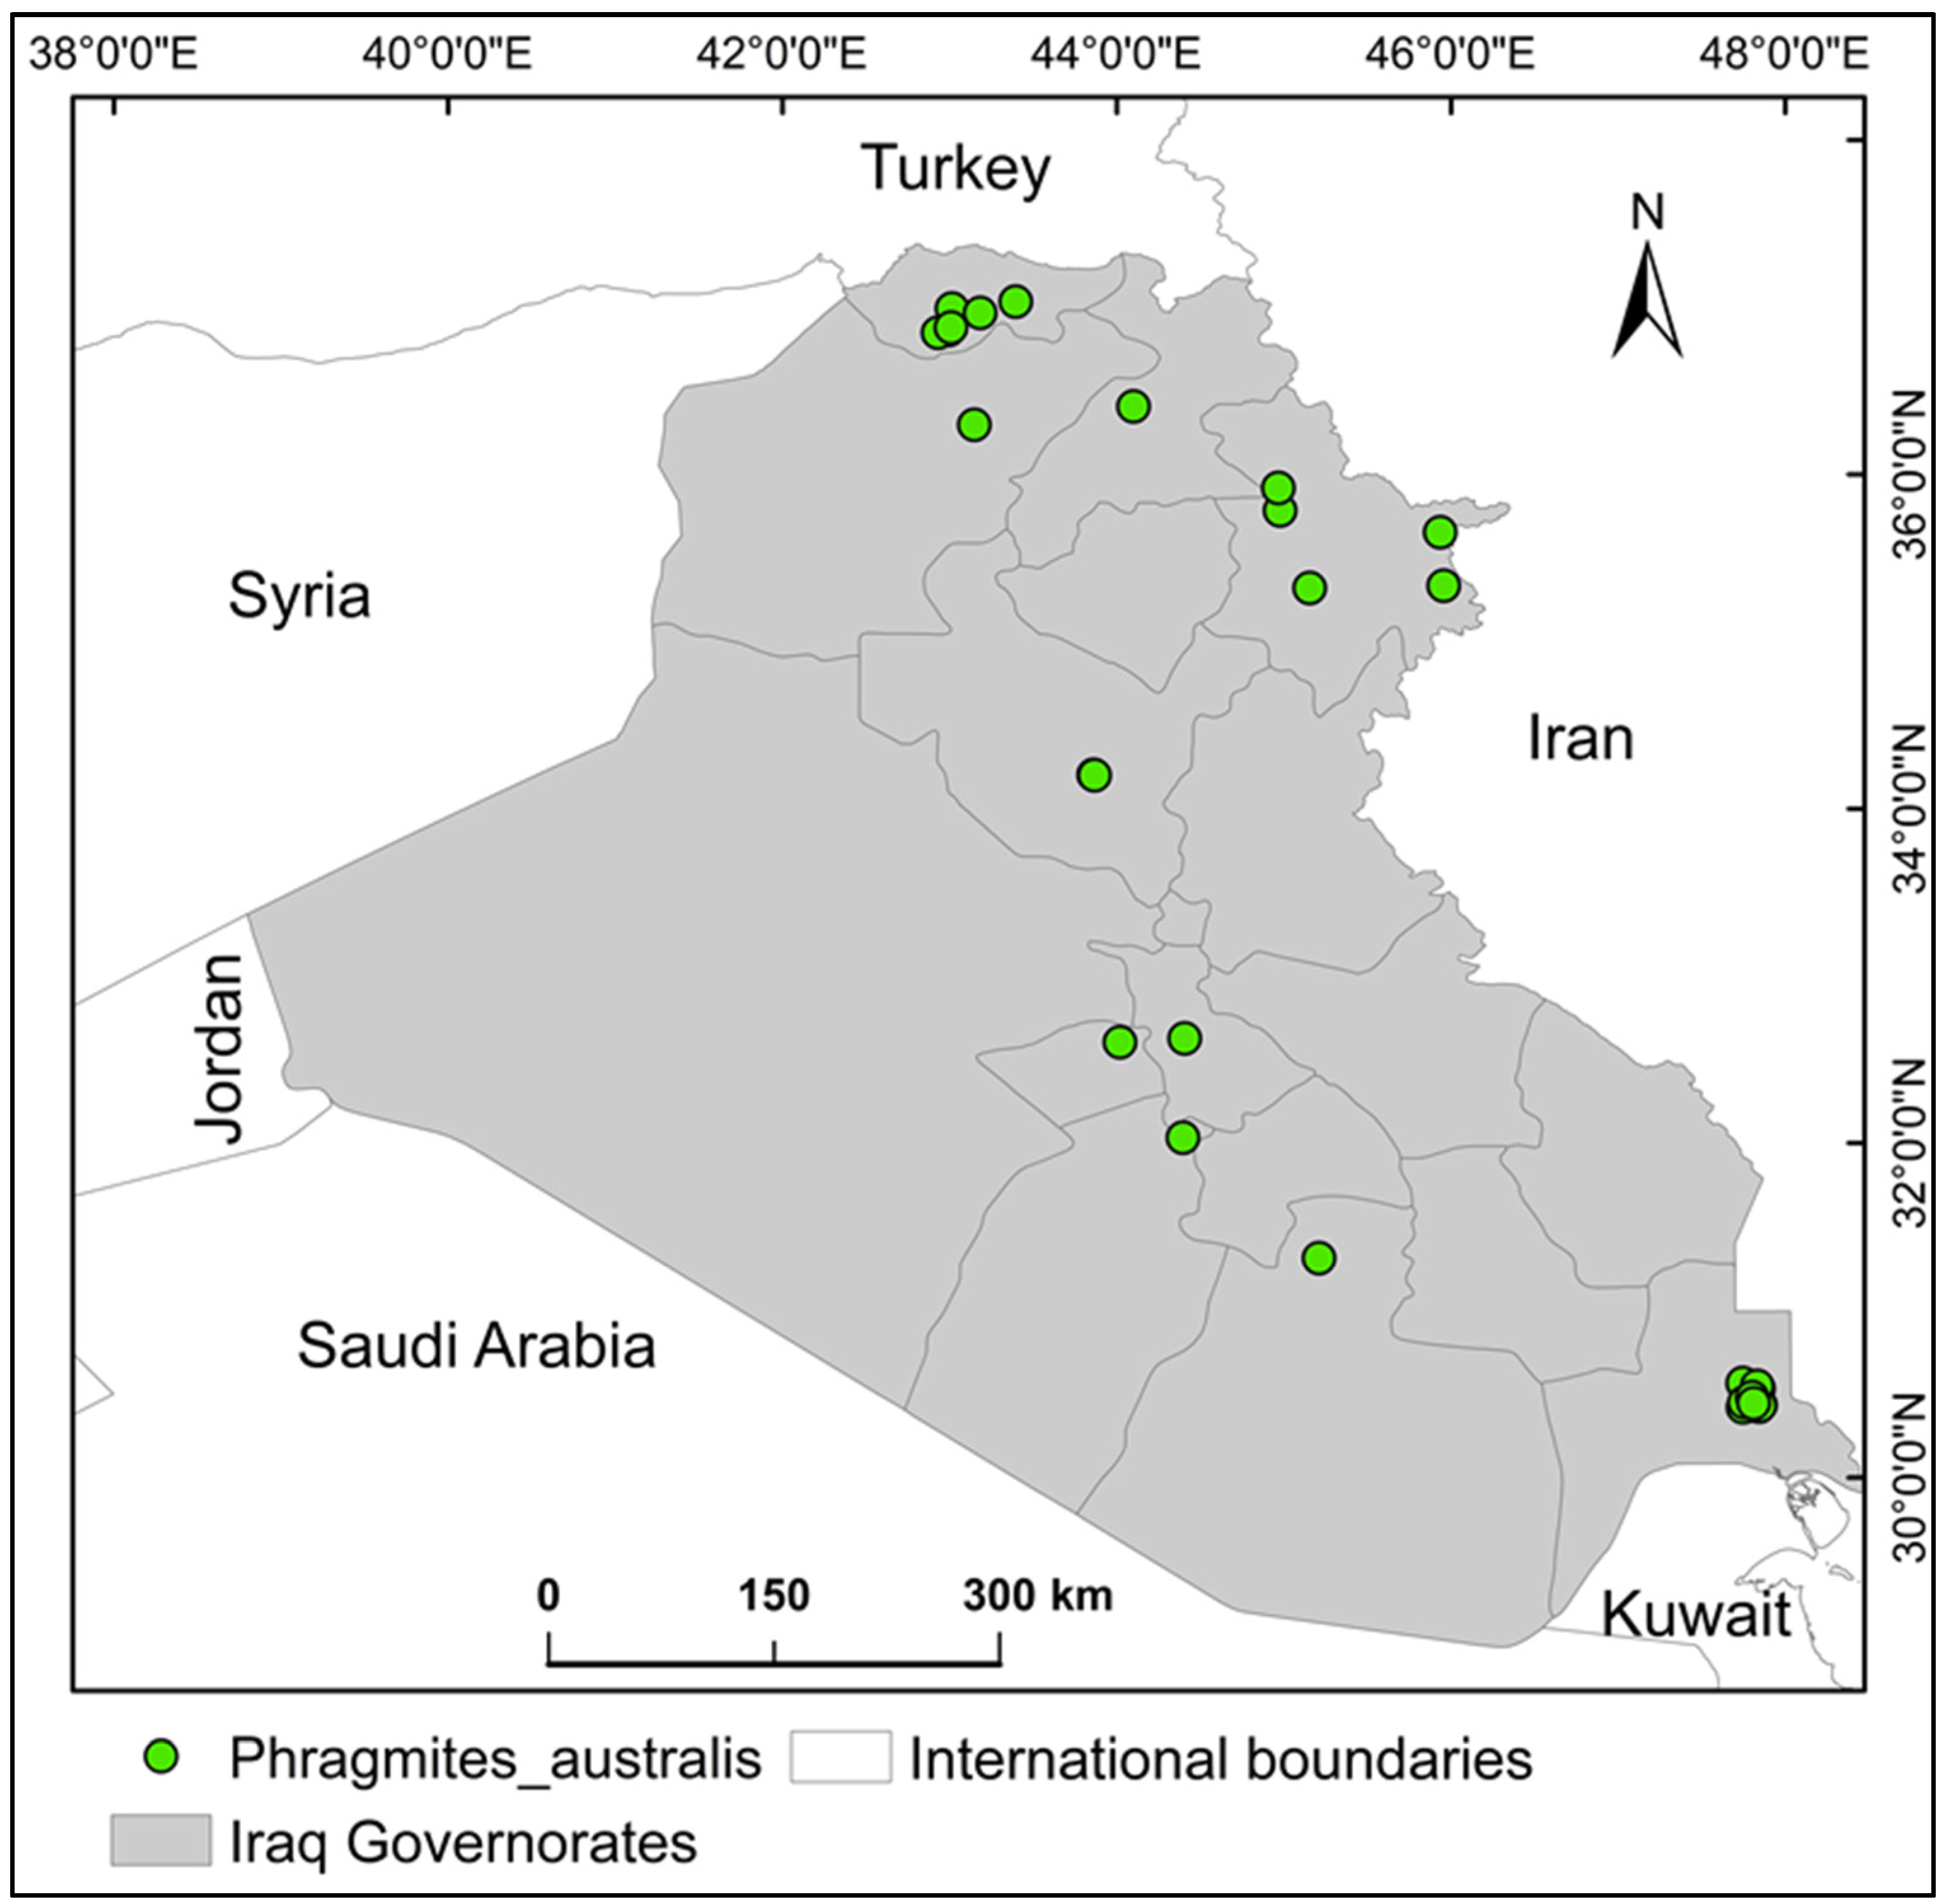
4.2. Phragmites Australis Occurrence Records

The geographic coordinates for P. australis were sourced from the Global Biodiversity Information Facility (GBIF) (https://doi.org/10.15468/dl.aug5xp). These location records underwent rigorous quality evaluations using GIS tools to verify positional precision. Initial data extraction yielded 45 entries, but after applying spatial filtering techniques [40] to eliminate duplicates and ensure adequate spacing between locations (i.e., minimizing sampling bias), only 30 distinct records were retained for modeling (i.e., MaxEnt modeling). It was ensured that these records cover the spatial extent of the entire country, and that the minimum distance between two individual records was not less than 1 km [41].

4.3. Conditioning Factors

The model was developed using multiple environmental variables, including the standard bioclimatic variables, topographic features (e.g., elevation, vegetation proxies (e.g., NDVI)), and land-use and land-cover (LULC). These conditioning factors were chosen based on the existing literature [42,43] and insights from local experts on invasive plant species in Iraq. Climatic data, comprising 19 bioclimatic indicators for current and future scenarios, were sourced from the WorldClim database (www.worldclim.org, accessed on 1 February 2024), which provides datasets published in the Intergovernmental Panel on Climate Change (IPCC) Assessment Report 5 (AR5). These variables were originally derived from historical monthly temperature and rainfall data recorded between 1950 and 2000 at weather stations. These datasets serve as the standard baseline for climate modeling, especially in studies projecting future scenarios. The future bioclimatic variables are sourced from the global circulation model, MRI-ESM2.0 (version 2.0), from the Meteorological Research Institute of Japan. This dataset includes two scenarios, SSP 126 and SSP 585 [44]. All data have a spatial resolution of 30 arc-seconds (~1 km) and are available globally [45]. Elevation data were acquired from the Shuttle Radar Topography Mission (SRTM; http://srtm.csi.cgiar.org/srtmdata, accessed on 27 December 2024). LULC data (100-m resolution, 2019) were sourced from Copernicus Land Cover (https://zenodo.org/communities/copernicus-land-cover, accessed on 13 December 2024). Additionally, vegetation dynamics were assessed using the Normalized Difference Vegetation Index (NDVI), calculated from Landsat 8 satellite imagery (https://earthexplorer.usgs.gov, accessed on 20 December 2024) captured between March and September 2021. These datasets, originally at 30-m resolution, were standardized to a uniform 1 km scale using a geospatial toolbox to align with other input variables. To minimize redundancy in the statistical framework, variables exhibiting strong pairwise correlations (Pearson’s |r| ≥ 0.8) were excluded during preprocessing. This step led to the removal of numerous bioclimatic variables. Only predictors demonstrating low collinearity were retained for final model development. To predict the geographic ranges of P. australis under present and projected scenarios, six bioclimatic parameters (bio1, bio2, bio12, bio14, and bio15) outlined in Table 1 were combined with elevation, LULC, and NDVI datasets. These variables provided the foundation for modeling shifts in the P. australis’ habitat over time.

4.4. MaxEnt Model

The maximum entropy algorithm (MaxEnt) [46] was chosen due to its reliability for generating precise outputs with limited samples [47]. MaxEnt identifies the most probable distribution of P. australis by balancing observed patterns with minimal prior assumptions, ensuring unbiased estimates even when data are sparse. In addition, MaxEnt is particularly advantageous for studies with few observations [48]. For model development, 80% of the P. australis location data was randomly allocated for calibration, with the remaining 20% reserved for testing. While default parameters are commonly employed for simplicity, adjustments were made to align with the study’s ecological context, data characteristics, and user expertise to enhance precision [49]. The analysis incorporated 10 independent model runs, each using 500 computational cycles, to generate an averaged probability mode of P. australis presence. A total of 550 pseudo-absence points were included to balance the limited occurrence records, with regularization parameters maintained at standard level (i.e., one) [50]. Variables’ relative importance were assessed through a Jackknife procedure, systematically excluding individual data points to test prediction consistency and identify environmental drivers of habitat suitability of P. australis. Results were visualized using logistic probability outputs, with thresholds based on minimum training presence values to classify regions into four suitability tiers: unsuitable, low suitable habitat, moderate suitable habitat, and high suitable habitat [51]. These categories were delineated via ArcGIS 10.3.
To evaluate shifts in habitat distribution over time, environmental suitability models were employed to estimate changes. Using geospatial analysis tools within ArcGIS environment, the changes between current and predicted future habitats were quantified. The quantifications were divided into four distinct categories: (i) Habitat gain, representing newly viable areas for P. australis in subsequent periods; (ii) unsuitable habitat, indicating locations unsuitable both currently and in future scenarios; (iii) no change habitat, encompassing areas where the species currently thrives and is expected to persist; and (iv) habitat loss, identifying regions where the species’ presence is forecasted to diminish.

4.5. Model Evaluation

The model’s predictive accuracy was measured using the widely recognized Area Under the Curve (AUC) statistic, a benchmark introduced by Hanley and McNeil [52]. AUC scores range from 0 to 1, with values closer to 1 reflecting strong discriminatory power in distinguishing habitat suitability for P. australis. A score of 0.5 indicates random prediction, while values above this threshold demonstrate increasing reliability for differentiating between probable presence and absence zones [30]. Higher AUC values correspond to greater confidence in the model’s ability to classify environmental suitability for P. australis.

5. Conclusions

The spread of P. australis in Iraq mirrors what is happening globally, shifting climates, e.g., annual precipitation, and land-cover features are driving its invasion. As temperatures rise the plant is expanding into new areas under future climate scenarios. Key drivers of P. australis prevalence include precipitation, elevation gradients, land-cover and land-use, and vegetation patterns, particularly in wetlands. Targeted interventions should concentrate on the highest-risk zones, which cover less than 1% of the nation’s territory (0.9% or 3994 km2), to manage the invasion effectively. This study represents a pioneering assessment of alien invasive plant species geography in Iraq. By mapping current and projected P. australis distributions, this research provides baseline data for future surveillance and control programs. Subsequent investigations should incorporate finer-scale climate variables to refine predictive accuracy.

Funding

This research did not receive any specific grant from funding agencies in the public, commercial, or not-for-profit sectors.

Institutional Review Board Statement

Not applicable.

Informed Consent Statement

Not applicable.

Data Availability Statement

Data are contained within the article.

Acknowledgments

Thanks to the Global Biodiversity Information Facility (GBIF.org) for making the species data available.

Conflicts of Interest

The author declares no conflicts of interest.

References

  1. Pyšek, P.; Richardson, D.M. The biogeography of naturalization in alien plants. J. Biogeogr. 2006, 33, 2040–2050. [Google Scholar] [CrossRef]
  2. Chen, B.; Sun, Y.; Han, Z.; Huang, H.; Zhang, H.; Li, Y.; Zhang, G.; Liu, W. Challenges in preventing and controlling invasive alien species in China. J. Biosaf 2020, 29, 157–163. [Google Scholar]
  3. Richardson, D.M.; Pyšek, P.; Rejmanek, M.; Barbour, M.G.; Panetta, F.D.; West, C.J. Naturalization and invasion of alien plants: Concepts and definitions. Divers. Distrib. 2000, 6, 93–107. [Google Scholar] [CrossRef]
  4. O’Connor, B.; Bojinski, S.; Röösli, C.; Schaepman, M. Monitoring global changes in biodiversity and climate is more important than ever as ecological crisis intensifies. Ecol. Inform. 2019, 55, 101033. [Google Scholar] [CrossRef]
  5. Lee, H.; Calvin, K.; Dasgupta, D.; Krinner, G.; Mukherji, A.; Thorne, P.; Trisos, C.; Romero, J.; Aldunce, P.; Barrett, K. Climate Change 2023: Synthesis Report. Contribution of Working Groups I, II and III to the Sixth Assessment Report of the Intergovernmental Panel on Climate Change; Core Writing Team, Lee, H., Romero, J., Eds.; IPCC: Geneva, Switzerland, 2023. [Google Scholar]
  6. Hassan, W.H.; Nile, B.K. Climate change and predicting future temperature in Iraq using CanESM2 and HadCM3 modeling. Model. Earth Syst. Environ. 2021, 7, 737–748. [Google Scholar] [CrossRef]
  7. Salman, S.A.; Shahid, S.; Ismail, T.; Ahmed, K.; Wang, X.-J. Selection of climate models for projection of spatiotemporal changes in temperature of Iraq with uncertainties. Atmos. Res. 2018, 213, 509–522. [Google Scholar] [CrossRef]
  8. Mansouri Daneshvar, M.R.; Ebrahimi, M.; Nejadsoleymani, H. An overview of climate change in Iran: Facts and statistics. Environ. Syst. Res. 2019, 8, 1–10. [Google Scholar] [CrossRef]
  9. Demircan, M.; Gürkan, H.; Eskioğlu, O.; Arabaci, H.; Coşkun, M. Climate change projections for Turkey: Three models and two scenarios. Turk. J. Water Sci. Manag. 2017, 1, 22–43. [Google Scholar] [CrossRef]
  10. Lu, X.; Siemann, E.; Shao, X.; Wei, H.; Ding, J. Climate warming affects biological invasions by shifting interactions of plants and herbivores. Glob. Chang. Biol. 2013, 19, 2339–2347. [Google Scholar] [CrossRef]
  11. Dukes, J.S.; Chiariello, N.R.; Loarie, S.R.; Field, C.B. Strong response of an invasive plant species (Centaurea solstitialis L.) to global environmental changes. Ecol. Appl. 2011, 21, 1887–1894. [Google Scholar] [CrossRef]
  12. Peterson, A.T.; Stewart, A.; Mohamed, K.I.; Araújo, M.B. Shifting global invasive potential of European plants with climate change. PLoS ONE 2008, 3, e2441. [Google Scholar] [CrossRef] [PubMed]
  13. Awchi, T.A.; Kalyana, M.M. Meteorological drought analysis in northern Iraq using SPI and GIS. Sustain. Water Resour. Manag. 2017, 3, 451–463. [Google Scholar] [CrossRef]
  14. Khwarahm, N.R. Modeling forest-shrubland fire susceptibility based on machine learning and geospatial approaches in mountains of Kurdistan Region, Iraq. Arab. J. Geosci. 2022, 15, 1184. [Google Scholar] [CrossRef]
  15. Khwarahm, N.R.; Najmaddin, P.M.; Ararat, K.; Qader, S. Past and future prediction of land cover land use change based on earth observation data by the CA–Markov model: A case study from Duhok governorate, Iraq. Arab. J. Geosci. 2021, 14, 1–14. [Google Scholar] [CrossRef]
  16. Khwarahm, N.R.; Qader, S.; Ararat, K.; Fadhil Al-Quraishi, A.M. Predicting and mapping land cover/land use changes in Erbil/Iraq using CA-Markov synergy model. Earth Sci. Inform. 2021, 14, 393–406. [Google Scholar] [CrossRef]
  17. Khwarahm, N.R. Mapping current and potential future distributions of the oak tree (Quercus aegilops) in the Kurdistan Region, Iraq. Ecol. Process. 2020, 9, 1–16. [Google Scholar] [CrossRef]
  18. Hama, A.A.; Khwarahm, N.R. Predictive mapping of two endemic oak tree species under climate change scenarios in a semiarid region: Range overlap and implications for conservation. Ecol. Inform. 2023, 73, 101930. [Google Scholar] [CrossRef]
  19. Khwarahm, N.R. Predicting the spatial distribution of Hyalomma ssp., vector ticks of Crimean–Congo Haemorrhagic fever in Iraq. Sustainability 2023, 15, 13669. [Google Scholar] [CrossRef]
  20. Brix, H.; Cížková, H. Introduction: Phragmites-dominated wetlands, their functions and sustainable use. Aquat. Bot. 2001, 69, 87–88. [Google Scholar] [CrossRef]
  21. Ahmad, S.A.; Ahmad, N.S.; Salih, S. Invasive alien species in Iraq. In Invasive Alien Species: Observations and Issues from Around the World; John Wiley & Sons Ltd.: Hoboken, NJ, USA, 2021; Volume 2, pp. 126–150. [Google Scholar]
  22. Al-Mayah, A.-R.A.; Al-Abbawy, D.A.; Al-Assadi, W.M.; Al-Saadi, S.A.; Al-Edany, T.Y. Status of aquatic macrophytes in Saffia nature reserve, South of Huwaiza Marsh, Iraq. Marsh Bull. 2012, 7, 1–16. [Google Scholar]
  23. Bedair, H.; Al-Saad, H.; Salman, N. Iraq’s southern marshes something special to be conserved; A Case Study. Marsh Bull. 2006, 2, 99–126. [Google Scholar]
  24. Rohal, C.B.; Cranney, C.; Hazelton, E.L.; Kettenring, K.M. Invasive Phragmites australis management outcomes and native plant recovery are context dependent. Ecol. Evol. 2019, 9, 13835–13849. [Google Scholar] [CrossRef] [PubMed]
  25. Kiviat, E. Ecosystem services of Phragmites in North America with emphasis on habitat functions. AoB Plants 2013, 5, plt008. [Google Scholar] [CrossRef]
  26. Kandoh, A.A.; Abed, S.A. Measurement the Heavy Elements of Phragmites australis and Syllibium marianum in Hor Al-Dalmaj, Southern Iraq. IOP Conf. Ser. Earth Environ. Sci. 2021, 790, 012034. [Google Scholar] [CrossRef]
  27. salman obaid AL-khazraji, S.; Al-Fatlawy, H.J.J. The Concentration of Some Heavy Metals in Phragmites Australis and Ceratophyllum. Demersum Plants in the Euphrates River, Iraq. Pak. J. Life Soc. Sci. 2024, 22, 2881–2903. [Google Scholar]
  28. Al-Iraqi, A.R.; Gandhi, B.P.; Folkard, A.M.; Barker, P.A.; Semple, K.T. Determine the optimal parameters for biogas production from common reed (Phragmites australis). BioEnergy Res. 2024, 17, 1302–1314. [Google Scholar] [CrossRef]
  29. Phillips, S.J.; Anderson, R.P.; Schapire, R.E. Maximum entropy modeling of species geographic distributions. Ecol. Model. 2006, 190, 231–259. [Google Scholar] [CrossRef]
  30. Phillips, S.J.; Anderson, R.P.; Dudík, M.; Schapire, R.E.; Blair, M.E. Opening the black box: An open-source release of Maxent. Ecography 2017, 40, 887–893. [Google Scholar] [CrossRef]
  31. Eller, F.; Lambertini, C.; Nguyen, L.X.; Brix, H. Increased invasive potential of non-native Phragmites australis: Elevated CO2 and temperature alleviate salinity effects on photosynthesis and growth. Glob. Chang. Biol. 2014, 20, 531–543. [Google Scholar] [CrossRef]
  32. Eller, F.; Skálová, H.; Caplan, J.S.; Bhattarai, G.P.; Burger, M.K.; Cronin, J.T.; Guo, W.-Y.; Guo, X.; Hazelton, E.L.; Kettenring, K.M. Cosmopolitan species as models for ecophysiological responses to global change: The common reed Phragmites australis. Front. Plant Sci. 2017, 8, 1833. [Google Scholar] [CrossRef] [PubMed]
  33. Choi, J.; Lee, S. Principal bioclimatic variables of ten dominant plant species in Korea wetland using the Maxent model. Ecol. Eng. 2022, 183, 106729. [Google Scholar] [CrossRef]
  34. Guo, W.Y.; Lambertini, C.; Li, X.Z.; Meyerson, L.A.; Brix, H. Invasion of Old World Phragmites australis in the New World: Precipitation and temperature patterns combined with human influences redesign the invasive niche. Glob. Chang. Biol. 2013, 19, 3406–3422. [Google Scholar] [CrossRef]
  35. McCormick, M.K.; Whigham, D.F.; Stapp, J.R.; Hazelton, E.L.; McFarland, E.K.; Kettenring, K.M. Shoreline modification affects recruitment of invasive Phragmites australis. Wetl. Ecol. Manag. 2020, 28, 909–919. [Google Scholar] [CrossRef]
  36. Ward, M.J.M.; Degazio, T.; Bowman, J. Great Lakes coastal wetland plant biodiversity increases following the manual removal of invasive Phragmites australis. Wetl. Ecol. Manag. 2025, 33, 2. [Google Scholar] [CrossRef]
  37. Wang, C.; Liu, L.; Yin, M.; Liu, B.; Wu, Y.; Eller, F.; Gao, Y.; Brix, H.; Wang, T.; Guo, W. Chromosome-level genome assemblies reveal genome evolution of an invasive plant Phragmites australis. Commun. Biol. 2024, 7, 1007. [Google Scholar] [CrossRef]
  38. Blizzard, C. Reexamining Ecological Roles and Management Methods of Phragmites australis. Master’s Thesis, Johns Hopkins University, Baltimore, MD, USA, 2023. [Google Scholar]
  39. Nasser, M. Forests and forestry in Iraq: Prospects and limitations. Commonw. For. Rev. 1984, 63, 299–304. [Google Scholar]
  40. Brown, J.L.; Bennett, J.R.; French, C.M. SDMtoolbox 2.0: The next generation Python-based GIS toolkit for landscape genetic, biogeographic and species distribution model analyses. PeerJ 2017, 5, e4095. [Google Scholar] [CrossRef]
  41. HamadAmin, B.A.; Khwarahm, N.R. Mapping impacts of climate change on the distributions of two endemic tree species under socioeconomic pathway scenarios (SSP). Sustainability 2023, 15, 5469. [Google Scholar] [CrossRef]
  42. Nan, Q.; Li, C.; Li, X.; Zheng, D.; Li, Z.; Zhao, L. Modeling the Potential Distribution Patterns of the Invasive Plant Species Phytolacca americana in China in Response to Climate Change. Plants 2024, 13, 1082. [Google Scholar] [CrossRef]
  43. Wu, K.; Wang, Y.; Liu, Z.; Huo, W.; Cao, J.; Zhao, G.; Zhang, F.-G. Prediction of potential invasion of two weeds of the genus Avena in Asia under climate change based on Maxent. Sci. Total Environ. 2024, 950, 175192. [Google Scholar] [CrossRef]
  44. Yukimoto, S.; Koshiro, T.; Kawai, H.; Oshima, N.; Yoshida, K.; Urakawa, S.; Tsujino, H.; Deushi, M.; Tanaka, T.; Hosaka, M. MRI MRI-ESM2. 0 Model Output Prepared for CMIP6 CMIP Historical, Version 20190222; Earth System Grid Federation: Washington, DC, USA, 2019. [Google Scholar]
  45. Hijmans, R.J.; Cameron, S.E.; Parra, J.L.; Jones, P.G.; Jarvis, A. Very high resolution interpolated climate surfaces for global land areas. Int. J. Climatol. A J. R. Meteorol. Soc. 2005, 25, 1965–1978. [Google Scholar] [CrossRef]
  46. Phillips, S.J.; Dudík, M.; Schapire, R.E. A maximum entropy approach to species distribution modeling. In Proceedings of the Twenty-First International Conference on Machine Learning, Banff, AB, Canada, 4–8 July 2004; ACM Press: New York, NY, USA, 2004; pp. 655–662. [Google Scholar]
  47. Elith, J.H.; Graham, C.P.; Anderson, R.; Dudík, M.; Ferrier, S.; Guisan, A.J.; Hijmans, R.; Huettmann, F.R.; Leathwick, J.; Lehmann, A. Novel methods improve prediction of species’ distributions from occurrence data. Ecography 2006, 29, 129–151. [Google Scholar] [CrossRef]
  48. Wisz, M.S.; Hijmans, R.; Li, J.; Peterson, A.T.; Graham, C.; Guisan, A.; Group, N.P.S.D.W. Effects of sample size on the performance of species distribution models. Divers. Distrib. 2008, 14, 763–773. [Google Scholar] [CrossRef]
  49. Phillips, S.J.; Dudík, M. Modeling of species distributions with Maxent: New extensions and a comprehensive evaluation. Ecography 2008, 31, 161–175. [Google Scholar] [CrossRef]
  50. Elith, J.; Leathwick, J.R. Species distribution models: Ecological explanation and prediction across space and time. Annu. Rev. Ecol. Evol. Syst. 2009, 40, 677–697. [Google Scholar] [CrossRef]
  51. Radha, K.O.; Khwarahm, N.R. An integrated approach to map the impact of climate change on the distributions of Crataegus azarolus and Crataegus monogyna in Kurdistan Region, Iraq. Sustainability 2022, 14, 14621. [Google Scholar] [CrossRef]
  52. Hanley, J.A.; McNeil, B.J. The meaning and use of the area under a receiver operating characteristic (ROC) curve. Radiology 1982, 143, 29–36. [Google Scholar] [CrossRef]
Figure 1. The model’s classification accuracy during validation was assessed using a metric derived from repeated training iterations. This measure evaluates the system’s capacity to correctly identify true negatives within a projected area. Across 10 computational trials, the algorithm achieved a mean value of AUC = 0.933 ± 0.012.
Plants 14 00768 g001
Figure 2. The model’s predictive improvements from constrained optimization (top) and classification accuracy metrics (bottom) were evaluated using iterative variable exclusion methods to assess how individual factors influenced habitat suitability patterns for P. australis in Iraq.
Plants 14 00768 g002
Figure 3. Predictive map for P. australis in Iraq under current climate conditions.
Plants 14 00768 g003
Figure 4. Predictive map for P. australis in Iraq under MRI-ESM2.0 SSP126 climate conditions.
Plants 14 00768 g004
Figure 5. Predictive map for P. australis in Iraq under MRI-ESM2.0 SSP585 climate conditions.
Plants 14 00768 g005
Figure 6. Predictive map for P. australis in Iraq analyzed from current prediction and future SSP126 climate scenarios.
Plants 14 00768 g006
Figure 7. Habitat gain and loss predictive map for P. australis in Iraq analyzed from current prediction and future SSP585 climate scenarios.
Plants 14 00768 g007
Figure 8. The study area (Iraq) and the occurrence records of the alien invasive species, Phragmites australis.
Plants 14 00768 g008
Table 1. The model’s input variables, their assigned units and abbreviations, and their quantified impact on P. australis habitat predictions are outlined alongside predictive weight (reflecting each factor’s influence on distribution probability).
Variable Used in ModelingAbbreviation and UnitPercent ContributionPermutation Importance
Elevation DEM (m)33.235.5
wc_bio12bio12 (annual precipitation) (mm)31.750
landcover2019LC 201919.14
wc_bio15bio15 (precipitation seasonality (coefficient of variation) (mm)6.12.2
wc_bio01bio1 (annual mean temperature) (°C)5.13.7
wc_bio02bio2 (mean diurnal range) (°C)2.12.3
IRAQ_NDVINDVI22
wc_bio14bio14 (precipitation of driest month) (mm)0.70.3
Table 2. Proportional distributions of suitable and unsuitable habitats for P. australis in Iraq under current climatic conditions and projected future scenarios (SSP12.6 and SSP58.5) during two intervals: mid-21st century (2041–2060) and late-21st century (2081–2100) for the MRI-ESM2.0 global model.
Current
Distribution
SSP126_2041–2060
Distribution
SSP585_2041–2060
Distribution
ClassArea
(Km2)
Area %
(Km2)
Area
(Km2)
Area % (Km2)Area
(Km2)
Area % (Km2)
Unsuitable habitat366,566.5085.12374,098.0386.87387,760.8090.04
Low suitable habitat51,504.0711.9641,818.889.7135,186.108.17
Medium suitable habitat11,540.422.6813,706.593.186762.171.57
High suitable habitat1021.180.241008.660.23923.090.21
Total area430,632.17100430,632.17100430,632.17100
Table 3. Proportional distribution (changes from current to future) of habitat gain and habitat loss for P. australis in Iraq under current climatic conditions and projected future scenarios (SSP12.6 and SSP58.5) during two intervals: mid-21st century (2041–2060) and late-21st century (2081–2100) for the MRI-ESM2.0 global model.
Current to SSP126_2041−2060 ChangeCurrent to SSP585_2041−2060
ClassArea
(Km2)
Area % (Km2)Area
(Km2)
Area %
(Km2)
Habitat gain15,403.223.587823.691.82
Unsuitable351,163.2881.55358,742.8183.31
No change41,130.919.5535,052.548.14
Habitat loss22,934.755.3329,013.126.74
Total area430,632.17100430,632.17100
Disclaimer/Publisher’s Note: The statements, opinions and data contained in all publications are solely those of the individual author(s) and contributor(s) and not of MDPI and/or the editor(s). MDPI and/or the editor(s) disclaim responsibility for any injury to people or property resulting from any ideas, methods, instructions or products referred to in the content.

