Abstract
Sugars are key metabolites influencing the flavor and quality of kiwifruit, with their accumulation in fruit relying on sugar transporters. Recently identified sugar transporters known as SWEETs play significant roles in modulating plant growth, development, and fruit ripening. However, the characteristics of SWEET genes in Actinidia eriantha remain poorly understood. In this study, a total of 26 AeSWEET genes were identified across 17 chromosomes. These genes encoded proteins ranging from 198 to 305 amino acids in length and contained 5 to 7 transmembrane helices. Both interspecific and intraspecific phylogenetic trees categorized AeSWEET proteins into four distinct clades. The motif and domain structures were conserved within each clade, although variations were observed in exon-intron organizations. One tandem and fourteen segmental duplication events were identified as primary drivers of the AeSWEET family expansion. Comparative syntenic mapping showed a closer homology of the AeSWEET family with that of dicotyledons compared to monocotyledons. Promoter cis-element analysis indicated the potential responses of AeSWEET genes to five phytohormones and seven environmental stressors. Quantitative real-time PCR analysis revealed tissue-specific expression profiles of AeSWEET genes, with two AeSWEET11 genes (AeSWEET11a and AeSWEET11b) showing significantly higher expression levels in fruit tissues. Their expressions were positively correlated with sucrose, fructose, and glucose contents throughout fruit development and ripening. Transient transformation tests in tobacco leaves verified the predominant localization of AeSWEET11a and AeSWEET11b to the plasma membrane. Functional assays in yeast mutants revealed that AeSWEET11a and AeSWEET11b both possessed sucrose and hexose transport activities. These findings highlight the potential of targeting AeSWEET11a and AeSWEET11b to enhance sugar accumulation in the fruit of A. eriantha, thereby providing a foundation for improving the flavor profile of commercial cultivars.
1. Introduction
Sugars serve as substrates for various primary metabolites and secondary metabolites, playing critical roles in numerous physiological processes in plants, including energy metabolism, signal transduction, growth and development, and stress responses [1]. Sugars are mainly produced in source tissues like mature leaves, from where they are subsequently transported to sink tissues, with fruits being a primary recipient [2]. Their accumulation in fruit crops not only provides energy for growth but also influences fruit quality and yield [3]. The process involves both sugar metabolism and transport, with sugar transporters serving as key components of the latter [4]. A variety of sugar transporters have been identified, primarily classified into monosaccharide transporters (MSTs), sucrose transporters (SUTs), and Sugars Will Eventually Be Exported Transporters (SWEETs) [5]. MSTs and SUTs share similar topological features and facilitate sugar transport using the electrochemical proton gradient, either in the same or opposite direction as sugar movement [6,7]. In contrast, SWEETs typically function as bidirectional transmembrane transporters, allowing sugars to traverse biological membranes along a pH-independent concentration gradient [8]. SWEETs play a pivotal role in mediating phloem loading in source tissues and unloading in sink tissues, particularly in fruits.
SWEET proteins are ubiquitously found in prokaryotes, animals, and plants, with their biological functions in plants exhibiting greater complexity compared to those in prokaryotes and animals [9]. Plant SWEETs possess the ability to transport various sugars, including sucrose, glucose, fructose, and galactose, thereby contributing to a broad spectrum of biological processes, such as vegetative and reproductive growth, hormone signaling, pathogenesis, abiotic stress responses, and senescence [10,11,12,13,14]. SWEET proteins belong to the MtN3/saliva family (PF03083), characterized by an N-terminus located outside the cytoplasm and a C-terminus positioned inside [15]. Typically, SWEET proteins contain seven transmembrane helices, with the fourth helix being less conserved and primarily serving as a linker that subdivides the protein into two MtN3/saliva domains [9]. Phylogenetic relationships classify plant SWEETs into four distinct clades. Members within the same clade may perform different physiological functions and have distinct organelle localization, yet they typically transport comparable substrates [16]. In general, SWEETs from clades I and II mainly facilitate the transport of hexose sugars, while those in clade III preferentially transport sucrose, and clade IV members favor fructose transport [17].
Unlike the SWEET proteins found in mammals, chordates and bacteria, which are encoded by a single gene, plant SWEETs are encoded by multiple genes [18,19]. Since the characterization of the AtSWEET genes in Arabidopsis [20], the SWEET gene family has been extensively investigated in economically important plants, such as rice [18], peanut [21], pear [22], banana [23], plum [24], and grape [25]. Recently, SWEET genes have been demonstrated to play diverse functions during fruit development and ripening. For instance, in melon, CmSWEET10 has been identified as a sucrose transporter localized on the plasma membrane of phloem sieve elements and companion cells [26]. It exhibits high expression levels during the early stages of sweet melon fruit development, suggesting its involvement in phloem apoplastic unloading and sucrose accumulation [26]. In cucumber, CsSWEET7a facilitates sugar unloading from phloem by transferring hexoses from companion cells into the apoplasmic space, thereby enhancing the metabolism of raffinose family oligosaccharides and promoting fruit growth through additional sugar unloading [27]. In tomato, the SlSWEET15 gene exhibits high expression in developing fruits, with its protein accumulating in vascular tissues and seed coats, key locations for sucrose unloading in fruits, where it mediates the efflux of sucrose from phloem into apoplasm, facilitating subsequent importation into storage parenchyma cells during fruit maturation [28]. In apple, MdSWEET23 is localized to the plasma membrane, and it is primarily expressed in the vascular bundles of the sepal and carpel [29]. Knock-down of MdSWEET23 resulted in reduced concentrations of sucrose and sorbitol in the fruit [29].
Kiwifruit (Actinidia Lindl.) is a genus of perennial deciduous fruit crops that originated in China and has since achieved global distribution [30]. The fruit is abundant in vitamins, minerals, dietary fiber and other metabolites beneficial to human health, contributing to its high consumer and establishing it as an important economic crop worldwide [31]. Although the genus Actinidia comprises 75 taxa, including 56 species and 21 varieties, commercial cultivars primarily derive from A. chinensis var. chinensis and A. chinensis var. deliciosa, with limited contributions from A. arguta and A. eriantha [32]. Notably, A. eriantha is characterized by its ease of peeling, convenience for consumption, and higher vitamin C content, which have generated increased interest [33]. However, the low sugar content in the fruit of most A. eriantha leads to suboptimal flavor, thereby limiting its market potential. Therefore, investigating sugar metabolism and transport in A. eriantha fruit is crucial. SWEET genes are known to affect fruit sugar content by modulating sugar transport processes [26,27,34]. Although several SWEET genes have been identified in A. chinensis [35,36], the characterization and functional roles of SWEET family genes in kiwifruits, particularly in A. eriantha, remain largely unexplored. In this study, we performed a detailed analysis of the conserved protein domains, evolutionary relationships, gene structures, collinearity patterns, and promoter cis-acting elements of the AeSWEET gene family in A. eriantha. Moreover, a cultivar exhibiting high soluble sugar content in its fruits was employed to investigate the expression patterns of AeSWEET genes across different tissues and fruit developmental stages. AeSWEET11a and AeSWEET11b were identified after correlation analysis between expression levels and sugar contents throughout fruit development and ripening. Their sugar transport capabilities were then demonstrated through functional complementation assays in yeast mutants. Our findings revealed the association of two AeSWEET genes with fruit ripening, thereby providing promising candidate genes for molecular breeding programs aimed at enhancing fruit sugar accumulation in A. eriantha.
2. Results
2.1. Identification of the AeSWEET Family Genes in A. eriantha
Through a systematic genome-wide screening approach employing HMMER and BLASTP algorithms, 26 AeSWEET genes were identified in A. eriantha. These genes were then designated as AeSWEET1a to AeSWEET17c based on their evolutionary proximity to previously identified SWEET genes in related species (Table S1). Subsequent analysis revealed that all 26 AeSWEET proteins contained transmembrane domains, with transmembrane helices (TMHs) ranging from 5 to 7, as presented in Table 1. These AeSWEETs exhibited a wide range of amino acid lengths and molecular weights, spanning from 198 amino acids (AeSWEET4a) to 305 amino acids (AeSWEET6a), and from 21,746.05 Da (AeSWEET4a) to 34,066.5 Da (AeSWEET6a), respectively. The majority of AeSWEETs displayed theoretical isoelectric points (pI) above 7, with the exception observed in AeSWEET17a (pI 6.5), indicating predominantly alkaline characteristics. The instability index of 20 AeSWEET proteins was below 40, indicative of protein stability, while the remaining 6 AeSWEET proteins were deemed unstable. All AeSWEET proteins exhibited grand average of hydropathy (GRAVY) values above 0.24, suggesting their hydrophobic nature. Additionally, subcellular localization predictions indicated that all AeSWEETs were localized to the plasma membrane.

Table 1.
Basic physical and chemical characteristics of AeSWEET proteins.
2.2. Chromosomal Mapping and Evolutionary Analysis of AeSWEETs
The chromosomal localization of AeSWEET genes was determined using the A. eriantha genome published in 2023 [37]. The results revealed an uneven distribution of these genes across 17 of the 29 chromosomes (Lgs) with gene counts ranging from one to four. As shown in Figure 1, the highest concentration was found on chromosome Lg19, which contained four genes, followed by Lg26 with three genes, and four chromosomes (Lg6, Lg13, Lg14, and Lg27) each containing two genes. The remaining 11 chromosomes each contained a single gene. Notably, both AeSWEET6b and 6c were located on Lg27, exhibiting identical transcriptional orientations. Their intergenic spacer region spanned just 500 bp and harbored no other functional genes (Table S1). Given their high sequence similarity (73.33%; Table S2), AeSWEET6b and 6c likely arose from tandem duplication. Additionally, gene density analysis showed that the AeSWEET genes were mainly located in genomic regions with relatively high gene density.
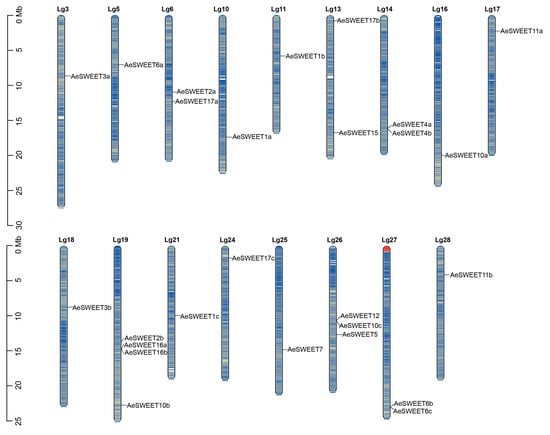
Figure 1.
Distribution of AeSWEETs on the whole-genome chromosomes. The scale represented chromosome length, with the black lines denoting the loci of individual AeSWEET genes. Chromosome coloration reflected gene density, where blue denoted high gene density and yellow signified low gene density.
Subsequently, an interspecific phylogenetic tree was constructed using the aligned dataset of both dicot and monocot SWEET sequences to assess evolutionary relationships. All SWEET proteins were grouped into four major clades: Clade I, II, III and IV (Figure 2). The AeSWEET proteins were distributed across all clades. Specifically, seven AeSWEETs clustered with plant SWEET1, 2, and 3 in Clade I; another seven were associated with SWEET4, 5, 6, and 7 in Clade II; seven more grouped with SWEET9 to 15 in Clade III; and five aligned with SWEET16 and 17 in Clade IV. Notably, most AeSWEETs within each clade exhibited species-specific clustering, such as AeSWEET1a and 1b in Clade I, AeSWEET6a, 6b and 6c in Clade II, AeSWEET11a and 11b in Clade III, and AeSWEET16a and 16b in Clade IV. Pairwise comparisons of both ORF and protein sequences demonstrated higher sequence identity among AeSWEET genes within the same species-specific clade (Table S2). These findings suggested that the expansion of the AeSWEET family largely occurred after the divergence of kiwifruit and other plant species.
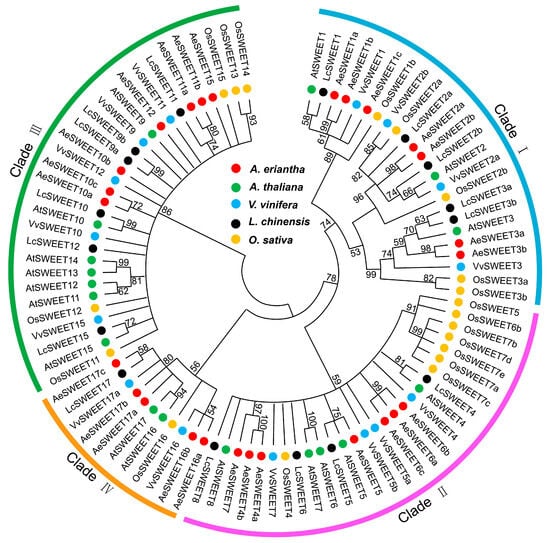
Figure 2.
Phylogenetic relationships of AeSWEETs and other plant SWEETs. SWEET members from Actinidia eriantha (Ae), Arabidopsis thaliana (At), Vitis vinifera (Vv), Litchi chinensis (Lc), and Oryza sativa (Os) were marked in the tree with red, green, blue, black and orange dots, respectively. The maximum likelihood phylogenetic tree was constructed using the LG model. Node numbers show the bootstrap values from 1000 replicates.
2.3. Protein Motifs, Conserved Domains and Gene Structure Features of AeSWEETs
Intraspecific phylogenetic analysis grouped the 26 AeSWEETs into four main clades (Figure 3A), consistent with the interspecific phylogenetic tree results. Using the MEME online tool, 14 conserved motifs were identified among the AeSWEET proteins (Figure 3B and Figure S1). Variations in the number and distribution of motifs were observed, with each AeSWEET member containing between 4 and 8 motifs, and unique motif patterns distinguishing the different clades. Specifically, all AeSWEETs in Clade I contained motifs 1, 4 and 5; Clade II members possessed motifs 3, 4, and 8; Clade III included motifs 1, 2, 3, 4, and 8; while Clade IV featured motifs 1, 3, 4, and 5. These distinct motif patterns revealed potentially functional diversity across the AeSWEET clades. Furthermore, conserved domain analysis revealed the presence of MtN3_slv and/or MtN3_slv superfamily domains in AeSWEET proteins (Figure 3C), indicating evolutionary conservation. Additionally, a structural map was generated based on genomic sequences to illustrate the exon-intron arrangements of AeSWEET genes (Figure 3D). The number of exons (ranging from 4 to 8) and introns (ranging from 3 to 7) varied significantly among AeSWEET family genes, suggesting that intron gain and loss events had occurred during evolution.
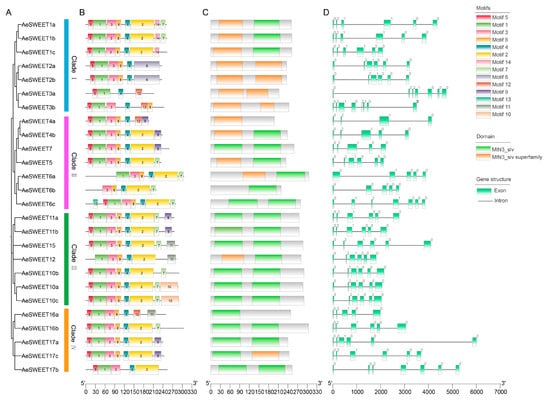
Figure 3.
Intraspecific evolutionary tree, conserved motif, functional domain, and gene structure of AeSWEETs. (A) The phylogenetic tree of 26 AeSWEETs. (B) The distribution of conserved motifs among AeSWEETs. (C) The conserved domains of AeSWEETs. (D) The exon-intron organization of AeSWEETs, where a value of 0 indicated that intron insertion did not disrupt the codon, 1 signified intron insertion following the first base of the codon, and 2 denoted intron insertion after the second base of the codon.
2.4. Collinearity and Synteny Patterns of AeSWEETs
An intraspecific collinear analysis was conducted to investigate the potential impact of gene duplication events on the AeSWEET family evolution (Figure 4A). Fourteen collinear gene pairs were identified among the AeSWEETs, suggesting that segmental duplication events played roles in enhancing genetic diversity. Additionally, certain genes participated in multiple gene pairs, such as AeSWEET1a-AeSWEET1b and AeSWEET1a-AeSWEET1c. The nonsynonymous (Ka) and synonymous (Ks) substitution rates were calculated for each duplicated AeSWEET gene pair to evaluate selection pressures (Table S3). The Ka/Ks ratios for 13 gene pairs were determined to be less than 1, except for AeSWEET10a-AeSWEET12, for which the Ka/Ks value could not be calculated due to its high sequence divergence value (pS ≥ 0.75). These findings indicated that the majority of AeSWEET genes underwent purifying selection.
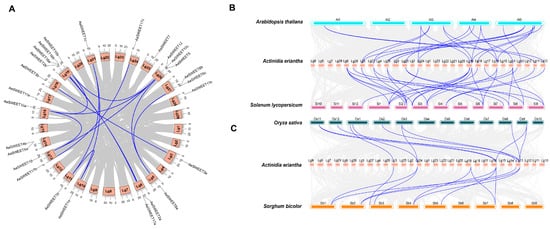
Figure 4.
Collinearity analysis of the AeSWEET family genes. (A) Collinear gene pairs of AeSWEET family genes. (B) Collinear gene pairs of SWEETs across Actinidia erientha, Arabidopsis thaliana, and Solanum lycopersicum. (C) Collinear gene pairs of SWEETs among Actinidia erientha, Oryza sativa, and Sorghum bicolor. Gray lines were used to connect the collinear gene blocks, while blue lines were utilized to link collinear SWEET gene pairs.
Furthermore, the interspecific syntenic maps of A. eriantha between two representative dicotyledons (A. thaliana and Solanum lycopersicum) and two monocotyledons (O. sativa and Sorghum bicolor) were also performed to identify orthologous genes (Figure 4B,C). The AeSWEET genes exhibited significant collinearity with SWEET genes from other dicotyledons, displaying the strongest collinear relationship with S. lycopersicum (28 pairs), followed by A. thaliana (22 pairs). In contrast, AeSWEET genes shared fewer genes with the monocotyledons, with both O. sativa and S. bicolor presenting 11 pairs. However, five members (AeSWEET1c, 2a, 10c, 12, and 17a) did not exhibit synteny with any of the four species analyzed, suggesting that they might have emerged after the divergence of these plant lineages.
2.5. Diverse Cis-Acting Elements Present in the Promoters of AeSWEET Genes
To explore the potential functional characteristics of the AeSWEET promoters, a 2000 bp region upstream of the start codon was extracted from each gene and subjected to analysis using PlantCARE. Abundant cis-acting elements (CAEs) were identified, comprising ten types of hormone-responsive CAEs, twenty-eight types of stress-responsive CAEs, and ten types of growth and biological process-responsive CAEs (Figure 5A). Hormone-responsive CAEs, such as MeJA, abscisic acid, salicylic acid, auxin, and gibberellin responsive elements, were present in the AeSWEET promoters (Figure 5B,C), indicating their broad involvement in hormonal responses. Stress-responsive CAEs were predominantly associated with light response (76.02%), followed by anaerobic induction (11.54%), low-temperature (4.75%), defense and stress (3.39%), drought (3.17%), anoxic specific inducibility (0.68%), and wound (0.45%), highlighting the participation of AeSWEETs in abiotic stresses (Figure 5D). Moreover, growth and biological process-responsive CAEs, such as those involved in cell cycle regulation, circadian control, and various metabolic pathways, were found in most AeSWEET promoters (Figure 5E). These findings suggest that AeSWEET genes play vital roles in diverse biological processes, as well as in responses to phytohormones and environmental stress.
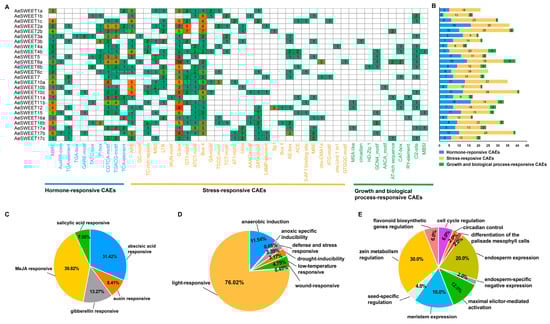
Figure 5.
Cis-acting elements (CAEs) in the AeSWEET promoters. (A) Categorization of cis-acting elements in AeSWEET promoters. Green in the heatmap indicated lower values, while red indicated higher values. (B) The counts of cis-acting elements within each promoter from the three distinct groups. (C) Percentage of cis-acting elements associated with hormone-response. (D) Percentage of cis-acting elements associated with stress-response. (E) Percentage of cis-acting elements associated with growth and biological processes.
2.6. Tissue Expression Patterns of the AeSWEET Family Genes
To investigate the expression patterns of AeSWEET family genes comprehensively, qRT-PCR analysis was conducted to detect their expression levels across seven distinct tissues (leaf, stem, flower, epicarp, outer pericarp, inner pericarp, and core). As shown in Figure 6, 19 AeSWEET genes were detected to express in at least one tested tissue, while the transcriptional abundance of other seven genes (AeSWEET4a, 4b, 6b, 6c, 10c, 16a, and 17a) showed negligible expression (Ct > 35). Eight AeSWEET genes, including four (AeSWEET1b, 2b, 3a, and 3b) in clade I, one (AeSWEET5) in clade II, two (AeSWEET12 and 15) in clade III, and one (AeSWEET17b) in clade IV, showed higher expression abundance in leaves relative to other tissues, suggesting their involvement in leaf sugar transport or loading processes. Conversely, two genes in clade IV (AeSWEET16b and 17c) displayed peak expression abundance in stems, implying their specialized functions in stem sugar transport. Moreover, AeSWEET1c in clade I and AeSWEET7 in clade II exhibited predominant expression in flowers, suggesting their potential roles in flower sugar transport. Additionally, seven genes, including two in clade I (AeSWEET1a and 2a), one in clade II (AeSWEET6a), and four in clade III (AeSWEET10a, 10b, 11a, and 11b), manifested elevated expression levels in at least one fruit tissues (epicarp, outer pericarp, inner pericarp, and core). Interestingly, AeSWEET11a and AeSWEET11b were significantly upregulated in all four fruit tissues, surpassing leaf expression abundance by over 200-fold, suggesting their pivotal involvement in fruit sugar transport mechanism.
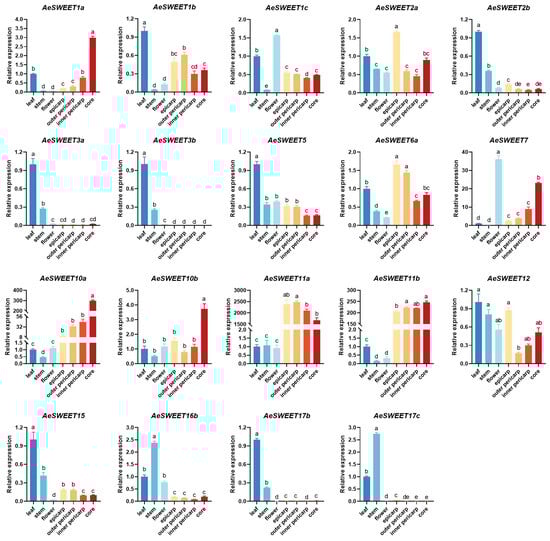
Figure 6.
Relative expression of the AeSWEET family genes in different tissues. The expression level in the leaf was normalized to 1. Differences in gene expression were assessed by one-way ANOVA with Tukey’s Honestly Significant Difference test, using distinct letters to denote statistical significance (p < 0.05).
2.7. Differential Expression of AeSWEET Genes During Fruit Development and Ripening
To further elucidate the potential roles of AeSWEET genes in fruit development and ripening, we evaluated their expression profiles across five distinct developmental stages using qRT-PCR. 15 out of the total 26 AeSWEET genes exhibited statistically significant differential expression in at least one of the fruit developmental stages, while AeSWEET3a and AeSWEET12 displayed marginal fluctuations during fruit development and ripening without reaching statistical significance (Figure 7). Eight members (AeSWEET2a, 2b, 7, 10a, 15, 16b, 17b, and 17c) showed peak expression levels at 60 DAF or 90 DAF, followed by a decline as the fruit progressed towards maturity. Conversely, five genes (AeSWEET1a, 1b, 1c, 6a, and 10b) exhibited fluctuating increases prior to fruit harvest (165 DAF) and were subsequently downregulated upon fruit ripening (15 DAH). Notably, the expression levels of AeSWEET11a and AeSWEET11b exhibited significant increments post-90 DAF, peaking at full ripeness (15 DAH), reaching 885-fold and 415-fold higher than those at 60 DAF, respectively. These findings suggest that sugar transport processes during A. eriantha fruit development and ripening were probably governed by distinct AeSWEET gene members. The majority participated in sugar transport pre-harvest, whereas AeSWEET11a and AeSWEET11b were predominantly engaged in sugar transport throughout fruit development and ripening.
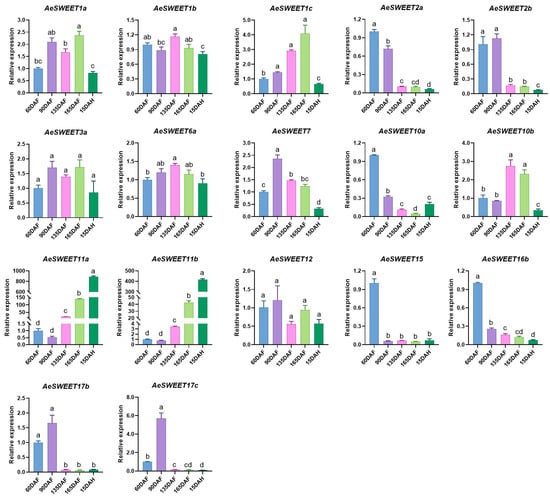
Figure 7.
Relative expression of the AeSWEET family genes throughout fruit development and ripening. The expression level at 60 days after full bloom was normalized to 1. Differences in gene expression were assessed by one-way ANOVA with Tukey’s Honestly Significant Difference test, using distinct letters to denote statistical significance (p < 0.05). DAF indicated days after full bloom, while DAH referred to days after harvest.
2.8. Correlation Analysis of AeSWEET Gene Expression and Sugar Contents During Fruit Development and Ripening
The biosynthesis, transport, and metabolism of sugars are critical processes in fruit development and ripening. Sucrose, fructose, and glucose constitute the main soluble sugars found in fruits and are closely associated with kiwifruit quality. The variations in the concentrations of these three sugars at different developmental stages were determined (Figure 8A). At 90 DAF, the levels of the three sugars were slightly elevated compared to 60 DAF, although this increase was not statistically significant. As fruit development and ripening progressed, the concentrations of these sugars significantly increased, peaking at full ripeness (15 DAH). To investigate the relationship between sugar contents and the expression levels of AeSWEET genes, Pearson correlation analysis was conducted (Figure 8B). The results showed that the correlation coefficients of 0.927 to 0.942 between AeSWEET11a expression levels and the contents of sucrose, glucose, and fructose. Similarly, the AeSWEET11b expression exhibited correlation coefficients ranging from 0.906 to 0.923 with the same sugars, indicating that the expression levels of AeSWEET11a and AeSWEET11b were positively correlated with the contents of these sugars during fruit development and ripening.
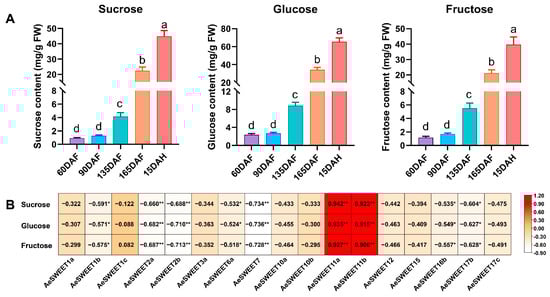
Figure 8.
Analysis of sugar contents and their correlation with AeSWEET genes during fruit development and ripening. (A) The concentrations of sucrose, glucose and fructose during fruit development and ripening. DAF indicated days after full bloom, while DAH referred to days after harvest. Differences in sugar concentrations were assessed by one-way ANOVA with Tukey’s Honestly Significant Difference test, using distinct letters to denote statistical significance (p < 0.05). (B) Correlation of sugar contents and expression levels of AeSWEET genes during fruit development and ripening. Asterisks indicated statistical significance (* p < 0.05, ** p < 0.01).
2.9. Subcellular Localization of AeSWEET11a and AeSWEET11b
Plant structural genes typically function within distinct subcellular compartments. To validate the presumed subcellular localization, the epidermal cells of Nicotiana benthamiana leaves were co-transformed with either 35S:AeSWEET11a-GFP or 35S:AeSWEET11b-GFP and a plasma membrane marker protein labeled with mKate (35S:AtNAA60-mKate) [38]. The control protein (35S:GFP) showed green fluorescence signal distributed throughout the entire cell, including membranes, cytoplasm, and nuclei. In contrast, the green fluorescence signal of 35S:AeSWEET11a-GFP or 35S:AeSWEET11b-GFP was exclusively observed in the membranes, coinciding with the red fluorescence signal of 35S:AtNAA60-mKate (Figure 9).
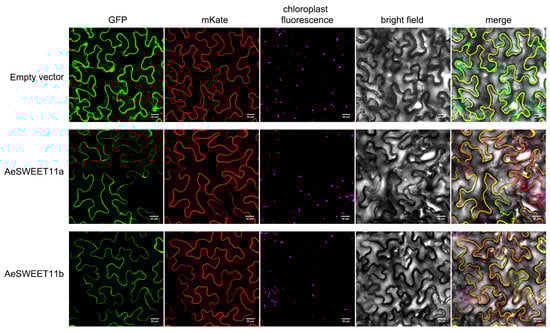
Figure 9.
Subcellular localization of AeSWEET11a and AeSWEET11b in Nicotiana benthamiana leaves. The vectors 35S:AeSWEET11a-GFP and 35S:AtNAA60-mKate vectors, 35S:AeSWEET11b-GFP and 35S:AtNAA60-mKate vectors, as well as 35S:GFP and 35S:AtNAA60-mKate were independently co-transfected into the tobacco leaves. Scale bars represented 20 μm.
2.10. Functions of AeSWEET11a and AeSWEET11b in Sugar Transporting
The functionality of the two AeSWEET11 genes in sugar transport was tested via heterologous expression in two yeast mutant strains, EBY.VW4000 [39] and SUSY7/ura3 [40]. EBY.VW4000 is a hexose transport-deficient strain incapable of utilizing monosaccharides for growth but can thrive on maltose. In contrast, the SUSY7/ura3 strain lacks extracellular invertase, which prevents it from using sucrose as the sole carbon source, although it possesses sucrose synthase activity and thus can metabolize sucrose via the exogenous sucrose transporter. Spotting assays showed that EBY.VW4000 cells transformed with AeSWEET11a-pDR195, AeSWEET11b-pDR195, or SlSWEET14-pDR195 (the positive control) exhibited robust growth on SD/-Ura medium supplemented with 2% (w/v) maltose or three monosaccharides (fructose, glucose, and galactose; Figure 10A). Conversely, EBY.VW4000 cells transformed with the empty pDR195 vector (the negative control) only grew on maltose and failed to grow on media containing fructose, glucose, or galactose. Furthermore, SUSY7/ura3 strains transformed with AeSWEET11a-pDR195, AeSWEET11b-pDR195, or SlSWEET14-pDR195 exhibited obviously faster growth on sucrose-containing media than those harboring the empty pDR195 vector (Figure 10B). These results suggested that both AeSWEET11a and AeSWEET11b functioned as transporters for hexoses (fructose, glucose, and galactose) and sucrose.
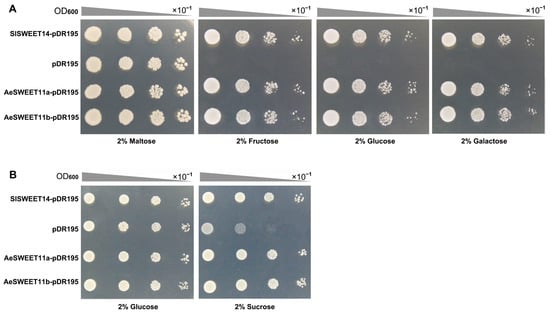
Figure 10.
Functional validation of AeSWEET11a and AeSWEET11b in yeast mutant cells. (A) The yeast mutant EBY.VW4000, transformed with AeSWEET11a-pDR195, AeSWEET11b-pDR195, SlSWEET14-pDR195 (positive control), or pDR195 (negative control), was cultured on SD/-Ura solid medium supplemented with 2% (w/v) maltose, fructose, glucose, or galactose as the sole carbon source. Serial 10-fold dilutions were spotted onto the solid medium. (B) The yeast mutant SUSY7/ura3 harboring AeSWEET11a-pDR195, AeSWEET11b-pDR195, SlSWEET14-pDR195 (positive control), or pDR195 (negative control) was grown on SD/-Ura solid medium with 2% (w/v) glucose or sucrose as the exclusive carbon source.
3. Discussion
3.1. The Characteristics of AeSWEET Family Genes in A. eriantha
SWEET proteins play crucial roles in plant growth, development, and defense mechanisms as they aid in the efficient long-distance translocation of sugars from source (such as mature leaves) to sink organs (e.g., seeds and fruits) [9]. These proteins are encoded by a gene family, the size of which varies across species. For instance, litchi contains 16 LcSWEETs [41], grape has 17 VvSWEETs [42], pear harbors 18 PbSWEETs [22], and banana contains 25 MaSWEETs [23]. In this study, 26 AeSWEET genes were identified in A. eriantha, which is more than the 17 AtSWEETs found in A. thaliana (a dicotyledonous model plant) [43] and the 21 OsSWEETs present in O. sativa (a monocotyledonous model plant) [18]. Most AeSWEET genes encoded basic proteins with 7 transmembrane helices although two proteins contained only 5 to 6 transmembrane helices, similar results were also found in PpSWEET proteins of Poa pratensis [44]. There were 4 to 8 exons existing in the AeSWEET family, unlike the 5 to 7 exons found in grape VvSWEET family [42].
Plant SWEET families usually undergo expansion and loss of members throughout evolution. The increased number of SWEET genes in higher plants primarily stems from tandem duplication and segmental duplication [45,46]. The proportions of these two duplication mechanisms reveal a striking divergence among species, exhibiting a phenomenon of species-specific dominance [47]. For instance, in Glycine max, segmental duplication events gave rise to 69.8% of GmSWEET genes, while in Eucalyptus grandis, tandem duplication produced 52.0% of EgSWEET genes [47]. Similarly, a tandem duplication event within the A. eriantha genome specifically produced two AeSWEET genes (AeSWEET6b and 6c), while the identification of 14 collinear gene pairs within the AeSWEET family strongly suggested that segmental duplication primarily drove the expansion of this family. Additionally, a significantly greater sharing of SWEET gene pairs was detected between A. eriantha and other dicotyledons compared to monocotyledons. Conversely, Pan et al. [48] observed that the AsSWEET family in common oat exhibited stronger collinearity with SWEET genes from other monocots than with those of dicots, implying that the divergence of SWEET family genes among species occurred synchronously with the split of monocot and dicot lineages. Phylogenetic trees classified the AeSWEET family into four distinct clades, corroborating previous studies [9]. However, compared to A. thaliana, A. eriantha lacked SWEET8, SWEET9, SWEET13, and SWEET14. This absence pattern was echoed in other species, such as litchi, which was missing SWEET7, SWEET13, SWEET14, and SWEET16 [41], and several Poaceae crops that lacked SWEET8 and SWEET9 [48]. These findings collectively indicated selective loss of specific SWEET family members throughout evolution. The loss of members within plant gene families has found to be associated with multiple factors, such as ecological adaptation pressures, functional redundancy, and pseudogenization [49,50]. Furthermore, the Ka/Ks value clearly demonstrated that purifying selection served as the primary evolutionary force shaping AeSWEET genes, likely playing a vital role in preserving ancestral biological functions.
3.2. Expression and Functional Diversity of AeSWEET Genes
SWEET family genes exhibit differential expression across plant tissues and are integral to the transport of various sugars. The expression patterns of these genes are closely tied to their functional roles, allowing tissue-specific analyses to serve as predictors of biological functions. In rice, the genes OsSWEET11 and OsSWEET15 exhibited highly concentrated and specific expressions in caryopses, where they influenced starch accumulation in the pericarp [51]. In Arabidopsis, AtSWEET16 was predominantly expressed in root vacuoles, and mutations in this gene impaired root growth under conditions of excess fructose [43]. Similarly, NECI, the Petunia homolog of AtSWEET9, exhibited predominant expression in nectaries [52]; its silencing led to male sterility and reduced nectar secretion [53,54]. Here, eight AeSWEET genes were identified with high expression in leaves, two showed peak expression in stems, another two were predominantly expressed in flowers, and seven exhibited elevated expression in at least one fruit tissue (Figure 6), indicating that sugar transport in different tissues was dominated by distinct AeSWEET genes. In addition, 15 AeSWEET genes were highly expressed at different time points of fruit development and ripening. However, only two genes exhibited a positive correlation between their expression levels and sugar content, whereas the rest showed negative correlations (Figure 8). The latter suggests a potential role in sugar efflux, which warrants further investigation. Although the widespread expression of AeSWEET genes suggest potential metabolic significance, their precise biological roles require further validation through multiple methodologies such as RNA in situ hybridization, immunolocalization, gene overexpression, or VIGS experiments in future investigations.
For the four distinct evolutionary clades characterized, all reported plant SWEET families; however, gene expression patterns within the same clade diverged across species. In Hemerocallis citrina, HcSWEET genes from identical clades generally shared similar expression profiles [55]. However, in A. eriantha, AeSWEET genes within the same clade manifested divergent expression modes (Figure 6). This expression divergence proved unsurprising, as MdSWEET15a in apple also exhibited high expression in flowers, fruits, and mature leaves, while MdSWEET12a, a fellow clade III member, predominantly expressed in fruit tissues [56]. Within A. thaliana clade III, AtSWEET11, 12, and 15 mediated sucrose efflux from the seed coat to the embryo [57], whereas AtSWEET9 specifically transported sucrose out of nectary parenchyma cells [54], indicating functional differentiation among clade members. Furthermore, duplicated genes also tended to diverge in expression [58,59], as evidenced in the AeSWEET gene duplicates. For instance, AeSWEET1a and 1b clustered within the species-specific group of clade I, consistent with their features as syntenic gene pairs boasting high sequence similarity (Figure 2, Tables S2 and S3), yet their expression patterns differed from one another (Figure 6). Similarly, duplicated HvSWEET genes in barley exhibited differential expression patterns, which was considered to undergo neofunctionalization post-duplication [60]. Additionally, the AeSWEET promoters featured cis-acting elements responsive to phytohormones, environmental stresses, as well as growth and biological processes (Figure 5), mirroring findings in the promoters of the plum PsSWEET family [24] and the peanut AhSWEET family [21]. Cis-acting elements in plant SWEET promoters can interact with transcription factors to modulate gene expression [21,34]. The types and numbers of cis-elements varied among distinct AeSWEET genes (Figure 5), potentially accounting for their differential expression at the transcriptional level. The VvSWEET promoters in grape clade III exhibited a higher abundance of ABRE elements [42], a pattern similarly observed within clade III of the AeSWEET family, implying that this subclade likely participated in multiple biological processes via the ABA signaling pathway.
3.3. AeSWEET11a and AeSWEET11b Probably Participate in Sugar Transport and Accumulation During Fruit Development and Ripening
Plant SWEET genes are crucial for fruit ripening and for regulating sugar accumulating in fruits. In watermelon, ClSWEET3 emerged as the most abundantly expressed SWEET gene throughout fruit development, with its expression levels positively correlating with sugar content [61]. Overexpression of ClSWEET3 resulted in increased sugar levels, whereas CRISPR-mediated clsweet3 mutants displayed decreased sugar content and biomass [61]. Although seven AeSWEET genes were detected as differentially expressed in at least one fruit tissue (Figure 6), only AeSWEET11a and AeSWEET11b consistently maintained elevated expression throughout fruit development and ripening (Figure 7), suggesting their crucial involvement in fruit sugar transport. Sucrose, glucose, and fructose constituted the primary soluble sugars defining the characteristic flavor profile of A. eriantha fruits [62]. These key sugars progressively accumulated during fruit development, culminating in peak levels upon full ripeness (Figure 8A). And they were significantly and positively correlated with the expression levels of AeSWEET11a and AeSWEET11b (Figure 8B). AcSWEET9b of A. chinensis var. ‘Donghong’, a homolog of AeSWEET11b, was shown to influence sucrose concentration during fruit development via gene overexpression and silencing [35], while its sugar transport activity remains unclear. In apple, MdSWEET12a exhibited dominant expression in fruit tissues, correlating positively with sucrose accumulation, and was validated as a sucrose transporter [56]. Generally, SWEETs in clades I, II, and IV preferentially transport hexoses, while those in clade III specialize in sucrose transport [63]. Recent studies have demonstrated that individual SWEET protein can simultaneously transport multiple types of sugar. For instance, Arabidopsis AtSWEET13 can transport both glucose and sucrose [64], while SlSWEET7a and SlSWEET14 in tomato are capable of transporting fructose, glucose, and sucrose [65]. Similarly, AeSWEET11a and AeSWEET11b in this study were confirmed to transport both hexoses and sucrose (Figure 10). These findings indicate that plant SWEETs within clade III have undergone functional differentiation during evolution.
The ORF and protein sequences of AeSWEET11a and AeSWEET11b showed over 92% similarity (Table S2), strongly indicating that they are duplicate genes. However, they were located on different chromosomes (Figure 1) and failed to form a syntenic gene pair (Figure 4), pointing to their origination through alternative duplication mechanisms. The expression profiles of AeSWEET11a and AeSWEET11b were highly similar across seven distinct tissues and five fruit developmental stages, implying shared functionality under these conditions. Nevertheless, marked differences were observed in their intron lengths and promoter cis-elements (Figure 5). For example, AeSWEET11a contained the ARE and WUN-motif cis-elements, which respond to anaerobic induction and wound-responsive signals, respectively, whereas AeSWEET11b harbored TC-rich repeats and LTR elements, which mediate defense and stress responses and low-temperature responses, respectively. This divergence suggested potential functional specialization under varying stress conditions. Furthermore, oligomerization activates SWEET proteins, allowing for the formation of homomeric or heteromeric multimers to promote sugar transport [9]. In Arabidopsis, eight AtSWEET proteins (AtSWEET1, 5, 6, 8, 11, 12, 16, and 17) were capable of forming homomeric complexes, while 47 heteromeric combinations could arise among the 17 AtSWEET proteins [66]. Peach PpSWEET11a and PpSWEET14, both located in the plasma membrane and capable of sucrose transport, showed similar expression patterns in source and sink tissues [67]. Overexpressing either PpSWEET11a or PpSWEET14 altered sucrose accumulation significantly, while co-expression led to an additive effect on sucrose levels, attributed to their ability to form homodimers and heterodimers, thereby enhancing transport activity [67]. Similarly, AeSWEET11a and AeSWEET11b were confirmed to have identical subcellular localization and sugar transport functions. Given their shared highly analogous expression patterns and strong correlation with sugar accumulation across fruit development and ripening stages, we hypothesized their synergistic potential to assemble into homodimers and heterodimers, collectively enhancing sugar transport efficiency throughout these processes. These findings suggested that AeSWEET11a and AeSWEET11b might serve as promising target genes or molecular markers for enhancing sugar accumulation in A. eriantha fruits through targeted breeding efforts.
4. Materials and Methods
4.1. Identification of AeSWEET Genes Through a Genome-Wide Analysis
The whole-genome sequence of A. eriantha Bentham ‘Midao 31’ was retrieved from the China National Center for Bioinformation (https://ngdc.cncb.ac.cn/gwh/Assembly/64038/show, accessed on 16 August 2024) [37]. The hidden Markov model (HMM) seed profile of SWEET domain (PF03083) was downloaded from the Pfam database (http://pfam.xfam.org/, accessed on 16 August 2024). Candidate AeSWEET genes were initially screened using HMMER v3.4 software (http://www.hmmer.org/, accessed on 16 August 2024), with an e-value threshold of <1 × 10⁻⁵. To comprehensively identify AeSWEET genes, protein sequences of AtSWEET were retrieved from the Arabidopsis Information Resource (TAIR, https://www.arabidopsis.org/, accessed on 16 August 2024). These AtSWEET sequences served as queries for homologous searches against all protein sequences of ‘Midao 31’ using the BLAST GUI Wrapper in TBtools-II v2.1 [68], yielding candidate genes. A Venn diagram was constructed to compare the results from HMMER and BLASTP, with the overlapping sequences identified as candidate AeSWEET genes. Subsequent validation using the Conserved Domains Database (https://www.ncbi.nlm.nih.gov/Structure/cdd/cdd.shtml, accessed on 16 August 2024) excluded sequences lacking or containing incomplete SWEET domains.
The analysis of AeSWEET protein properties was conducted using the ExPASy ProtParam tool (https://web.expasy.org/protparam/, accessed on 19 August 2024). Transmembrane topology prediction was performed using the Deep TMHMM-1.0 tool (https://services.healthtech.dtu.dk/services/DeepTMHMM-1.0/, accessed on 19 August 2024). Subcellular localization was assessed using ProtComp v.9.0 with default parameters (http://www.softberry.com, accessed on 19 August 2024).
4.2. Chromosomal Location and Phylogenetic Relationship of AeSWEETs
The chromosomal positions of AeSWEET genes were retrieved from the GFF file, and subsequently visualized using the Gene Location Visualize program in TBtools-II v2.1. The protein sequences of SWEET family in V. vinifera and L. chinensis, were obtained according to previous reports [41,42]. The interspecific phylogenetic tree was constructed utilizing SWEET protein sequences from A. eriantha, A. thaliana, V. vinifera, L. chinensis and O. sativa, while the intraspecific evolutionary relationships were resolved through phylogenetic analysis of 26 AeSWEET sequences. Multiple sequence alignments were performed using the Muscle algorithm, followed by precise trimming of non-conservative regions through Quick Run TrimAL. Using MEGA v12, maximum-likelihood phylogenetic trees were constructed with 1000 bootstrap replicates.
4.3. Gene Structure and Protein Domains of AeSWEETs
The exon-intron structure of AeSWEET genes was analyzed using annotated data retrieved from the GFF file. Conserved motifs and domains of AeSWEET proteins were identified, respectively, using the online tools of MEME (https://meme-suite.org/meme/, accessed on 26 August 2024) and CD-Search (https://www.ncbi.nlm.nih.gov/Structure/bwrpsb/bwrpsb.cgi, accessed on 26 August 2024). Finally, the visualization of gene-structures, conserved motifs, domains, and motif compositions was carried out using the Gene Structure View program and Batch MEME Motif Viz tool in TBtools-II v2.1.
4.4. Intraspecific and Interspecific Collinearity Analysis
Genome sequences of S. lycopersicum, O. sativa, and S. bicolor were downloaded from Ensembl Plants database (http://plants.ensembl.org/index.html, accessed on 28 August 2024), along with the A. thaliana genome from TAIR, to represent dicot and monocot plants in the collinearity analysis. Intraspecies and interspecies collinearity for 26 AeSWEET genes and SWEET genes from other plants were performed using the One-Step MCScanX tool integrated into TBtools-II v2.1. Based on the results of the intraspecies collinearity analysis, the Simple Ka/Ks Calculator was employed to compute Ka/Ks ratios for aligned duplicated gene pairs.
4.5. Cis-Acting Element Analysis of AeSWEET Promoters
The 2000 bp sequences upstream of the start codon of AeSWEET genes were extracted from the ‘Midao 31’ genome and defined as their promoter regions. These promoter sequences were subsequently analyzed for cis-acting elements using PlantCARE (http://bioinformatics.psb.ugent.be/webtools/plantcare/html/, accessed on 12 September 2024). Finally, the categories and quantities of identified cis-acting elements were categorized and quantified using the Excel and visualized with GraphPad Prism 9.0.
4.6. Plant Materials and Quantitative Real-Time PCR
The five-year-old A. eriantha Bentham ‘Lvyan 3’ vines cultivated at the experimental base of the Fujian Academy of Agricultural Sciences (26°23′ N, 117°9′ E) in Mingxi County, Fujian Province, China, served as experimental materials. To assess gene expression across various tissues, mature leaves and annual stems were collected on 20 April 2024, while flowers were sampled on 8 May 2024. Fruit tissues (epicarp, outer pericarp, inner pericarp, and core) were collected on 20 October 2024, from fruits that had reached harvest maturity (with a total soluble solids content of 8.0 ± 0.5% and a dry matter content of 19.6 ± 0.8%). For the analysis of gene expression throughout fruit development and ripening, fruits were collected at five developmental stages: 60 days after full bloom (DAF), 90 DAF, 135 DAF, 165 DAF (harvest maturity), and 15 days after harvest (DAH; reaching the edible stage with a total soluble solids content of 18.5 ± 0.9% and a firmness of 1.2 ± 0.3 N). Fruit maturity was assessed based on the total soluble solids, dry matter content, and firmness. Total soluble solids were measured using a digital hand-held refractometer (Atago, Tokyo, Japan). Dry matter content was determined by drying 3 mm thick equatorial fruit slices at 60 °C to a constant weight (approximately 24 h). Fruit firmness was assessed with a TMS-Pilot texture analyzer (FTC, Sterling, VA, USA). Nine vines were divided into three groups serving as three biological replicates. Each biological replicate contained twelve fruits of uniform size and free from damage.
The RNAprep Pure Plant Plus Kit (Tiangen, Beijing, China) was employed to extract total RNA of kiwifruit tissues. RNA integrity and concentration were analyzed using 1% agarose gels and a NanoDrop One Spectrophotometer (Thermo Scientific, Waltham, MA, USA). 500 ng of total RNA per sample was subsequently reverse-transcribed into complementary DNA (cDNA) for quantitative real-time PCR (qRT-PCR) using the HiScript III RT SuperMix for qPCR (gDNA wiper plus; Vazyme, Nanjing, China). Each AeSWEET gene primer was designed with the assistance of online PrimerQuest Tool (https://sg.idtdna.com/PrimerQuest/Home/Index, accessed on 30 October 2024), and their specificity was verified through the primer check function in TBtools-II v2.1. qRT-PCR was carried out using a LightCycler480 Real-time instrument (Roche, Mannheim, Schaffhausen, Switzerland) and the Taq Pro Universal SYBR qPCR Master Mix (Vazyme, Nanjing, China), in accordance with the manufacturer’s instructions. Using five 10-fold dilutions of the cDNA mixture from the test samples as templates, qRT-PCR amplification was performed for each pair of primers, and standard curves were generated to analyze their amplification efficiencies. The AeActin gene (Aermda05g007346) of A. eriantha served as a housekeeping gene, and relative expression levels of AeSWEET genes were calculated using the Pfaffl analysis method [69]. Each sample was analyzed with three biological replicates and three technical replicates. Detailed information regarding AeSWEET primers was provided in Table S4.
4.7. Measurement of Sucrose, Glucose and Fructose
Sucrose, glucose, and fructose concentrations were quantified using high-performance liquid chromatography (HPLC) with methodological modifications [62]. Briefly, fruit samples were homogenized in liquid nitrogen, and 2 g of the resulting powder was then transferred to a 50 mL centrifuge tube. After adding 15 mL of 80% (v/v) ethanol and mixing thoroughly, the mixture was extracted by ultrasonication at 35 °C for 30 min. After cooling to room temperature, the mixture was centrifuged at 4000 rpm for 10 min, and the supernatant was transferred to a volumetric flask. The residue was re-extracted once, and the supernatants were combined. The combined supernatants were subsequently dried by rotary evaporation, and an equal volume of deionized water was then added to dissolve the dried extract. The fully dissolved solution was filtered through a 0.22 µm membrane, and the resulting filtrate was used for sugar analysis via HPLC. Chromatographic separations were performed on an Agilent ZORBAX NH2 column (4.6 mm × 250 mm, 5.0 µm), with a mobile phase consisting of acetonitrile and deionized water (70:30, v/v). The injection volume was 20 µL, the flow rate was 1.0 mL/min, and the column temperature was maintained at 40 °C. Detection was performed using a refractive index detector (RID). Each sample was analyzed with three biological replicates.
4.8. Subcellular Localization
The open reading frame (ORF) sequences of AeSWEET11a and AeSWEET11b were, respectively, amplified from fruits of ‘Lvyan 3’ at 165 DAF using specific primers (AeSWEET11a-OrfF/R and AeSWEET11b-OrfF/R; Table S5), and subsequently cloned into the pEASY®-Blunt zero vector (TransGen, Beijing, China). Six clones for each gene were selected via PCR and confirmed through sequencing. The validated vectors were then employed as templates to amplify the coding sequences of AeSWEET11a and AeSWEET11b without the stop codons under the primers AeSWEET11a-SubF/R and AeSWEET11b-SubF/R (Table S5), respectively. The purified PCR products were fused to the N-terminus of GFP within 62SK vector, utilizing the ClonExpress Ultra One Step Cloning Kit (Vazyme, Nanjing, China) to generate constructs of 35S:AeSWEET11a-GFP and 35S:AeSWEET11b-GFP. The empty 62SK vector (35S:GFP) was employed as a control. Additionally, the 35S:AtNAA60-mKate vector served as a plasma membrane marker [38,70].
The vectors 35S:AeSWEET11a-GFP and 35S:AtNAA60-mKate, 35S:AeSWEET11b-GFP and 35S:AtNAA60-mKate, as well as 35S:GFP and 35S:AtNAA60-mKate, were co-transformed into N. benthamiana leaves via Agrobacterium-mediated infiltration according to reported methods [66]. Following infiltration, the tobacco plants were incubated for an additional 3 days. Fluorescence imaging was then performed using a Nikon C2-ER confocal microscope. GFP, mKate, and chloroplast autofluorescence were excited at 488 nm, 561 nm, and 640 nm, with emission detected at 510 nm, 580 nm, and 675 nm, respectively.
4.9. Yeast Mutant Complementary Growth Assay
The coding sequences of AeSWEET11a and AeSWEET11b were amplified using specific primers, AeSWEET11a-ExpF/R and AeSWEET11b-ExpF/R (Table S6), respectively, and subsequently inserted into the pDR195 vector between BamHI and XhoI sites via homologous recombination using the ClonExpress Ultra One Step Cloning Kit (Vazyme, Nanjing, China). The recombinant constructs were then cloned into DH5a cells. Six colonies were selected based on PCR screening and confirmed by sequencing.
To transform yeast, 1 µg of the verified recombinant plasmid was combined with 100 μL of competent yeast cells and 500 μL of PEG/LiAc solution. Following a 30 min incubation at 30 °C in a water bath, 20 μL DMSO was added, and the mixture was heat-shocked at 42 °C water bath for 20 min. The transformation mixture was centrifuged at 700 g to remove the supernatant, and 1 mL of YPM liquid medium was added before shaking at 30 °C for 90 min. After another centrifugation at 700 g for 5 min, the yeast was resuspended in 1ml 0.9% (w/v) NaCl. The EBY.VW4000 yeast strain expressing AeSWEET11a or AeSWEET11b was cultivated on SD/-Ura medium supplemented with 2% (w/v) maltose, while the SUSY7/ura3 strain was grown on SD/-Ura medium containing 2% (w/v) glucose. After 3-day incubation at 30 °C, individual colonies were verified by PCR. The confirmed strains were resuspended in 0.9% NaCl, and when the optical density at 600 nm (OD600) reached 0.8, cultures were diluted to 100, 10−1, 10−2, and 10−3 and subsequently spotted onto the SD/-Ura medium supplemented with various sugar sources, including 2% (w/v) maltose, fructose, glucose, galactose and sucrose. Following incubation at 30 °C for 88 h, the strains’ growth was evaluated. The strain harboring SlSWEET14-pDR195 was used as positive control [65]. For each group, three sequencing-verified clones were selected to serve as three biological replicates. Each was independently transformed into yeast and spotted onto SD/-Ura medium supplemented with various sugar sources.
4.10. Statistical Analyses
Data normality was tested using GraphPad Prism 9.0 (Normality and Lognormality Tests). Differences in AeSWEET gene expression levels and sugar concentrations were analyzed by one-way ANOVA with Tukey’s Honestly Significant Difference test. Correlations between transcriptional levels of AeSWEET genes and sugar contents (sucrose, fructose, glucose) were determined by calculating Pearson correlation coefficients using the software’s analytical suite, with a two-tailed significance test employed to verify statistical relevance.
Supplementary Materials
The following supporting information can be downloaded at: https://www.mdpi.com/article/10.3390/plants14203140/s1, Figure S1: Compositions of the 14 motifs identified in the AeSWEET family; Table S1: Gene information of the AeSWEET family; Table S2: Pairwise similarities among AeSWEET family genes; Table S3: Ka/Ks ratios of homologous genes within the AeSWEET family; Table S4: Primer sequences used for qRT-PCR; Table S5: Primer sequences used for subcellular localization; Table S6: Primer sequences used for functional analysis.
Author Contributions
Conceptualization, X.F. and Y.C.; methodology, X.F. and Y.C.; software, X.F. and Q.H.; validation, X.F., Q.H. and M.G.; formal analysis, X.F., Q.H. and M.G.; investigation, X.F., Q.H., M.G. and R.L.; resources, X.F., Q.H., M.G. and R.L.; data curation, X.F. and Y.C.; writing—original draft preparation, X.F.; writing—review and editing, X.F., Q.H., M.G., R.L. and Y.C.; visualization, X.F. and Q.H.; supervision, X.F. and Y.C.; project administration, X.F. and Y.C.; funding acquisition, X.F. and Y.C. All authors have read and agreed to the published version of the manuscript.
Funding
This research was funded by the Basic Science Foundation of Fujian Province (No. 2023R1026002), the Natural Science Foundation of Fujian province (No. 2023J01367), the Seed Industry Innovation and Industrialization Project of Fujian Province (No. zycxny2021010), and the Project of Fujian Academy of Agricultural Sciences (No. YCZX202503).
Data Availability Statement
All datasets generated and analyzed during this study are available from the corresponding author on reasonable request.
Acknowledgments
We acknowledge all those who collaborated on this project.
Conflicts of Interest
The authors declare no conflicts of interest.
References
- Jeandet, P.; Formela-Luboińska, M.; Labudda, M.; Morkunas, I. The role of sugars in plant responses to stress and their regulatory function during development. Int. J. Mol. Sci. 2022, 23, 5161. [Google Scholar] [CrossRef]
- Wen, S.; Neuhaus, H.E.; Cheng, J.; Bie, Z. Contributions of sugar transporters to crop yield and fruit quality. J. Exp. Bot. 2022, 73, 2275–2289. [Google Scholar] [CrossRef] [PubMed]
- Falchi, R.; Bonghi, C.; Drincovich, M.F.; Famiani, F.; Lara, M.V.; Walker, R.P.; Vizzotto, G. Sugar metabolism in stone fruit: Source-sink relationships and environmental and agronomical effects. Front. Plant Sci. 2020, 11, 573982. [Google Scholar] [CrossRef]
- Zhang, C.; Bian, Y.; Hou, S.; Li, X. Sugar transport played a more important role than sugar biosynthesis in fruit sugar accumulation during Chinese jujube domestication. Planta 2018, 248, 1187–1199. [Google Scholar] [CrossRef]
- Julius, B.T.; Leach, K.A.; Tran, T.M.; Mertz, R.A.; Braun, D.M. Sugar transporters in plants: New insights and discoveries. Plant Cell Physiol. 2017, 58, 1442–1460. [Google Scholar] [CrossRef]
- Xue, X.; Wang, J.; Shukla, D.; Cheung, L.S.; Chen, L.Q. When SWEETs turn tweens: Updates and perspectives. Annu. Rev. Plant Biol. 2022, 73, 379–403. [Google Scholar] [CrossRef]
- Slewinski, T.L. Diverse functional roles of monosaccharide transporters and their homologs in vascular plants: A physiological perspective. Mol. Plant 2011, 4, 641–662. [Google Scholar] [CrossRef] [PubMed]
- Chen, L.Q.; Qu, X.Q.; Hou, B.H.; Sosso, D.; Osorio, S.; Fernie, A.R.; Frommer, W.B. Sucrose efflux mediated by SWEET proteins as a key step for phloem transport. Science 2012, 335, 207–211. [Google Scholar] [CrossRef]
- Zhu, Y.; Tian, Y.; Han, S.; Wang, J.; Liu, Y.; Yin, J. Structure, evolution, and roles of SWEET proteins in growth and stress responses in plants. Int. J. Biol. Macromol. 2024, 263, 130441. [Google Scholar] [CrossRef]
- Singh, J.; Das, S.; Jagadis Gupta, K.; Ranjan, A.; Foyer, C.H.; Thakur, J.K. Physiological implications of SWEETs in plants and their potential applications in improving source-sink relationships for enhanced yield. Plant Biotechnol. J. 2023, 21, 1528–1541. [Google Scholar] [CrossRef] [PubMed]
- Breia, R.; Conde, A.; Badim, H.; Fortes, A.M.; Gerós, H.; Granell, A. Plant SWEETs: From sugar transport to plant-pathogen interaction and more unexpected physiological roles. Plant Physiol. 2021, 186, 836–852. [Google Scholar] [CrossRef]
- Fakher, B.; Ashraf, M.A.; Wang, L.; Wang, X.; Zheng, P.; Aslam, M.; Qin, Y. Pineapple SWEET10 is a glucose transporter. Hortic. Res. 2023, 10, uhad175. [Google Scholar] [CrossRef] [PubMed]
- Chen, D.; Shi, Y.; Zhang, P.; Xie, W.; Li, S.; Xiao, J.; Yuan, M. Deletion of the sugar importer gene OsSWEET1b accelerates sugar starvation-promoted leaf senescence in rice. Plant Physiol. 2024, 195, 2176–2194. [Google Scholar] [CrossRef]
- Fan, X.W.; Sun, J.L.; Cai, Z.; Zhang, F.; Li, Y.Z.; Palta, J.A. MeSWEET15a/b genes play a role in the resistance of cassava (Manihot esculenta Crantz) to water and salt stress by modulating sugar distribution. Plant Physiol. Biochem. 2023, 194, 394–405. [Google Scholar] [CrossRef]
- Ji, J.; Yang, L.; Fang, Z.; Zhang, Y.; Zhuang, M.; Lv, H.; Wang, Y. Plant SWEET family of sugar transporters: Structure, evolution and biological functions. Biomolecules 2022, 12, 205. [Google Scholar] [CrossRef]
- Yamada, K.; Osakabe, Y. Sugar compartmentation as an environmental stress adaptation strategy in plants. Semi. Cell Dev. Biol. 2018, 83, 106–114. [Google Scholar] [CrossRef]
- Zhang, X.; Wang, S.; Ren, Y.; Gan, C.; Li, B.; Fan, Y.; Zhao, X.; Yuan, Z. Identification, analysis and gene cloning of the SWEET gene family provide insights into sugar transport in Pomegranate (Punica granatum). Int. J. Mol. Sci. 2022, 23, 2471. [Google Scholar] [CrossRef]
- Yuan, M.; Wang, S. Rice MtN3/saliva/SWEET family genes and their homologs in cellular organisms. Mol. Plant 2013, 6, 665–674. [Google Scholar] [CrossRef] [PubMed]
- Patil, G.; Valliyodan, B.; Deshmukh, R.; Prince, S.; Nicander, B.; Zhao, M.; Sonah, H.; Song, L.; Lin, L.; Chaudhary, J.; et al. Soybean (Glycine max) SWEET gene family: Insights through comparative genomics, transcriptome profiling and whole genome re-sequence analysis. BMC Genom. 2015, 16, 520. [Google Scholar] [CrossRef] [PubMed]
- Chen, L.Q.; Hou, B.H.; Lalonde, S.; Takanaga, H.; Hartung, M.L.; Qu, X.Q.; Guo, W.J.; Kim, J.G.; Underwood, W.; Chaudhuri, B.; et al. Sugar transporters for intercellular exchange and nutrition of pathogens. Nature 2010, 468, 527–532. [Google Scholar] [CrossRef]
- Li, Y.; Fu, M.; Li, J.; Wu, J.; Shua, Z.; Chen, T.; Yao, W.; Huai, D. Genome-wide identification of SWEET genes reveals their roles during seed development in peanuts. BMC Genom. 2024, 25, 259. [Google Scholar] [CrossRef]
- Li, J.; Qin, M.; Qiao, X.; Cheng, Y.; Li, X.; Zhang, H.; Wu, J. A new insight into the evolution and functional divergence of SWEET transporters in Chinese white pear (Pyrus bretschneideri). Plant Cell Physiol. 2017, 58, 839–850. [Google Scholar] [CrossRef]
- Miao, H.; Sun, P.; Liu, Q.; Miao, Y.; Liu, J.; Zhang, K.; Hu, W.; Zhang, J.; Wang, J.; Wang, Z.; et al. Genome-wide analyses of SWEET family proteins reveal involvement in fruit development and abiotic/biotic stress responses in banana. Sci. Rep. 2017, 7, 3536. [Google Scholar] [CrossRef]
- Liu, S.; Nie, X.; Chen, H.; Shen, X. Identification of the SWEET gene family and functional characterization of PsSWEET1a and PsSWEET17b in the regulation of sugar accumulation in ‘Fengtang’ plum (Prunus salicina Lindl.). BMC Plant Biol. 2025, 25, 407. [Google Scholar] [CrossRef] [PubMed]
- Chong, J.; Piron, M.C.; Meyer, S.; Merdinoglu, D.; Bertsch, C.; Mestre, P. The SWEET family of sugar transporters in grapevine: VvSWEET4 is involved in the interaction with Botrytis cinerea. J. Exp. Bot. 2014, 65, 6589–6601. [Google Scholar] [CrossRef] [PubMed]
- Zhou, Y.; Li, K.; Wen, S.; Yang, D.; Gao, J.; Wang, Z.; Zhu, P.; Bie, Z.; Cheng, J. Phloem unloading in cultivated melon fruits follows an apoplasmic pathway during enlargement and ripening. Hortic. Res. 2023, 10, uhad123. [Google Scholar] [CrossRef]
- Li, Y.; Liu, H.; Yao, X.; Wang, J.; Feng, S.; Sun, L.; Ma, S.; Xu, K.; Chen, L.Q.; Sui, X. Hexose transporter CsSWEET7a in cucumber mediates phloem unloading in companion cells for fruit development. Plant Physiol. 2021, 186, 640–654. [Google Scholar] [CrossRef]
- Ko, H.Y.; Ho, L.H.; Neuhaus, H.E.; Guo, W.J. Transporter SlSWEET15 unloads sucrose from phloem and seed coat for fruit and seed development in tomato. Plant Physiol. 2021, 187, 2230–2245. [Google Scholar] [CrossRef]
- Nie, P.; Wang, L.; Li, M.; Lyu, D.; Qin, S.; Xue, X. MdSWEET23, a sucrose transporter from apple (Malus × domestica Borkh.), influences sugar metabolism and enhances cold tolerance in tomato. Front. Plant Sci. 2023, 14, 1266194. [Google Scholar] [CrossRef]
- Huang, S.; Ding, J.; Deng, D.; Tang, W.; Sun, H.; Liu, D.; Zhang, L.; Niu, X.; Zhang, X.; Meng, M. Draft genome of the kiwifruit Actinidia chinensis. Nature Commun. 2013, 4, 2640. [Google Scholar] [CrossRef] [PubMed]
- Wang, R.; Shu, P.; Zhang, C.; Zhang, J.; Chen, Y.; Zhang, Y.; Du, K.; Xie, Y.; Li, M.; Ma, T.; et al. Integrative analyses of metabolome and genome-wide transcriptome reveal the regulatory network governing flavor formation in kiwifruit (Actinidia chinensis). New Phytol. 2022, 233, 373–389. [Google Scholar] [CrossRef] [PubMed]
- Yuan, X.; Zheng, H.; Fan, J.; Liu, F.; Li, J.; Zhong, C.; Zhang, Q. Comparative study on physicochemical and nutritional qualities of kiwifruit varieties. Foods 2022, 12, 108. [Google Scholar] [CrossRef]
- Tao, J.; Jia, H.; Wu, M.; Zhong, W.; Huang, Y.; Huang, L.; Xu, Y.; Huang, C. Integrated metabolome and transcriptome analysis reveals the mechanism related to the formation of peelability in Actinidia eriantha. Sci. Hortic. 2024, 330, 113072. [Google Scholar] [CrossRef]
- Fang, H.; Shi, Y.; Liu, S.; Jin, R.; Sun, J.; Grierson, D.; Li, S.; Chen, K. The transcription factor CitZAT5 modifies sugar accumulation and hexose proportion in citrus fruit. Plant Physiol. 2023, 192, 1858–1876. [Google Scholar] [CrossRef]
- Han, X.; Zhang, Y.; Zhang, Q.; Ma, N.; Liu, X.; Tao, W.; Lou, Z.; Zhong, C.; Deng, X.W.; Li, D.; et al. Two haplotype-resolved, gap-free genome assemblies for Actinidia latifolia and Actinidia chinensis shed light on the regulatory mechanisms of vitamin C and sucrose metabolism in kiwifruit. Mol. Plant 2023, 16, 452–470. [Google Scholar] [CrossRef] [PubMed]
- Nardozza, S.; Boldingh, H.L.; Kashuba, M.P.; Feil, R.; Jones, D.; Thrimawithana, A.H.; Ireland, H.S.; Philippe, M.; Wohlers, M.W.; McGhie, T.K. Carbon starvation reduces carbohydrate and anthocyanin accumulation in red-fleshed fruit via trehalose 6-phosphate and MYB27. Plant Cell Environ. 2020, 43, 819–835. [Google Scholar] [CrossRef]
- Wang, Y.; Dong, M.; Wu, Y.; Zhang, F.; Ren, W.; Lin, Y.; Chen, Q.; Zhang, S.; Yue, J.; Liu, Y. Telomere-to-telomere and haplotype-resolved genome of the kiwifruit Actinidia eriantha. Mol. Hortic. 2023, 3, 4. [Google Scholar] [CrossRef]
- Linster, E.; Layer, D.; Bienvenut, W.V.; Dinh, T.V.; Weyer, F.A.; Leemhuis, W.; Brünje, A.; Hoffrichter, M.; Miklankova, P.; Kopp, J.; et al. The Arabidopsis N(α) -acetyltransferase NAA60 locates to the plasma membrane and is vital for the high salt stress response. New Phytol. 2020, 228, 554–569. [Google Scholar] [CrossRef]
- Wieczorke, R.; Krampe, S.; Weierstall, T.; Freidel, K.; Hollenberg, C.P.; Boles, E. Concurrent knock-out of at least 20 transporter genes is required to block uptake of hexoses in Saccharomyces cerevisiae. FEBS Lett. 1999, 464, 123–128. [Google Scholar] [CrossRef]
- Riesmeier, J.W.; Willmitzer, L.; Frommer, W.B. Isolation and characterization of a sucrose carrier cDNA from spinach by functional expression in yeast. EMBO J. 1992, 11, 4705–4713. [Google Scholar] [CrossRef]
- Xie, H.; Wang, D.; Qin, Y.; Ma, A.; Fu, J.; Qin, Y.; Hu, G.; Zhao, J. Genome-wide identification and expression analysis of SWEET gene family in Litchi chinensis reveal the involvement of LcSWEET2a/3b in early seed development. BMC Plant Biol. 2019, 19, 499. [Google Scholar] [CrossRef]
- Geng, K.; Zhan, Z.; Xue, X.; Hou, C.; Li, D.; Wang, Z. Genome--wide identification of the SWEET gene family in grape (Vitis vinifera L.) and expression analysis of VvSWEET14a in response to water stress. Physiol. Mol. Biol. Plants 2024, 30, 1565–1579. [Google Scholar] [CrossRef] [PubMed]
- Guo, W.J.; Nagy, R.; Chen, H.Y.; Pfrunder, S.; Yu, Y.C.; Santelia, D.; Frommer, W.B.; Martinoia, E. SWEET17, a facilitative transporter, mediates fructose transport across the tonoplast of Arabidopsis roots and leaves. Plant Physiol. 2014, 164, 777–789. [Google Scholar] [CrossRef] [PubMed]
- Zhang, R.; Niu, K.; Ma, H. Identification and expression analysis of the SWEET gene family from Poa pratensis under abiotic stresses. DNA Cell Biol. 2020, 39, 1606–1620. [Google Scholar] [CrossRef] [PubMed]
- Zhu, J.; Zhou, L.; Li, T.; Ruan, Y.; Zhang, A.; Dong, X.; Zhu, Y.; Li, C.; Fan, J. Genome-wide investigation and characterization of SWEET gene family with focus on their evolution and expression during hormone and abiotic stress response in Maize. Genes 2022, 13, 1682. [Google Scholar] [CrossRef]
- Li, W.; Ren, Z.; Wang, Z.; Sun, K.; Pei, X.; Liu, Y.; He, K.; Zhang, F.; Song, C.; Zhou, X.; et al. Evolution and Stress Responses of Gossypium hirsutum SWEET Genes. Int. J. Mol. Sci. 2018, 19, 769. [Google Scholar] [CrossRef]
- Li, X.; Si, W.; Qin, Q.; Wu, H.; Jiang, H. Deciphering evolutionary dynamics of SWEET genes in diverse plant lineages. Sci. Rep. 2018, 8, 13440. [Google Scholar] [CrossRef]
- Pan, Y.; Niu, K.; Miao, P.; Zhao, G.; Zhang, Y.; Ju, Z.; Chai, J.; Yang, J.; Cui, X.; Zhang, R. Genome-wide analysis of the SWEET gene family and its response to powdery mildew and leaf spot infection in the common oat (Avena sativa L.). BMC Genom. 2024, 25, 995. [Google Scholar] [CrossRef]
- Sun, Y.; Deng, T.; Zhang, A.; Moore, M.J.; Landis, J.B.; Lin, N.; Zhang, H.; Zhang, X.; Huang, J.; Zhang, X.; et al. Genome sequencing of the endangered kingdonia uniflora (Circaeasteraceae, Ranunculales) reveals potential mechanisms of evolutionary specialization. iScience 2020, 23, 101124. [Google Scholar] [CrossRef] [PubMed]
- Wang, P.; Moore, B.M.; Panchy, N.L.; Meng, F.; Lehti-Shiu, M.D.; Shiu, S.H. Factors influencing gene family size variation among related species in a plant family, solanaceae. Genome Biol. Evol. 2018, 10, 2596–2613. [Google Scholar] [CrossRef]
- Yang, J.; Luo, D.; Yang, B.; Frommer, W.B.; Eom, J.S. SWEET11 and 15 as key players in seed filling in rice. New Phytol. 2018, 218, 604–615. [Google Scholar] [CrossRef]
- Ge, Y.X.; Angenent, G.C.; Wittich, P.E.; Peters, J.; Franken, J.; Busscher, M.; Zhang, L.M.; Dahlhaus, E.; Kater, M.M.; Wullems, G.J.; et al. NEC1, a novel gene, highly expressed in nectary tissue of Petunia hybrida. Plant J. 2000, 24, 725–734. [Google Scholar] [CrossRef]
- Ge, Y.X.; Angenent, G.C.; Dahlhaus, E.; Franken, J.; Peters, J.; Wullems, G.J.; Creemers-Molenaar, J. Partial silencing of the NEC1 gene results in early opening of anthers in Petunia hybrida. Mol. Genet. Genom. 2001, 265, 414–423. [Google Scholar] [CrossRef]
- Lin, I.W.; Sosso, D.; Chen, L.Q.; Gase, K.; Kim, S.G.; Kessler, D.; Klinkenberg, P.M.; Gorder, M.K.; Hou, B.H.; Qu, X.Q.; et al. Nectar secretion requires sucrose phosphate synthases and the sugar transporter SWEET9. Nature 2014, 508, 546–549. [Google Scholar] [CrossRef]
- Cao, L.; Wang, J.; Wang, L.; Liu, H.; Wu, W.; Hou, F.; Liu, Y.; Gao, Y.; Cheng, X.; Li, S.; et al. Genome-wide analysis of the SWEET gene family in Hemerocallis citrina and functional characterization of HcSWEET4a in response to salt stress. BMC Plant Biol. 2024, 24, 661. [Google Scholar] [CrossRef] [PubMed]
- Zhang, B.; Li, Y.N.; Wu, B.H.; Yuan, Y.Y.; Zhao, Z.Y. Plasma membrane-localized transporter MdSWEET12 is involved in sucrose unloading in apple fruit. J. Agric. Food Chem. 2022, 70, 15517–15530. [Google Scholar] [CrossRef] [PubMed]
- Chen, L.Q.; Lin, I.W.; Qu, X.Q.; Sosso, D.; McFarlane, H.E.; Londoño, A.; Samuels, A.L.; Frommer, W.B. A cascade of sequentially expressed sucrose transporters in the seed coat and endosperm provides nutrition for the Arabidopsis embryo. Plant Cell 2015, 27, 607–619. [Google Scholar] [CrossRef]
- Haberer, G.; Hindemitt, T.; Meyers, B.C.; Mayer, K.F. Transcriptional similarities, dissimilarities, and conservation of cis-elements in duplicated genes of Arabidopsis. Plant Physiol. 2004, 136, 3009–3022. [Google Scholar] [CrossRef]
- Blanc, G.; Wolfe, K.H. Functional divergence of duplicated genes formed by polyploidy during Arabidopsis evolution. Plant Cell 2004, 16, 1679–1691. [Google Scholar] [CrossRef]
- Yue, W.; Cai, K.; Xia, X.; Liu, L.; Wang, J. Genome-wide identification, expression pattern and genetic variation analysis of SWEET gene family in barley reveal the artificial selection of HvSWEET1a during domestication and improvement. Front. Plant Sci. 2023, 14, 1137434. [Google Scholar] [CrossRef] [PubMed]
- Ren, Y.; Li, M.; Guo, S.; Sun, H.; Zhao, J.; Zhang, J.; Liu, G.; He, H.; Tian, S.; Yu, Y.; et al. Evolutionary gain of oligosaccharide hydrolysis and sugar transport enhanced carbohydrate partitioning in sweet watermelon fruits. Plant Cell 2021, 33, 1554–1573. [Google Scholar] [CrossRef]
- Tao, J.; Wu, M.; Jiao, X.; Chen, S.; Jia, D.; Xu, X.; Huang, C. Dynamic changes of fruit physiological quality and sugar components during fruit growth and development of Actinidia eriantha. Horticulturae 2022, 8, 529. [Google Scholar] [CrossRef]
- Eom, J.S.; Chen, L.Q.; Sosso, D.; Julius, B.T.; Lin, I.W.; Qu, X.Q.; Braun, D.M.; Frommer, W.B. SWEETs, transporters for intracellular and intercellular sugar translocation. Curr. Opin. Plant Biol. 2015, 25, 53–62. [Google Scholar] [CrossRef] [PubMed]
- Weigle, A.T.; Shukla, D. The Arabidopsis AtSWEET13 transporter discriminates sugars by selective facial and positional substrate recognition. Commun. Biol. 2024, 7, 764. [Google Scholar] [CrossRef]
- Zhang, X.; Feng, C.; Wang, M.; Li, T.; Liu, X.; Jiang, J. Plasma membrane-localized SlSWEET7a and SlSWEET14 regulate sugar transport and storage in tomato fruits. Hortic. Res. 2021, 8, 186. [Google Scholar] [CrossRef]
- Xuan, Y.H.; Hu, Y.B.; Chen, L.-Q.; Sosso, D.; Ducat, D.C.; Hou, B.-H.; Frommer, W.B. Functional role of oligomerization for bacterial and plant SWEET sugar transporter family. Proc. Natl. Acad. Sci. USA 2013, 110, E3685–E3694. [Google Scholar] [CrossRef]
- Luo, M.; Jia, M.; Pan, L.; Chen, W.; Zhou, K.; Xi, W. Sugar transporters PpSWEET11a and PpSWEET14 synergistically mediate peach sucrose allocation from source leaves to fruit. Commun. Biol. 2024, 7, 1068. [Google Scholar] [CrossRef] [PubMed]
- Chen, C.; Wu, Y.; Li, J.; Wang, X.; Zeng, Z.; Xu, J.; Liu, Y.; Feng, J.; Chen, H.; He, Y.; et al. TBtools-II: A “one for all, all for one” bioinformatics platform for biological big-data mining. Mol. Plant 2023, 16, 1733–1742. [Google Scholar] [CrossRef]
- Chini, V.; Foka, A.; Dimitracopoulos, G.; Spiliopoulou, I. Absolute and relative real-time PCR in the quantification of tst gene expression among methicillin-resistant Staphylococcus aureus: Evaluation by two mathematical models. Lett. Appl. Microbiol. 2007, 45, 479–484. [Google Scholar] [CrossRef]
- Shcherbo, D.; Murphy, C.S.; Ermakova, G.V.; Solovieva, E.A.; Chepurnykh, T.V.; Shcheglov, A.S.; Verkhusha, V.V.; Pletnev, V.Z.; Hazelwood, K.L.; Roche, P.M.; et al. Far-red fluorescent tags for protein imaging in living tissues. Biochem. J. 2009, 418, 567–574. [Google Scholar] [CrossRef]
Disclaimer/Publisher’s Note: The statements, opinions and data contained in all publications are solely those of the individual author(s) and contributor(s) and not of MDPI and/or the editor(s). MDPI and/or the editor(s) disclaim responsibility for any injury to people or property resulting from any ideas, methods, instructions or products referred to in the content. |
© 2025 by the authors. Licensee MDPI, Basel, Switzerland. This article is an open access article distributed under the terms and conditions of the Creative Commons Attribution (CC BY) license (https://creativecommons.org/licenses/by/4.0/).