Author Contributions
Conceptualization, A.H.P. and P.W.C.; methodology, S.J.W., N.B., P.K., N.K. and S.K.; formal analysis, S.J.W. and W.C.B.; investigation, N.B., N.K. and P.W.C.; resources, S.K., N.B. and P.W.C.; data curation, S.J.W., S.K., D.M.W., E.L., J.A.U. and L.L.H.; writing—original draft preparation, S.J.W.; writing—review and editing, P.K., D.J., L.L.H., W.C.B., C.D., A.H.P. and P.W.C.; visualization, S.J.W., S.K. and D.J.; supervision, P.W.C.; project administration, P.W.C.; funding acquisition, N.K., D.J. and P.W.C. All authors have read and agreed to the published version of the manuscript.
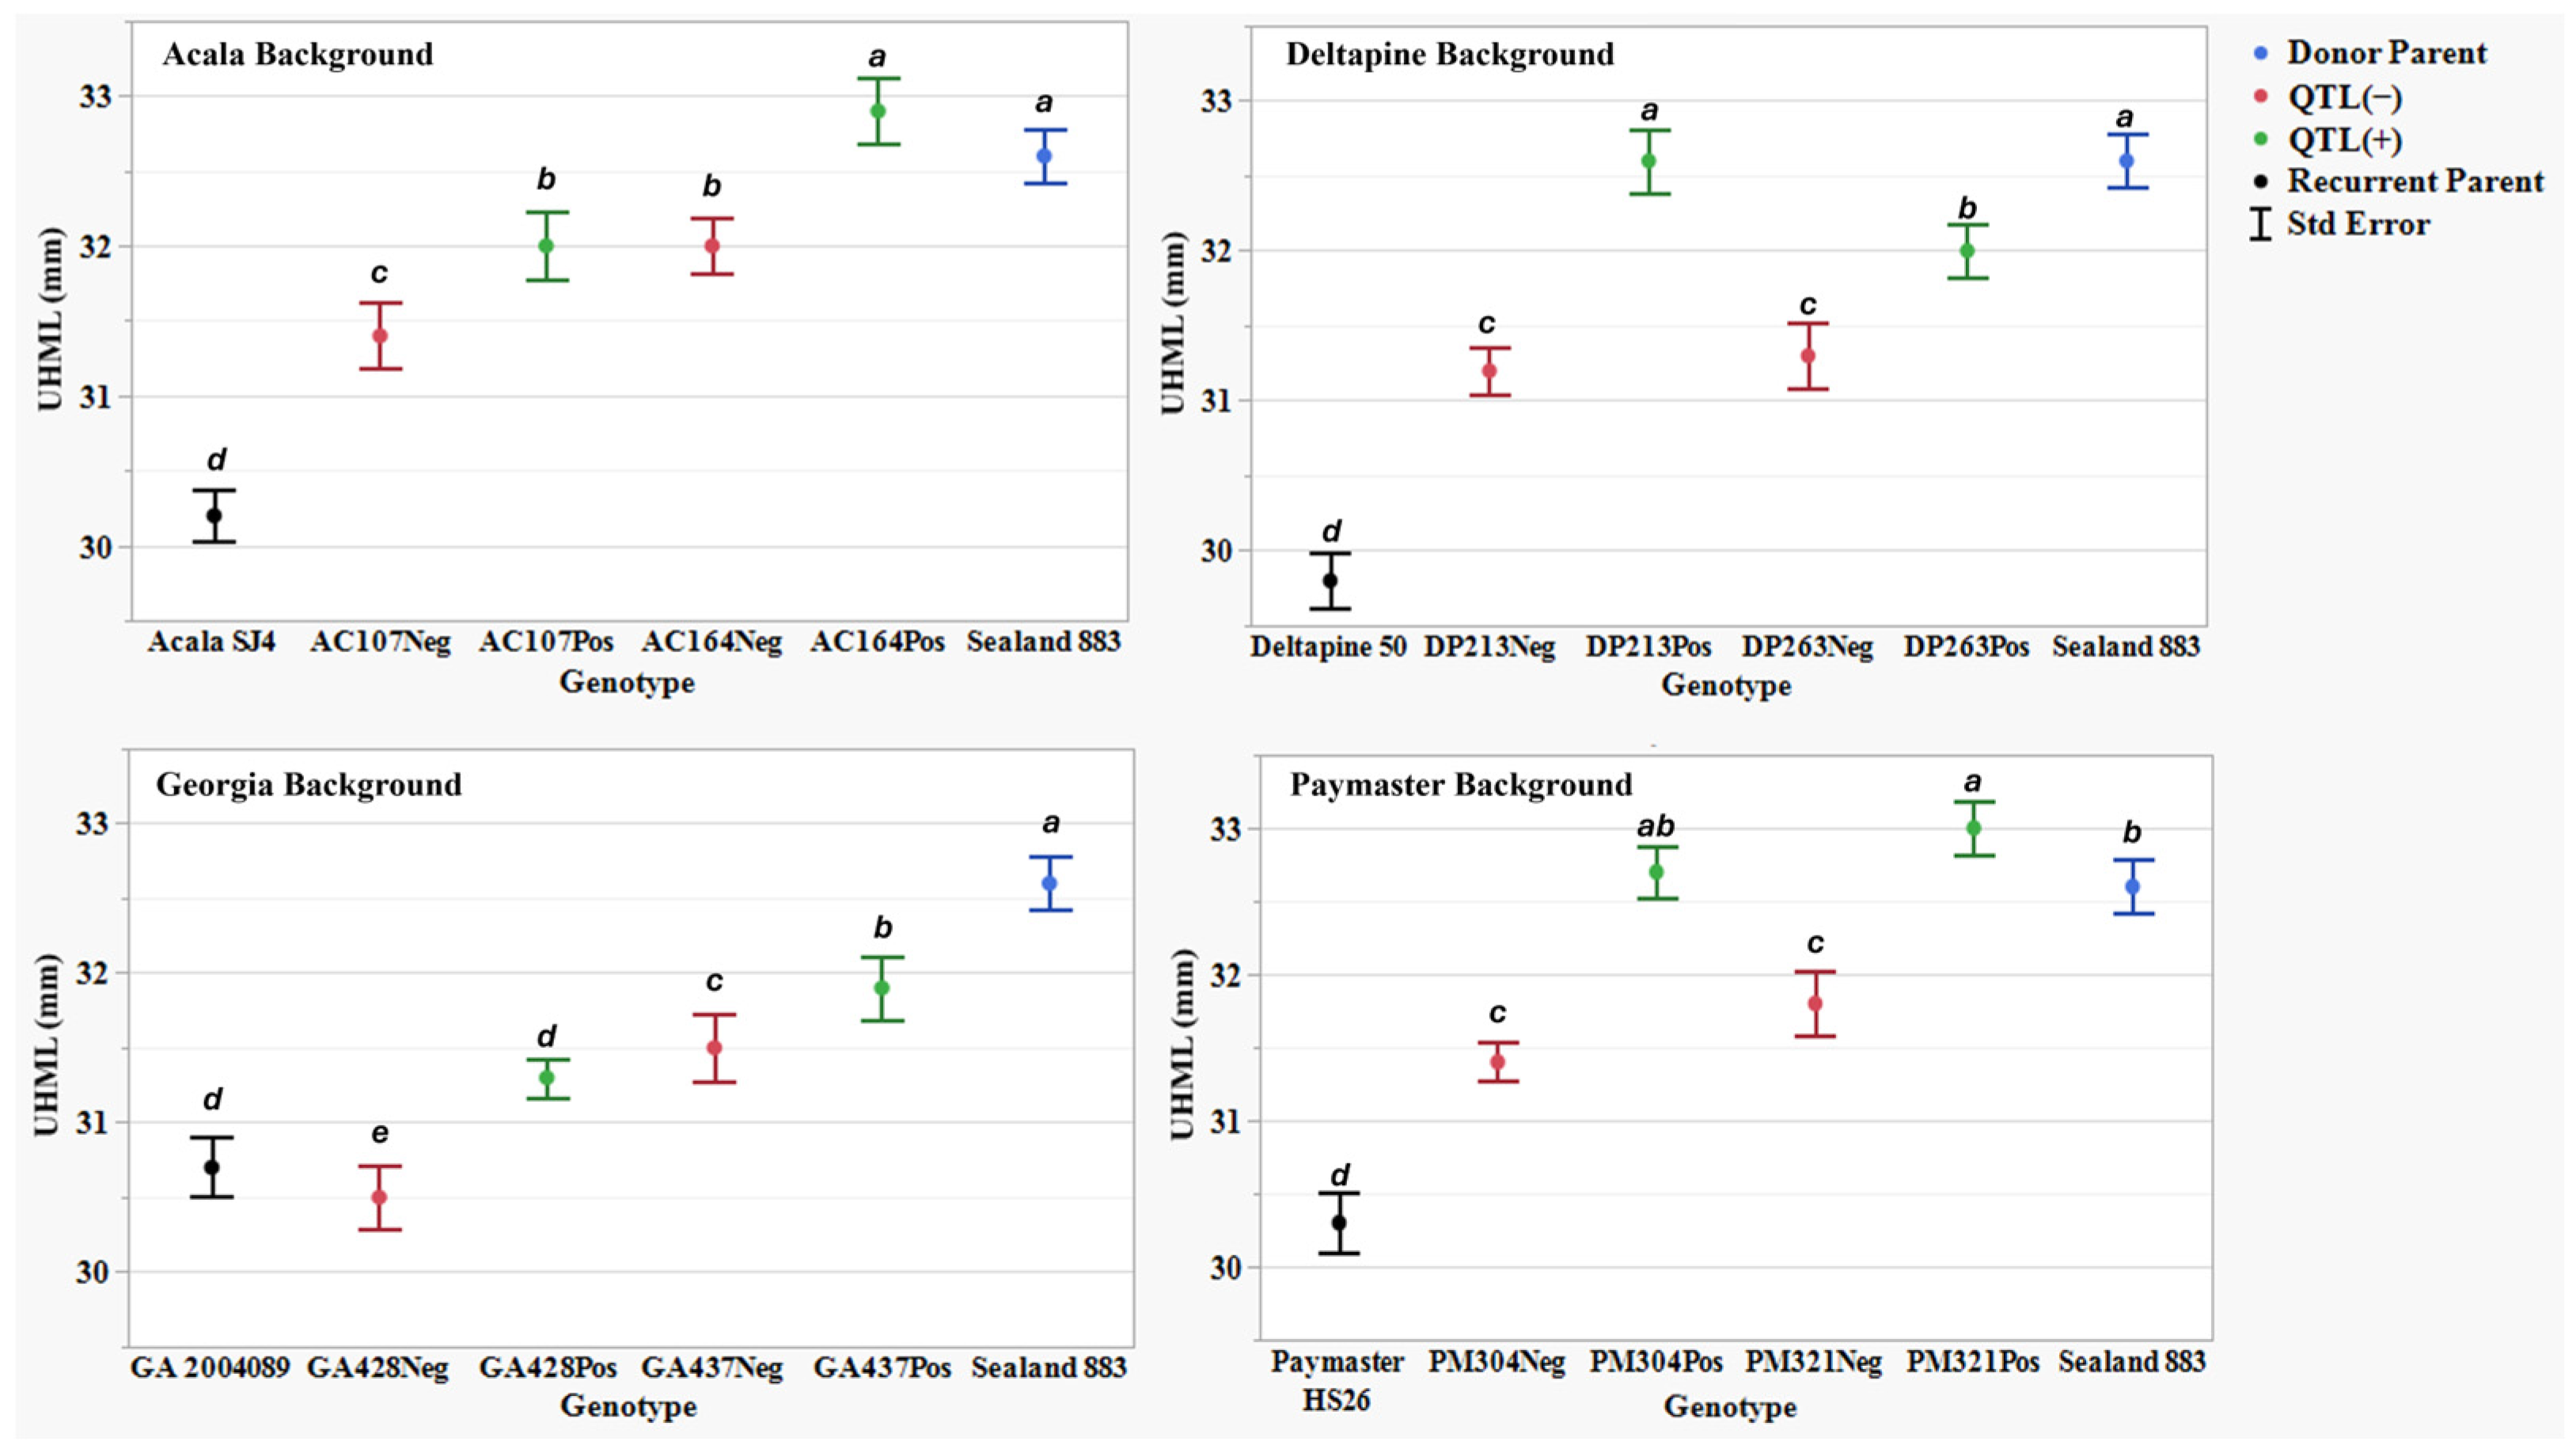
Figure 1.
Upper half mean length (UHML) (mm) means, standard errors, and mean separations (k = 100, based on Waller-Duncan LSD, represented with alphabet letters) for sixteen near-isogenic introgression lines differing for qFL-Chr.25, deployed within four regionally adapted genetic backgrounds (Acala, Deltapine, Georgia, and Paymaster) compared to the recurrent cultivar parents (ACSJ4, DP50, GA089, PMHS26) and the QTL donor parent (SL883), in Tifton, GA, in 2020 and 2023, College Station, TX, Plains, GA, and Tifton, GA, in 2021 and 2022.
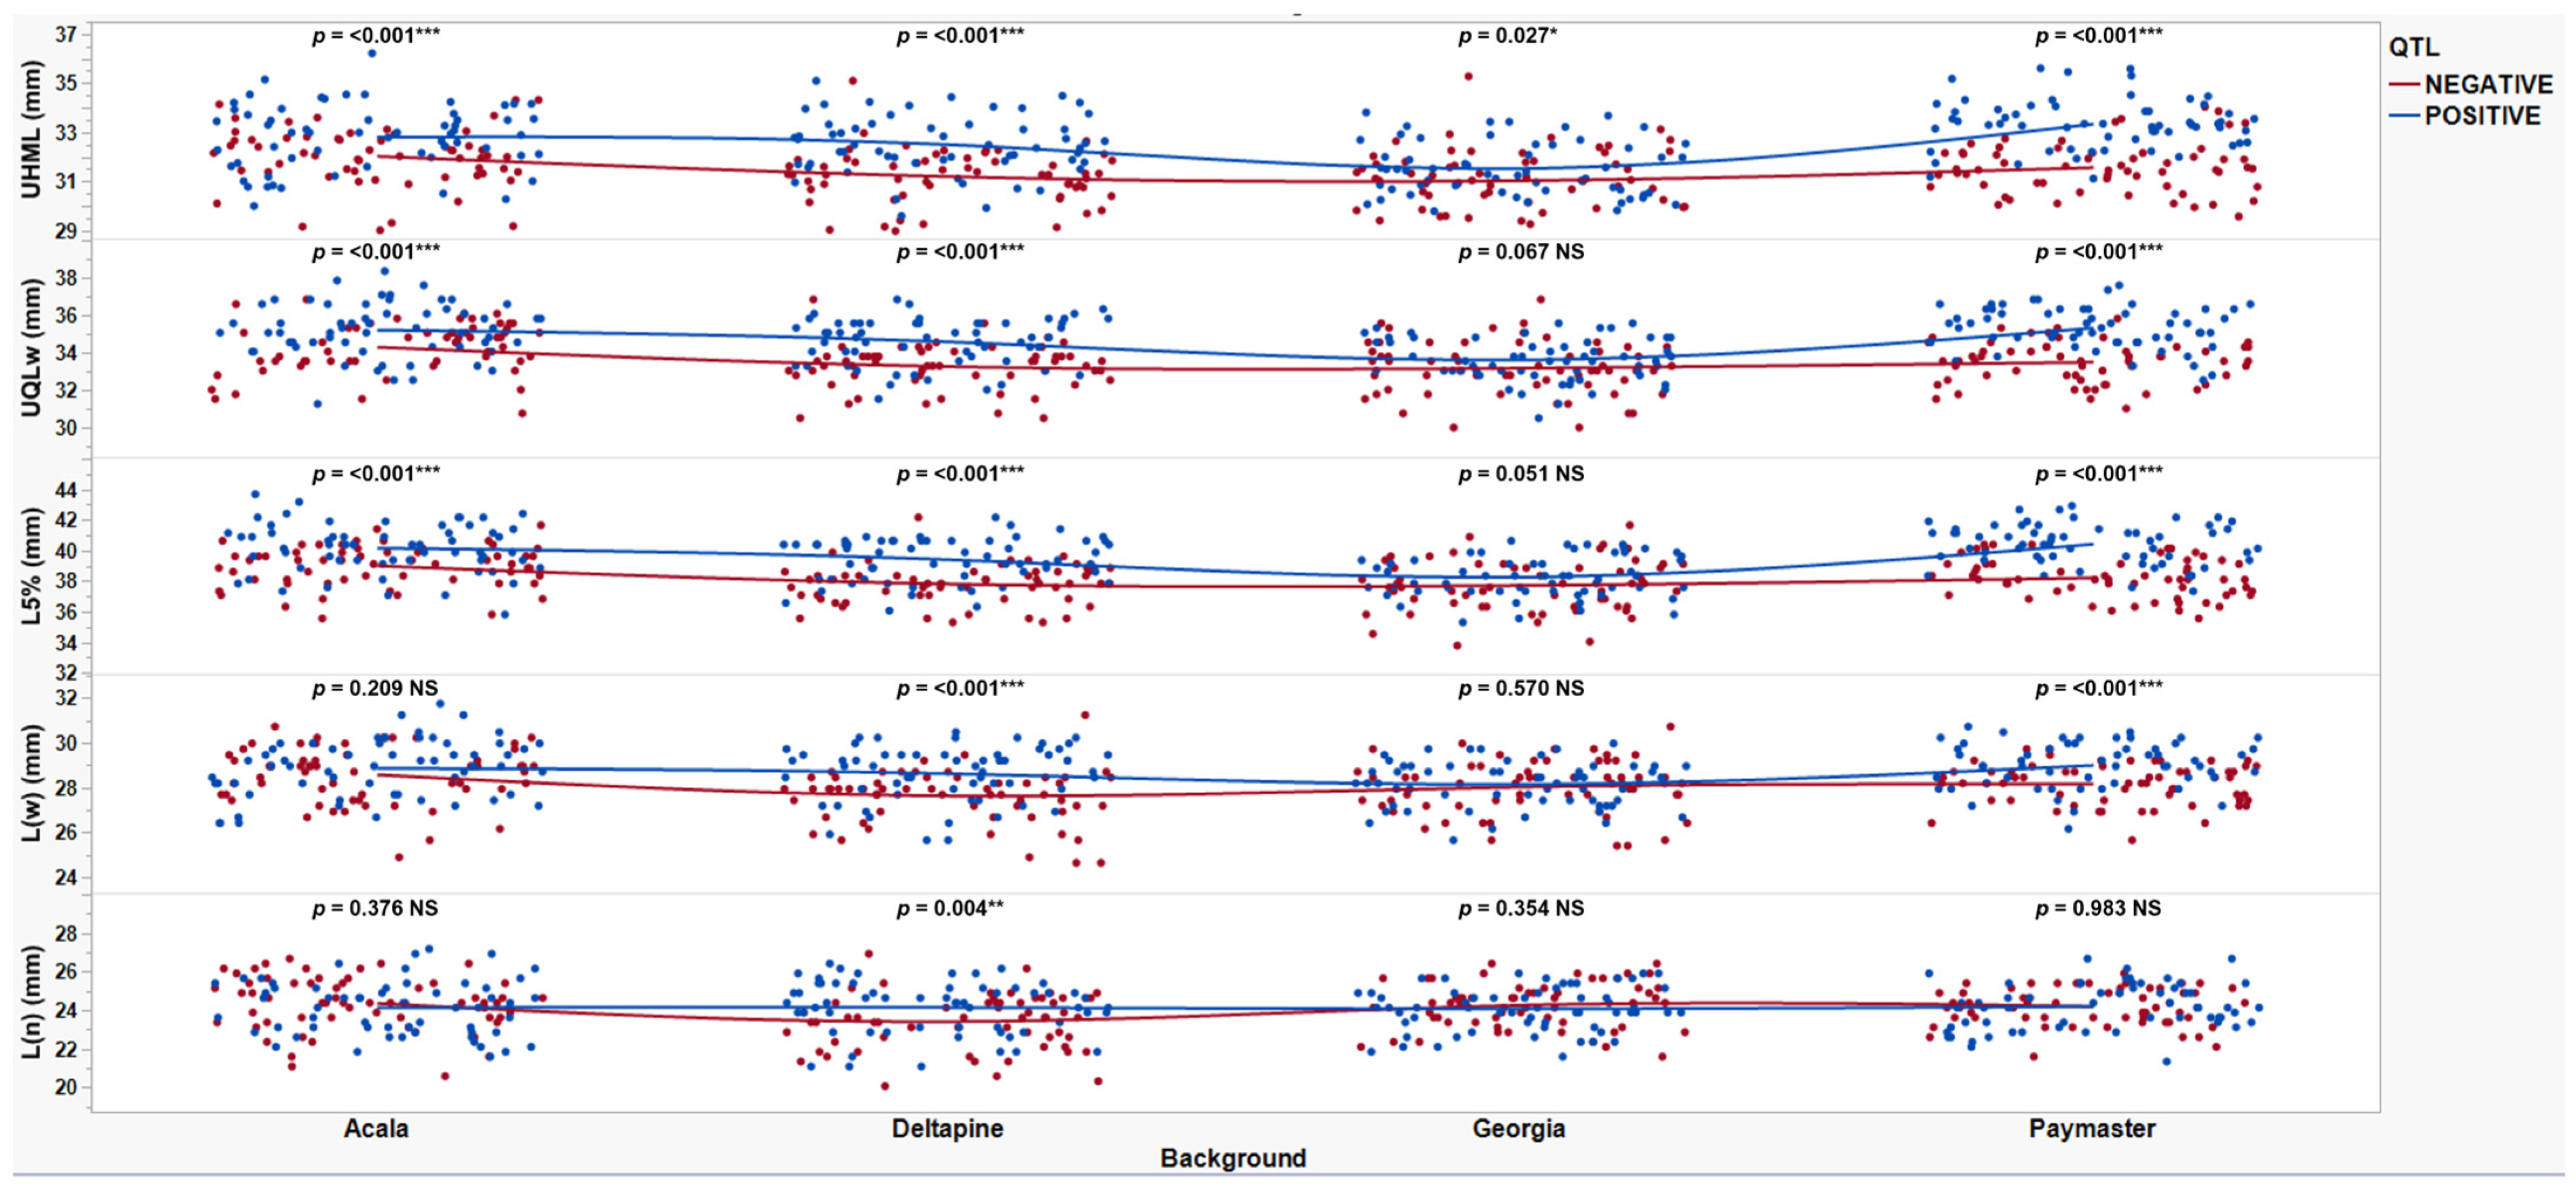
Figure 2.
Scatterplots of near-isogenic introgression lines with QTL(+) (blue) and QTL(−) (red) by background (Acala, Deltapine, Georgia, and Paymaster) for all fiber length traits (UHML, UQL(w), L5%, L(w), and L(n)) in mm tested in Tifton, GA, in 2020 and 2023, College Station, TX, Plains, GA, and Tifton, GA, in 2021 and 2022. *, **, and *** represent significance with p-values of 0.05, 0.01, and 0.001, respectively. NS denotes not significant.
Figure 3.
Length by number L(n) (mm) means, standard errors, and mean separations (k = 100, based on Waller-Duncan LSD, represented with alphabet letters) for sixteen nearly isogenic introgression lines differing for qFL-Chr.25, deployed within four regionally adapted genetic backgrounds (Acala, Deltapine, Georgia, and Paymaster) compared to the recurrent cultivar parents (ACSJ4, DP50, GA089, PMHS26) and the QTL donor parent (SL883), in Tifton, GA, in 2020 and 2023, College Station, TX, Plains, GA, and Tifton, GA, in 2021 and 2022.
Figure 4.
Length by weight L(w) (mm) means, standard errors, and mean separations (k = 100, based on Waller-Duncan LSD, represented with alphabet letters) for sixteen nearly isogenic introgression lines differing for qFL-Chr.25, deployed within four regionally adapted genetic backgrounds (Acala, Deltapine, Georgia, and Paymaster) compared to the recurrent cultivar parents (ACSJ4, DP50, GA089, PMHS26) and the QTL donor parent (SL883), in Tifton, GA, in 2020 and 2023, College Station, TX, Plains, GA, and Tifton, GA, in 2021 and 2022.
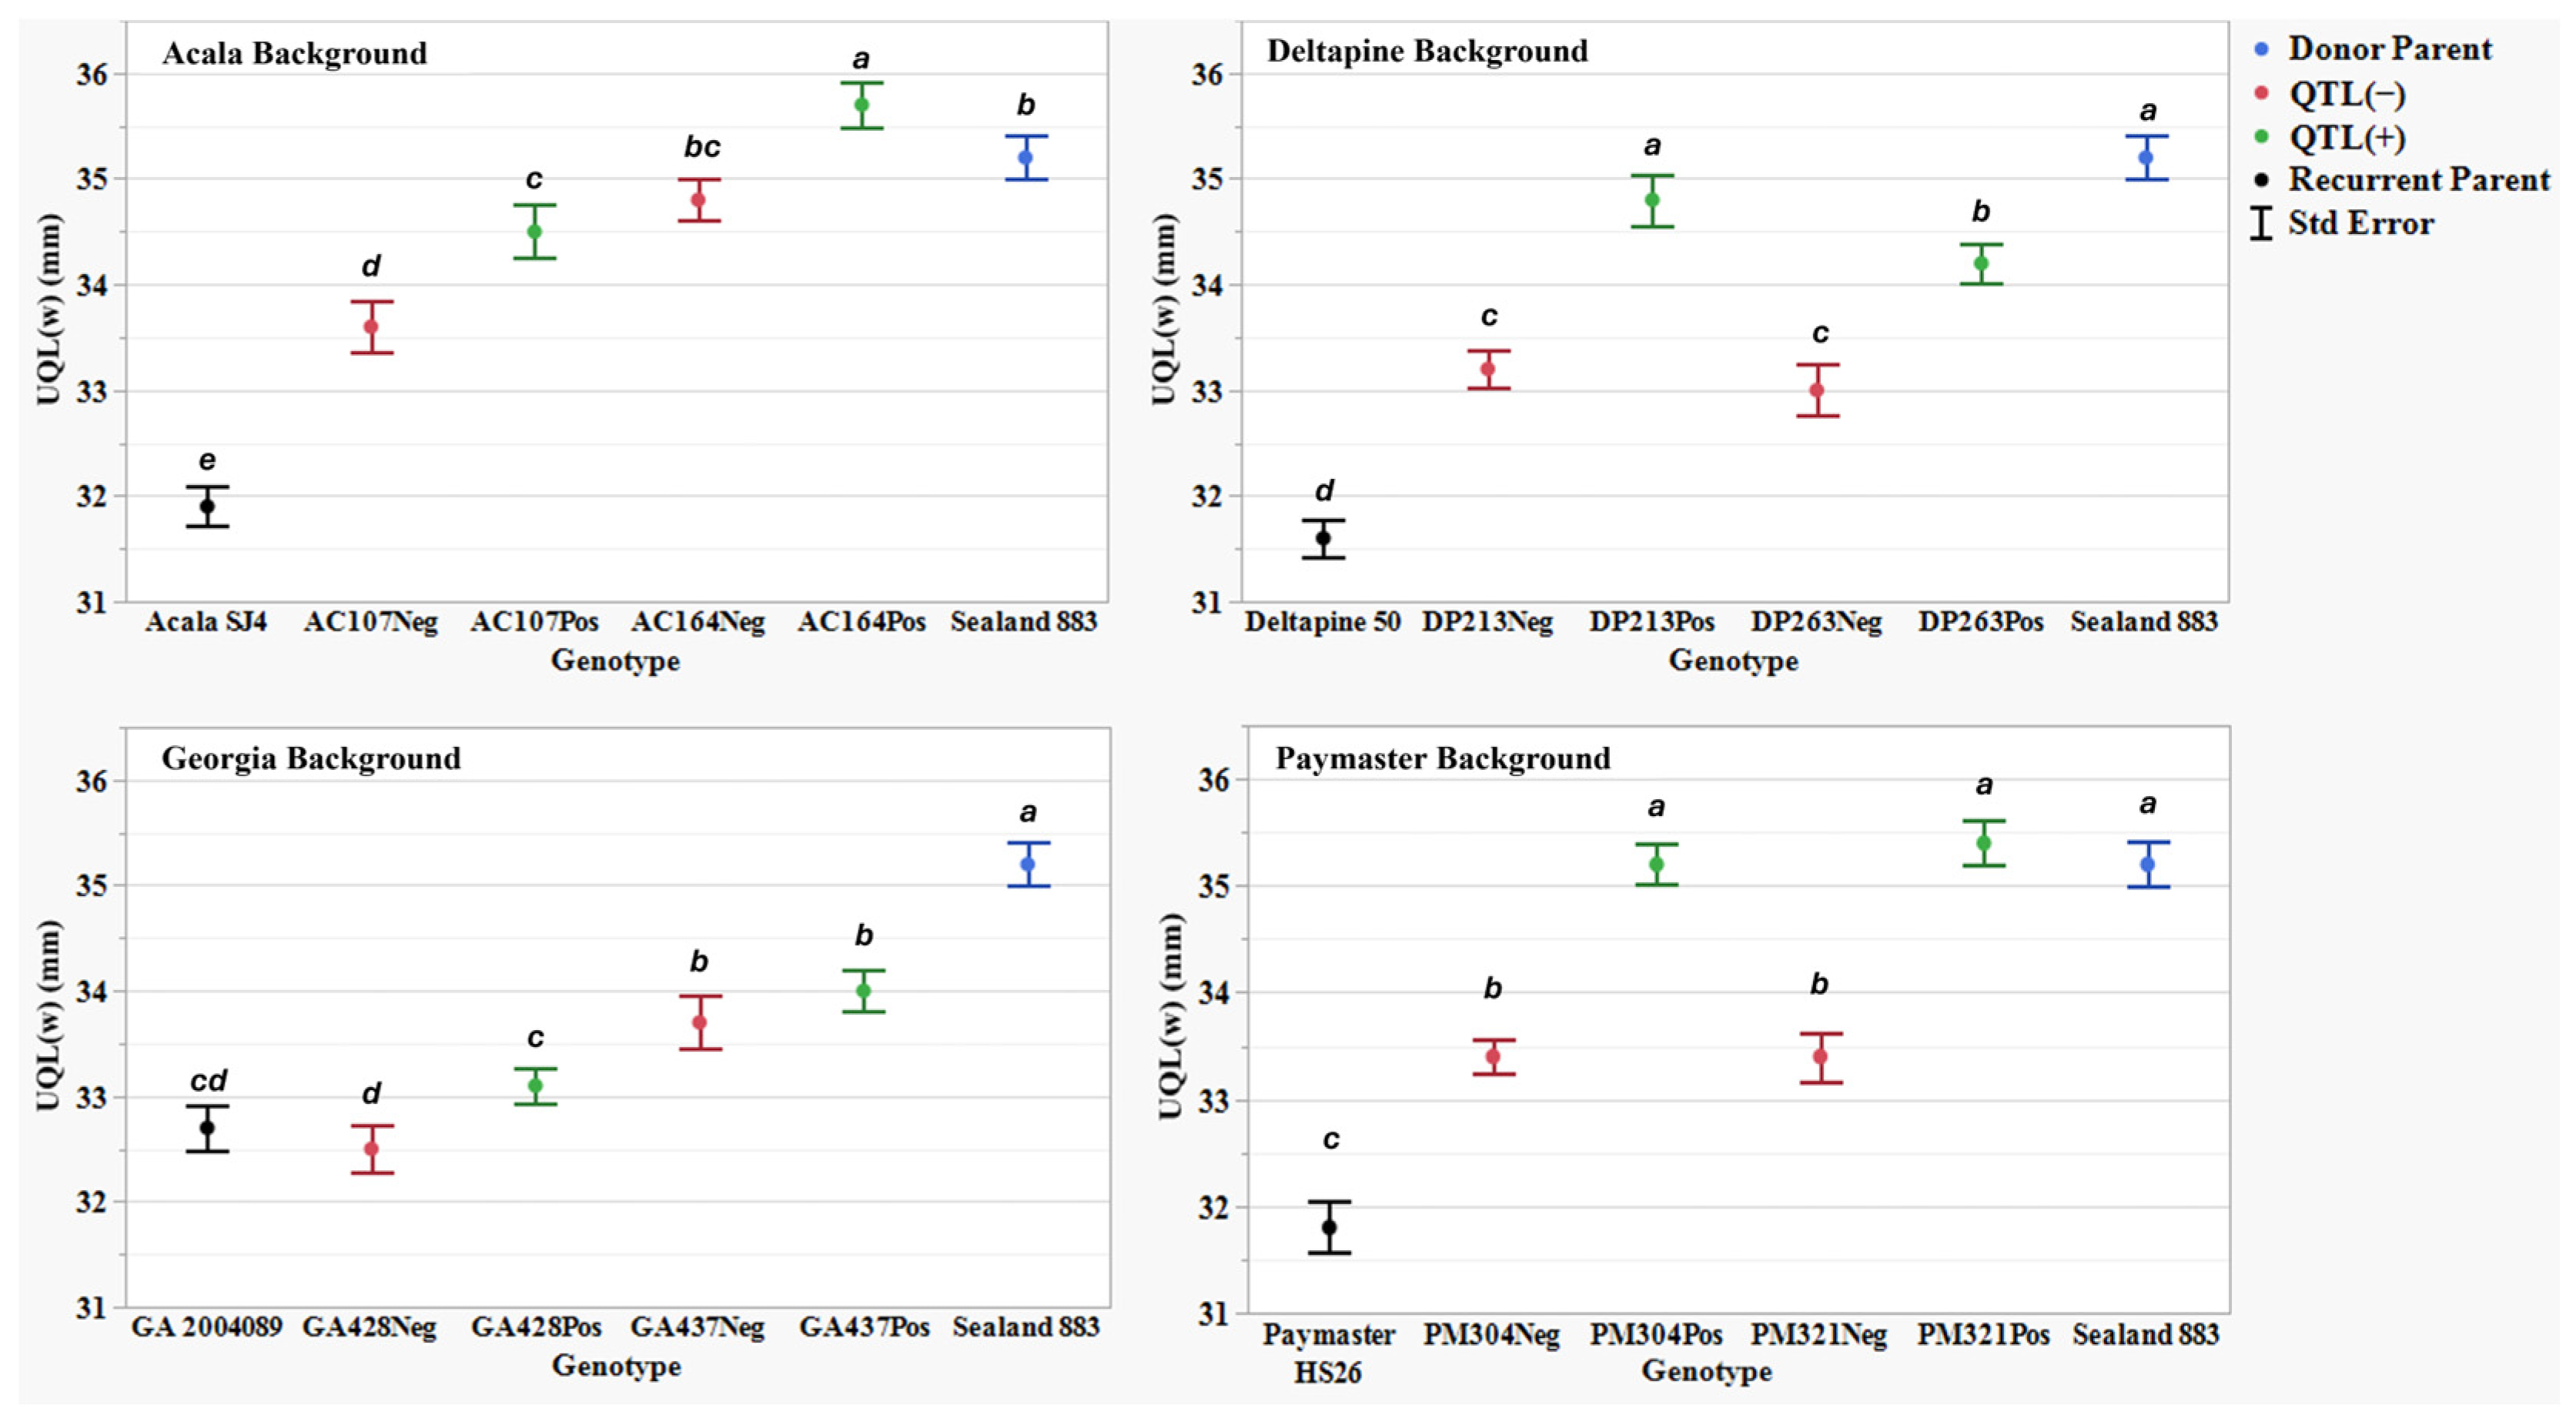
Figure 5.
Upper quartile length (UQL(w)) (mm) means, standard errors, and mean separations (k = 100, based on Waller-Duncan LSD, represented with alphabet letters) for sixteen nearly isogenic introgression lines differing for qFL-Chr.25, deployed within four regionally adapted genetic backgrounds (Acala, Deltapine, Georgia, and Paymaster) compared to the recurrent cultivar parents (ACSJ4, DP50, GA089, PMHS26) and the QTL donor parent (SL883), in Tifton, GA, in 2020 and 2023, College Station, TX, Plains, GA, and Tifton, GA, in 2021 and 2022.
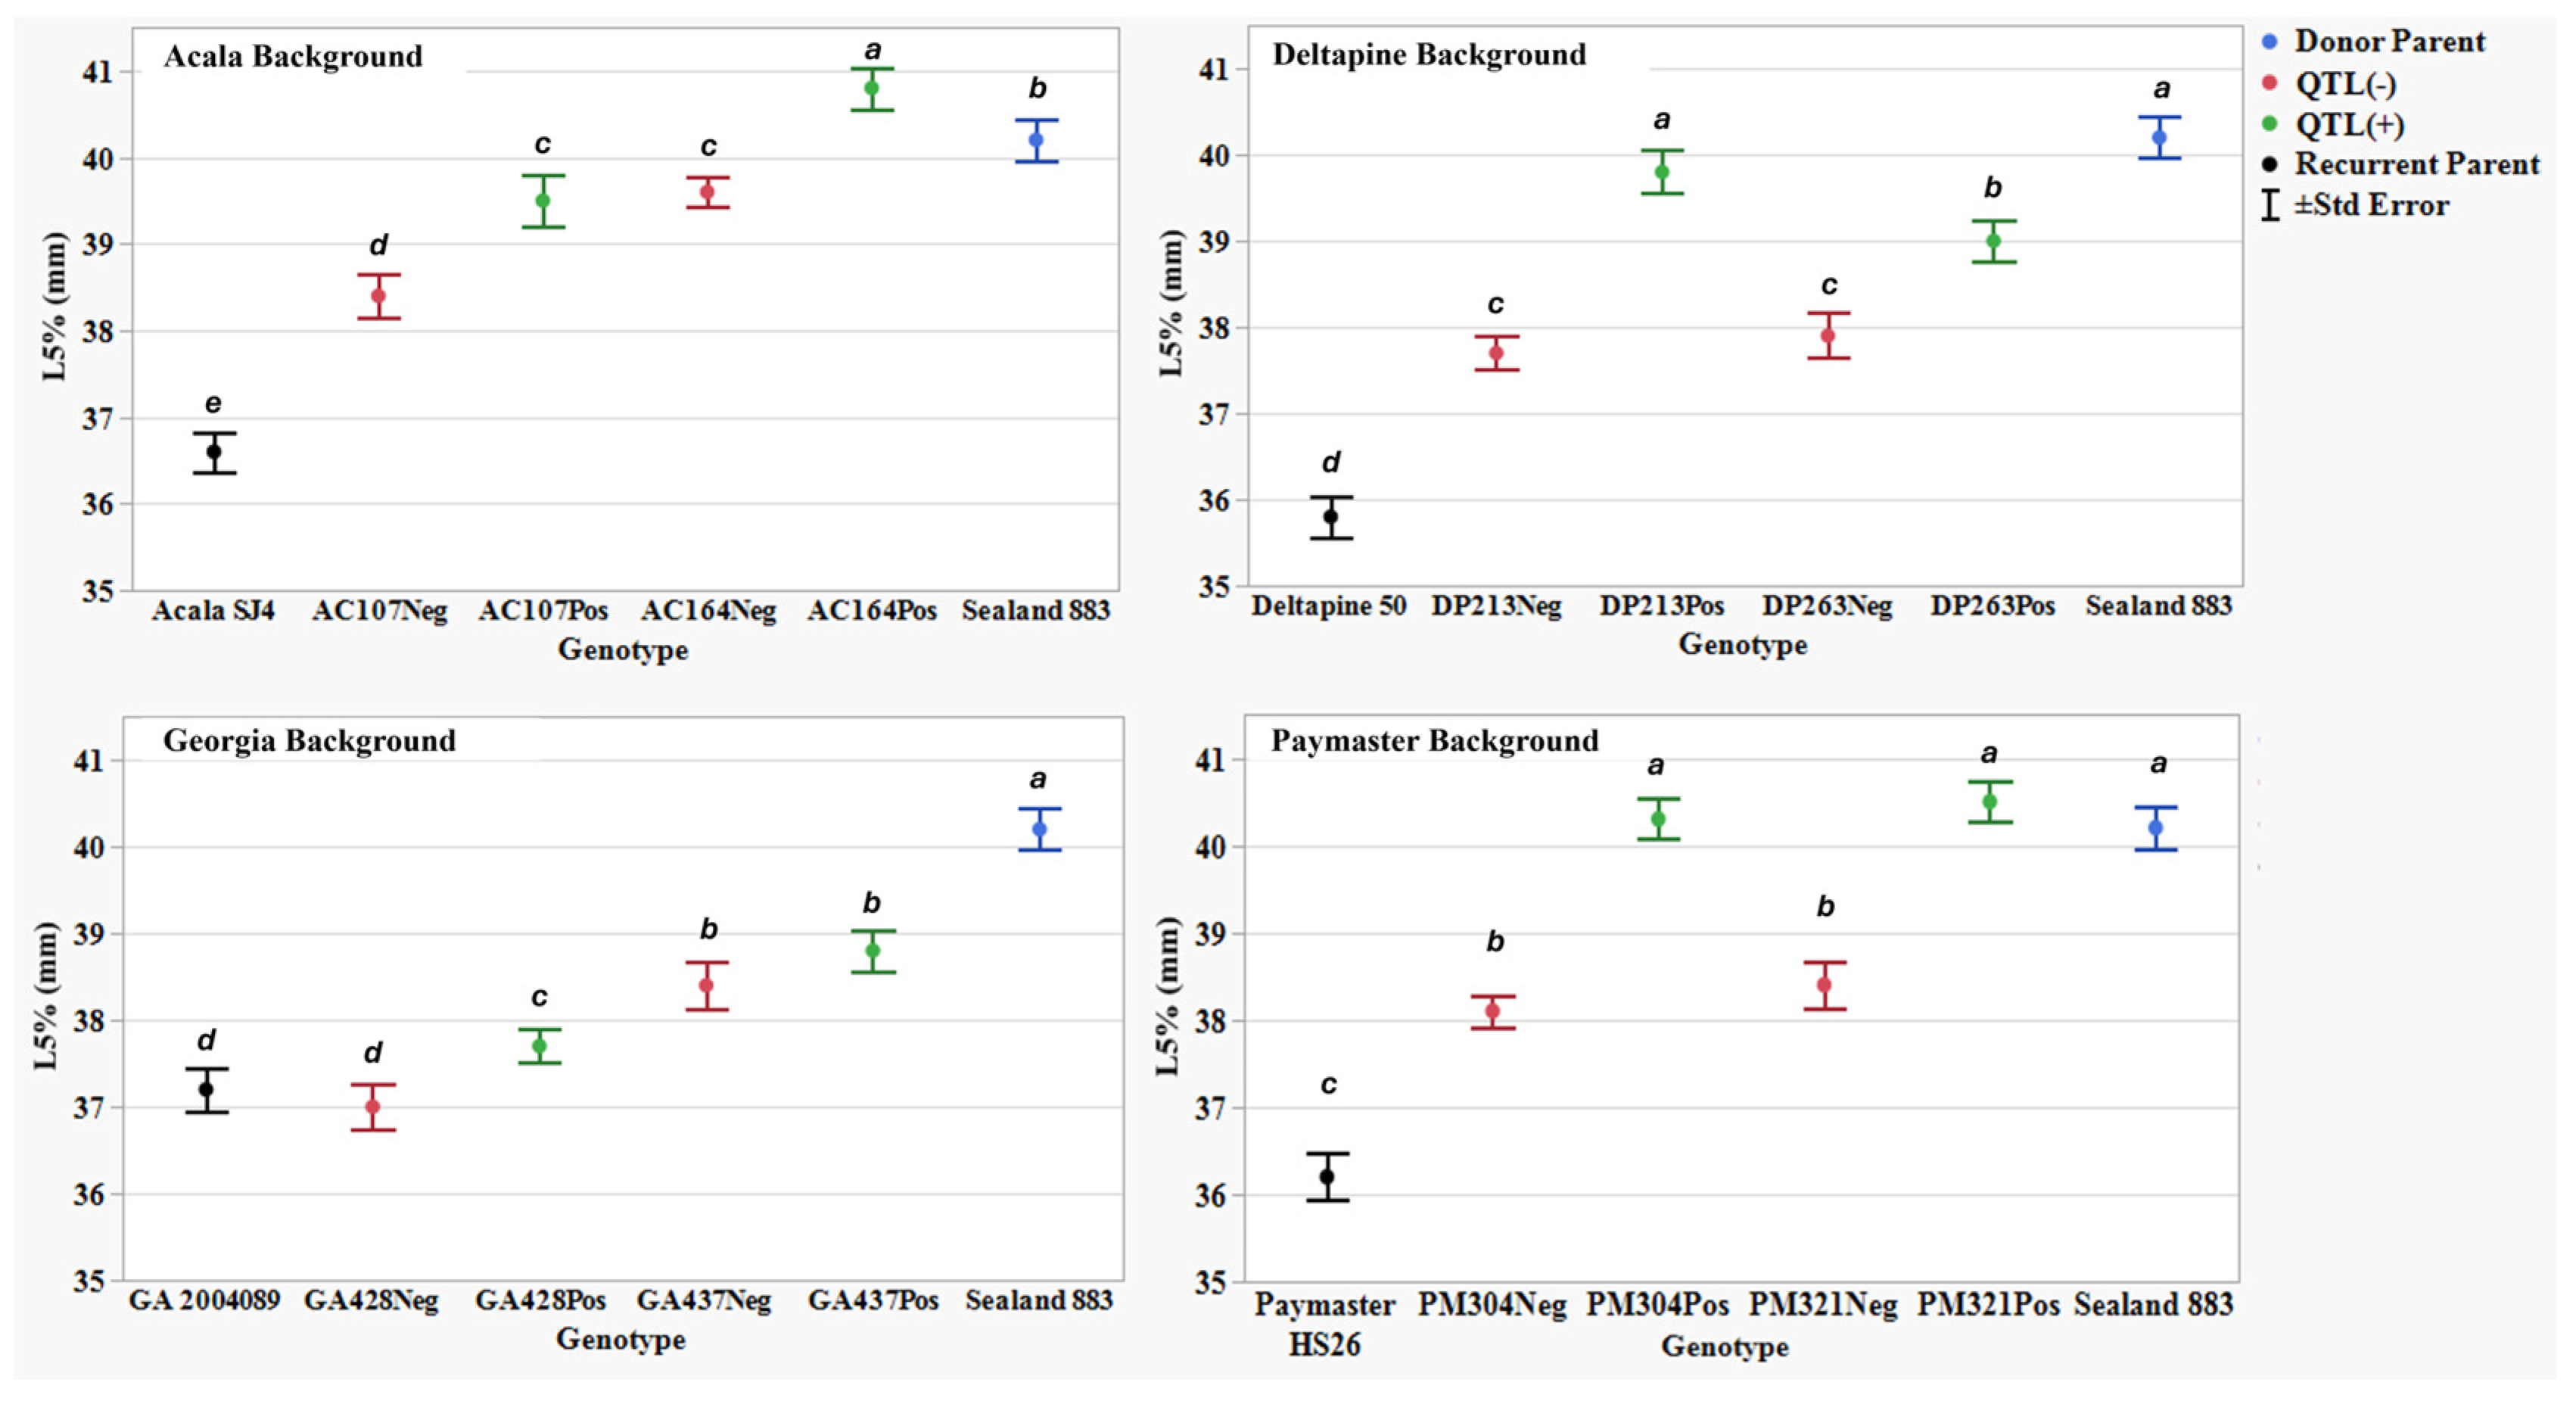
Figure 6.
The 5% span length by number (L5%) (mm) means, standard errors, and mean separations (k = 100, based on Waller-Duncan LSD, represented with alphabet letters) for sixteen nearly isogenic introgression lines differing for qFL-Chr.25, deployed within four regionally adapted genetic backgrounds (Acala, Deltapine, Georgia, and Paymaster) compared to the recurrent cultivar parents (ACSJ4, DP50, GA089, PMHS26) and the QTL donor parent (SL883), in Tifton, GA, in 2020 and 2023, College Station, TX, Plains, GA, and Tifton, GA, in 2021 and 2022.
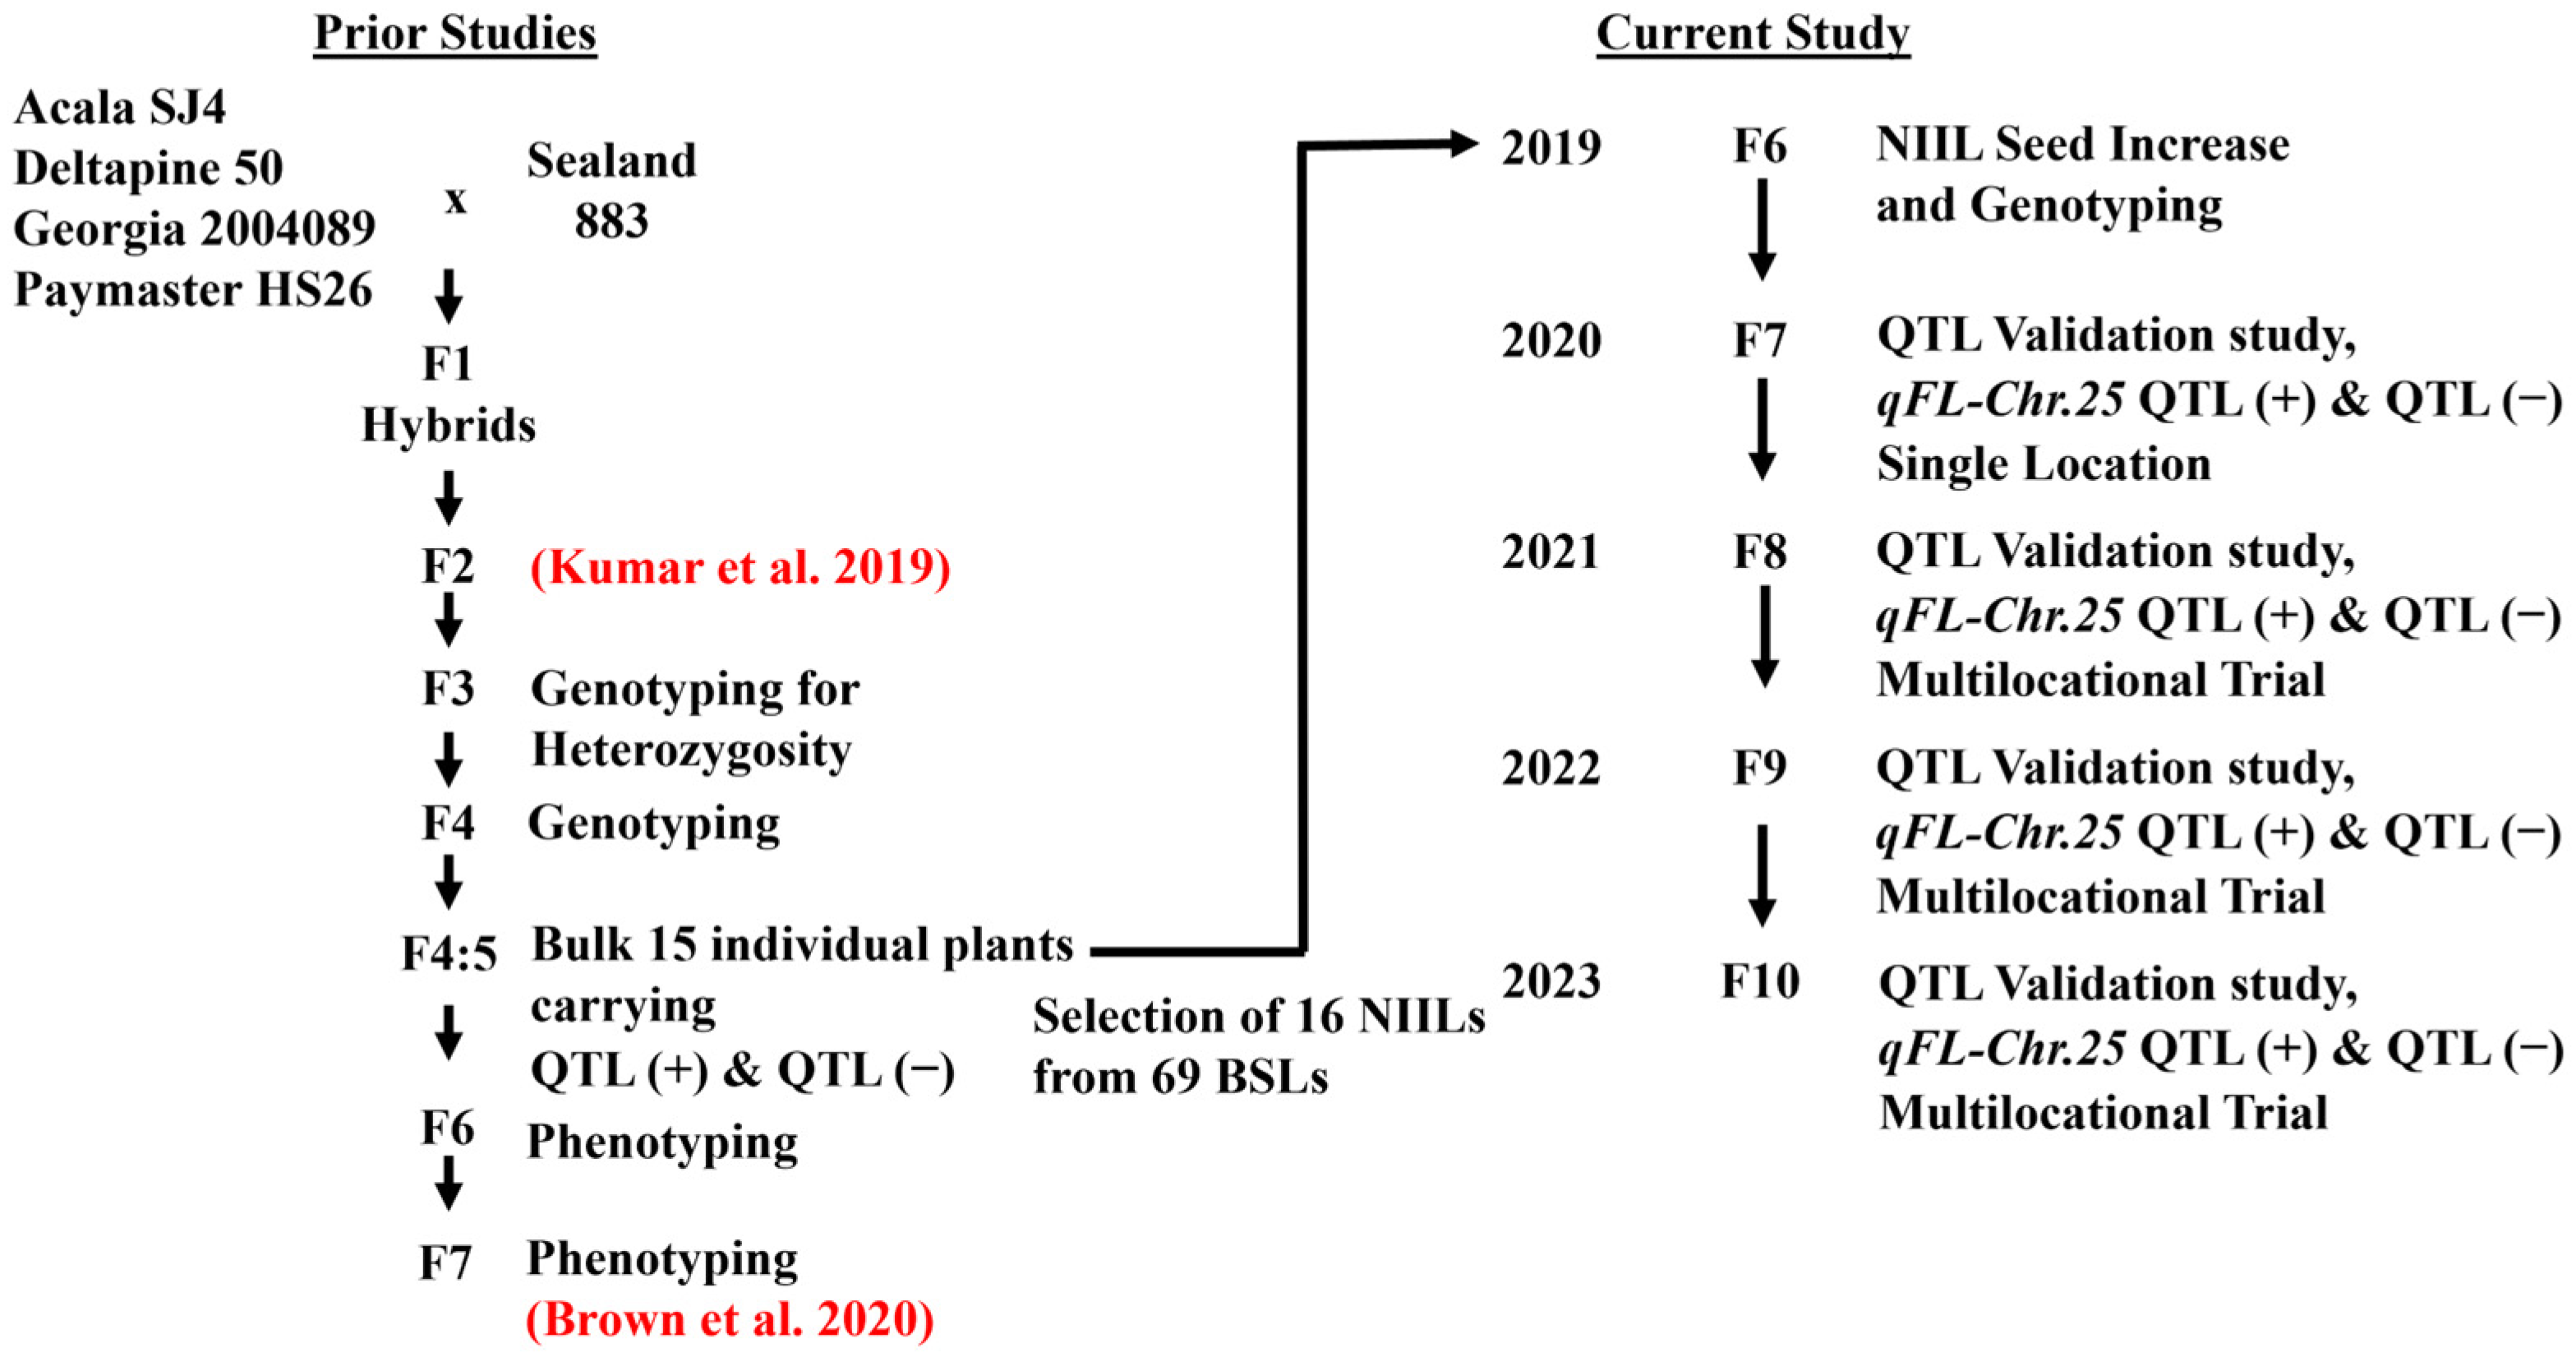
Figure 7.
Flowchart for population development including original cross, previous studies [
17,
30], and current study.
Figure 7.
Flowchart for population development including original cross, previous studies [
17,
30], and current study.
Table 1.
Attributes of SNP markers associated with qFL-Chr.25.
Table 1.
Attributes of SNP markers associated with qFL-Chr.25.
| | SNP Marker a |
|---|
| | i17091Gh b | i10579Gh |
|---|
| Chromosome | D06 | D06 |
| SNP location c | 867,431 | 1,072,116 |
| Forward primer | TCTTTCTCTTTCCTCCCCTCTCTAC | TACTCATTCGTTGGTTCGTCAAGT |
| Reverse primer | GGACATGGCTGGTTGAAGTGA | GGTGGCCTCGAAAATCAGAA |
| G. barbadense allele | C | T |
| G. hirsutum allele | T | C |
| “Gb” allele probe d | AATAGCTCCTCCCCCAT | TTTTCCTCCCGGTCG |
| “Gh” allele probe | TAGCTCCTCCTCCATC | TCCTCCCGGCCGC |
| 50 bp sequence spanning the SNP marker | CTACCTCTCCAACAATAGCTCCTCC[C/T]CCATCTTCACTGCACCGTCACTTCA | TGGATACTCCTCGTTTTCCTCCCGG[T/C]CGCCGCCCTTCTGATTTTCGAGGCC |
Table 2.
Analysis of variance mean squares for HVI traits across eight environments.
Table 2.
Analysis of variance mean squares for HVI traits across eight environments.
| Source | DF | † UHML | MIC | UI | STR | ELO | SFI |
|---|
| Rep | 3 | 2.6 | 0.12 | 1.3 | 3.4 | 0.05 | 1.0 |
| Env | 7 | 48.8 ** | 3.62 ** | 106.2 ** | 61.3 ** | 44.81 ** | 139.9 ** |
| Error A | 19 | 1.7 ** | 0.14 ** | 1.4 | 3.3 * | 0.22 ** | 0.7 * |
| Genotype | 20 | 40.5 ** | 3.55 ** | 2.4 ** | 21.7 ** | 4.63 ** | 7.8 ** |
| GxE | 140 | 0.6 | 0.09 ** | 0.8 | 2.1 * | 0.15 ** | 0.6 ** |
| Error B | 440 | 0.8 | 0.05 | 0.8 | 1.5 | 0.07 | 0.3 |
Table 3.
Analysis of variance mean squares for AFIS traits across eight environments.
Table 3.
Analysis of variance mean squares for AFIS traits across eight environments.
| Source | DF | † L(w) | L(n) | UQL(w) | L5% | SFC(w) | SFC(n) | Fine | IFC | MatRatio | StdFine |
|---|
| Rep | 3 | 1.6 | 2.6 | 3.0 | 5.0 | 3.8 | 22 | 19 | 1.0 | 0.0009 | 29 |
| Env | 7 | 61.0 ** | 82.8 ** | 55.4 ** | 75.1 ** | 84.1 ** | 491 ** | 3000 ** | 147.1 ** | 0.1827 ** | 586 ** |
| Error A | 19 | 1.3 ** | 1.3 ** | 1.5 * | 1.9 * | 1.4 ** | 7 * | 89 ** | 0.8 ** | 0.0006 ** | 56 ** |
| Genotype | 20 | 13.7 ** | 4.7 ** | 43.1 ** | 62.7 ** | 10.6 ** | 86 ** | 1508 ** | 4.4 ** | 0.0054 ** | 1497 ** |
| GxE | 140 | 0.6 | 0.7* | 0.8 | 1.0 | 0.9 ** | 5 ** | 30 | 0.4 ** | 0.0003 * | 19 * |
| Error B | 440 | 0.5 | 0.5 | 0.7 | 0.9 | 0.5 | 3 | 23 | 0.2 | 0.0002 | 13 |
Table 4.
Pearson correlation coefficients among High Volume Instrument (HVI, in blue) and Advanced Fiber Information System (AFIS, in green) fiber quality traits across eight environments.
Table 4.
Pearson correlation coefficients among High Volume Instrument (HVI, in blue) and Advanced Fiber Information System (AFIS, in green) fiber quality traits across eight environments.
| | HVI Traits | AFIS Traits |
|---|
| Trait | UHML † | MIC | UI | STR | ELO | SFI | L(w) | L(n) | UQL(w) | L5% | SFC(w) | SFC(n) | Fine | IFC | MatRatio |
| MIC | −0.55 ** | | | | | | | | | | | | | | |
| UI | 0.35 ** | −0.01 | | | | | | | | | | | | | |
| STR | 0.15 ** | −0.01 | −0.03 | | | | | | | | | | | | |
| ELO | 0.01 | 0.01 | 0.56 ** | −0.43 ** | | | | | | | | | | | |
| SFI | −0.67 ** | 0.34 ** | −0.68 ** | 0.06 | −0.50 ** | | | | | | | | | | |
| L(w) | 0.8 ** | −0.32 ** | 0.55 ** | 0.13 * | 0.19 ** | −0.69 ** | | | | | | | | | |
| L(n) | 0.54 ** | −0.07 | 0.67 ** | 0.03 | 0.36 ** | −0.64 ** | 0.89 ** | | | | | | | | |
| UQL(w) | 0.9 ** | −0.49 ** | 0.35 ** | 0.16 ** | −0.01 | −0.63 ** | 0.92 ** | 0.65 ** | | | | | | | |
| L5% | 0.9 ** | −0.53 ** | 0.31 ** | 0.13 ** | 0.01 | −0.66 ** | 0.89 ** | 0.62 ** | 0.98 ** | | | | | | |
| SFC(w) | −0.11 * | −0.24 ** | −0.65 ** | 0.03 | −0.49 ** | 0.48 ** | −0.54 ** | −0.84 ** | −0.2 ** | −0.17 ** | | | | | |
| SFC(n) | 0.01 | −0.26 ** | −0.58 ** | 0.11 * | −0.50 ** | 0.40 ** | −0.41 ** | −0.77 ** | −0.06 | −0.05 | 0.97 ** | | | | |
| Fine | −0.55 ** | 0.81 ** | 0.02 | −0.07 | 0.05 | 0.21 ** | −0.31 ** | −0.11 * | −0.46 ** | −0.49 ** | −0.23 ** | −0.22 ** | | | |
| IFC | 0.21 ** | −0.42 ** | 0.02 | −0.09 | 0.14 ** | 0.08 | 0.06 | 0.04 | 0.11 * | 0.08 | 0.18 ** | 0.12 * | −0.67 ** | | |
| MatRatio | −0.17 ** | 0.43 ** | −0.01 | 0.15 ** | −0.19 ** | −0.05 | −0.03 | −0.03 | −0.08 | −0.07 | −0.18 ** | −0.10 | 0.69 ** | −0.95 ** | |
| StdFine | −0.55 ** | 0.62 ** | 0.04 | −0.27 ** | 0.28 ** | 0.33 ** | −0.38 ** | −0.12 * | −0.53 ** | −0.58 ** | −0.10 * | −0.19 ** | 0.59 ** | 0.15 ** | −0.18 ** |
Table 5.
High volume instrument (HVI) fiber property means of NIILS differing for qFL-Chr.25 within four regionally adapted backgrounds compared to the recurrent and QTL donor parents across eight environments.
Table 5.
High volume instrument (HVI) fiber property means of NIILS differing for qFL-Chr.25 within four regionally adapted backgrounds compared to the recurrent and QTL donor parents across eight environments.
| Background | Genotype | UHML † | MIC | UI | STR | ELO | SFI |
|---|
| | | mm | unit | % | kN m kg−1 | % | % |
| Acala | ACSJ4 | 30.0 d ‡ | 4.5 a | 84.2 b | 32.7 ab | 6.5 a | 6.3 a |
| | AC107Neg | 31.6 c | 4.2 b | 84.0 bc | 32.4 abc | 5.8 b | 6.1 a |
| | AC107Pos | 32.4 b | 3.7 d | 83.7 c | 31.8 c | 5.7 b | 5.7 b |
| | AC164Neg | 32.4 b | 4.0 c | 84.8 a | 33.1 a | 5.6 c | 5.5 bc |
| | AC164Pos | 33.2 a | 3.8 d | 84.1 bc | 32.7 a | 5.2 d | 5.3 c |
| | SL883 | 32.9 a | 3.7 d | 83.7 bc | 31.9 bc | 5.5 c | 5.3 c |
| Deltapine | DP50 | 29.5 d | 4.8 a | 84.2 a | 29.2 c | 6.8 a | 6.9 a |
| | DP213Neg | 31.1 c | 4.2 b | 84.2 a | 31.2 b | 6.0 c | 6.6 b |
| | DP213Pos | 33.0 a | 3.9 d | 84.2 a | 32.5 a | 5.6 d | 5.3 d |
| | DP263Neg | 31.3 c | 3.9 d | 83.9 a | 30.8 b | 5.9 c | 6.3 b |
| | DP263Pos | 32.0 b | 4.0 c | 84.3 a | 32.1 a | 6.4 b | 5.7 c |
| | SL883 | 32.9 a | 3.7 e | 83.7 a | 31.9 a | 5.5 d | 5.3 d |
| Georgia | GA089 | 30.8 d | 4.7 a | 84.56 a | 30.4 b | 6.5 a | 6.3 ab |
| | GA428Neg | 30.5 e | 4.0 c | 84.3 ab | 31.5 a | 6.3 b | 6.3 a |
| | GA428Pos | 31.0 d | 3.9 d | 84.6 a | 31.7 a | 6.1 c | 6.1 ab |
| | GA437Neg | 31.6 c | 4.2 b | 84.1 bc | 31.9 a | 6.1 c | 6.0 bc |
| | GA437Pos | 32.0 b | 4.0 cd | 84.1 bc | 31.4 a | 5.9 d | 5.8 c |
| | SL883 | 32.9 a | 3.7 e | 83.7 c | 31.9 a | 5.5 e | 5.3 d |
| Paymaster | PMHS26 | 29.7 d | 4.9 a | 84.6 a | 31.9 a | 6.0 a | 6.3 a |
| | PM304Neg | 31.4 c | 4.3 b | 84.5 a | 32.1 a | 5.6 cd | 6.0 b |
| | PM304Pos | 33.3 ab | 4.0 c | 84.0 b | 32.2 a | 5.6 c | 5.1 cd |
| | PM321Neg | 31.7 c | 4.1 c | 84.2 ab | 31.6 a | 5.9 b | 6.0 b |
| | PM321Pos | 33.4 a | 3.9 d | 83.9 b | 31.8 a | 5.5 de | 5.0 d |
| | SL883 | 32.9 b | 3.7 e | 83.7 b | 31.9 a | 5.5 e | 5.3 c |
| CV (%) | | 3.5 | 7.8 | 1.7 | 4.9 | 13.2 | 24.0 |
Table 6.
Upper half mean length (UHML) improvement attributed to the presence of qFL-Chr.25 within eight NIILs deployed in four different backgrounds across eight environments.
Table 6.
Upper half mean length (UHML) improvement attributed to the presence of qFL-Chr.25 within eight NIILs deployed in four different backgrounds across eight environments.
| Background | NIILs | QTL(+) | std dev | QTL(−) | std dev | Difference |
|---|
| Acala | AC107 | 32.4 | 1.3 | 31.6 | 1.2 | 0.8 |
| | AC164 | 33.2 | 1.2 | 32.4 | 1.0 | 0.8 |
| Deltapine | DP213 | 33.0 | 1.2 | 31.1 | 0.9 | 1.9 |
| | DP263 | 32.0 | 1.0 | 31.3 | 1.2 | 0.7 |
| Georgia | GA428 | 31.0 | 0.7 | 30.5 | 1.7 | 0.5 |
| | GA437 | 32.0 | 1.1 | 31.6 | 1.2 | 0.4 |
| Paymaster | PM304 | 33.3 | 1.0 | 31.4 | 0.7 | 1.9 |
| | PM321 | 33.4 | 1.0 | 31.7 | 1.2 | 1.7 |
| | | | | | Average: | 1.1 |
Table 7.
Advanced Fiber Information System (AFIS) fiber property means of NIILS differing for qFL-Chr.25 within four regionally adapted backgrounds compared to the recurrent and QTL donor parents across eight environments.
Table 7.
Advanced Fiber Information System (AFIS) fiber property means of NIILS differing for qFL-Chr.25 within four regionally adapted backgrounds compared to the recurrent and QTL donor parents across eight environments.
| Background | Genotype | L(w) † | L(n) | UQL(w) | L5% | SFC(w) | SFC(n) | Fine | IFC | MatRatio | StdFine |
|---|
| | | mm | mm | mm | mm | % | % | m/Tex | % | | Hs |
| Acala | ACSJ4 | 27.3 e ‡ | 23.9 cd | 32.0 e | 36.6 e | 4.3 d | 13.0 d | 163.5 a | 4.9 d | 0.93 a | 176.1 a |
| | AC107Neg | 28.0 d | 23.8 d | 33.7 d | 38.4 d | 5.6 b | 16.6 b | 157.6 bc | 5.2 c | 0.93 a | 169.9 c |
| | AC107Pos | 28.4 c | 23.8 d | 34.6 c | 39.5 c | 6.1 a | 18.0 a | 154.2 de | 5.8 a | 0.90 c | 171.3 bc |
| | AC164Neg | 29.2 ab | 24.9 a | 34.9 bc | 39.6 c | 4.8 c | 14.9 c | 159.5 b | 5.2 c | 0.93 a | 171.9 b |
| | AC164Pos | 29.3 a | 24.5 b | 35.8 a | 40.8 a | 5.8 ab | 17.7 a | 155.7 cd | 5.5 b | 0.92 b | 169.7 cd |
| | SL883 | 28.9 b | 24.1 bc | 35.2 b | 40.2 b | 5.9 ab | 17.9 a | 153.3 e | 5.6 b | 0.91 b | 168.2 d |
| Deltapine | DP50 | 26.8 d | 23.1 c | 31.7 d | 35.8 d | 5.6 b | 16.3 d | 177.6 a | 5.3 d | 0.91 ab | 194.8 a |
| | DP213Neg | 27.6 c | 23.3 bc | 33.3 c | 37.7 c | 6.2 a | 18.1 a | 162.2 b | 5.6 b | 0.91 b | 178.7 b |
| | DP213Pos | 28.8 a | 24.2 a | 34.9 a | 39.8 a | 5.8 ab | 17.6 abc | 155.8 c | 5.4 cd | 0.92 a | 170.3 d |
| | DP263Neg | 27.6 c | 23.5 b | 33.2 c | 37.9 c | 5.9 ab | 17.0 bcd | 152.3 d | 5.9 a | 0.90 c | 169.4 de |
| | DP263Pos | 28.4 b | 24.1 a | 34.2 b | 39.0 b | 5.5 b | 16.7 cd | 157.3 c | 5.9 a | 0.90 c | 175.0 c |
| | SL883 | 28.9 a | 24.1 a | 35.2 a | 40.2 a | 5.9 ab | 17.9 ab | 153.3 d | 5.6 bc | 0.91 ab | 168.2 e |
| Georgia | GA089 | 27.7 c | 23.9 b | 32.8 cd | 37.2 d | 5.0 c | 15.2 c | 170.1 a | 5.1 c | 0.92 a | 184.6 a |
| | GA428Neg | 27.7 c | 24.1 ab | 32.5 d | 37.0 d | 4.5 d | 13.5 e | 160.6 b | 6.0 a | 0.89 c | 179.7 b |
| | GA428Pos | 27.9 c | 24.1 ab | 33.1 c | 37.7 c | 4.7 cd | 14.5 d | 156.2 c | 5.9 a | 0.90 c | 174.2 c |
| | GA437Neg | 28.3 b | 24.4 a | 33.8 b | 38.4 b | 4.9 c | 15.0 cd | 162.5 b | 5.6 b | 0.91 b | 178.6 b |
| | GA437Pos | 28.3 b | 24.0 ab | 34.1 b | 38.8 b | 5.5 b | 16.5 b | 157.8 c | 5.5 b | 0.91 b | 173.3 c |
| | SL883 | 28.9 a | 24.1 ab | 35.2 a | 40.2 a | 5.9 a | 17.9 a | 153.3 d | 5.6 b | 0.91 b | 168.2 d |
| Paymaster | PMHS26 | 27.4 c | 24.1 a | 31.9 c | 36.2 c | 4.2 d | 12.9 d | 177.6 a | 4.5 d | 0.95 a | 187.4 a |
| | PM304Neg | 28.1 b | 24.3 a | 33.4 b | 38.1 b | 4.7 c | 14.4 c | 161.0 b | 5.0 c | 0.93 b | 172.9 b |
| | PM304Pos | 29.0 a | 24.2 a | 35.2 a | 40.3 a | 5.7 a | 17.8 a | 156.8 c | 5.0 c | 0.93 b | 169.0 c |
| | PM321Neg | 28.2 b | 24.1 a | 33.6 b | 38.4 b | 5.0 b | 15.4 b | 157.4 c | 5.3 b | 0.92 c | 171.5 b |
| | PM321Pos | 29.0 a | 24.2 a | 35.4 a | 40.5 a | 5.8 a | 17.9 a | 152.1 d | 5.2 b | 0.92 c | 165.6 d |
| | SL883 | 28.9 a | 24.1 a | 35.2 a | 40.2 a | 5.9 a | 17.9 a | 153.3 d | 5.6 a | 0.91 c | 168.2 c |
| CV (%) | | 2.4 | 3.0 | 2.5 | 2.5 | 13.5 | 10.8 | 3.0 | 9.0 | 1.6 | 2.0 |


 ,
, 


