

Invasive Alien Species as a Potential Source of Phytopharmaceuticals: Phenolic Composition and Antimicrobial and Cytotoxic Activity of Robinia pseudoacacia L. Leaf and Flower Extracts


 ,
,  ,
,  , , , ,
  and
and 
Abstract

1. Introduction
2. Results and Discussion
2.1. Spectrophotometric Analysis of the Phenolic Content and Antioxidant Capacity
2.2. Phenolic Compounds
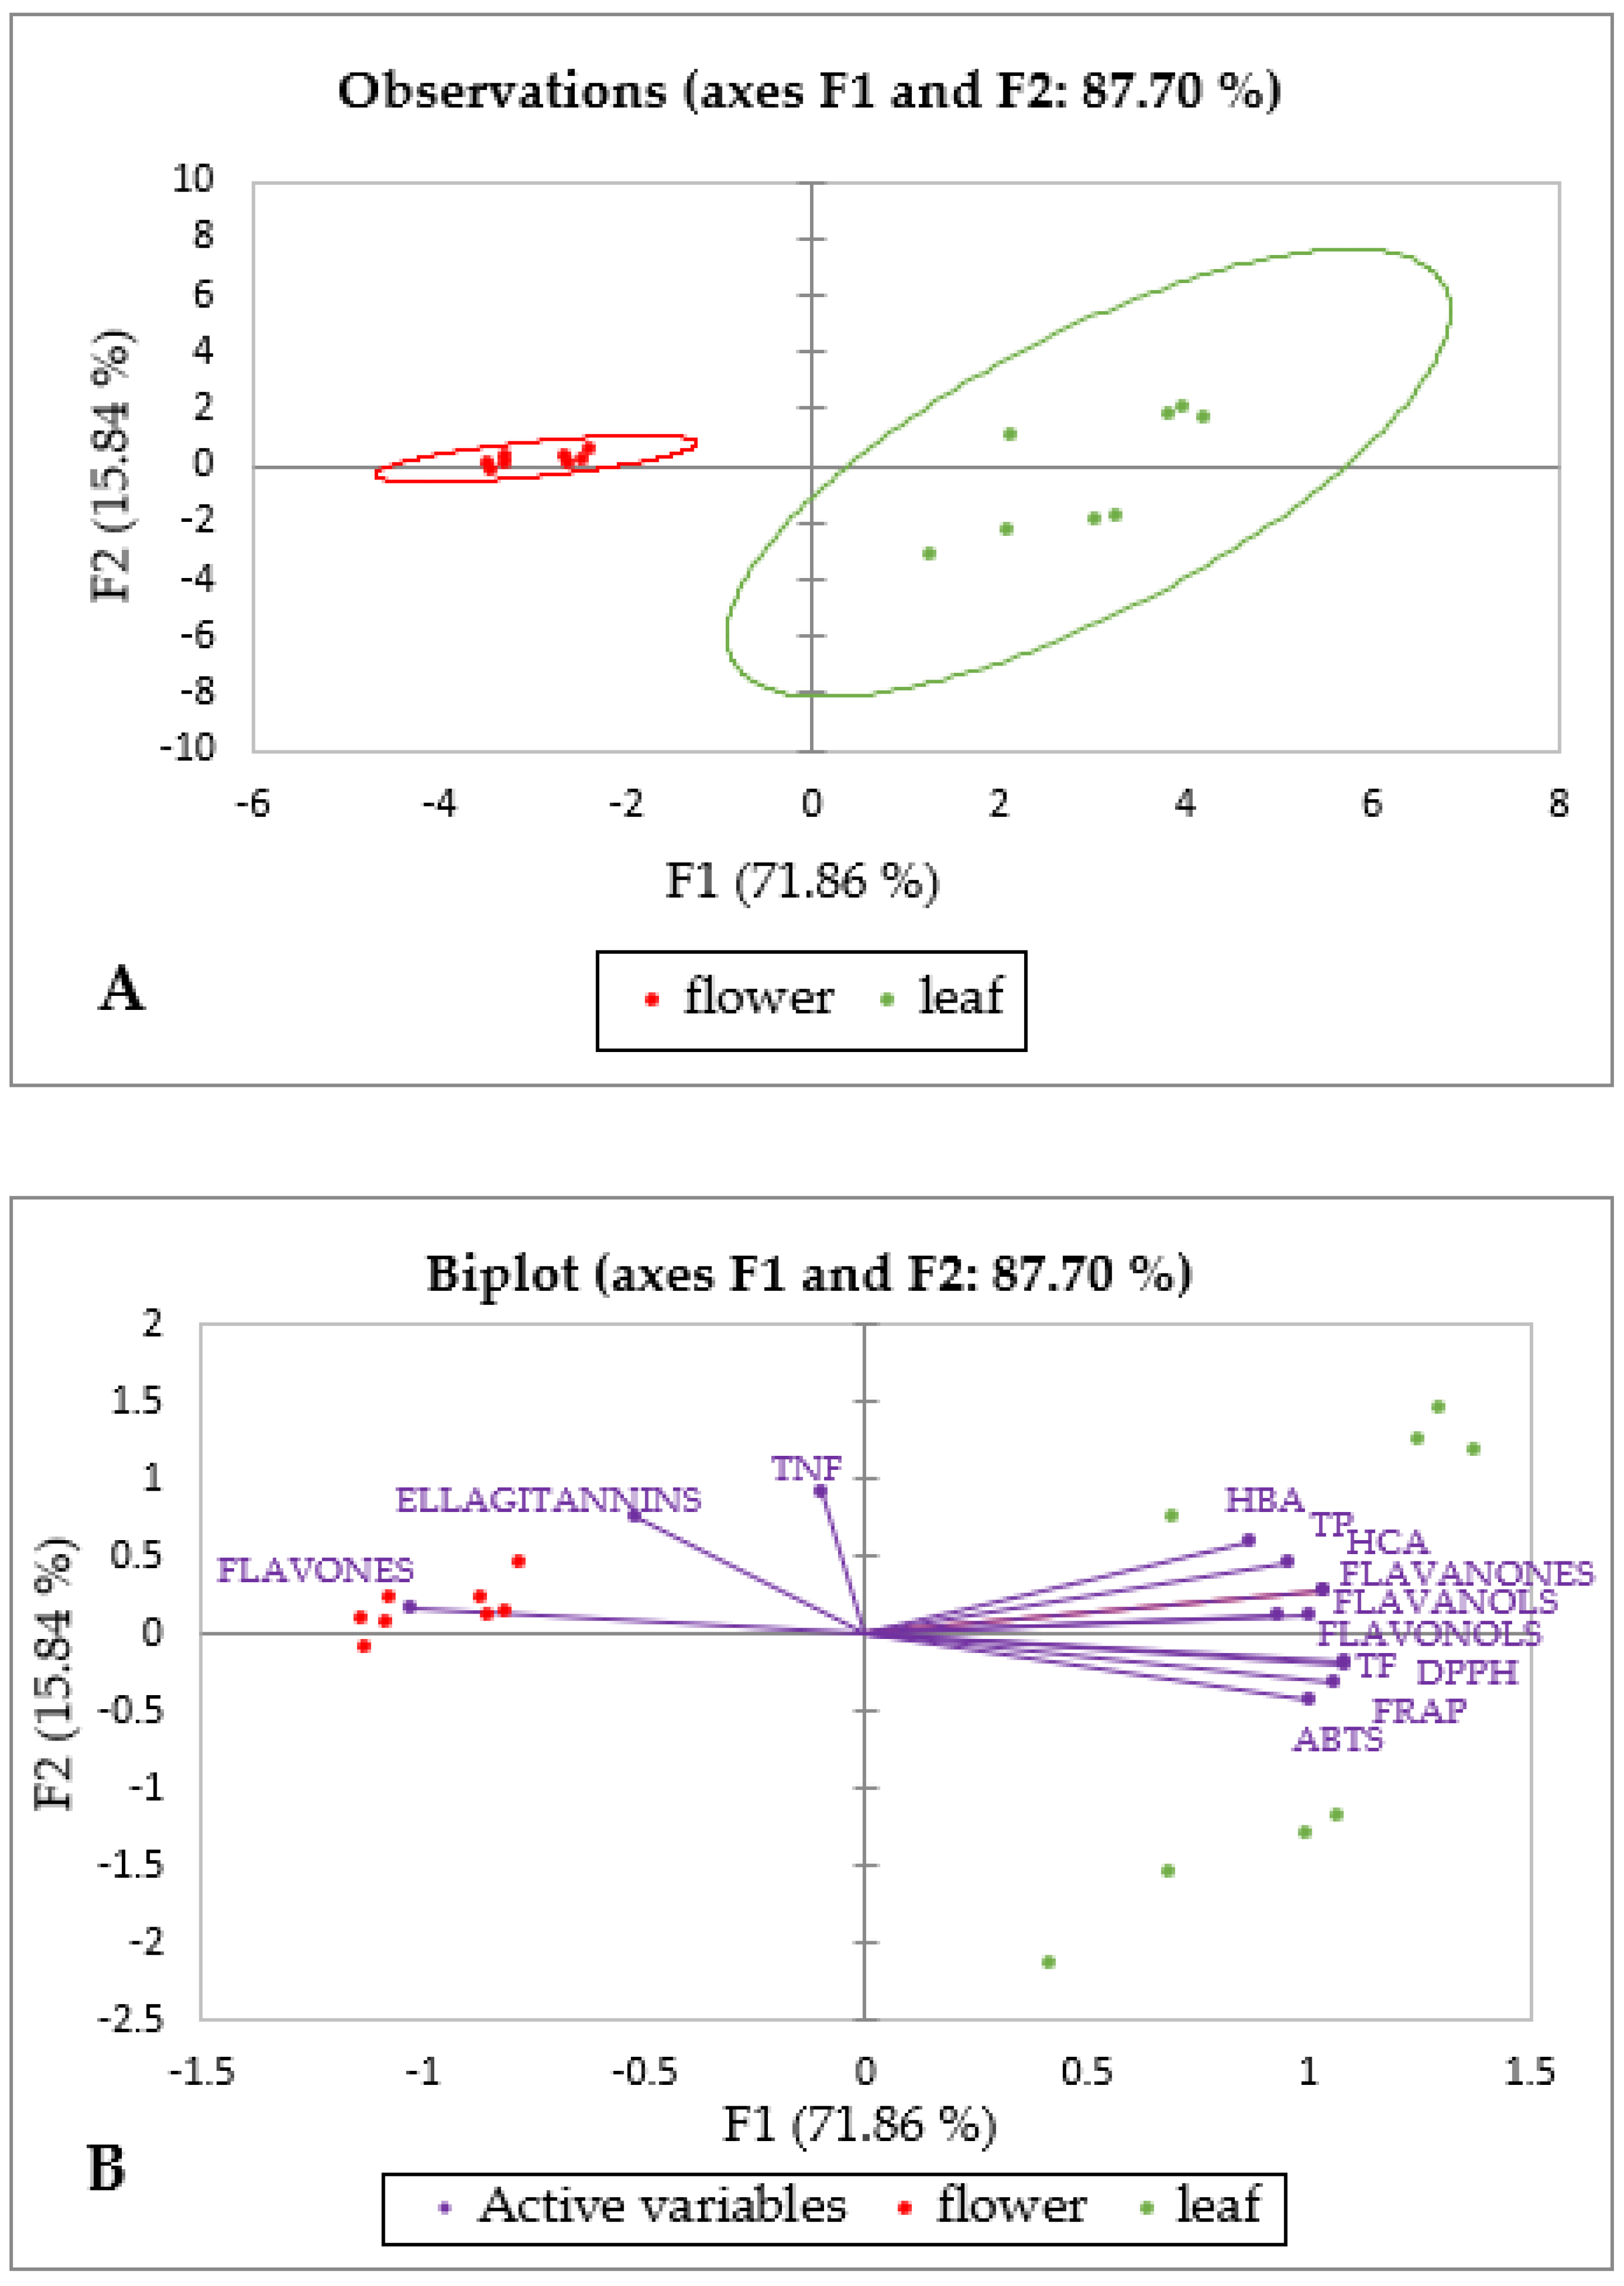
2.3. Principal Component Analysis of Specialized Metabolites and Antioxidant Capacity
2.4. Antimicrobial and Cytotoxic Activity
2.4.1. Antibacterial and Antifungal Activity and Cytotoxicity
2.4.2. Anti-Biofilm and Anti-Quorum Activities
3. Materials and Methods
3.1. Chemicals
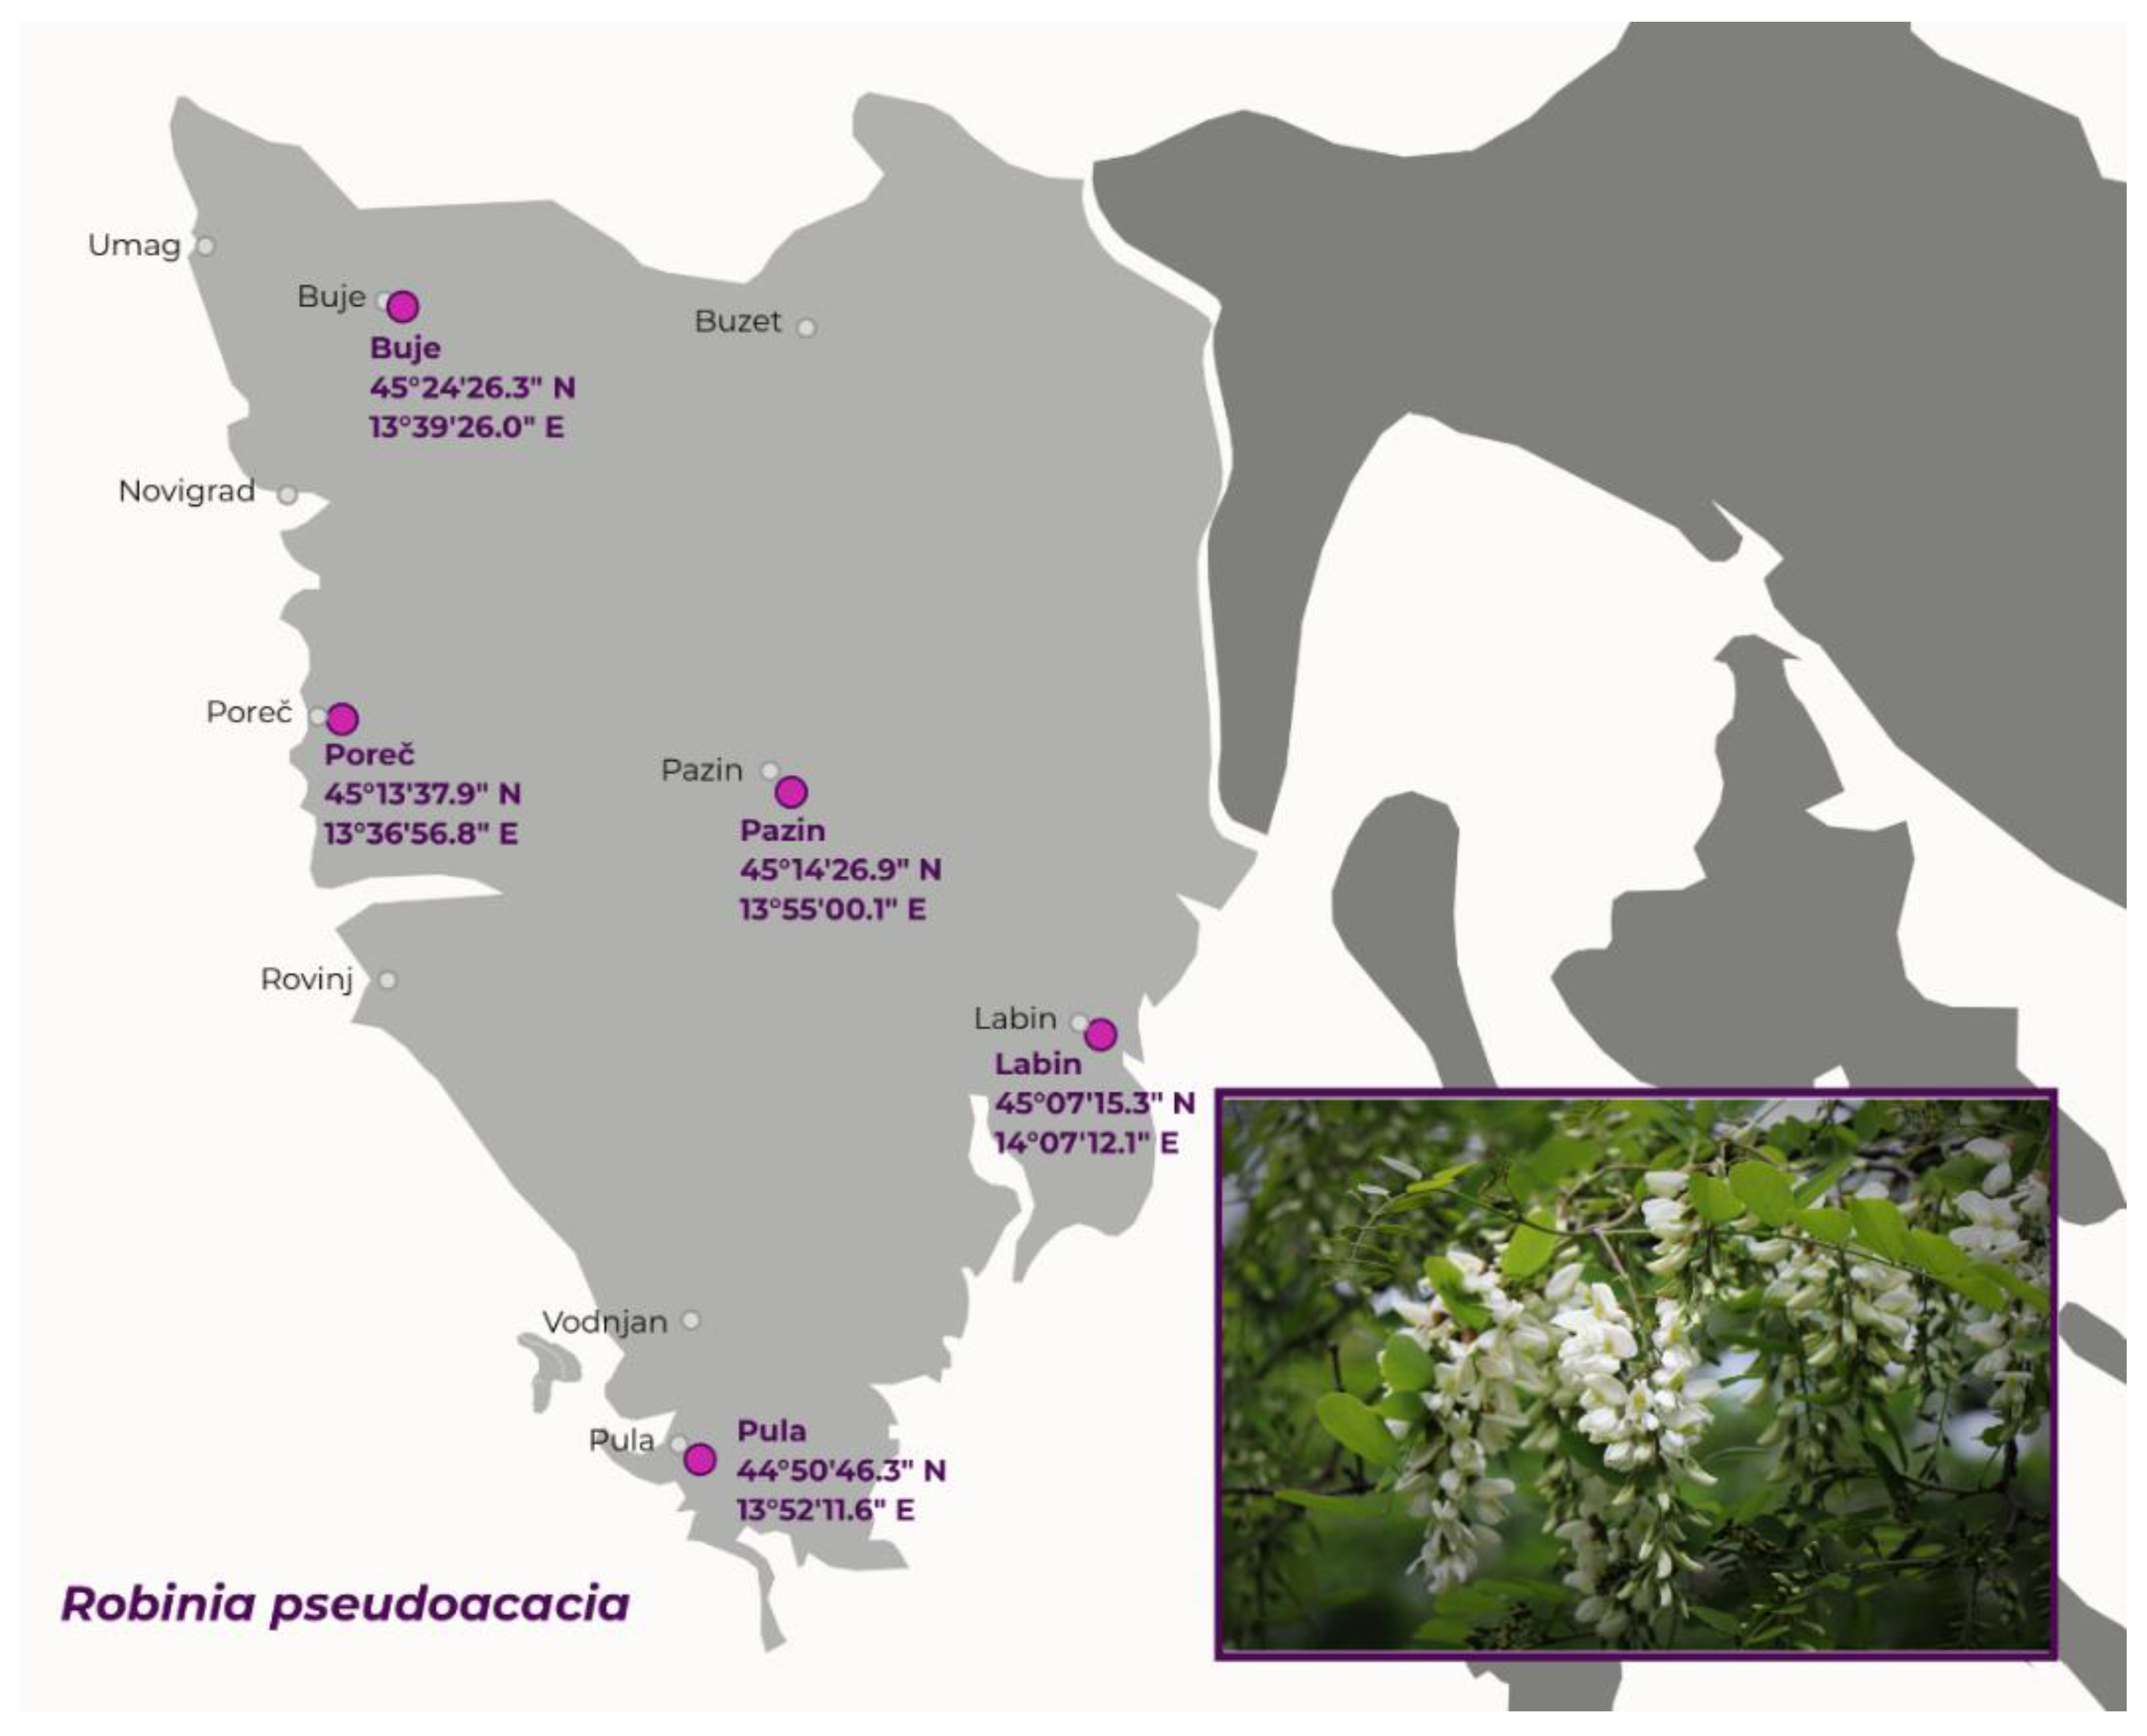
3.2. Plant Material
3.3. Extraction Procedure
3.4. Total Phenolics, Flavonoids, and Non-Flavonoids Content and Antioxidant Capacity
3.5. HPLC-DAD-MS Analysis and Identification of Phenolic Compounds
3.6. Antibacterial and Antifungal Activity
3.7. Anti-Biofilm and Anti-Quorum Sensing Activity
3.8. Cytotoxic Assessment
3.9. Statistical Analysis
4. Conclusions
Supplementary Materials
Author Contributions
Funding
Data Availability Statement
Acknowledgments
Conflicts of Interest
References
- Macel, M.; Vos, R.C.H.; Jansen, J.J.; Putten, W.H.; Dam, N.M. Novel Chemistry of Invasive Plants: Exotic Species Have More Unique Metabolomic Profiles than Native Congeners. Ecol. Evol. 2014, 4, 2777–2786. [Google Scholar] [CrossRef]
- Poljuha, D.; Sladonja, B.; Šola, I.; Dudaš, S.; Bilić, J.; Rusak, G.; Motlhatlego, K.E.; Eloff, J.N. Phenolic Composition of Leaf extracts of Ailanthus altissima (Simaroubaceae) with Antibacterial and Antifungal Activity Equivalent to Standard Antibiotics. Nat. Prod. Commun. 2017, 12, 1609–1612. [Google Scholar] [CrossRef]
- Poljuha, D.; Sladonja, B.; Šola, I.; Šenica, M.; Uzelac, M.; Veberič, R.; Hudina, M.; Famuyide, I.M.; Eloff, J.N.; Mikulic-Petkovsek, M. LC–DAD–MS Phenolic Characterisation of Six Invasive Plant Species in Croatia and Determination of Their Antimicrobial and Cytotoxic Activity. Plants 2022, 11, 596. [Google Scholar] [CrossRef] [PubMed]
- Pietta, P.; Minoggio, M.; Bramati, L. Plant Polyphenols: Structure, Occurrence and Bioactivity. Stud. Nat. Prod. Chem. 2003, 28, 257–312. [Google Scholar] [CrossRef]
- Kim, Y.O.; Lee, E.J. Comparison of Phenolic Compounds and the Effects of Invasive and Native Species in East Asia: Support for the Novel Weapons Hypothesis. Ecol. Res. 2011, 26, 87–94. [Google Scholar] [CrossRef]
- Wein, K. Die Erste Einführung Nordamerikanischer Gehölze in Europa. Mitt. Dtsch. Dendrol. Ges. 1930, 42, 137–163. [Google Scholar]
- Vítková, M.; Müllerová, J.; Sádlo, J.; Pergl, J.; Pyšek, P. Black Locust (Robinia pseudoacacia) Beloved and Despised: A Story of an Invasive Tree in Central Europe. For. Ecol. Manag. 2017, 384, 287–302. [Google Scholar] [CrossRef]
- Mantovani, D.; Veste, M.; Freese, D. Black Locust (Robinia pseudoacacia L.) Ecophysiological and Morphological Adaptations to Drought and Their Consequence on Biomass Production and Water-Use Efficiency. N. Z. J. For. Sci. 2014, 44, 29. [Google Scholar] [CrossRef]
- Sitzia, T.; Cierjacks, A.; de Rigo, D.; Caudullo, G. Robinia pseudoacacia in Europe: Distribution, Habitat, Usage and Threats. In European Atlas of Forest Tree; Publication Office of the European Union: Luxembourg, 2016. [Google Scholar]
- GBIF Secretariat: GBIF Backbone Taxonomy. Available online: https://www.gbif.org/dataset/d7dddbf4-2cf0-4f39-9b2a-bb099caae36c (accessed on 16 February 2023).
- Global Invasive Species Database Species Profile: Robinia pseudoacacia. 2023. Available online: http://www.Iucngisd.Org/Gisd/Speciesname/Robinia+pseudoacacia (accessed on 16 February 2023).
- Kutnar, L.; Kobler, A. Sedanje Stanje Razširjenosti Robinije (Robinia pseudoacacia L.) v Sloveniji in Napovedi Za Prihodnost. Acta Silvae Ligni 2013, 102, 21–30. [Google Scholar] [CrossRef]
- Vítková, M.; Kolbek, J. Vegetation Classification and Synecology of Bohemian Robinia pseudacacia Stands in a Central European Context. Phytocoenologia 2010, 40, 205–241. [Google Scholar] [CrossRef]
- Nasir, H.; Iqbal, Z.; Hiradate, S.; Fujii, Y. Allelopathic Potential of Robinia pseudo-acacia L. J. Chem. Ecol. 2005, 31, 2179–2192. [Google Scholar] [CrossRef]
- Khanduri, V.; Bali, R.; Rawat, P.; Rawat, M. Allelopathic Effect of Robinia pseudoacacia on Germination and Growth of Some Important Food Crops of the Garhwal Himalayas. J. Pharmacogn. Phytochem. 2019, 8, 206–210. [Google Scholar]
- Macías, F.A.; Molinillo, J.M.; Varela, R.M.; Galindo, J.C. Allelopathy—A Natural Alternative for Weed Control. Pest. Manag. Sci. 2007, 63, 327–348. [Google Scholar] [CrossRef] [PubMed]
- Kalisz, S.; Kivlin, S.N.; Bialic-Murphy, L. Allelopathy Is Pervasive in Invasive Plants. Biol. Invasions 2021, 23, 367–371. [Google Scholar] [CrossRef]
- Lorenzo, P.; Hussain, M.I.; González, L. Role of Allelopathy During Invasion Process by Alien Invasive Plants in Terrestrial Ecosystems. In Allelopathy; Cheema, Z.A., Farooq, M., Wahid, A., Eds.; Springer: Berlin/Heidelberg, Germany, 2013; pp. 3–21. ISBN 978-3-642-30594-8. [Google Scholar]
- McCoy, R.M.; Widhalm, J.R.; McNickle, G.G. Allelopathy as an Evolutionary Game. Plant Direct 2022, 6, e382. [Google Scholar] [CrossRef]
- Bektić, S.; Huseinović, S.; Husanović, J.; Memić, S. Allelopathic Effects of Extract Robinia pseudoacacia L. and Chenopodium album L. on Germination of Tomato (Solanum lycopersicum L.). CJAST 2021, 40, 11–18. [Google Scholar] [CrossRef]
- Botta-Dukat, Z.; Balogh, L.; Feher, A. The Most Important Invasive Plants in Hungary; Institute of Ecology and Botany; Hungarian Academy of Sciences: Budapest, Hungary, 2008. [Google Scholar]
- Hu, S.; Jiao, J.; Kou, M.; Wang, N.; García-Fayos, P.; Liu, S. Quantifying the Effects of Robinia pseudoacacia Afforestation on Plant Community Structure from a Functional Perspective: New Prospects for Management Practices on the Hilly and Gullied Loess Plateau, China. Sci. Total Environ. 2021, 773, 144878. [Google Scholar] [CrossRef]
- Marinas, I.; Oprea, E.; Geana, E.-I.; Chifiriuc, C.; Lazar, V. Antimicrobial and Antioxidant Activity of the Vegetative and Reproductive Organs of Robinia pseudoacacia. J. Serb. Chem. Soc. 2014, 79, 1363–1378. [Google Scholar] [CrossRef]
- Călina, D.; Olah, N.K.; Pătru, E.; Docea, A.; Popescu, H.; Bubulica, M.V. Chromatographic Analysis of the Flavonoids from Robinia pseudoacacia Species. Curr. Health Sci. J. 2013, 39, 232–236. [Google Scholar]
- Savic Gajic, I.; Savic, I.; Boskov, I.; Žerajić, S.; Markovic, I.; Gajic, D. Optimization of Ultrasound-Assisted Extraction of Phenolic Compounds from Black Locust (Robiniae pseudoacaciae) Flowers and Comparison with Conventional Methods. Antioxidants 2019, 8, 248. [Google Scholar] [CrossRef]
- Kanlaya, R.; Thongboonkerd, V. Protective Effects of Epigallocatechin-3-Gallate from Green Tea in Various Kidney Diseases. Adv. Nutr. 2019, 10, 112–121. [Google Scholar] [CrossRef] [PubMed]
- Zduńska, K.; Dana, A.; Kolodziejczak, A.; Rotsztejn, H. Antioxidant Properties of Ferulic Acid and Its Possible Application. Ski. Pharmacol. Physiol. 2018, 31, 332–336. [Google Scholar] [CrossRef] [PubMed]
- Wang, Q.; Wei, H.; Zhou, S.; Li, Y.; Zheng, T.; Zhou, C.; Wan, X. Hyperoside: A Review on Its Sources, Biological Activities, and Molecular Mechanisms. Phytother. Res. 2022, 36, 2779–2802. [Google Scholar] [CrossRef]
- Habtemariam, S. Rutin as a Natural Therapy for Alzheimer’s Disease: Insights into Its Mechanisms of Action. CMC 2016, 23, 860–873. [Google Scholar] [CrossRef] [PubMed]
- Imran, M.; Rauf, A.; Abu-Izneid, T.; Nadeem, M.; Shariati, M.A.; Khan, I.A.; Imran, A.; Orhan, I.E.; Rizwan, M.; Atif, M.; et al. Luteolin, a Flavonoid, as an Anticancer Agent: A Review. Biomed. Pharmacother. 2019, 112, 108612. [Google Scholar] [CrossRef]
- Al Zahrani, N.A.; El-Shishtawy, R.M.; Asiri, A.M. Recent Developments of Gallic Acid Derivatives and Their Hybrids in Medicinal Chemistry: A Review. Eur. J. Med. Chem. 2020, 204, 112609. [Google Scholar] [CrossRef]
- Han, M.G.; Park, Y.J.; In, M.-J.; Kim, D.C. Biological Activities of Ethanolic Extract from Robinia pseudoacacia L. Flower. JABC 2022, 65, 107–111. [Google Scholar] [CrossRef]
- Zhang, Y.; Yang, S.; Zhao, X.; Yang, Y.; Li, B.; Zhu, F.; Zhu, R. Immune Enhancement of Taishan Robinia pseudoacacia Polysaccharide on Recombinant Proteus Mirabilis OmpA in Chickens. Int. Immunopharmacol. 2014, 22, 236–241. [Google Scholar] [CrossRef]
- Jamal, M.; Ahmad, W.; Andleeb, S.; Jalil, F.; Imran, M.; Nawaz, M.A.; Hussain, T.; Ali, M.; Rafiq, M.; Kamil, M.A. Bacterial Biofilm and Associated Infections. J. Chin. Med. Assoc. 2018, 81, 7–11. [Google Scholar] [CrossRef]
- Mokhetho, K.; Sandasi, M.; Ahmad, A.; Gp, K.; Viljoen, A. Gas chromatography-based metabolomics in the identification of potential anti-quorum sensing compounds in commercial essential oils. Planta Med. 2019, 85, P-098. [Google Scholar]
- Adeyemo, R.O.; Famuyide, I.M.; Dzoyem, J.P.; Lyndy Joy, M. Anti-Biofilm, Antibacterial, and Anti-Quorum Sensing Activities of Selected South African Plants Traditionally Used to Treat Diarrhoea. Evid. Based Complement. Alternat. Med. 2022, 2022, 1307801. [Google Scholar] [CrossRef] [PubMed]
- Bouyahya, A.; El Omari, N.; Hakkour, M.; El Menyiy, N.; Benali, T.; Kulikov, D.; Karpukhin, M.; Shariati, M.A.; Venkidasamy, B.; Thiruvengadam, M.; et al. A Review on Transcriptomic and Metabolomic Responses of Plants to Nanopollution. Environ. Sci. Pollut. Res. 2022, 29, 22913–22929. [Google Scholar] [CrossRef] [PubMed]
- Peerzada, M.N.; Rizvi, M.A.; Kk, A.K.; Sahu, A.; Verma, S. Nature-Based Computing Bioinformatics Approaches in Drug Discovery against Promising Molecular Targets Carbonic Anhydrases and Serine/Threonine Kinases for Cancer Treatment. In Nature-Inspired Intelligent Computing Techniques in Bioinformatics; Raza, K., Ed.; Studies in Computational Intelligence; Springer Nature: Singapore, 2023; Volume 1066, pp. 309–328. ISBN 978-981-19637-8-0. [Google Scholar]
- Pant, P.; Pandey, S.; Dall’Acqua, S. The Influence of Environmental Conditions on Secondary Metabolites in Medicinal Plants: A Literature Review. Chem. Biodivers. 2021, 18, e2100345. [Google Scholar] [CrossRef]
- Kato-Noguchi, H.; Kato, M. Evolution of the Secondary Metabolites in Invasive Plant Species Chromolaena odorata for the Defense and Allelopathic Functions. Plants 2023, 12, 521. [Google Scholar] [CrossRef] [PubMed]
- Kenjeric, D.; Mandic, M.; Primorac, L.; Bubalo, D.; Perl, A. Flavonoid Profile of Robinia Honeys Produced in Croatia. Food Chem. 2007, 102, 683–690. [Google Scholar] [CrossRef]
- Jerković, I.; Mastelić, J.; Marijanović, Z.; Klein, Ž.; Jelić, M. Comparison of Hydrodistillation and Ultrasonic Solvent Extraction for the Isolation of Volatile Compounds from Two Unifloral Honeys of Robinia pseudoacacia L. and Castanea sativa L. Ultrason. Sonochem. 2007, 14, 750–756. [Google Scholar] [CrossRef]
- Uršulin-Trstenjak, N.; Levanić, D.; Primorac, L.; Bošnir, J.; Vahčić, N.; Šarić, G. Mineral Profile of Croatian Honey and Differences Due to Its Geographical Origin. Czech J. Food Sci. 2015, 33, 156–164. [Google Scholar] [CrossRef]
- Olszewska, M.A.; Michel, P. Antioxidant Activity of Inflorescences, Leaves and Fruits of Three Sorbus Species in Relation to Their Polyphenolic Composition. Nat. Prod. Res. 2009, 23, 1507–1521. [Google Scholar] [CrossRef]
- Borneo, R.; León, A.E.; Aguirre, A.; Ribotta, P.; Cantero, J.J. Antioxidant Capacity of Medicinal Plants from the Province of Córdoba (Argentina) and Their In Vitro Testing in a Model Food System. Food Chem. 2009, 112, 664–670. [Google Scholar] [CrossRef]
- Hallmann, E. Quantitative and Qualitative Identification of Bioactive Compounds in Edible Flowers of Black and Bristly Locust and Their Antioxidant Activity. Biomolecules 2020, 10, 1603. [Google Scholar] [CrossRef]
- Loizzo, M.R.; Pugliese, A.; Bonesi, M.; Tenuta, M.C.; Menichini, F.; Xiao, J.; Tundis, R. Edible Flowers: A Rich Source of Phytochemicals with Antioxidant and Hypoglycemic Properties. J. Agric. Food Chem. 2016, 64, 2467–2474. [Google Scholar] [CrossRef]
- Kowalczewski, P.Ł.; Pauter, P.; Smarzyński, K.; Różańska, M.B.; Jeżowski, P.; Dwiecki, K.; Mildner-Szkudlarz, S. Thermal Processing of Pasta Enriched with Black Locust Flowers Affect Quality, Phenolics, and Antioxidant Activity. J. Food Process. Preserv. 2019, 43, e14106. [Google Scholar] [CrossRef]
- Kuś, P.M.; Congiu, F.; Teper, D.; Sroka, Z.; Jerković, I.; Tuberoso, C.I.G. Antioxidant Activity, Color Characteristics, Total Phenol Content and General HPLC Fingerprints of Six Polish Unifloral Honey Types. LWT 2014, 55, 124–130. [Google Scholar] [CrossRef]
- Calderon-Montano, J.M.; Burgos-Moron, E.; Perez-Guerrero, C.; Lopez-Lazaro, M. A Review on the Dietary Flavonoid Kaempferol. Mini Rev. Med. Chem. 2011, 11, 298–344. [Google Scholar] [CrossRef]
- Anand, J.; Upadhyaya, B.; Rawat, P.; Rai, N. Biochemical Characterization and Pharmacognostic Evaluation of Purified Catechins in Green Tea (Camellia sinensis) Cultivars of India. 3 Biotech 2015, 5, 285–294. [Google Scholar] [CrossRef]
- Ji, H.F.; Du, A.L.; Zhang, L.W.; Xu, C.Y.; Yang, M.D.; Li, F.F. Effects of Drying Methods on Antioxidant Properties in Robinia pseudoacacia L. Flowers. J. Med. Plants Res. 2012, 6, 3233–3239. [Google Scholar] [CrossRef]
- Agati, G.; Azzarello, E.; Pollastri, S.; Tattini, M. Flavonoids as Antioxidants in Plants: Location and Functional Significance. Plant Sci. 2012, 196, 67–76. [Google Scholar] [CrossRef] [PubMed]
- Vek, V.; Poljanšek, I.; Oven, P. Efficiency of Three Conventional Methods for Extraction of Dihydrorobinetin and Robinetin from Wood of Black Locust. Eur. J. Wood Prod. 2019, 77, 891–901. [Google Scholar] [CrossRef]
- Magel, E.; Jay-Allemand, C.; Ziegler, H. Formation of Heartwood Substances in the Stemwood of Robinia pseudoacacia L. II. Distribution of Nonstructural Carbohydrates and Wood Extractives across the Trunk. Trees 1994, 8, 165–171. [Google Scholar] [CrossRef]
- Sergent, T.; Kohnen, S.; Jourez, B.; Beauve, C.; Schneider, Y.-J.; Vincke, C. Characterization of Black Locust (Robinia pseudoacacia L.) Heartwood Extractives: Identification of Resveratrol and Piceatannol. Wood Sci. Technol. 2014, 48, 1005–1017. [Google Scholar] [CrossRef]
- Kropf, U.; Korošec, M.; Bertoncelj, J.; Ogrinc, N.; Nečemer, M.; Kump, P.; Golob, T. Determination of the Geographical Origin of Slovenian Black Locust, Lime and Chestnut Honey. Food Chem. 2010, 121, 839–846. [Google Scholar] [CrossRef]
- Scripcă, L.A.; Amariei, S. The Influence of Chemical Contaminants on the Physicochemical Properties of Unifloral and Multifloral Honey. Foods 2021, 10, 1039. [Google Scholar] [CrossRef] [PubMed]
- Vranic, D.; Petronijevic, R.; Koricanac, V.; Djinovic Stojanovic, J.; Lilic, S.; Borovic, B.; Lukic, M. Evaluation of Serbian Black Locust Honey Quality Parameters as a Contribution to Confirmation of Its Botanical Origin. IOP Conf. Ser. Earth Environ. Sci. 2019, 333, 012113. [Google Scholar] [CrossRef]
- Kędzierska-Matysek, M.; Stryjecka, M.; Teter, A.; Skałecki, P.; Domaradzki, P.; Florek, M. Relationships Between the Content of Phenolic Compounds and the Antioxidant Activity of Polish Honey Varieties as a Tool for Botanical Discrimination. Molecules 2021, 26, 1810. [Google Scholar] [CrossRef] [PubMed]
- Veitch, N.C.; Elliott, P.C.; Kite, G.C.; Lewis, G.P. Flavonoid Glycosides of the Black Locust Tree, Robinia pseudoacacia (Leguminosae). Phytochemistry 2010, 71, 479–486. [Google Scholar] [CrossRef]
- Tyśkiewicz, K.; Konkol, M.; Kowalski, R.; Rój, E.; Warmiński, K.; Krzyżaniak, M.; Gil, Ł.; Stolarski, M.J. Characterization of Bioactive Compounds in the Biomass of Black Locust, Poplar and Willow. Trees 2019, 33, 1235–1263. [Google Scholar] [CrossRef]
- Gmižić, D.; Pinterić, M.; Lazarus, M.; Šola, I. High Growing Temperature Changes Nutritional Value of Broccoli (Brassica oleracea L. convar.) Alef. var. cymosa Duch.) Seedlings. Foods 2023, 12, 582. [Google Scholar] [CrossRef]
- Šola, I.; Stipaničev, M.; Vujčić, V.; Mitić, B.; Huđek, A.; Rusak, G. Comparative Analysis of Native Crocus Taxa as a Great Source of Flavonoids with High Antioxidant Activity. Plant Foods Hum. Nutr. 2018, 73, 189–195. [Google Scholar] [CrossRef]
- Freeman, B.L.; Eggett, D.L.; Parker, T.L. Synergistic and Antagonistic Interactions of Phenolic Compounds Found in Navel Oranges. J. Food Sci. 2010, 75, C570–C576. [Google Scholar] [CrossRef]
- Widyawati, P.S.; Budianta, T.D.W.; Kusuma, F.A.; Wijaya, L. Difference of Solvent Polarity to Phytochemical Content and Antioxidant Activity of Pluchea indicia Less Leaves Extracts. Int. J. Pharmacogn. Phytochem. Res. 2015, 6, 850–855. [Google Scholar]
- Metivier, R.P.; Francis, F.J.; Clydesdale, F.M. Solvent extraction of anthocyanins from wine pomace. J. Food Sci. 1980, 45, 1099–1100. [Google Scholar] [CrossRef]
- Labarbe, B.; Cheynier, V.; Brossaud, F.; Souquet, J.-M.; Moutounet, M. Quantitative Fractionation of Grape Proanthocyanidins According to Their Degree of Polymerization. J. Agric. Food Chem. 1999, 47, 2719–2723. [Google Scholar] [CrossRef] [PubMed]
- Prior, R.L.; Lazarus, S.A.; Cao, G.; Muccitelli, H.; Hammerstone, J.F. Identification of Procyanidins and Anthocyanins in Blueberries and Cranberries (Vaccinium spp.) Using High-Performance Liquid Chromatography/Mass Spectrometry. J. Agric. Food Chem. 2001, 49, 1270–1276. [Google Scholar] [CrossRef] [PubMed]
- Guyot, S.; Marnet, N.; Drilleau, J.-F. Thiolysis−HPLC Characterization of Apple Procyanidins Covering a Large Range of Polymerization States. J. Agric. Food Chem. 2001, 49, 14–20. [Google Scholar] [CrossRef]
- Poljuha, D.; Šola, I.; Bilić, J.; Dudaš, S.; Bilušić, T.; Markić, J.; Rusak, G. Phenolic Composition, Antioxidant Capacity, Energy Content and Gastrointestinal Stability of Croatian Wild Edible Plants. Eur. Food Res. Technol. 2015, 241, 573–585. [Google Scholar] [CrossRef]
- Noviany, N.; Hadi, S.; Nofiani, R.; Lotulung, P.D.; Osman, H. Fabaceae: A Significant Flavonoid Source for Plant and Human Health. Phys. Sci. Rev. 2022. [Google Scholar] [CrossRef]
- Samanta, A.; Das, G.; Das, S.K. Roles of flavonoids in plants. Int. J. Pharm. Sci. Tech. 2011, 6, 12–35. [Google Scholar]
- Fernández-Aparicio, M.; Masi, M.; Cimmino, A.; Vilariño, S.; Evidente, A. Allelopathic Effect of Quercetin, a Flavonoid from Fagopyrum esculentum Roots in the Radicle Growth of Phelipanche Ramosa: Quercetin Natural and Semisynthetic Analogues Were Used for a Structure-Activity Relationship Investigation. Plants 2021, 10, 543. [Google Scholar] [CrossRef]
- Li, S.; Hao, M.; Wu, T.; Wang, Z.; Wang, X.; Zhang, J.; Zhang, L. Kaempferol Alleviates Human Endothelial Cell Injury through CircNOL12/MiR-6873-3p/FRS2 Axis. Biomed. Pharmacother. 2021, 137, 111419. [Google Scholar] [CrossRef]
- Mikulic-Petkovsek, M.; Veberic, R.; Hudina, M.; Misic, E. HPLC-DAD-MS Identification and Quantification of Phenolic Components in Japanese Knotweed and American Pokeweed Extracts and Their Phytotoxic Effect on Seed Germination. Plants 2022, 11, 3053. [Google Scholar] [CrossRef]
- Martin-Tanguy, J.; Cabanne, F.; Perdrizet, E.; Martin, C. The Distribution of Hydroxycinnamic Acid Amides in Flowering Plants. Phytochemistry 1978, 17, 1927–1928. [Google Scholar] [CrossRef]
- Isemura, M. Catechin in Human Health and Disease. Molecules 2019, 24, 528. [Google Scholar] [CrossRef]
- De Araújo, F.F.; de Paulo Farias, D.; Neri-Numa, I.A.; Pastore, G.M. Polyphenols and Their Applications: An Approach in Food Chemistry and Innovation Potential. Food Chem. 2021, 338, 127535. [Google Scholar] [CrossRef]
- Mbaveng, A.T.; Zhao, Q.; Kuete, V. Harmful and Protective Effects of Phenolic Compounds from African Medicinal Plants. In Toxicological Survey of African Medicinal Plants; Elsevier: Amsterdam, The Netherlands, 2014; pp. 577–609. ISBN 978-0-12-800018-2. [Google Scholar]
- Cheng, Z.; Zhang, Z.; Han, Y.; Wang, J.; Wang, Y.; Chen, X.; Shao, Y.; Cheng, Y.; Zhou, W.; Lu, X.; et al. A Review on Anti-Cancer Effect of Green Tea Catechins. J. Func. Foods 2020, 74, 104172. [Google Scholar] [CrossRef]
- Enayati, A.; Salehi, A.; Alilou, M.; Stuppner, H.; Mirzaei, H.; Omraninava, A.; Khori, V.; Yassa, N. Six New Triterpenoids From the Root of Potentilla reptans and Their Cardioprotective Effects In Silico. Nat. Prod. Res. 2022, 6, 2504–2512. [Google Scholar] [CrossRef]
- Hodges, J.; Zeng, M.; Cao, S.; Pokala, A.; Rezaei, S.; Sasaki, G.; Vodovotz, Y.; Bruno, R. Catechin-Rich Green Tea Extract Reduced Intestinal Inflammation and Fasting Glucose in Metabolic Syndrome and Healthy Adults: A Randomized, Controlled, Crossover Trial. Curr. Dev. Nutr. 2022, 6, 981. [Google Scholar] [CrossRef]
- Boskov, I.A.; Savic Gajic, I.M.; Savic, I.M.; Spalovic, B.R.; Strbac, N.D. Black Locust Flowers: Antioxidant Extraction Kinetics, Reducing Capacity, Mineral Composition, and Antioxidant Activity. Chem. Eng. Commun. 2022, 209, 1182–1190. [Google Scholar] [CrossRef]
- Aniya, Y.; Koyama, T.; Miyagi, C.; Miyahira, M.; Inomata, C.; Kinoshita, S.; Ichiba, T. Free Radical Scavenging and Hepatoprotective Actions of the Medicinal Herb, Crassocephalum crepidioides from the Okinawa Islands. Biol. Pharm. Bull. 2005, 28, 19–23. [Google Scholar] [CrossRef]
- Kulevanova, S.; Stefova, M.; Kadifkova Panovska, T.; Stafilov, T. HPLC Identification and Determination of Myricetin, Quercetin, Kaempferol and Total Flavonoids in Herbal Drugs. Maced. Pharm. Bull. 2003, 48, 25–30. [Google Scholar] [CrossRef]
- Janbaz, K.H.; Saeed, S.A.; Gilani, A.H. Protective Effect of Rutin on Paracetamol- and CCl4-Induced Hepatotoxicity in Rodents. Fitoterapia 2002, 73, 557–563. [Google Scholar] [CrossRef]
- Javed, H.; Khan, M.M.; Ahmad, A.; Vaibhav, K.; Ahmad, M.E.; Khan, A.; Ashafaq, M.; Islam, F.; Siddiqui, M.S.; Safhi, M.M.; et al. Rutin Prevents Cognitive Impairments by Ameliorating Oxidative Stress and Neuroinflammation in Rat Model of Sporadic Dementia of Alzheimer Type. Neuroscience 2012, 210, 340–352. [Google Scholar] [CrossRef]
- Ganeshpurkar, A.; Saluja, A.K. The Pharmacological Potential of Rutin. Saudi Pharm. J. 2017, 25, 149–164. [Google Scholar] [CrossRef]
- Wang, S.-D.; Liu, W.; Xue, C.-B.; Luo, W.-C. The Effects of Luteolin on Phenoloxidase and the Growth of Spodoptera exigua (Huebner) Larvae (Lepidoptera: Noctuidae). J. Pestic. Sci. 2010, 35, 483–487. [Google Scholar] [CrossRef]
- Atanasov, A.Z.; Hristakov, I.S.; Koszel, M.; Przywara, A. Monitoring Agrometeorological Factors and Weight of the Bee Hive During Black Locust (Robinia pseudoacacia) Flowering. In Farm Machinery and Processes Management in Sustainable Agriculture; Pascuzzi, S., Santoro, F., Eds.; Lecture Notes in Civil Engineering; Springer International Publishing: Cham, Switzerland, 2023; Volume 289, pp. 239–251. ISBN 978-3-031-13089-2. [Google Scholar]
- Fellah, B.; Bannour, M.; Rocchetti, G.; Lucini, L.; Ferchichi, A. Phenolic Profiling and Antioxidant Capacity in Flowers, Leaves and Peels of Tunisian Cultivars of Punica granatum L. J. Food Sci. Technol. 2018, 55, 3606–3615. [Google Scholar] [CrossRef]
- Saboonchian, F.; Jamei, R.; Sarghein, S.H. Phenolic and Flavonoid Content of Elaeagnus angustifolia L. (Leaf and Flower). Avicenna J. Phytomed. 2014, 4, 231–238. [Google Scholar] [PubMed]
- Kuete, V.; Krusche, B.; Youns, M.; Voukeng, I.; Fankam, A.G.; Tankeo, S.; Lacmata, S.; Efferth, T. Cytotoxicity of Some Cameroonian Spices and Selected Medicinal Plant Extracts. J. Ethnopharmacol. 2011, 134, 803–812. [Google Scholar] [CrossRef]
- Eloff, J.N. A Proposal towards a Rational Classification of the Antimicrobial Activity of Acetone Tree Leaf Extracts in a Search for New Antimicrobials. Planta Med. 2021, 87, 836–840. [Google Scholar] [CrossRef]
- Kotzé, M.; Eloff, J.N.; Houghton, P.J. Extraction of Antibacterial Compounds from Combretum microphyllum (Combretaceae). S. Afr. J. Bot. 2002, 68, 62–67. [Google Scholar] [CrossRef]
- Eloff, J.N. Quantification the Bioactivity of Plant Extracts during Screening and Bioassay Guided Fractionation. Phytomedicine 2004, 11, 370–371. [Google Scholar] [CrossRef]
- Famuyide, I.M.; Aro, A.O.; Fasina, F.O.; Eloff, J.N.; McGaw, L.J. Antibacterial and Antibiofilm Activity of Acetone Leaf Extracts of Nine Under-Investigated South African Eugenia and Syzygium (Myrtaceae) Species and Their Selectivity Indices. BMC Complement. Altern. Med. 2019, 19, 141. [Google Scholar] [CrossRef] [PubMed]
- Pettit, R.K.; Weber, C.A.; Kean, M.J.; Hoffmann, H.; Pettit, G.R.; Tan, R.; Franks, K.S.; Horton, M.L. Microplate Alamar Blue Assay for Staphylococcus epidermidis Biofilm Susceptibility Testing. Antimicrob. Agents Chemother. 2005, 49, 2612–2617. [Google Scholar] [CrossRef] [PubMed]
- Swolana, D.; Kępa, M.; Kruszniewska-Rajs, C.; Wojtyczka, R.D. Antibiofilm Effect of Silver Nanoparticles in Changing the Biofilm-Related Gene Expression of Staphylococcus epidermidis. Int. J. Mol. Sci. 2022, 23, 9257. [Google Scholar] [CrossRef] [PubMed]
- Erhabor, C.R.; Erhabor, J.O.; McGaw, L.J. The Potential of South African Medicinal Plants against Microbial Biofilm and Quorum Sensing of Foodborne Pathogens: A Review. S. Afr. J. Bot. 2019, 126, 214–231. [Google Scholar] [CrossRef]
- Moradi, F.; Hadi, N. Quorum-Quenching Activity of Some Iranian Medicinal Plants. New Microbe. New Infect. 2021, 42, 100882. [Google Scholar] [CrossRef]
- Samreen; Qais, F.A.; Ahmad, I. Anti-Quorum Sensing and Biofilm Inhibitory Effect of Some Medicinal Plants against Gram-Negative Bacterial Pathogens: In Vitro and In Silico Investigations. Heliyon 2022, 8, e11113. [Google Scholar] [CrossRef] [PubMed]
- Ogbuadike, E.C.; Nkadimeng, S.M.; Igwe, C.C.; Dzoyem, J.P.; Qekwana, D.N.; Petzer, I.-M.; McGaw, L.J. An In Vitro Study on the Potential of Selected South African Plant Extracts to Prevent and Treat Bovine Mastitis. S. Afr. J. Bot. 2023, 154, 98–107. [Google Scholar] [CrossRef]
- Bilić, J.; Svorcina, M.; Poljuha, D. Antioxidant capacity of fruit species characteristic for gardens in Istria (Croatia). In Proceedings of the 9th International Congress of Food Technologists, Biotechnologists and Nutritionists, Zagreb, Croatia, 3–5 October 2018; Kovačević Ganić, K., Dragović-Uzelac, V., Balbino, S., Eds.; Croatian Society of Food Technologists, Biotechnologists and Nutritionists: Zagreb, Croatia, 2018. [Google Scholar]
- Mikulic-Petkovsek, M.; Schmitzer, V.; Stampar, F.; Veberic, R.; Koron, D. Changes in Phenolic Content Induced by Infection with Didymella applanata and Leptosphaeria coniothyrium, the Causal Agents of Raspberry Spur and Cane Blight. Plant Pathol. 2014, 63, 185–192. [Google Scholar] [CrossRef]
- Eloff, J.N. Which extractant should be used for the screening and isolation of antimicrobial components from plants? J. Ethnopharmacol. 1998, 60, 1–8. [Google Scholar] [CrossRef]
- Singleton, V.L.; Rossi, J.A. Colorimetry of Total Phenolics with Phosphomolybdic-Phosphotungstic Acid Reagents. Am. J. Enol. Vitic. 1965, 16, 144–158. [Google Scholar] [CrossRef]
- Amerine, A.; Ough, C.S. Methods for Analysis of Musts and Wines. J. Inst. Brew. 1981, 87, 223–224. [Google Scholar] [CrossRef]
- Martins, D.; Barros, L.; Carvalho, A.M.; Ferreira, I.C.F.R. Nutritional and in Vitro Antioxidant Properties of Edible Wild Greens in Iberian Peninsula Traditional Diet. Food Chem. 2011, 125, 488–494. [Google Scholar] [CrossRef]
- Mikulic-Petkovsek, M.; Koron, D.; Rusjan, D. The Impact of Food Processing on the Phenolic Content in Products Made from Juneberry (Amelanchier lamarckii) Fruits. J. Food Sci. 2020, 85, 386–393. [Google Scholar] [CrossRef]
- Mikulic-Petkovsek, M.; Stampar, F.; Veberic, R.; Sircelj, H. Wild Prunus Fruit Species as a Rich Source of Bioactive Compounds: Wild Prunus-Rich Source of Bioactive CompoundS. J. Food Sci. 2016, 81, C1928–C1937. [Google Scholar] [CrossRef]
- Eloff, J.N. A Sensitive and Quick Microplate Method to Determine the Minimal Inhibitory Concentration of Plant Extracts for Bacteria. Planta Med. 1998, 64, 711–713. [Google Scholar] [CrossRef] [PubMed]
- Masoko, P.; Picard, J.; Eloff, J.N. Antifungal Activities of Six South African Terminalia Species (Combretaceae). J. Ethnopharmacol. 2005, 99, 301–308. [Google Scholar] [CrossRef] [PubMed]
- Mohsenipour, Z.; Hassanshahian, M. The Effects of Allium sativum Extracts on Biofilm Formation and Activities of Six Pathogenic Bacteria. Jundishapur J. Microbiol. 2015, 8, e48733. [Google Scholar] [CrossRef]
- Sandasi, M.; Leonard, C.M.; Viljoen, A.M. The In Vitro Antibiofilm Activity of Selected Culinary Herbs and Medicinal Plants against Listeria monocytogenes: Anti-Biofilm Activity. Lett. Appl. Microbiol. 2010, 50, 30–35. [Google Scholar] [CrossRef]
- Sandasi, M.; Leonard, C.M.; Viljoen, A.M. The Effect of Five Common Essential Oil Components on Listeria monocytogenes Biofilms. Food Control 2008, 19, 1070–1075. [Google Scholar] [CrossRef]
- Ahmad, A.; Viljoen, A.M.; Chenia, H.Y. The Impact of Plant Volatiles on Bacterial Quorum Sensing. Lett. Appl. Microbiol. 2015, 60, 8–19. [Google Scholar] [CrossRef]
- Mosmann, T. Rapid Colorimetric Assay for Cellular Growth and Survival: Application to Proliferation and Cytotoxicity Assays. J. Immunol. Methods 1983, 65, 55–63. [Google Scholar] [CrossRef]
- McGaw, L.J.; Van der Merwe, D.; Eloff, J.N. In Vitro Anthelmintic, Antibacterial and Cytotoxic Effects of Extracts from Plants Used in South African Ethnoveterinary Medicine. Vet. J. 2007, 173, 366–372. [Google Scholar] [CrossRef] [PubMed]


| Phenolic Compounds | Robinia pseudoacacia Leaf | Robinia pseudoacacia Flower | ||
|---|---|---|---|---|
| 70% EtOH | 80% MeOH | 70% EtOH | 80% MeOH | |
| 3-Caffeoylquinic acid | 0.454 ± 0.057 a | 0.355 ± 0.043 a | 0.123 ± 0.041 b | 0.037 ± 0.003 b |
| 5-Caffeoylquinic acid | 0.011 ± 0.000 a | 0.010 ± 0.001 ab | 0.005 ± 0.001 c | 0.006 ± 0.001 bc |
| Caffeic acid | 0.346 ± 0.054 a | 0.236 ± 0.024 b | 0.100 ± 0.018 c | 0.059 ± 0.008 c |
| Caffeic acid hexoside 1 | 0.242 ± 0.010 a | 0.224 ± 0.038 a | 0.029 ± 0.001 b | 0.022 ± 0.002 b |
| Caffeic acid hexoside 2 | 0.039 ± 0.001 a | 0.021 ± 0.005 b | 0.003 ± 0.000 c | 0.004 ± 0.001 c |
| p-Coumaric acid | 0.152 ± 0.009 a | 0.116 ± 0.039 a | n.d. | n.d. |
| p-Coumaric acid hexoside 1 | 0.052 ± 0.002 a | 0.048 ± 0.008 b | 0.007 ± 0.001 a | 0.006 ± 0.002 b |
| p-Coumaric acid hexoside 2 | 0.287 ± 0.011 a | 0.118 ± 0.035 b | 0.026 ± 0.006 c | 0.068 ± 0.014 c |
| 3-p-Coumaroylquinic acid | 0.102 ± 0.001 a | 0.086 ± 0.004 b | 0.001 ± 0.000 c | 0.002 ± 0.000 c |
| 4-p-Coumaroylquinic acid | 0.003 ± 0.002 a | 0.002 ± 0.002 a | 0.003 ± 0.001 a | 0.001 ± 0.000 a |
| 5-p-Coumaroylquinic acid 1 | 0.109 ± 0.003 b | 0.087 ± 0.011 b | 0.409 ± 0.123 a | 0.056 ± 0.011 b |
| 5-p-Coumaroylquinic acid 2 | 0.084 ± 0.004 ab | 0.046 ± 0.016 c | 0.059 ± 0.005 bc | 0.101 ± 0.005 a |
| 3-Feruloylquinic acid | 0.033 ± 0.001 a | 0.018 ± 0.004 b | 0.002 ± 0.000 c | 0.004 ± 0.000 c |
| Ferulic acid | 0.006 ± 0.000 a | 0.006 ± 0.000 a | n.d. | n.d. |
| Sinapic acid derivate | 0.036 ± 0.001 a | 0.031 ± 0.002 b | n.d. | n.d. |
| Hydroxycinnamic acid derivatives | 1.956 ± 0.100 a | 1.451 ± 0.155 c | 0.603 ± 0.246 b | 0.349 ± 0.100 d |
| Gallic acid | 0.361 ± 0.026 a | 0.247 ± 0.041 b | 0.137 ± 0.017 c | 0.091 ± 0.008 c |
| Ellagic acid | 0.005 ± 0.000 c | 0.006 ± 0.001 c | 0.115 ± 0.010 b | 0.137 ± 0.004 a |
| Ellagic acid hexoside | 1.137 ± 0.029 a | 0.572 ± 0.004 b | 0.249 ± 0.022 d | 0.441 ± 0.019 c |
| Protocatehuic acid | 0.192 ± 0.024 | 0.154 ± 0.012 | 0.025 ± 0.001 | 0.016 ± 0.001 |
| p-Hydroxybenzoic acid | 0.518 ± 0.013 b | 0.393 ± 0.070 a | n.d. | n.d. |
| Hydroxybenzoic acid derivatives | 2.076 ± 0.272 a | 1.014 ± 0.751 b | 0.513 ± 0.039 b | 0.682 ± 0.028 b |
| Apigenin glucuronyl rhamnosylhexoside | 1.036 ± 0.114 a | 1.220 ± 0.133 a | 0.051 ± 0.005 b | 0.091 ± 0.004 b |
| Luteolin rhamnosyl hexoside 1 | 0.009 ± 0.001 c | 0.003 ± 0.000 c | 3.075 ± 0.142 b | 1.748 ± 0.163 a |
| Luteolin rhamnosyl hexoside 2 | 0.130 ± 0.015 c | 0.153 ± 0.015 c | 1.281 ± 0.111 b | 1.524 ± 0.040 a |
| Luteolin dirhamnosyl hexoside 1 | 0.451 ± 0.048 c | 0.133 ± 0.027 c | 6.990 ± 0.652 b | 12.299 ± 0.566 a |
| Luteolin dirhamnosyl hexoside 2 | 0.013 ± 0.001 c | 0.016 ± 0.001 c | 1.404 ± 0.161 b | 2.459± 0.106 a |
| Flavones | 1.52 ± 0.352 c | 1.486 ± 0.226 c | 11.474 ± 1.074 b | 19.448 ± 0.842 a |
| Procyanidin dimer 1 | 3.552 ± 0.194 a | 2.695 ± 0.493 a | 0.487 ± 0.070 b | 0.479 ± 0.036 b |
| Procyanidin dimer 2 | 4.890 ± 0.205 a | 3.396 ± 0.291 b | 0.128 ± 0.013 c | 0.131 ± 0.038 c |
| Procyanidin dimer 3 | 2.132 ± 0.255 a | 1.643 ± 0.285 a | 0.039 ± 0.008 b | 0.018 ± 0.002 b |
| Procyanidin dimer 4 | 1.294 ± 0.196 b | 0.916 ± 0.191 b | 2.612 ± 0.272 a | 0.158 ± 0.020 c |
| Procyanidin trimer 1 | 4.055 ± 0.065 a | 3.429 ± 0.192 b | 0.031 ± 0.007 c | 0.042 ± 0.007 c |
| Procyanidin trimer 2 | 1.214 ± 0.047 a | 0.668 ± 0.144 b | 0.327 ± 0.066 c | 0.161 ± 0.016 c |
| Procyanidin trimer 3 | 2.958 ± 0.045 a | 2.227 ± 0.246 b | 0.026 ± 0.005 c | 0.012 ± 0.002 c |
| Procyanidin trimer 4 | 3.214 ± 0.092 a | 2.646 ± 0.368 b | n.d. | n.d. |
| Procyanidin trimer 5 | 0.235 ± 0.028 a | 0.164 ± 0.046 b | n.d. | n.d. |
| Procyanidin tetramer 1 | 0.728 ± 0.028 a | 0.401 ± 0.086 b | n.d. | n.d. |
| Procyanidin tetramer 2 | 2.949 ± 0.049 a | 1.844 ± 0.223 b | n.d. | n.d. |
| Epicatechin | 0.013 ± 0.002 c | 0.009 ± 0.002 c | 0.251 ± 0.012 a | 0.105 ± 0.014 b |
| Catechin | 6.221 ± 0.194 a | 5.907 ± 0.493 a | 0.576 ± 0.081 b | 0.871 ± 0.141 b |
| Gallocatechin | 1.003 ± 0.043 a | 0.620 ± 0.077 b | 0.366 ± 0.081 c | 0.520 ± 0.054 c |
| Flavanols | 32.806 ± 2.113 a | 24.357 ± 3.528 b | 4.126 ± 0.667 c | 2.134 ± 0.866 c |
| Quercetin pentoside | n.d. | n.d. | 0.002 ± 0.000 a | 0.002 ± 0.000 a |
| Quercetin-3-galactoside | 0.275 ± 0.028 a | 0.233 ± 0.035 a | 0.107 ± 0.014 b | 0.134 ± 0.005 b |
| Quercetin-3-glucoside | 0.022 ± 0.001 c | 0.029 ± 0.004 c | 0.051 ± 0.004 b | 0.061 ± 0.002 a |
| Quercetin-3-rutinoside | 0.179 ± 0.020 b | 0.311 ± 0.047 b | 0.299 ± 0.085 b | 0.519 ± 0.033 a |
| Quercetin rhamnosyhexoside | 0.219 ± 0.047 b | 0.139 ± 0.021 b | 1.383 ± 0.160 a | 0.027 ± 0.002 b |
| Kaempferol hexoside 1 | n.d. | n.d. | 0.003 ± 0.001 a | 0.004 ± 0.000 a |
| Kaempferol hexoside 2 | n.d. | n.d. | 0.274 ± 0.020 a | 0.292 ± 0.011 a |
| Kaempferol hexoside 3 | n.d. | n.d. | 0.081 ± 0.012 b | 0.126 ± 0.013 a |
| Kaempferol-3-glucoside | 0.200 ± 0.029 a | 0.170 ± 0.017 a | n.d. | n.d. |
| Kaempferol rhamnosyl hexoside 1 | 0.001 ± 0.000 c | 0.001 ± 0.000 c | 0.252 ± 0.029 b | 0.537 ± 0.015 a |
| Kaempferol rhamnosyl hexoside 2 | 0.324 ± 0.030 a | 0.232 ± 0.025 b | 0.051 ± 0.015 c | 0.089 ± 0.006 c |
| Kaempferol rhamnosyl hexoside 3 | 0.091 ± 0.005 c | 0.120 ± 0.015 bc | 0.172 ± 0.028 a | 0.140 ± 0.007 ab |
| Kaempferol glucuronyl rhamnosyl hexoside 1 | 0.105 ± 0.011 b | 0.135 ± 0.025 ab | 0.114 ± 0.012 b | 0.174 ± 0.018 a |
| Kaempferol glucuronyl rhamnosyl hexoside 2 | 5.521 ± 0.623 a | 3.181 ± 0.182 b | 0.272 ± 0.033 c | 0.463 ± 0.041 c |
| Isorhamnetin-3-rutinoside | 1.041 ± 0.095 a | 1.248 ± 0.128 a | 0.228 ± 0.046 b | 0.390 ± 0.088 b |
| Isorhamnetin hexoside 1 | 0.005 ± 0.000 b | 0.003 ± 0.000 b | 0.072 ± 0.025 a | 0.094 ± 0.004 a |
| Isorhamnetin hexoside 2 | 0.093 ± 0.018 a | 0.058 ± 0.003 b | 0.010 ± 0.001 c | 0.017 ± 0.002 c |
| Myricetin hexoside | 0.090 ± 0.011 b | 0.053 ± 0.003 c | 0.061 ± 0.007 c | 0.130 ± 0.004 a |
| Robinetin | 0.001 ± 0.000 c | 0.002 ± 0.000 b | 0.003 ± 0.000 b | 0.003 ± 0.000 a |
| Dihydrorobinetin | 0.081 ± 0.001 a | 0.068 ± 0.003 b | 0.004 ± 0.001 b | 0.006 ± 0.001 c |
| Flavonols | 8.226 ± 0.656 a | 5.843 ± 0.660 b | 3.457 ± 0.220 c | 3.171 ± 0.162 c |
| Naringenin hexoside 1 | 0.092 ± 0.007 b | 0.142 ± 0.014 a | 0.043 ± 0.003 d | 0.070 ± 0.005 c |
| Naringenin hexoside 2 | 0.082 ± 0.009 a | 0.058 ± 0.014 ab | 0.057 ± 0.014 ab | 0.031 ± 0.010 b |
| Naringenin hexoside 3 | 0.294 ± 0.039 a | 0.202 ± 0.020 b | 0.038 ± 0.008 c | 0.024 ± 0.005 c |
| Flavanones | 0.468 ± 0.052 a | 0.362 ± 0.113 a | 0.127 ± 0.010 b | 0.125 ± 0.017 b |
| Vescalagin 1 | 3.296 ± 0.347 b | 1.021 ± 0.090 c | 3.436 ± 0.306 b | 5.863 ± 0.290 a |
| Vescalagin 2 | 2.031 ± 0.181 a | 1.364 ± 0.156 b | 0.642 ± 0.105 c | 0.971 ± 0.139 bc |
| Ellagitannins | 5.327 ± 0.274 ab | 1.789 ± 0.805 c | 4.078 ± 0.376 b | 6.834 ± 0.418 a |
| Total Analyzed Phenolics | 52.717 ± 2.531 a | 36.742 ± 3.588 b | 24.853 ± 2.052 c | 32.743 ± 2.2689 bc |
| Plant/Organ | Solvent | Yield | LC50 | Pseudomonas aeruginosa | Staphylococcus aureus | Bacillus cereus | Candida albicans | Candida parapsilosis | ||||||||||
|---|---|---|---|---|---|---|---|---|---|---|---|---|---|---|---|---|---|---|
| MIC | TAA | SI | MIC | TAA | SI | MIC | TAA | SI | MIC | TAA | SI | MIC | TAA | SI | ||||
| RL | 70% EtOH | 204 | 0.11 | 0.63 | 324 | 0.17 | >2.5 | 82 | 0.04 | 0.63 | 324 | 0.17 | 2.5 | 82 | 0.04 | 2.5 | 82 | 0.04 |
| 80% MeOH | 247 | 0.11 | 0.63 | 392 | 0.17 | 2.5 | 98 | 0.04 | 0.63 | 392 | 0.17 | 0.63 | 392 | 0.17 | 0.63 | 392 | 0.17 | |
| RF | 70% EtOH | 264 | >1 | >2.5 | 106 | 0.4 | >2.5 | 105 | >0.04 | 0.63 | 419 | >1.59 | 2.5 | 105 | 0.04 | 1.25 | 211 | 0.8 |
| 80% MeOH | 254 | >1 | 0.63 | 403 | >1.59 | 2.5 | 101 | 0.04 | 0.63 | 403 | >1.59 | 1.25 | 203 | 0.08 | 2.5 | 101 | 0.4 | |
| Gentamicin | 0.0003 | 0.00013 | 0.0005 | |||||||||||||||
| Amphotericin-B | 0.000488 | 0.001953 | ||||||||||||||||
| Plant/Organ | Solvent | Anti-Quorum Activity (mg/mL) | Anti-Biofilm Activity (%) | ||
|---|---|---|---|---|---|
| MQSIC | IC50 | Prevention | Eradication | ||
| RL | 70% EtOH | >1.25 | 0.43 | + | + |
| 80% MeOH | >1.25 | 0.41 | ++ | + | |
| RF | 70% EtOH | 0.63 | 0.04 | ++ | + |
| 80% MeOH | 0.16 | 0.04 | + | + | |
Disclaimer/Publisher’s Note: The statements, opinions and data contained in all publications are solely those of the individual author(s) and contributor(s) and not of MDPI and/or the editor(s). MDPI and/or the editor(s) disclaim responsibility for any injury to people or property resulting from any ideas, methods, instructions or products referred to in the content. |
© 2023 by the authors. Licensee MDPI, Basel, Switzerland. This article is an open access article distributed under the terms and conditions of the Creative Commons Attribution (CC BY) license (https://creativecommons.org/licenses/by/4.0/).
Share and Cite
Uzelac, M.; Sladonja, B.; Šola, I.; Dudaš, S.; Bilić, J.; Famuyide, I.M.; McGaw, L.J.; Eloff, J.N.; Mikulic-Petkovsek, M.; Poljuha, D. Invasive Alien Species as a Potential Source of Phytopharmaceuticals: Phenolic Composition and Antimicrobial and Cytotoxic Activity of Robinia pseudoacacia L. Leaf and Flower Extracts. Plants 2023, 12, 2715. https://doi.org/10.3390/plants12142715
Uzelac M, Sladonja B, Šola I, Dudaš S, Bilić J, Famuyide IM, McGaw LJ, Eloff JN, Mikulic-Petkovsek M, Poljuha D. Invasive Alien Species as a Potential Source of Phytopharmaceuticals: Phenolic Composition and Antimicrobial and Cytotoxic Activity of Robinia pseudoacacia L. Leaf and Flower Extracts. Plants. 2023; 12(14):2715. https://doi.org/10.3390/plants12142715
Chicago/Turabian StyleUzelac, Mirela, Barbara Sladonja, Ivana Šola, Slavica Dudaš, Josipa Bilić, Ibukun M. Famuyide, Lyndy J. McGaw, Jacobus N. Eloff, Maja Mikulic-Petkovsek, and Danijela Poljuha. 2023. "Invasive Alien Species as a Potential Source of Phytopharmaceuticals: Phenolic Composition and Antimicrobial and Cytotoxic Activity of Robinia pseudoacacia L. Leaf and Flower Extracts" Plants 12, no. 14: 2715. https://doi.org/10.3390/plants12142715
APA StyleUzelac, M., Sladonja, B., Šola, I., Dudaš, S., Bilić, J., Famuyide, I. M., McGaw, L. J., Eloff, J. N., Mikulic-Petkovsek, M., & Poljuha, D. (2023). Invasive Alien Species as a Potential Source of Phytopharmaceuticals: Phenolic Composition and Antimicrobial and Cytotoxic Activity of Robinia pseudoacacia L. Leaf and Flower Extracts. Plants, 12(14), 2715. https://doi.org/10.3390/plants12142715