
Comparative MS- and NMR-Based Metabolome Mapping of Egyptian Red and White Squill Bulbs F. Liliaceae and in Relation to Their Cytotoxic Effect

 , , ,
, , , 

Abstract
1. Introduction
2. Results and Discussion
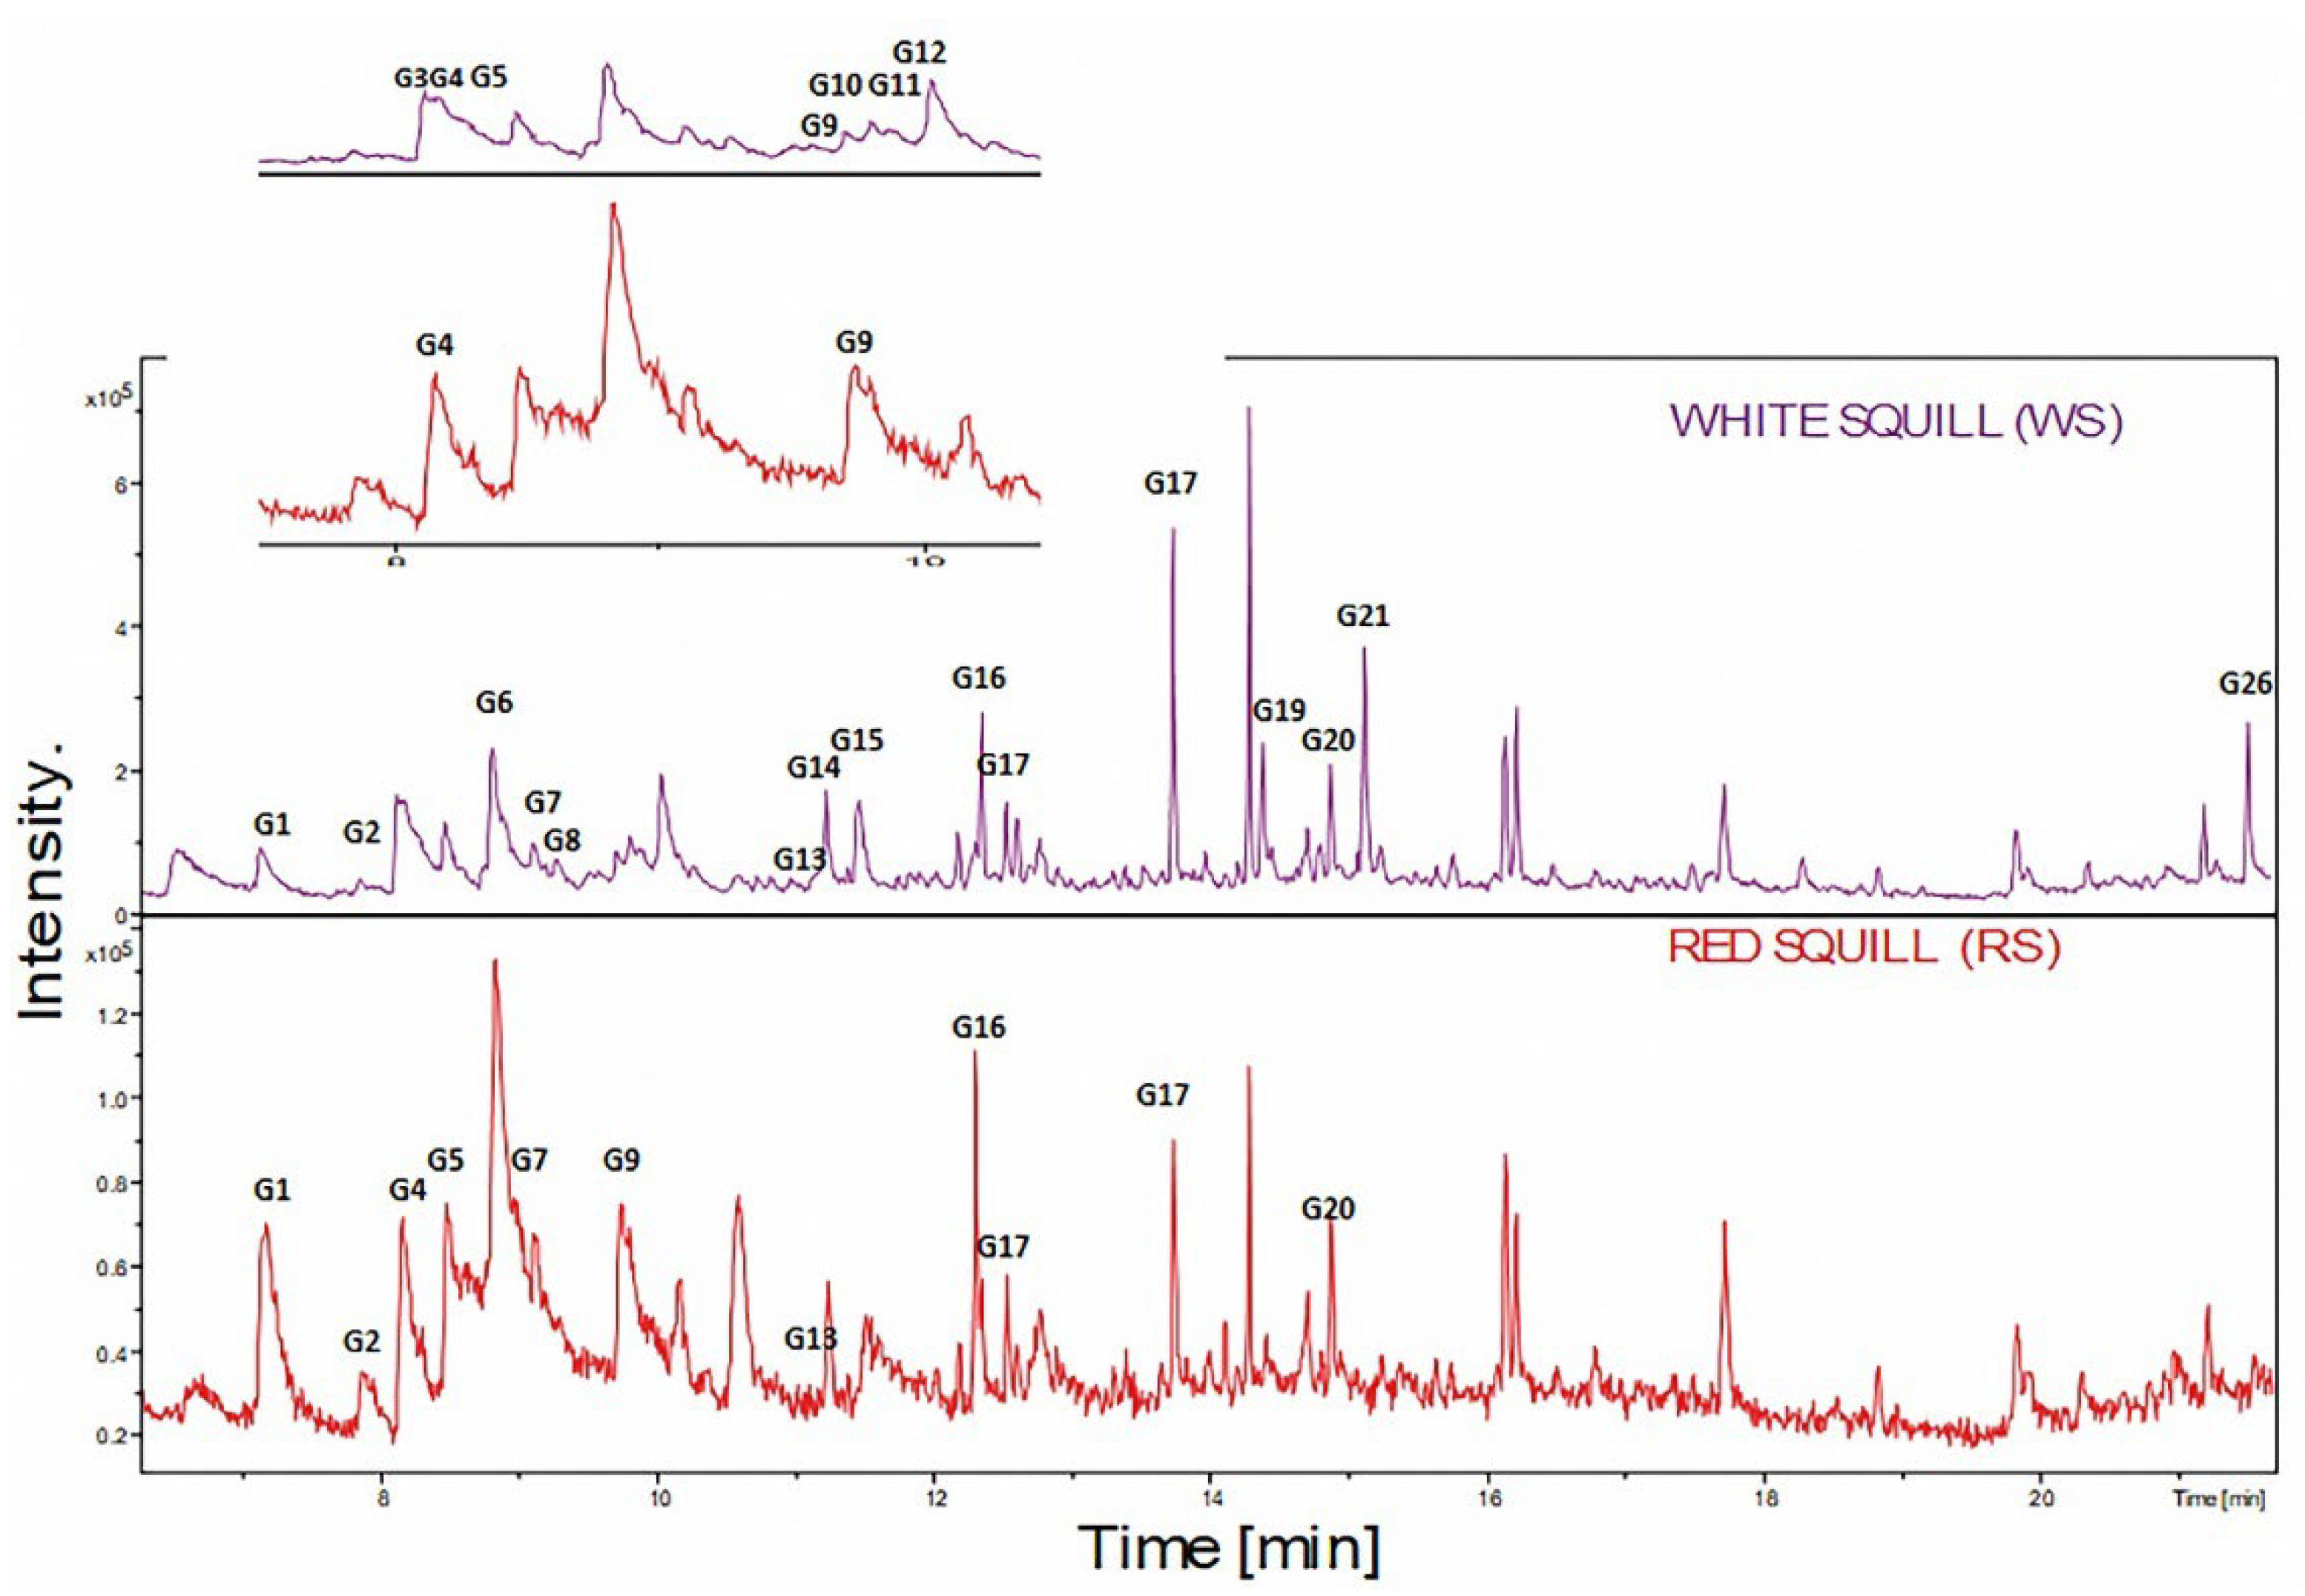
2.1. Identification of Volatile Organic Compounds (VOCs)
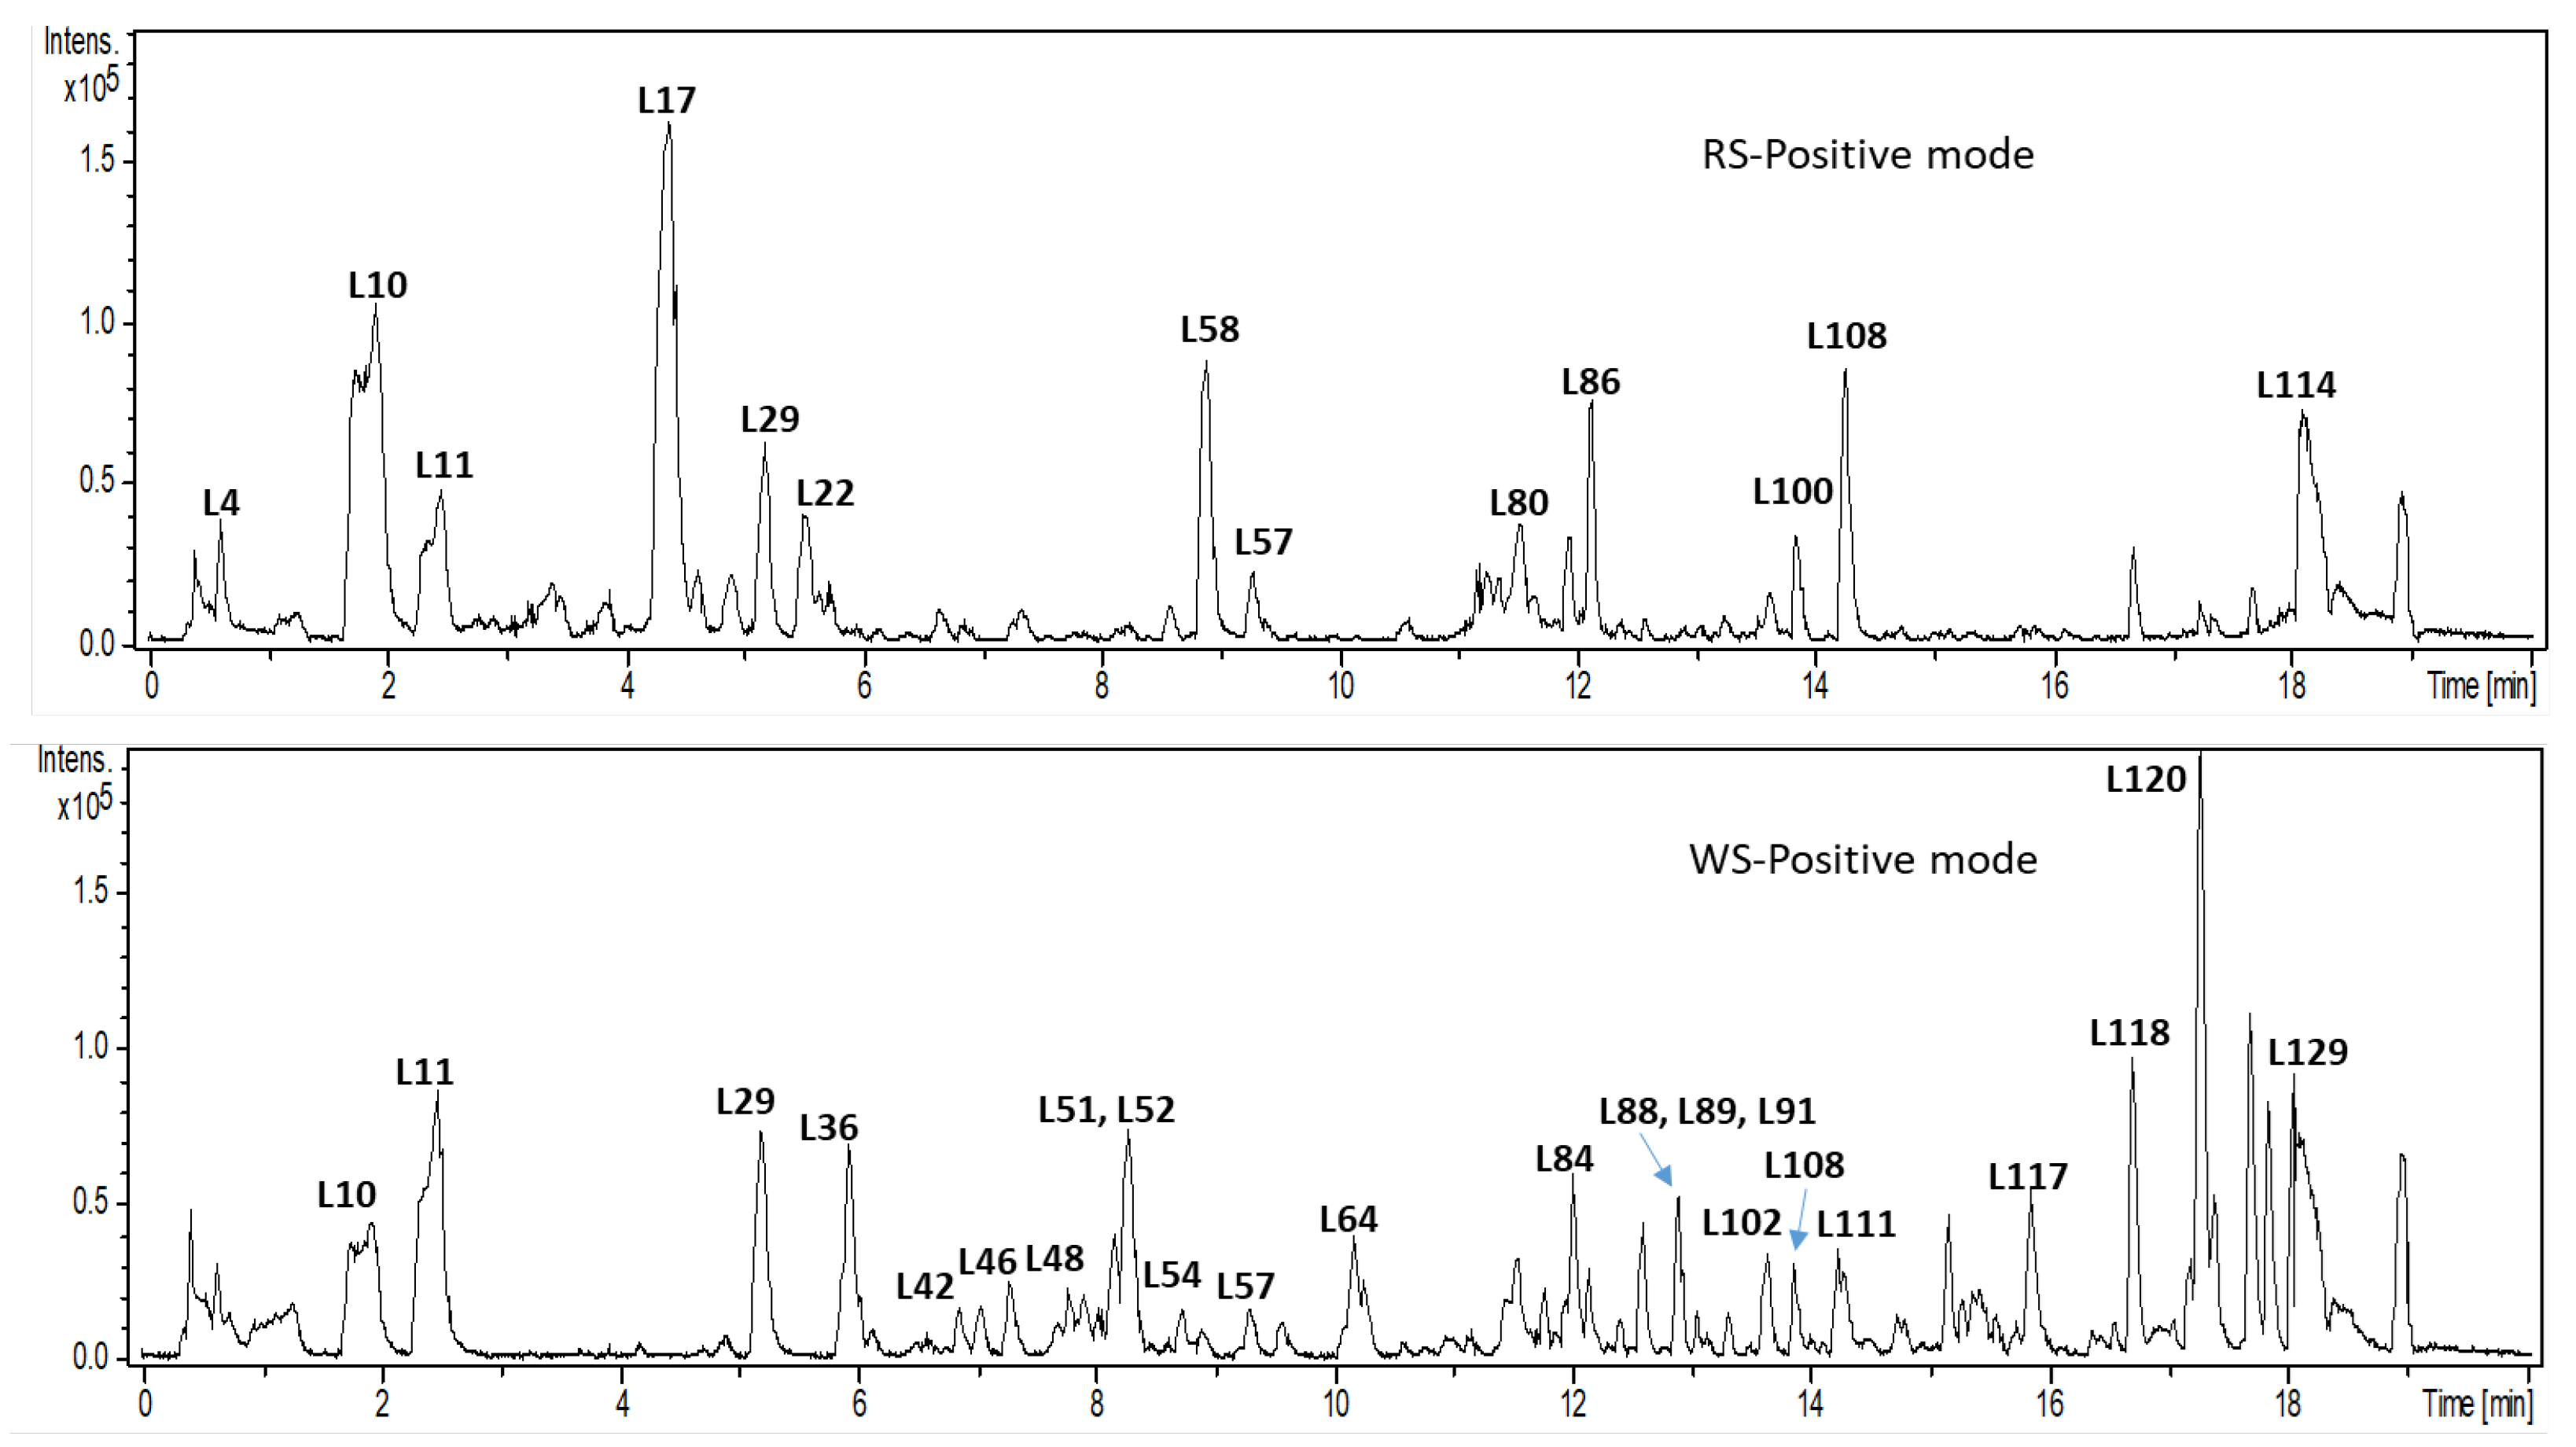
2.2. Secondary Metabolites Profiling via UHPLC/MS
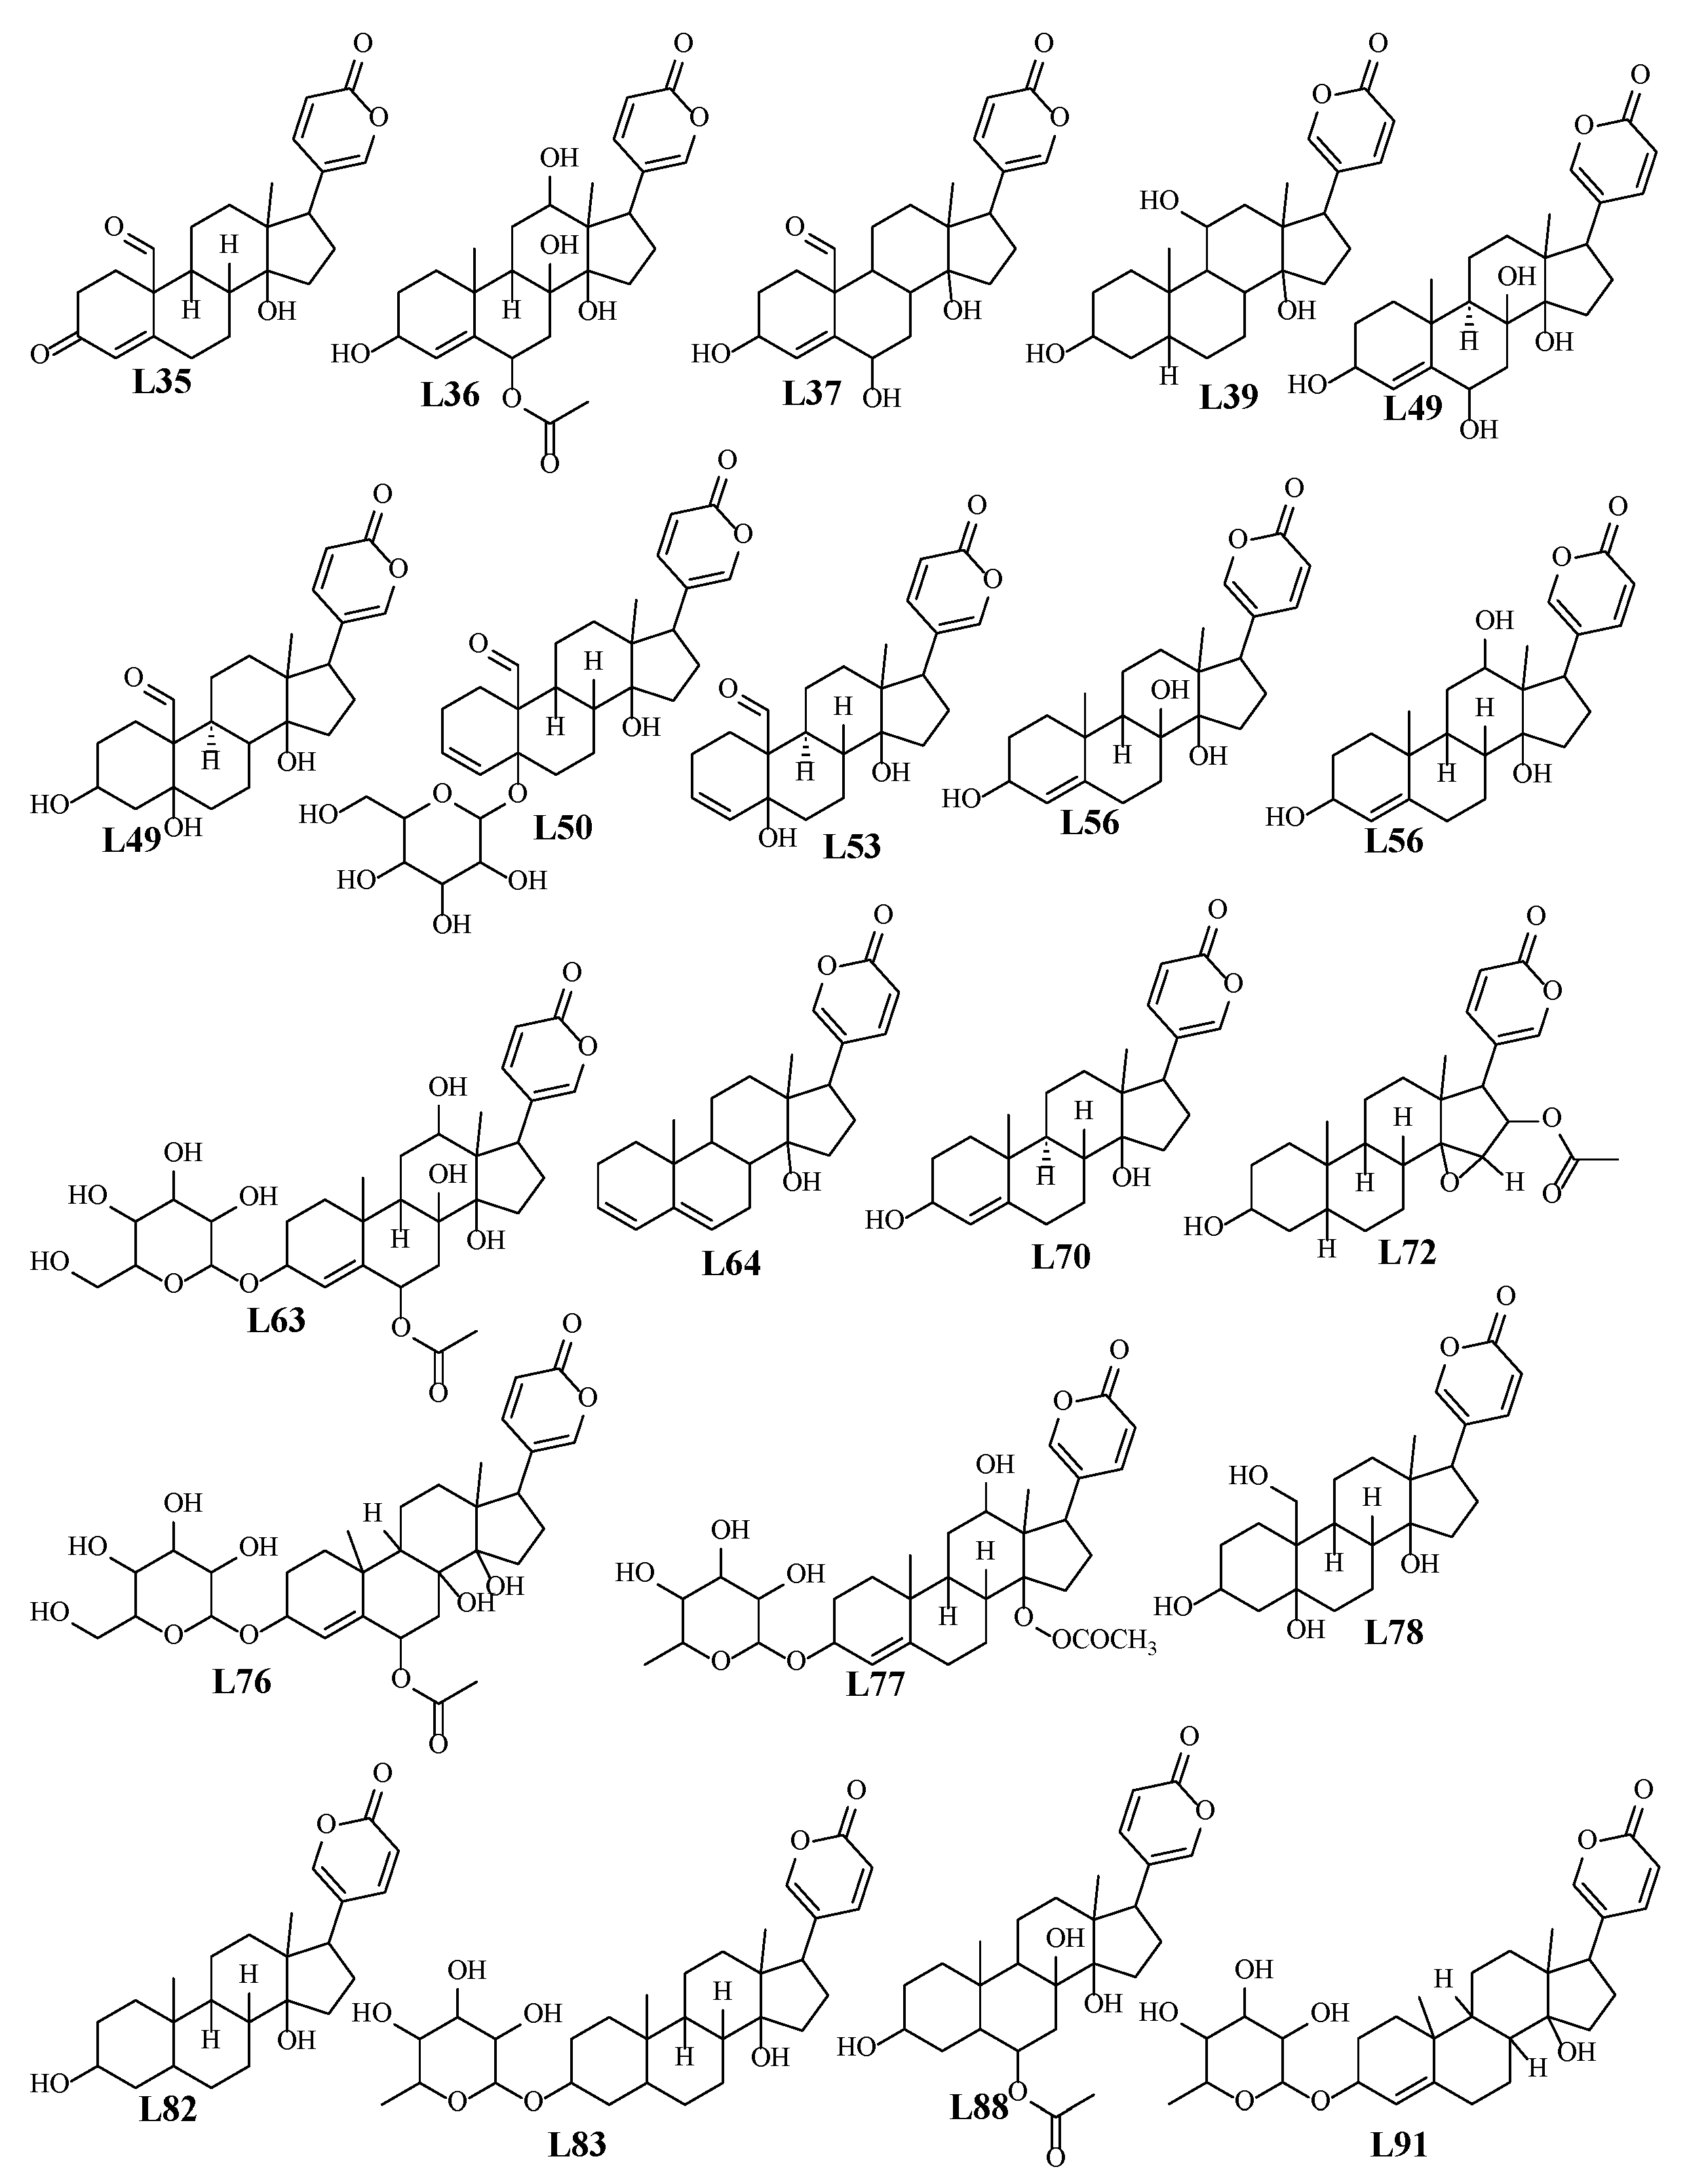
2.2.1. Bufadienolides
Hydroxyoxobufaenolide
2.2.2. Flavonoids
Identification of Flavanols/Flavonols
Identification of Flavones/Flavanones
Identification of Coumarins
2.2.3. Phenolic Acids
2.2.4. Amino Acids and Fatty Acids
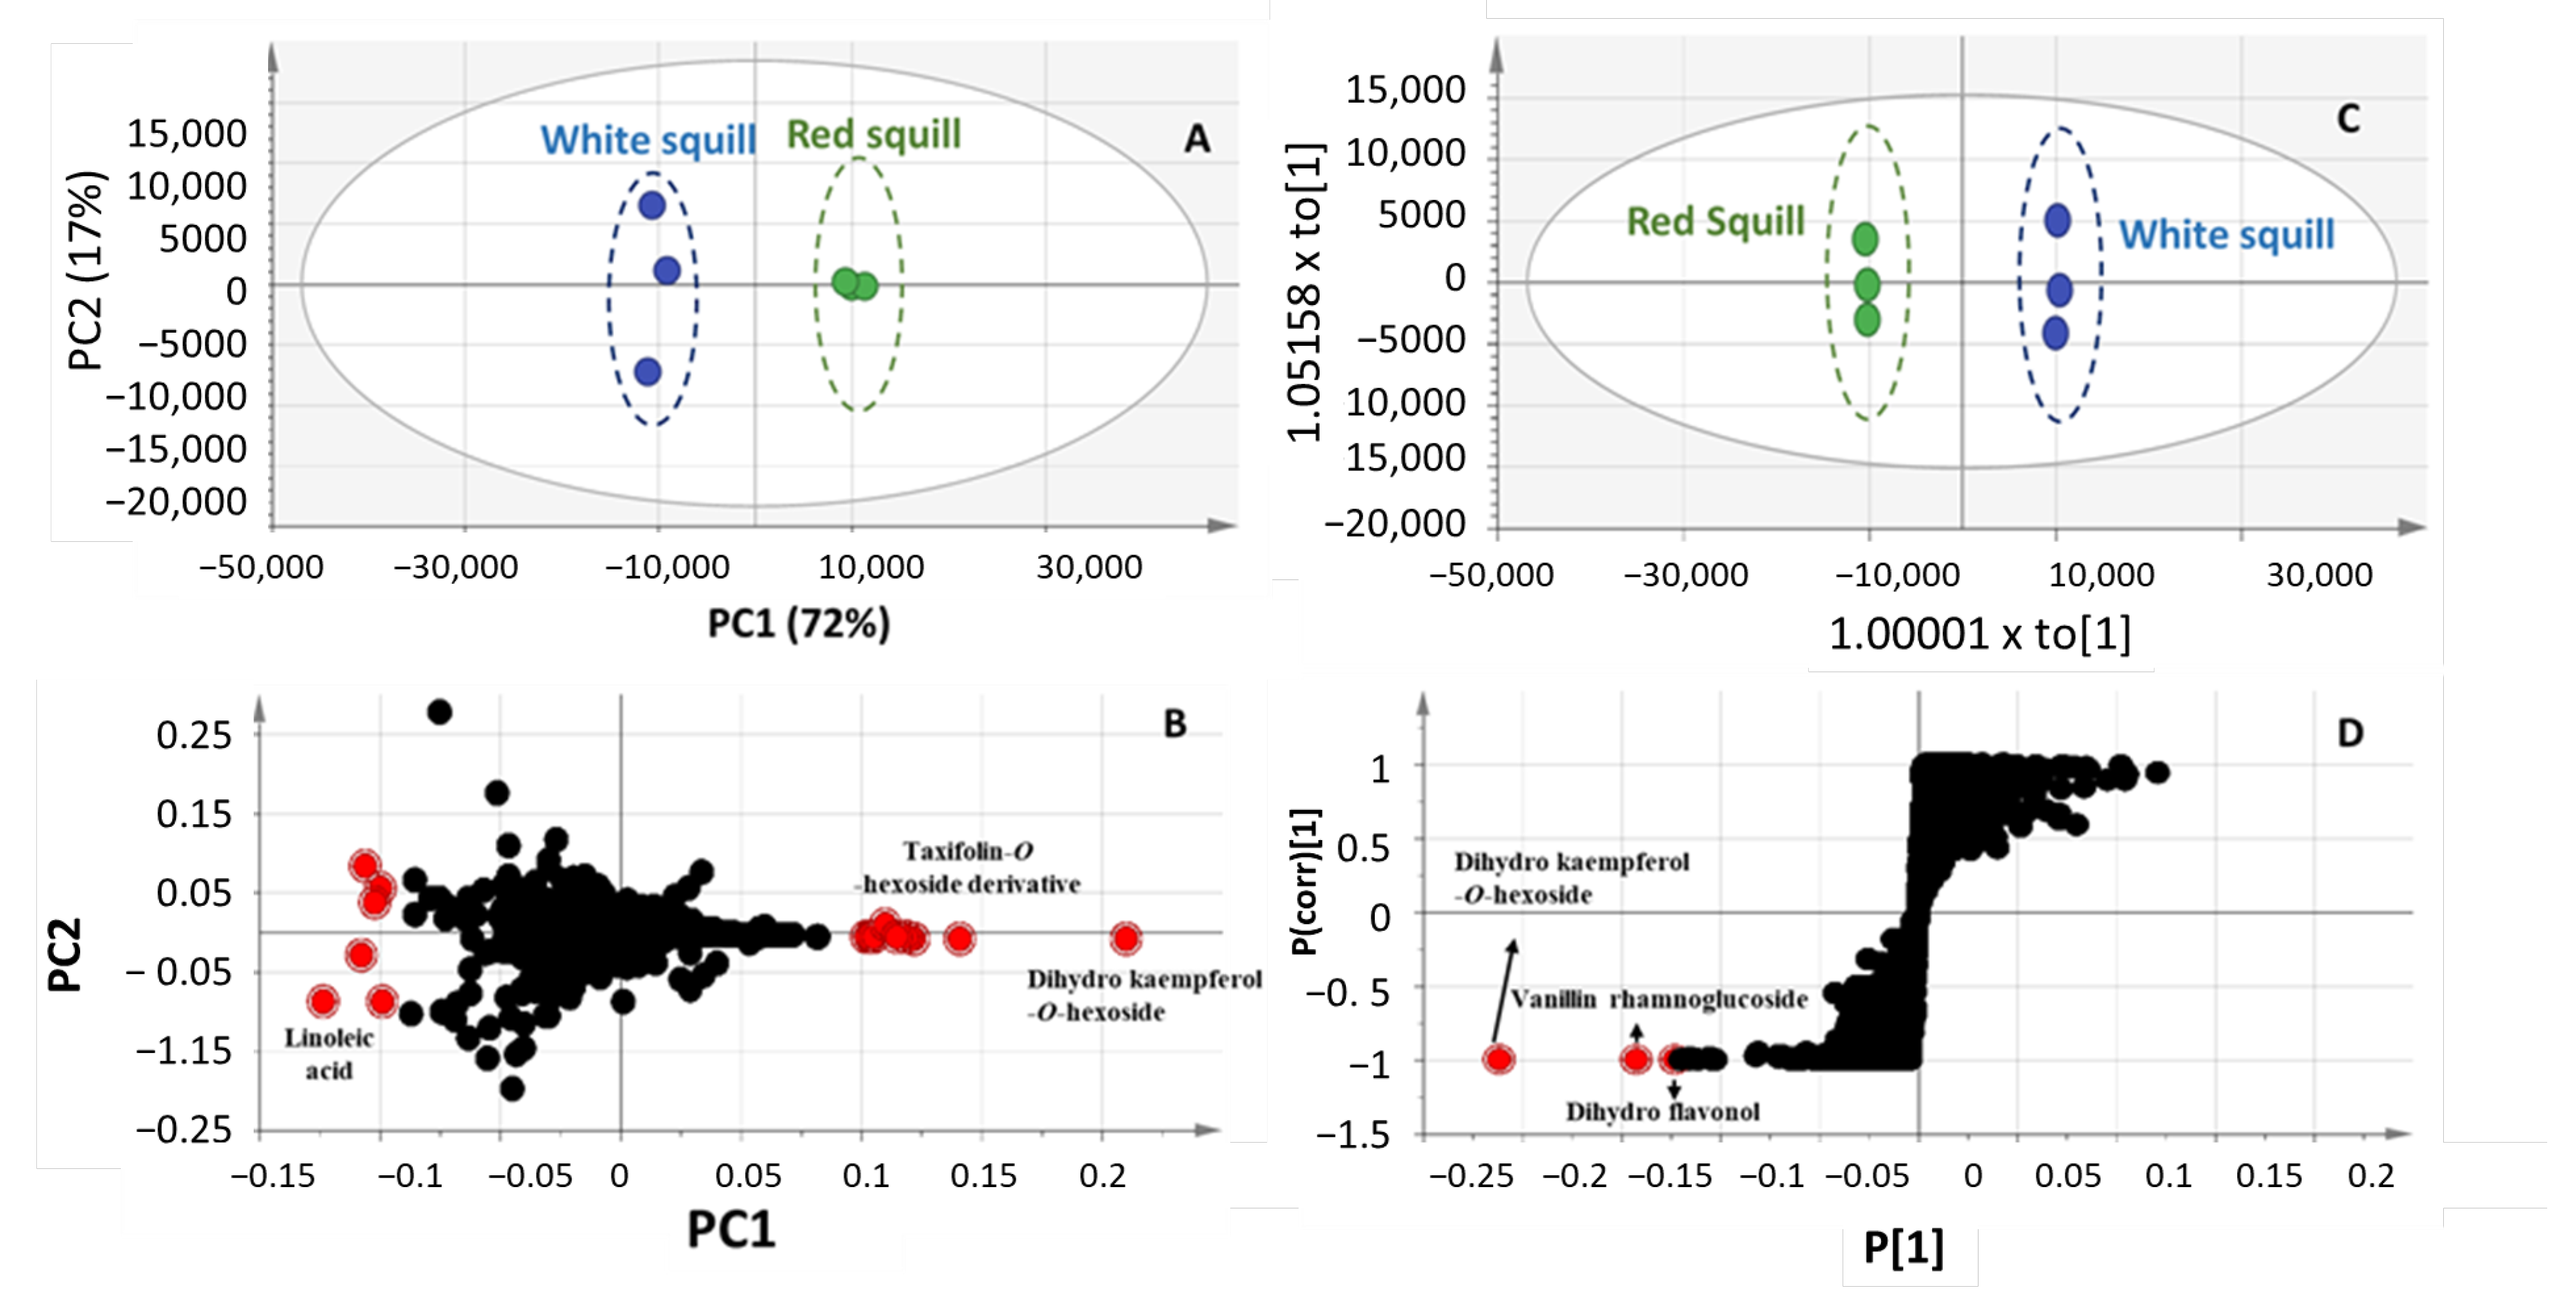
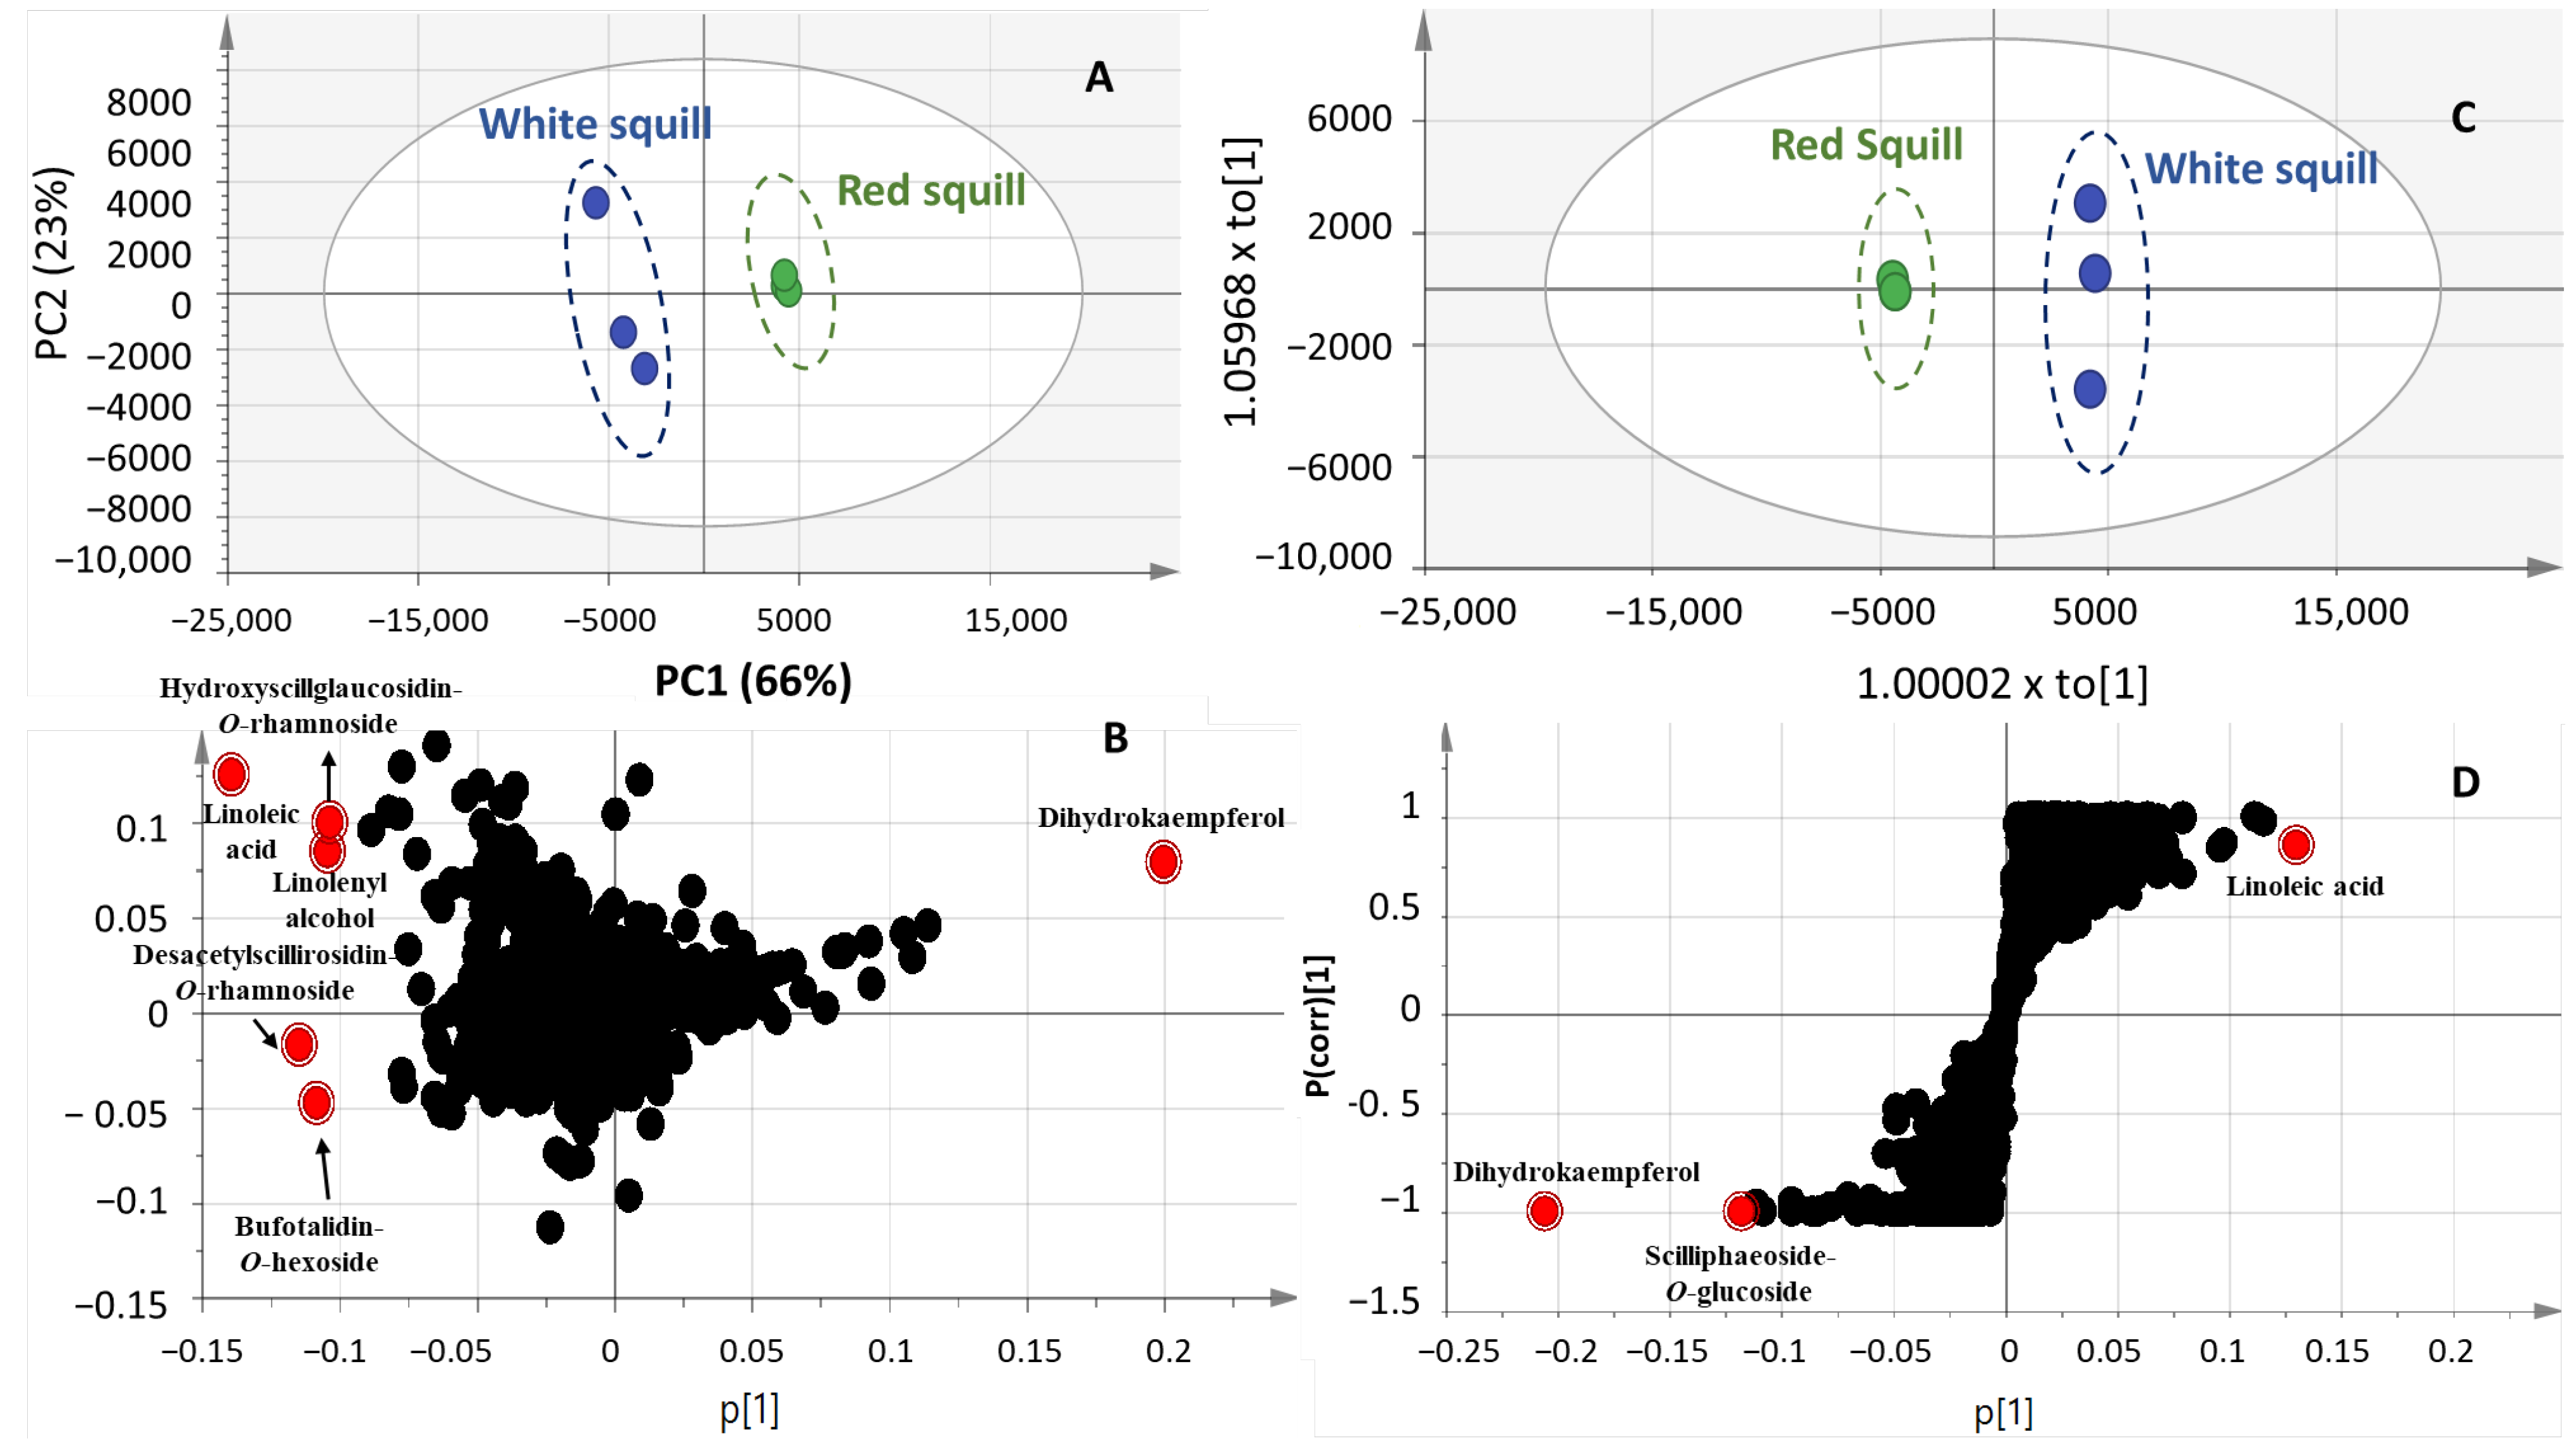
2.3. Multivariate Data Analysis of UPLC-MS Dataset
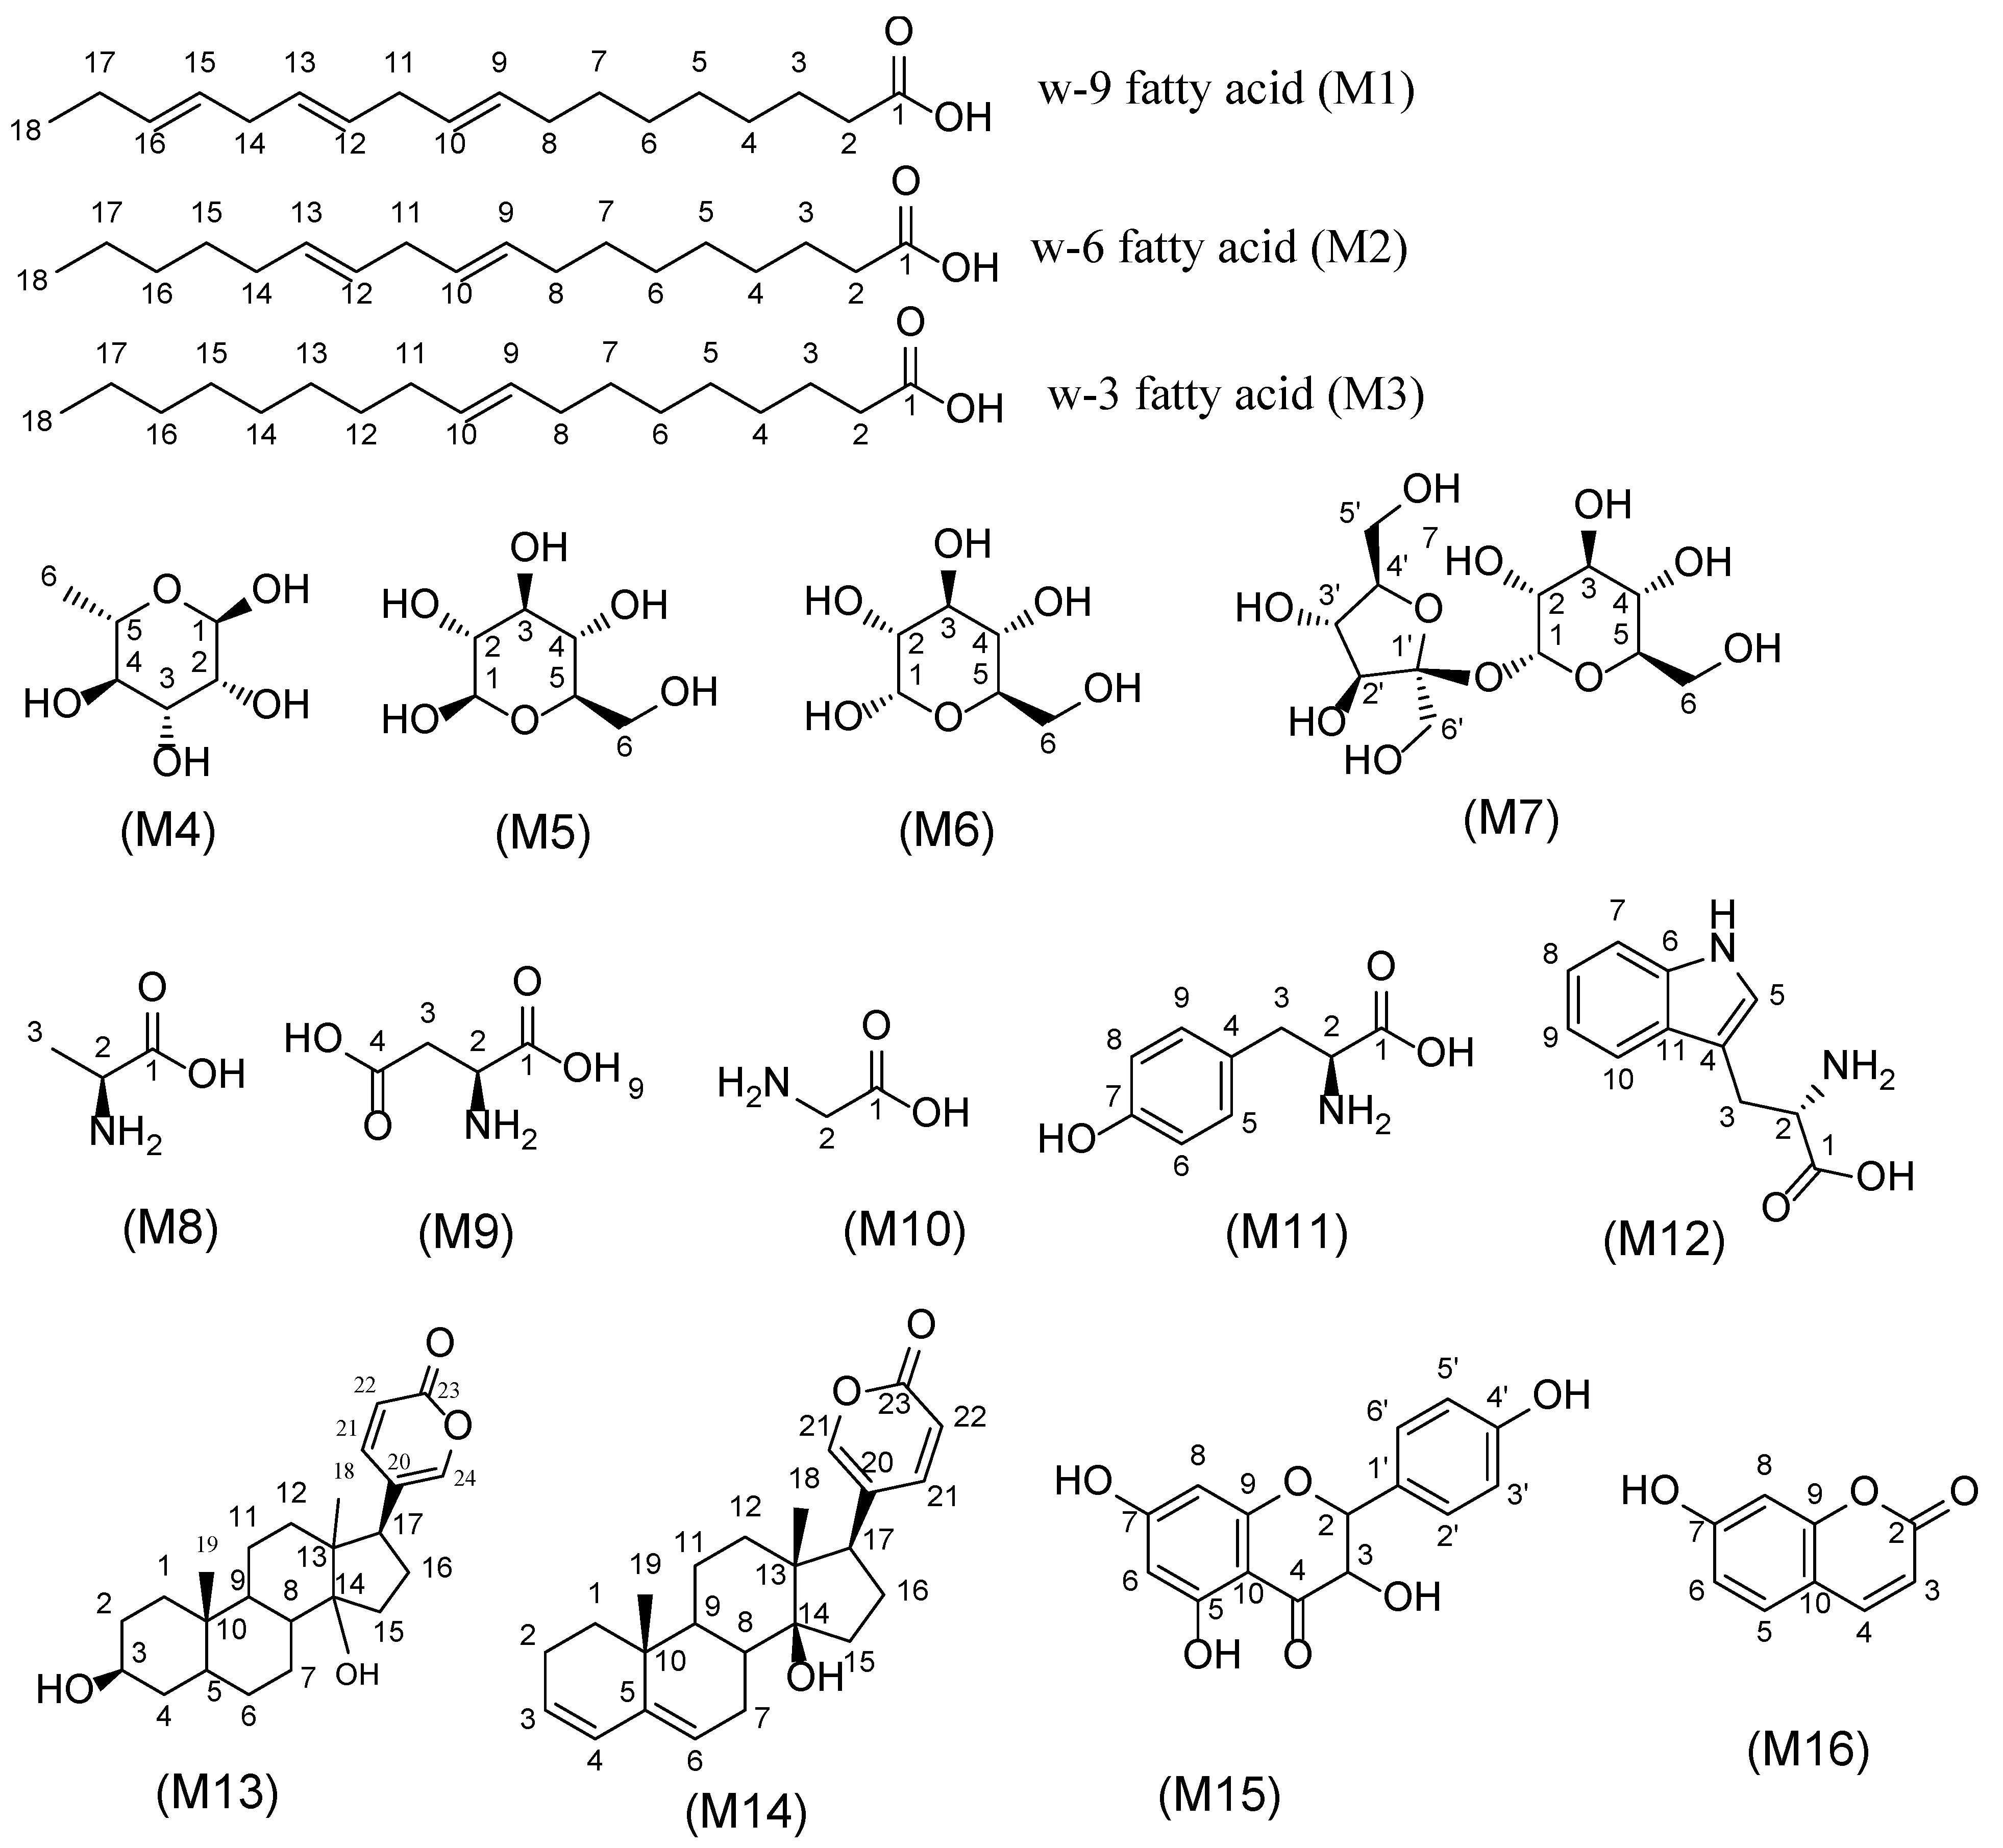
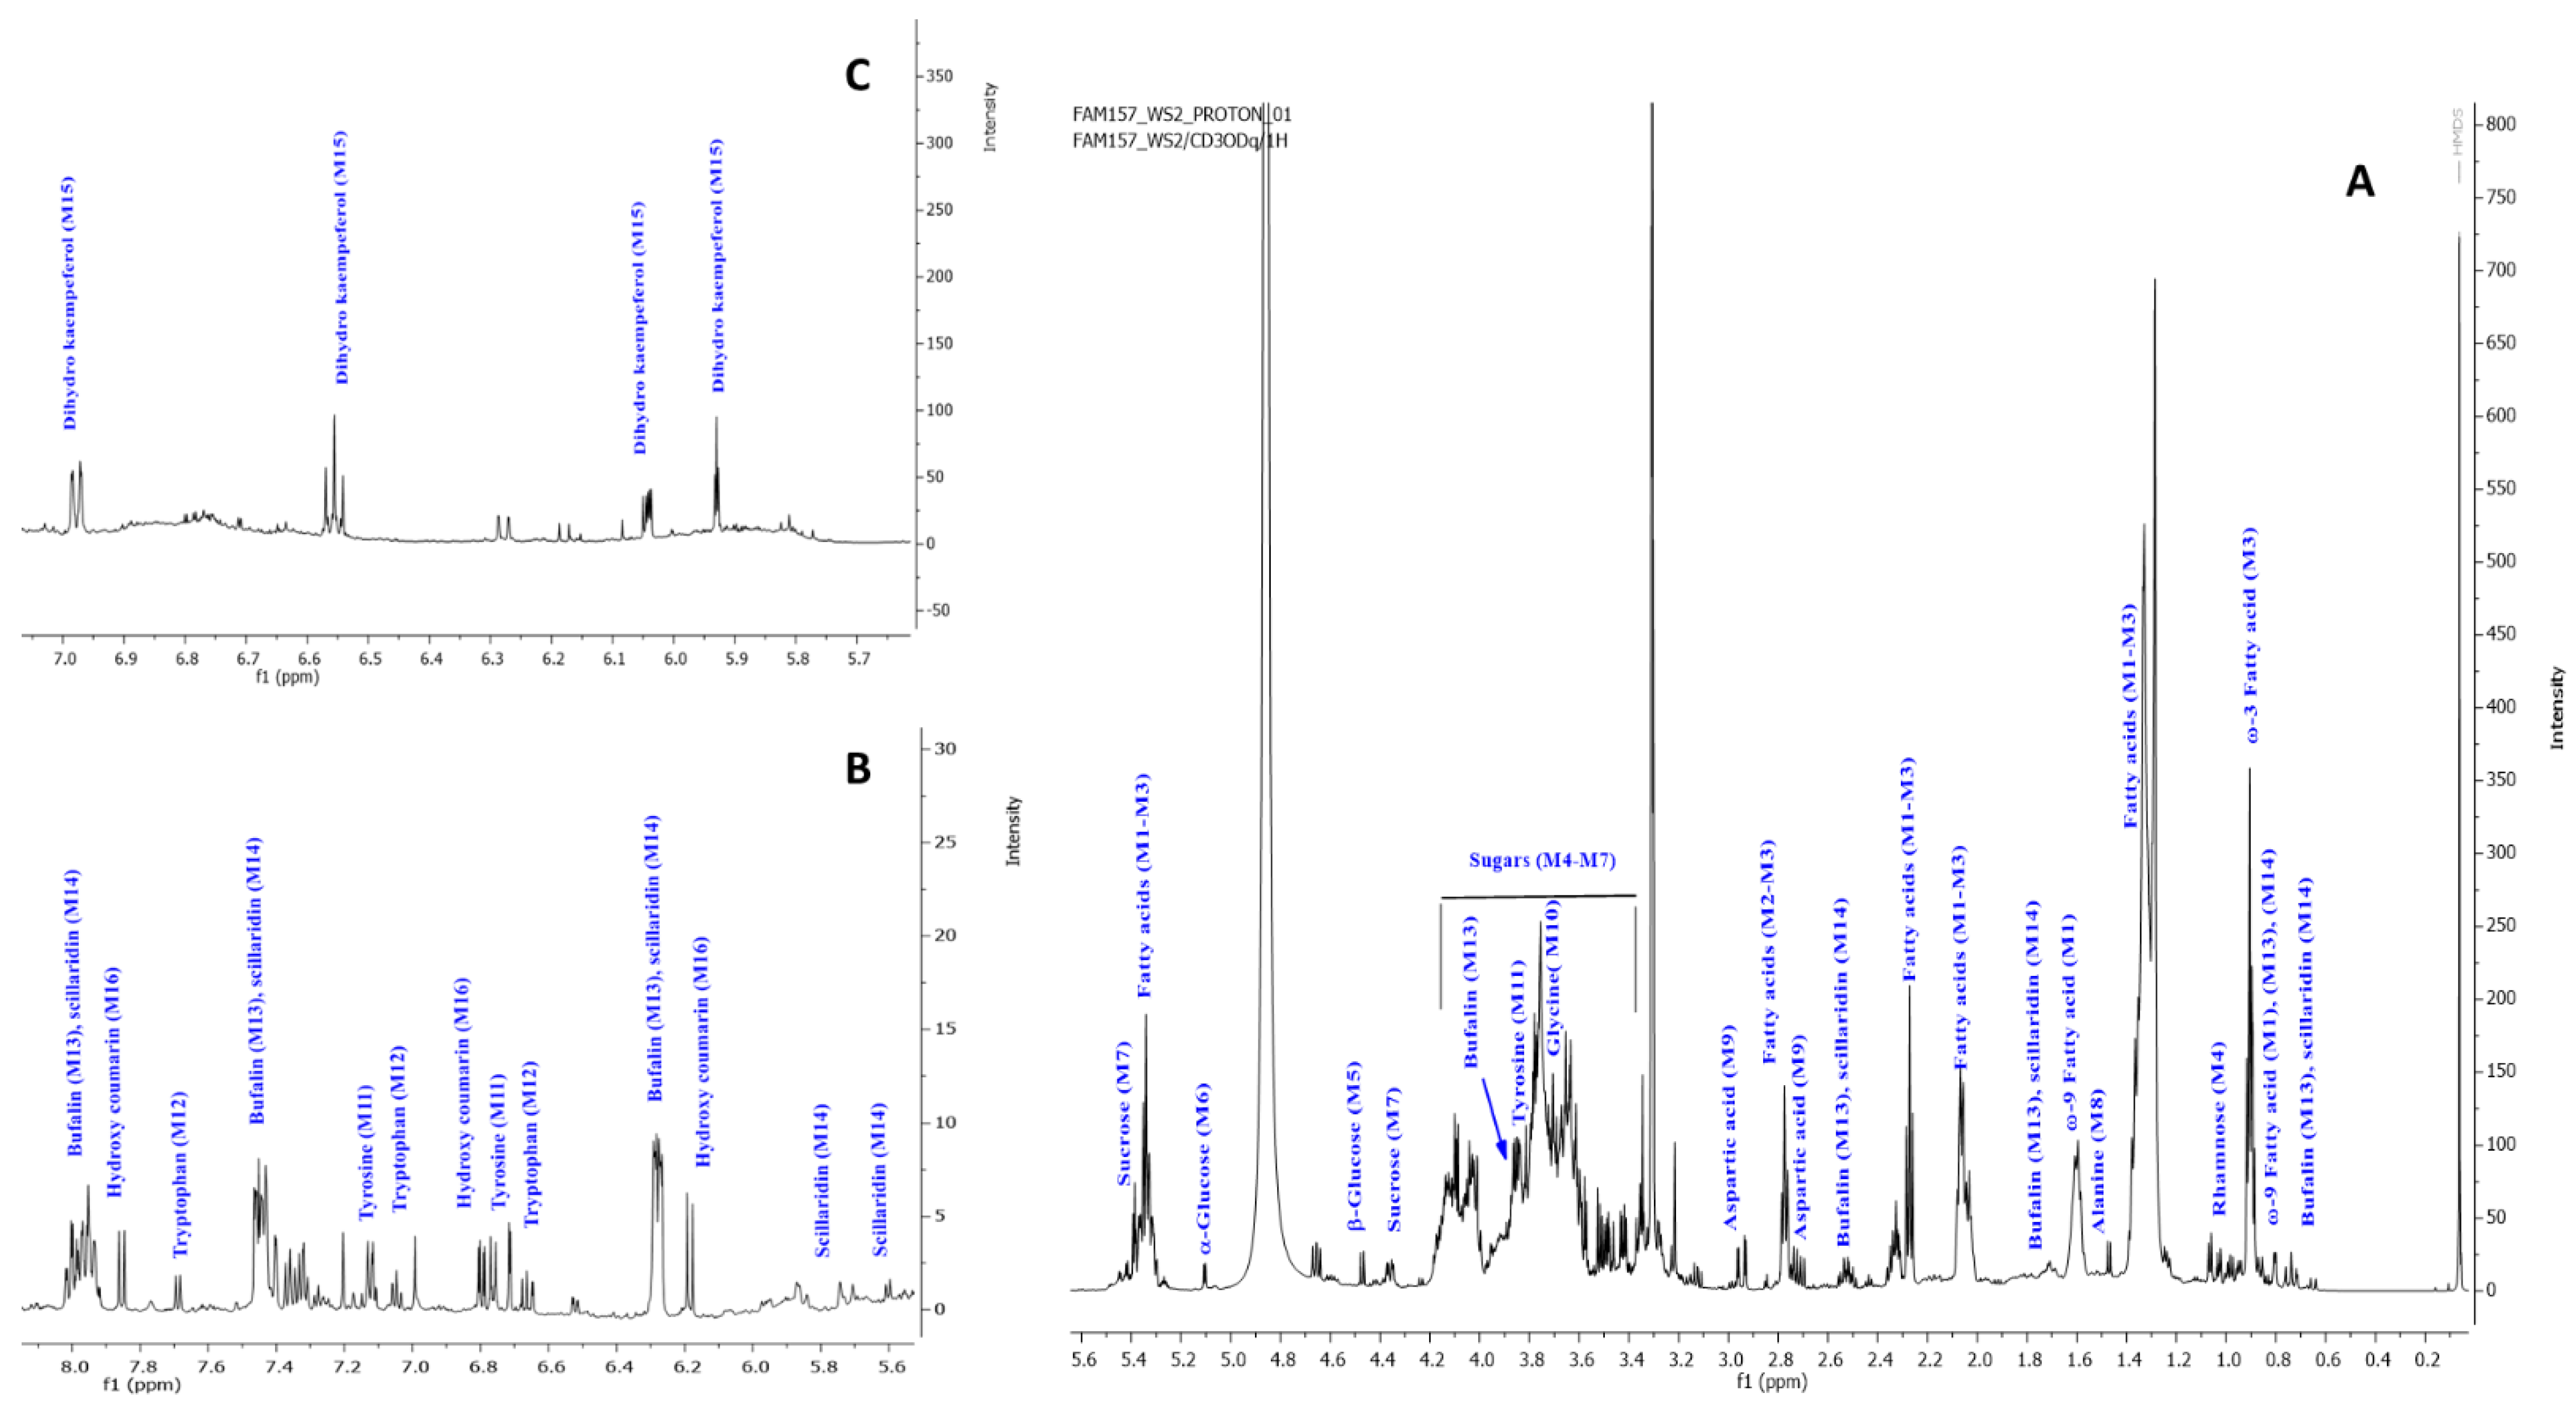
2.4. NMR Metabolites Fingerprinting
2.4.1. Fatty Acids
2.4.2. Sugars
2.4.3. Amino Acids
2.4.4. Bufadienolides
2.4.5. Coumarins and Flavonoids
2.5. Quantification of Major Metabolites via 1H-NMR
2.6. Cytotoxic Screening Activity
3. Materials and Methods
3.1. Plant Material
3.2. Secondary Metabolites Extraction and Preparation of NMR and MS Analysis Sample
3.3. SPME/GC-MS
3.4. UHPLC/MS
Multivariate Data Analysis of UPLC-MS & GC-MS Dataset
3.5. Identification of Major Metabolites via NMR Analysis
Quantification of Major Metabolites via 1H-NMR
3.6. Bioassays
3.6.1. Cell Culture
3.6.2. Cytotoxic Screening Assay
3.6.3. Statistical Analysis
4. Conclusions
Supplementary Materials
Author Contributions
Funding
Data Availability Statement
Acknowledgments
Conflicts of Interest
References
- Bozorgi, M.; Amin, G.; Shekarchi, M.; Rahimi, R. Traditional medical uses of Drimia species in terms of phytochemistry, pharmacology and toxicology. J. Tradit. Chin. Med. 2017, 37, 124–139. [Google Scholar] [CrossRef]
- El-Seedi, H.R.; Burman, R.; Mansour, A.; Turki, Z.; Boulos, L.; Gullbo, J.; Goransson, U. The traditional medical uses and cytotoxic activities of sixty-one Egyptian plants: Discovery of an active cardiac glycoside from Urginea maritima. J. Ethnopharmacol. 2013, 145, 746–757. [Google Scholar] [CrossRef] [PubMed]
- BayazıT, V.; Konar, V. Analgesic Effects of Scilliroside, Proscillaridin-A and Taxifolin from Squill Bulb (Urginea maritima) on Pains. Dig. J. Nanomater. Biostruct. (DJNB) 2010, 5, 457–465. [Google Scholar]
- Dizaye, K.; Hamed, B. Cardiovascular studies of white squill (Urginea maritima) extract. Zanco J. Med. Sci. 2010, 14, 20–27. [Google Scholar]
- Leblanc, F.J.; Lee, C.O. A study of the toxic principles of red squill. J. Am. Pharm. Assoc. 1939, 28, 151–154. [Google Scholar]
- Santos, C.V.d.; Kerkhoff, J.; Tomazelli, C.A.; Wenceslau, C.F.; Sinhorin, A.P.; de Jesus Rodrigues, D.; Carneiro, F.S.; Bomfim, G.F. Vasoconstrictor and hemodynamic effects of a methanolic extract from Rhinella marina toad poison. Toxicon 2022, 218, 57–65. [Google Scholar] [CrossRef]
- Wang, H.-Y.L.; O’Doherty, G.A. Modulators of Na/K-ATPase: A patent review. Expert Opin. Ther. Pat. 2012, 22, 587–605. [Google Scholar] [CrossRef]
- Aswal, S.; Kumar, A.; Semwal, R.B.; Chauhan, A.; Kumar, A.; Lehmann, J.; Semwal, D.K. Drimia indica: A plant used in traditional medicine and its potential for clinical uses. Medicina 2019, 55, 255. [Google Scholar] [CrossRef]
- Wu, C.-H.; Tao, W.; Yamaguchi, Y.; Yue, C.; Han, L.-F.; Zhang, Y. A new phenylpropanol glycoside and its five known analogues from Boschniakia rossica. Chin. Herb. Med. 2013, 5, 5–8. [Google Scholar]
- Metin, M.; Bürün, B. Effects of the high doses of Urginea maritima (L.) baker extract on chromosomes. Caryologia 2010, 63, 367–375. [Google Scholar] [CrossRef]
- Bozorgi, M.; Amin, G.; Kasebzade, S.; Shekarchi, M. Development and validation of a HPLC-UV method for determination of Proscillaridin A in Drimia maritima. Res. J. Pharmacogn. 2016, 3, 1–7. [Google Scholar]
- Singh, V.; Soni, L.K.; Dobhal, S.; Jain, S.K.; Parasher, P.; Dobhal, M.P. Phytochemicals and Pharmacological Properties of Urginea Species. Chem. Sci. Rev. Lett. 2016, 5, 79–95. [Google Scholar]
- Krenn, L.; Kopp, B.; Steurer, S.; Schubert-Zsilavecz, M. 9-Hydroxyscilliphaeoside, a new bufadienolide from Urginea maritima. J. Nat. Prod. 1996, 59, 612–613. [Google Scholar] [CrossRef]
- Rasheed, D.M.; Porzel, A.; Frolov, A.; El Seedi, H.R.; Wessjohann, L.A.; Farag, M.A. Comparative analysis of Hibiscus sabdariffa (roselle) hot and cold extracts in respect to their potential for α-glucosidase inhibition. Food Chem. 2018, 250, 236–244. [Google Scholar] [CrossRef] [PubMed]
- Worley, B.; Powers, R. PCA as a practical indicator of OPLS-DA model reliability. Curr. Metab. 2016, 4, 97–103. [Google Scholar] [CrossRef]
- Okada, T.; Mochamad Afendi, F.; Altaf-Ul-Amin, M.; Takahashi, H.; Nakamura, K.; Kanaya, S. Metabolomics of medicinal plants: The importance of multivariate analysis of analytical chemistry data. Curr. Comput.-Aided Drug Des. 2010, 6, 179–196. [Google Scholar] [CrossRef]
- Jha, S. Bufadienolides. In Phytochemicals in Plant Cell Cultures; Elsevier: Amsterdam, The Netherlands, 1988; pp. 179–191. [Google Scholar]
- Feng, W.; Hao, Z.; Li, M. Isolation and Structure Identification of Flavonoids. In Flavonoids, from Biosynthesis to Human Health; Justino, G.C., Ed.; Intech Open: Rijeka, Croatia, 2017; pp. 17–43. [Google Scholar]
- Barrueto, F.; Kirrane, B.M.; Cotter, B.W.; Hoffman, R.S.; Nelson, L.S. Cardioactive steroid poisoning: A comparison of plant-and animal-derived compounds. J. Med. Toxicol. 2006, 2, 152–155. [Google Scholar] [CrossRef]
- Iizuka, M.; Warashina, T.; Noro, T. Bufadienolides and a new lignan from the bulbs of Urginea maritima. Chem. Pharm. Bull. 2001, 49, 282–286. [Google Scholar] [CrossRef]
- Crouch, N.R.; du Toit, K.; Mulholland, D.A.; Drewes, S.E. Bufadienolides from bulbs of Urginea lydenburgensis (Hyacinthaceae: Urgineoideae). Phytochemistry 2006, 67, 2140–2145. [Google Scholar] [CrossRef]
- Shimada, K.; Umezawa, E.; Nambara, T.; Kupchan, S.M. Isolation and characterization of cardiotonic steroids from the bulb of Urginea altissima Baker. Chem. Pharm. Bull. 1979, 27, 3111–3114. [Google Scholar] [CrossRef]
- Kopp, B.; Krenn, L.; Draxler, M.; Hoyer, A.; Terkola, R.; Vallaster, P.; Robien, W. Bufadienolides from Urginea maritima from Egypt. Phytochemistry 1996, 42, 513–522. [Google Scholar] [CrossRef] [PubMed]
- Cao, Y.; Wu, J.; Pan, H.; Wang, L. Chemical Profile and Multicomponent Quantitative Analysis for the Quality Evaluation of Toad Venom from Different Origins. Molecules 2019, 24, 3595. [Google Scholar] [CrossRef] [PubMed]
- Mohamed, G.A.; Ibrahim, S.R.M.; Shaala, L.A.; Alshali, K.Z.; Youssef, D.T.A. Urgineaglyceride A: A new monoacylglycerol from the Egyptian Drimia maritima bulbs. Nat. Prod. Res. 2014, 28, 1583–1590. [Google Scholar] [CrossRef]
- Koorbanally, N.A.; Koorbanally, C.; Harilal, A.; Mulholland, D.A.; Crouch, N.R. Bufadienolides from Drimia robusta and Urginea epigea (Hyacinthaceae). Phytochemistry 2004, 65, 3069–3073. [Google Scholar] [CrossRef] [PubMed]
- Wei, W.; Yu, Y.; Wang, X.; Yang, L.; Zhang, H.; Ji, H.; Li, Z.; Hou, J.; Wu, W.; Guo, D. Simultaneous Determination of Bufalin and Its Nine Metabolites in Rat Plasma for Characterization of Metabolic Profiles and Pharmacokinetic Study by LC–MS/MS. Molecules 2019, 24, 1662. [Google Scholar] [CrossRef] [PubMed]
- Kakouri, E.; Kanakis, C.; Trigas, P.; Tarantilis, P.A. Characterization of the chemical composition of Drimia numidica plant parts using high-resolution mass spectrometry: Study of their total phenolic content and antioxidant activity. Anal. Bioanal. Chem. 2019, 411, 3135–3150. [Google Scholar] [CrossRef]
- Knittel, D.N.; Stintzing, F.C.; Kammerer, D.R. Metabolic fate of cardiac glycosides and flavonoids upon fermentation of aqueous sea squill (Drimia maritima L.) extracts. J. Pharm. Biomed. Anal. 2015, 110, 100–109. [Google Scholar] [CrossRef]
- Bose, C.; Chakrabarty, A. 4,5-Dihydro-14-[beta]-Hydroxy Scilladienolide-3-O-[beta]-D-Glucopyranoside (AC-3) from the Stems of Milletia ovalifolia. Asian J. Chem. 2002, 14, 671. [Google Scholar]
- Fang, S.; Tao, H.; Xia, K.; Guo, W. Proscillaridin A induces apoptosis and inhibits the metastasis of osteosarcoma in vitro and in vivo. Biochem. Biophys. Res. Commun. 2019, 521, 880–886. [Google Scholar] [CrossRef]
- Triana-Martínez, F.; Picallos-Rabina, P.; Da Silva-Álvarez, S.; Pietrocola, F.; Llanos, S.; Rodilla, V.; Soprano, E.; Pedrosa, P.; Ferreirós, A.; Barradas, M. Identification and characterization of Cardiac Glycosides as senolytic compounds. Nat. Commun. 2019, 10, 4731. [Google Scholar] [CrossRef]
- Da Costa, E.M.; Armaos, G.; McInnes, G.; Beaudry, A.; Moquin-Beaudry, G.; Bertrand-Lehouillier, V.; Caron, M.; Richer, C.; St-Onge, P.; Johnson, J.R. Heart failure drug proscillaridin A targets MYC overexpressing leukemia through global loss of lysine acetylation. J. Exp. Clin. Cancer Res. 2019, 38, 251. [Google Scholar] [CrossRef] [PubMed]
- Yuan, B.; Shimada, R.; Xu, K.; Han, L.; Si, N.; Zhao, H.; Bian, B.; Hayashi, H.; Okazaki, M.; Takagi, N. Multiple cytotoxic effects of gamabufotalin against human glioblastoma cell line U-87. Chem.-Biol. Interact. 2019, 314, 108849. [Google Scholar] [CrossRef] [PubMed]
- He, R.; Ma, H.; Zhou, J.; Zhu, Z.; Lv, X.; Li, Q.; Wang, H.; Yan, Y.; Luo, N.; Di, L. High Resolution Mass Profile of Bufadienolides and Peptides Combing with Anti-Tumor Cell Screening and Multivariate Analysis for the Quality Evaluation of Bufonis Venenum. Molecules 2019, 24, 1943. [Google Scholar] [CrossRef] [PubMed]
- Pohl, T.; Koorbanally, C.; Crouch, N.R.; Mulholland, D.A. Bufadienolides from Drimia robusta and Urginea altissima (Hyacinthaceae). Phytochemistry 2001, 58, 557–561. [Google Scholar] [CrossRef]
- Krenn, L.; Stapf, V.; Kopp, B. Bufadienolides from Drimia robusta BAK. Sci. Pharm. 2000, 68, 421–427. [Google Scholar] [CrossRef]
- Pinheiro, P.F.; Justino, G.C. Structural analysis of flavonoids and related compounds—A review of spectroscopic applications. In Phytochemicals—A Global Perspective of Their Role in Nutrition and Health; Rao, V., Ed.; IntechOpen: Rijeka, Croatia, 2012; pp. 33–56. [Google Scholar]
- Ye, M.; Yang, W.-Z.; Liu, K.-D.; Qiao, X.; Li, B.-J.; Cheng, J.; Feng, J.; Guo, D.-A.; Zhao, Y.-Y. Characterization of flavonoids in Millettia nitida var. hirsutissima by HPLC/DAD/ESI-MSn. J. Pharm. Anal. 2012, 2, 35–42. [Google Scholar]
- Ragab, E.A.; Raafat, M. A new monoterpene glucoside and complete assignments of dihydroflavonols of Pulicaria jaubertii: Potential cytotoxic and blood pressure lowering activity. Nat. Prod. Res. 2016, 30, 1280–1288. [Google Scholar] [CrossRef]
- Knittel, D.N.; Stintzing, F.C.; Kammerer, D.R. Simultaneous determination of bufadienolides and phenolic compounds in sea squill (Drimia maritima (L.) Stearn) by HPLC-DAD-MS n as a means to differentiate individual plant parts and developmental stages. Anal. Bioanal. Chem. 2014, 406, 6035–6050. [Google Scholar] [CrossRef]
- Fernandez, M.; Vega, F.A.; Arrupe, T.; Renedo, J. Flavonoids of squill, Urginea maritima. Phytochemistry 1972, 11, 1534. [Google Scholar] [CrossRef]
- Belhaddad, O.E.; Charef, N.; Amamra, S.; Zerargui, F.; Baghiani, A.; Khennouf, S.; Arrar, L. Chromatographic fractionation, antioxidant and antibacterial activities of Urginea maritima methanolic extract. Pak. J. Pharm. Sci. 2017, 30, 127–134. [Google Scholar]
- March, R.E.; Lewars, E.G.; Stadey, C.J.; Miao, X.-S.; Zhao, X.; Metcalfe, C.D. A comparison of flavonoid glycosides by electrospray tandem mass spectrometry. Int. J. Mass Spectrom. 2006, 248, 61–85. [Google Scholar] [CrossRef]
- Olennikov, D.N.; Gadimli, A.I.; Isaev, J.I.; Kashchenko, N.I.; Prokopyev, A.S.; Kataeva, T.N.; Chirikova, N.K.; Vennos, C. Caucasian Gentiana Species: Untargeted LC-MS Metabolic Profiling, Antioxidant and Digestive Enzyme Inhibiting Activity of Six Plants. Metabolites 2019, 9, 271. [Google Scholar] [CrossRef] [PubMed]
- Cui, W.; He, Z.; Zhang, Y.; Fan, Q.; Feng, N. Naringenin Cocrystals Prepared by Solution Crystallization Method for Improving Bioavailability and Anti-hyperlipidemia Effects. AAPS PharmSciTech 2019, 20, 115. [Google Scholar] [CrossRef]
- Shimokawa, Y.; Akao, Y.; Hirasawa, Y.; Awang, K.; Hadi, A.H.A.; Sato, S.; Aoyama, C.; Takeo, J.; Shiro, M.; Morita, H. Gneyulins A and B, stilbene trimers, and noidesols A and B, dihydroflavonol-C-glucosides, from the bark of Gnetum gnemonoides. J. Nat. Prod. 2010, 73, 763–767. [Google Scholar] [CrossRef]
- Abbas, S.; Bashir, S.; Khan, A.; Mehmood, M.H.; Gilani, A.H. Gastrointestinal stimulant effect of Urginea indica Kunth. and involvement of muscarinic receptors. J. Phytother. Res. 2012, 26, 704–708. [Google Scholar] [CrossRef]
- Bashir, S.; Abbas, S.; Gilani, A.H.; Khan, A. Studies on bronchodilator and cardiac stimulant activities of Urginea indica. J. Bangladesh J. Pharmacol. 2013, 8, 249–254. [Google Scholar] [CrossRef]
- Kumar, N.; Goel, N. Phenolic acids: Natural versatile molecules with promising therapeutic applications. Biotechnol. Rep. 2019, 24, e00370. [Google Scholar] [CrossRef]
- Méndez-Líter, J.A.; Tundidor, I.; Nieto-Domínguez, M.; de Toro, B.F.; Santana, A.G.; de Eugenio, L.I.; Prieto, A.; Asensio, J.L.; Sánchez, C.; Martínez, M.J. Transglycosylation products generated by Talaromyces amestolkiae GH3 β-glucosidases: Effect of hydroxytyrosol, vanillin and its glucosides on breast cancer cells. Microb. Cell Factories 2019, 18, 97. [Google Scholar] [CrossRef]
- Seong, Y.-A.; Hwang, D.; Kim, G.-D. The anti-inflammatory effect of Gnaphalium affine through inhibition of NF-κB and MAPK in lipopolysaccharide-stimulated RAW264.7 cells and analysis of its phytochemical components. Cell Biochem. Biophys. 2016, 74, 407–417. [Google Scholar] [CrossRef]
- Jaakola, L.; Määttä, K.; Pirttilä, A.M.; Törrönen, R.; Kärenlampi, S.; Hohtola, A. Expression of genes involved in anthocyanin biosynthesis in relation to anthocyanin, proanthocyanidin, and flavonol levels during bilberry fruit development. Plant Physiol. 2002, 130, 729–739. [Google Scholar] [CrossRef]
- Emwas, A.-H.; Roy, R.; McKay, R.T.; Tenori, L.; Saccenti, E.; Gowda, G.N.; Raftery, D.; Alahmari, F.; Jaremko, L.; Jaremko, M. NMR spectroscopy for metabolomics research. Metabolites 2019, 9, 123. [Google Scholar] [CrossRef]
- Kim, H.K.; Choi, Y.H.; Verpoorte, R. NMR-based metabolomic analysis of plants. Nat. Protoc. 2010, 5, 536–549. [Google Scholar] [CrossRef] [PubMed]
- Lin, C.Y.; Wu, H.; Tjeerdema, R.S.; Viant, M.R. Evaluation of metabolite extraction strategies from tissue samples using NMR metabolomics. Metabolomics 2007, 3, 55–67. [Google Scholar] [CrossRef]
- Khattab, A.R.; Rasheed, D.M.; El-Haddad, A.E.; Porzel, A.; Wessjohann, L.A.; Farag, M.A. Assessing phytoequivalency of four Zingiberaceae spices (galangals, turmeric and ginger) using a biochemometric approach: A case study. Ind. Crops Prod. 2022, 188, 115722. [Google Scholar] [CrossRef]
- Saket, K.; Afshari, J.T.; Saburi, E.; Yousefi, M.; Salari, R. Therapeutic aspects of Squill; an evidence-based review. Curr. Drug Discov. Technol. 2020, 17, 318–324. [Google Scholar] [CrossRef]
- Cunha-Filho, G.A.; Resck, I.S.; Cavalcanti, B.C.; Pessoa, C.Ó.; Moraes, M.O.; Ferreira, J.R.O.; Rodrigues, F.A.R.; dos Santos, M.L. Cytotoxic profile of natural and some modified bufadienolides from toad Rhinella schneideri parotoid gland secretion. Toxicon 2010, 56, 339–348. [Google Scholar] [CrossRef]
- Tempone, A.G.; Pimenta, D.C.; Lebrun, I.; Sartorelli, P.; Taniwaki, N.N.; de Andrade Jr, H.F.; Antoniazzi, M.M.; Jared, C. Antileishmanial and antitrypanosomal activity of bufadienolides isolated from the toad Rhinella jimi parotoid macrogland secretion. Toxicon 2008, 52, 13–21. [Google Scholar] [CrossRef]
- Mahringer, A.; Karamustafa, S.; Klotz, D.; Kahl, S.; Konkimalla, V.B.; Wang, Y.; Wang, J.; Liu, H.-Y.; Boechzelt, H.; Hao, X. Inhibition of P-glycoprotein at the blood–brain barrier by phytochemicals derived from traditional Chinese medicine. Cancer Genom. -Proteom. 2010, 7, 191–205. [Google Scholar]
- Li, R.-Z.; Fan, X.-X.; Duan, F.-G.; Jiang, Z.-B.; Pan, H.-D.; Luo, L.-X.; Zhou, Y.-L.; Li, Y.; Yao, Y.-J.; Yao, X.-J. Proscillaridin A induces apoptosis and suppresses non-small-cell lung cancer tumor growth via calcium-induced DR4 upregulation. Cell Death Dis. 2018, 9, 696. [Google Scholar] [CrossRef]
- Manganyi, M.C.; Tlatsana, G.S.; Mokoroane, G.T.; Senna, K.P.; Mohaswa, J.F.; Ntsayagae, K.; Fri, J.; Ateba, C.N. Bulbous Plants Drimia: “A Thin Line between Poisonous and Healing Compounds” with Biological Activities. Pharmaceutics 2021, 13, 1385. [Google Scholar] [CrossRef]
- Farag, M.A.; Gad, H.A.; Heiss, A.G.; Wessjohann, L.A. Metabolomics driven analysis of six Nigella species seeds via UPLC-qTOE-MS and GC-MS coupled to chemometrics. Food Chem. 2014, 151, 333–342. [Google Scholar] [CrossRef] [PubMed]
- Farag, M.A.; El-Kersh, D.M.; Ehrlich, A.; Choucry, M.A.; El-Seedi, H.; Frolov, A.; Wessjohann, L.A. Variation in Ceratonia siliqua pod metabolome in context of its different geographical origin, ripening stage and roasting process. Food Chem. 2019, 283, 675–687. [Google Scholar] [CrossRef] [PubMed]
- Fabre, N.; Rustan, I.; de Hoffmann, E.; Quetin-Leclercq, J. Determination of flavone, flavonol, and flavanone aglycones by negative ion liquid chromatography electrospray ion trap mass spectrometry. J. Am. Soc. Mass Spectrom. 2001, 12, 707–715. [Google Scholar] [CrossRef] [PubMed]
- Maghraby, Y.R. Nanoencapsulation of Jania rubens’ Phytochemicals: Antioxidant Properties for Food Applications. Ph.D. Thesis, American University in Cairo, New Cairo, Egypt, 2021. [Google Scholar]
- Smith, C.A.; Want, E.J.; O’Maille, G.; Abagyan, R.; Siuzdak, G. XCMS: Processing mass spectrometry data for metabolite profiling using nonlinear peak alignment, matching, and identification. Anal. Chem. 2006, 78, 779–787. [Google Scholar] [CrossRef]
- Farag, M.A.; Khaled, S.E.; El Gingeehy, Z.; Shamma, S.N.; Zayed, A. Comparative Metabolite Profiling and Fingerprinting of Medicinal Cinnamon Bark and Its Commercial Preparations via a Multiplex Approach of GC–MS, UV, and NMR Techniques. Metabolites 2022, 12, 614. [Google Scholar] [CrossRef]


| Peak # | Rt (min) | KI | Name | Abundance % | Cas-No | |
|---|---|---|---|---|---|---|
| WS | RS | |||||
| Monoterpene hydrocarbon | ||||||
| G1 | 7.13 | 909.1 | α-Pinene | 2.09 | 8.04 | 7785-26-4 |
| G2 | 8.12 | 965.6 | β-Myrcene | 6.74 | 8.73 | 123-35-3 |
| G4 | 8.46 | 985.3 | 3-Carene | 2.32 | 7.81 | 13466-78-9 |
| G5 | 8.47 | 985.6 | 2-Thujene | 2.32 | 7.29 | 28634-89-1 |
| G6 | 8.75 | 1002.4 | p-Cymene | 1.96 | _ | 99-87-6 |
| G7 | 8.81 | 1005.9 | Limonene | 4.89 | 7.81 | 5989-27-5 |
| G8 | 9.27 | 1035.2 | α-Phellandrene | 1.72 | _ | 99-83-2 |
| G9 | 9.70 | 1063 | Isoterpinolene | 1.91 | 8.15 | 586-63-0 |
| G10 | 9.71 | 1063.3 | 4-Carene | 1.74 | _ | 29050-33-7 |
| Total monoterpene hydrocarbon | 25.69 | 47.82 | ||||
| Oxygenated monoterpene | ||||||
| G15 | 11.47 | 1182.9 | Estragole | 2.29 | _ | 140-67-0 |
| Total oxygenated monoterpene | 2.29 | |||||
| Sesquiterpene hydrocarbon | ||||||
| G21 | 15.12 | 1471.1 | β-Bisabolene | 8.22 | _ | 495-61-4 |
| Total sesquiterpene hydrocarbon | 8.22 | |||||
| Oxygenated hydrocarbon | ||||||
| G12 | 10.03 | 1084.1 | Nonanal | 2.64 | _ | 124-19-6 |
| G14 | 11.44 | 1181.4 | Decanal | 2.49 | _ | 112-31-2 |
| G26 | 21.50 | 1841.9 | Palmitic acid, methyl ester | 7.02 | _ | 112-39-0 |
| Total oxygenated hydrocarbon | 12.15 | |||||
| Aromatic | ||||||
| G19 | 14.79 | 1444.4 | 2-Methyl-4-hydroxyacetophenone | 1.75 | _ | 875-59-2 |
| Total aromatic | 1.75 | |||||
| Heterocyclic | ||||||
| G3 | 8.17 | 968.8 | Furan-2-pentyl- | 4.57 | _ | 3777-69-3 |
| Total heterocyclic | 4.57 | |||||
| Hydrocarbon | ||||||
| G11 | 9.81 | 1069.5 | Decane | 2.64 | 6.31 | 124-18-5 |
| G13 | 11.22 | 1166 | Tridecane | 4.92 | 6.03 | 629-50-5 |
| G16 | 12.16 | 1235.5 | 4,7-Dimethylundecane | 2.84 | 5.97 | 17301-32-5 |
| G20 | 14.87 | 1451 | Pentadecane | 5.97 | 6.43 | 544-76-3 |
| G24 | 17.72 | 1644 | Hexadecane | _ | 7.29 | 544-76-3 |
| G25 | 19.83 | 1754.6 | Heptadecane | 3.39 | 5.22 | 629-50-5 |
| Total hydrocarbon | 19.76 | 37.26 | ||||
| Unknown | ||||||
| G17 | 12.52 | 1261.8 | Unknown | 4.78 | 6.66 | _ |
| G18 | 13.73 | 1357.6 | Unknown | 18.11 | _ | _ |
| G22 | 15.23 | 1480.8 | Unknown | 1.86 | _ | 624-24-8 |
| G23 | 16.13 | 1546 | Unknown | _ | 8.27 | _ |
| Total unknown | 24.955 | 14.93 | ||||
| Total volatiles | 100.0 | 100.0 | ||||
| Code | tR (m.) | UV | Elemental Composition | Error ppm | Exact Mass (M+H)+/ (M−H)− | Identified Fragments (MS2) | Identified Metabolite | Class | WS | RS |
|---|---|---|---|---|---|---|---|---|---|---|
| L1 | 0.4 | 280–300 | (C21H17O6)⁺ | 8 | 365.1049 | 203, 185 | Unknown glycoside | Unknown | + | − |
| L2 | 0.4 | 280–300 | (C27H27O11)+ | 3.7 | 527.1567 | 365, 347, 203, 185 | Unknown Glycoside (dihexose) | Unknown | + | − |
| L3 | 0.4 | 280–300 | (C21H31O12)+ | 6.5 | 475.1779 | 133, 116 | Hydroxycinnamyl-O-dihexoside | Phenolic | + | + |
| L4 | 0.4 | 280–300 | (C12H21O10)+ | 2.9 | 325.112 | 145, 127 | Disacharide (cellobiosan) | Sugar | + | + |
| L5 | 0.5 | 280–300 | (C33H37O16)+ | 5 | 689.2041 | 527, 365, 347, 203, 185 | Unknown glycoside (dihexoside) | Unknown | + | − |
| L6 | 0.6 | 280 | (C18H31O15)+ | 2.2 | 487.1668 | 325, 271, 163, 145, 127 | Agarotriose | Sugar | + | + |
| L7 | 0.6 | 280 | (C24H41O20)+ | 4.4 | 649.2157 | 325, 289, 271, 253, 223,163, 145, 127 | Polysaccharide (agarotriose dimer) | Sugar | − | + |
| L8 | 0.7 | 280 | (C9H12NO3)+ | 3.1 | 182.0806 | 165, 147, 136, 123 | Tyrosine | Amino acid | + | + |
| L9 | 1.2 | 280 | (C9H12NO2)+ | 6.2 | 166.0852 | 120, 103 | Phenylalanine | Amino acid | + | + |
| L10 | 1.6 | 280 | (C11H16NO2)+ | 2.6 | 194.1171 | 148 | Amino acid derivative | Amino acid | − | + |
| N1 | 1.7 | 280 | (C14H19O8)− | 3.4 | 315.1075 | 153 | Isorahmantin | Flavonol | − | + |
| L11 | 2.3 | 280 | (C11H10NO2)+ | 4.6 | 188.0697 | 170, 146 | Tryptophan derivative | Amino acid | − | + |
| L12 | 2.5 | 280 | (C11H13N2O2)⁺ | 6.1 | 205.0959 | 188, 170, 146, 118 | Tryptophan | Amino acid | + | + |
| L13 | 2.8 | 282 | (C15H15O7)+ | −1.8 | 307.0818 | 289, 271, 261, 243, 188, 151, 139 | Leucocyanidin | − | + | |
| N2 | 2.9 | 280 | (C20H19O10)− | 0.7 | 419.0988 | 165 | Juglanin | Flavonoid | − | + |
| N3 | 3.1 | 282–340 | (C21H23O11)− | 1.9 | 451.1246 | 289, 271, 243, 227, 199, 177, 151 | Catechin-O-hexoside | Flavanol | − | + |
| L14 | 3.3 | 283–340 | (C15H15O6)+ | 1.6 | 291.0859 | 273, 245, 151, 139 | Catechin | Flavanol | − | + |
| N4 | 3.3 | 283–340 | (C21H23O11)− | 1.9 | 451.1246 | 271, 243, 227, 199, 177, 151 | Catechin-O-hexoside isomer | Flavanol | − | + |
| L15 | 3.5 | 283–340 | (C15H11O6)+ | 1.1 | 287.0547 | 259, 231, 149 | Kaempferol | Flavone | − | + |
| N5 | 3.6 | 282–296–340 | (C20H27O14)− | 0 | 491.1406 | 209, 191, 167, 123 | Vanillic acid-O-dihexoside | Phenolic acid | − | + |
| L16 | 3.7 | 282–296–340 | (C27H33O16)+ | 5.1 | 613.1746 | 271, 243, 215 | Dihydrokaempeferol-O-dihexoside | Flavanol | − | + |
| N6 | 3.8 | 282–296–340 | (C27H31O16)− | 1.6 | 611.1608 | 287, 269, 259, 243, 215 | Dihydrokaempeferol-O-dihexoside (aromadendrin-O-dihexoside) | Flavanol | − | + |
| N7 | 3.9 | 282–296–340 | (C33H41O21)− | 0.4 | 773.2142 | 287, 269, 259, 243, 215 | Dihydrokaempeferol-O-trihexoside (aromadendrin-O-trihexoside) | Flavanol | − | + |
| L17 | 4.2 | 291–330 | (C15H13O6)+ | −0.9 | 289.0709 | 271, 253, 243, 215, 149 | Dihydrokaempferol | Flavanol | − | + |
| N8 | 4.2 | 291–330 | (C36H33O18)− | 0.3 | 753.167 | 465, 437, 315, 303, 285, 259, 245, 219 | Dihydroquercitin-O-hexosidederivative (taxifolin-O-hexoside derivative) | Flavanol | − | + |
| L18 | 4.3 | 291–330 | (C21H23O11)+ | 2.2 | 451.1245 | 289, 271, 247 | Dihydrokaempferol-O-hexoside | Flavanol | − | + |
| L19 | 4.3 | 291–330 | (C38H45O25)+ | 1.8 | 901.2228 | 451, 289, 271, 243 | Dihydrokaempferol-O-hexoside dimer | Flavanol | − | + |
| L20 | 4.3 | 291–330 | (C15H11O5)+ | −0.2 | 271.0601 | 243, 215, 149 | Apigenin | Flavone | − | + |
| L21 | 4.3 | 291–330 | (C14H11O4)+ | 2.2 | 243.0646 | 215, 149 | Unknown | Unknown | − | + |
| N9 | 4.3 | 291–330 | (C42H43O22)− | −5.8 | 899.2304 | 449, 342, 287, 259 | Dihydrokaempeferol-O-hexoside dimer | Flavanol | − | + |
| N10 | 4.4 | 291–330 | (C21H21O11)− | 6.3 | 449.1122 | 287, 269, 259, 243, 225, 151 | Dihydro kaempeferol-O-hexoside (aromadendrin-O-hexoside | Flavanol | − | + |
| L22 | 4.6 | 283–296–340 | (C15H13O7)+ | 1.8 | 305.065 | 287, 259, 231, 153 | Dihydroquercitin | Flavanol | − | + |
| N11 | 4.6 | 283–296–340 | (C37H45O26)− | 2.1 | 905.2205 | 450, 285, 261, 243, 191 | Kampferol derivative | Flavonol | - | + |
| L23 | 4.7 | 283–296–340 | (C15H11O8)+ | 0 | 319.0812 | 301, 273, 269, 245 | Myricetin | Flavonol | − | + |
| L24 | 4.7 | 283–296–340 | (C16H15O7)+ | −0.3 | 319.0813 | 313, 307, 286, 273, 245, 217, 185, 149, 137 | Dihydroisorhmentin or Methyltaxifolin | Flavonoid | − | + |
| N12 | 4.6 | 283–296–340 | (C22H23O12)− | 2.9 | 479.1181 | 317, 306, 299, 289 | Noidesol A/B | Flavonoid | − | + |
| L25 | 4.8 | 283–296-340 | (C20H29O13)+ | 1 | 477.1598 | 169, 151 | Vanillin rhamnoglucoside | Phenolic acid | − | + |
| 4.9 | 283–296-340 | (C20H27O13)− | 0.6 | 475.1457 | 209, 167, 123 | Vanillin rhamnoglucoside | Phenolic acid | − | + | |
| L26 | 4.8 | 283–296-340 | (C8H9O4)+ | 2.8 | 169.049 | 151, 127, 109 | Vanillic acid | Phenolic acid | − | + |
| N13 | 4.8 | 283–296-340 | (C15H11O6)− | 0.9 | 287.0559 | 201, 125 | Dihydrokaempeferol | Dihydroflavonol | − | + |
| L27 | 4.9 | 283–296-340 | (C14H19O9)+ | 4.8 | 331.1008 | 169 | Vanillic acid-O-hexoside | Phenolic acid | − | + |
| N14 | 4.9 | 283–296-340 | (C21H29O12)− | 1.9 | 473.1651 | 209, 191, 167, 123 | Dimethoxy hydrocinnamic acid (dimethoxyphenyl propionic acid)-dipentoside | Phenolic acid | − | + |
| L28 | 5.1 | 282 | (C21H23O10)+ | 3.2 | 435.1272 | 271, 255, 151, 119 | (Apigenin-O-hexoside) | Flavanone | − | + |
| L29 | 5.1 | 282 | (C9H7O3)+ | 2.7 | 163.0385 | 135, 119, 107 | Hydroxycoumarin | Coumarin | − | + |
| L30 | 5.1 | 282 | (C42H37O15)+ | 1.3 | 781.2117 | 409, 317, 287, 247, 169 | Unknown glycoside of L31 | Unknown | − | + |
| N15 | 5.1 | 280 | (C9H5O3)− | 3.7 | 161.0244 | 133, 117, 105 | Hydroxycoumarin | Coumarin | − | + |
| N16 | 5.4 | 283–340 | (C21H21O12)− | 0.7 | 465.1035 | 285, 275, 259, 231, 217, 152, 125 | Kaempferol-O-hexoside | Flavonol | − | + |
| L31 | 5.5 | 283–340 | (C36H27O10)+ | 3.6 | 619.1621 | 329, 317, 287, 271, 247, 229, 181, 169 | Unknown aglycone of L30 | Unknown | − | + |
| N17 | 5.5 | 283–340 | (C42H43O24)− | 4.4 | 931.2208 | 465, 303, 285, 275, 259, 231, 217, 152, 125 | Dihydroquercitin-O-hexoside (dimer) | Flavanol | − | + |
| N18 | 5.6 | 283–340 | (C27H31O17)− | 0.2 | 627.1544 | 303,285, 217, 189, 151, 125 | Dihydroquercitin-O- dihexoside | Flavanol | − | + |
| N19 | 5.6 | 283–340 | (C29H29O15)− | 0.1 | 617.1497 | 314, 285, 221, 209, 167, 125 | Kampferol derivative | Flavanol | − | + |
| L32 | 5.7 | 283–340 | (C27H31O17)+ | 6.3 | 627.1517 | 303 | Quercitin-O-dihexoside | Flavonol | − | + |
| N20 | 5.7 | 283–340 | (C27H29O17)− | 0.2 | 625.1411 | 463, 301, 125 | Quercitin-O-dihexoside | Flavonol | − | + |
| L33 | 5.9 | 283–340 | (C27H31O15)+ | 6.7 | 595.1617 | 415, 397, 379, 361, 271 | Apigenin-O-dihexoside | Flavanone | − | + |
| L34 | 6 | 299 | (C24H27O4)+ | 0.5 | 379.1902 | 351, 333, 315, 239 | Monohydroxy-19-oxobufa-4,20,22-trienolide | Bufadienolide | + | − |
| L35 | 6.1 | 299 | (C24H29O5)+ | 0.3 | 397.2 | 381, 363, 345, 317 | 3-Dehydroscilliglaucosidin (scilliglaucosidine) | Bufadienolide | + | − |
| L36 | 6.2 | 299 | (C30H41O11)+ | 1.1 | 577.2637 | 417, 399, 381, 363, 345, 335 | Desacetylscillirosidin-O-thevetoside | Bufadienolide | + | + |
| N21 | 6.2 | 280–298-340 | (C15H11O7)− | 2.6 | 303.0502 | 294, 207, 181, 154, 99, 51 | Dihydroquercitin | Flavanol | − | + |
| N22 | 6.3 | 280–298-340 | (C27H31O15)− | 2.3 | 595.1654 | 271, 151, 125 | Naringenin-O-dihexoside | Flavanoid | − | + |
| N23 | 6.3 | 280–298-340 | (C21H19O12)− | 1.7 | 463.08 | 301, 300, 271, 151 | Quercitin-O-hexoside | Flavonol | − | + |
| L37 | 6.5 | 299 | (C24H31O6)+ | 2 | 415.2107 | 397, 379, 351, 333 | Trihydroxy-oxobufa-trienolide (hydroxy-scilliglaucosidin) | Bufadienolide | + | − |
| L38 | 6.6 | 298 | (C30H45O10)+ | 0.1 | 565.3008 | 403, 385, 367, 331, 272 | Gammabufotalin-O-glucoside | Bufadienolide | + | − |
| L39 | 6.6 | 298 | (C24H35O5)+ | 3 | 403.247 | 385,367, 253 | Gamabufotalin | Bufadienolide | + | + |
| L40 | 6.6 | 280–298–340 | (C15H11O7)+ | 0.8 | 303.05 | 191 | Quercitin | Flavonol | − | + |
| L41 | 6.6 | 280–298–340 | (C21H21O12)+ | 2.8 | 465.1015 | 308, 303 | Quercitin-O-hexoside | Flavonol | − | + |
| L42 | 6.8 | 298 | (C30H43O10)+ | 1.2 | 563.2844 | 545, 365, 347, 337, 323, 267, 252, 213 | Scillirubroside | Bufadienolide | + | − |
| L43 | 6.9 | 298 | (C24H31O4)⁺ | 2.8 | 383.2228 | 365, 348, 251 | Scillirubrosidin-H2O(scillirubroside-hexoside-H2O) | Bufadienolide | + | + |
| L44 | 7 | 298 | (C24H29O6)⁺ | 1.2 | 413.1954 | 395, 69, 351, 333 | Trihydroxy-oxobufa-tetra-enolide | Bufadienolide | + | − |
| L45 | 7 | 298 | (C43H45O11)+ | 2.2 | 737.294 | 413, 395, 377, 359, 331 | Trihydroxy-oxobufa-tetra-enolide-O-di-hexoside | Bufadienolide | + | − |
| L46 | 7.2 | 299 | (C30H41O11)+ | 3.8 | 577.2621 | 415, 397, 379, 351, 333 | Hydroxyscilliglaucoside | Bufadienolide | + | + |
| N24 | 7.7 | 280–298–340 | (C21H19O11)− | 3.7 | 447.0916 | 285, 255, 227 | Kaempferol-O-glucoside (hexoside) | Flavonol | − | + |
| L47 | 7.8 | 299 | (C36H51O15)+ | 8.1 | 723.3164 | 561, 415, 397, 379, 361 | Trihydroxy-oxobufa-trienolide-O-rhamnosdie-glucoside/Scilliglaucosidin-O-rhamnoside-glucoside | Bufadienolide | + | − |
| L48 | 7.9 | 299 | (C24H33O6)+ | 1.8 | 417.2279 | 399, 381, 363, 345, 335, 145 | Desacetylscillirosidin/Hydroxyscilliphaeosidin/Bufotalidin | Bufadienolide | + | − |
| L49 | 7.9 | 299 | (C24H33O6)+ | 1.8 | 417.2279 | 399, 381, 363, 335, | Desacetylscillirosidin/Hydroxyscilliphaeosidin/Bufotalidin isomer | Bufadienolide | + | − |
| L50 | 8 | 299 | (C30H41O10)⁺ | 1.1 | 561.269 | 415, 379, 361, 351 | Trihydroxy-oxobufa-trienolide-O-rhamoside/Hydroxy-scilliglaucosidin-O-rhamnoside | Bufadienolide | + | + |
| N25 | 8.1 | 280–298–340 | (C22H21O12)− | 1.9 | 477.103 | 315, 314, 299, 285, 271, 243 | Isorhamnetin 3-hexoside | Flavonol | − | + |
| L51 | 8.3 | 299 | (C30H43O10)⁺ | 2.1 | 563.2839 | 417, 399, 381, 363, 345, 315, 278 | Desacetylscillirosidin-O-rhamnoside/Hydroxyscilliphaeosidin-O-rhamnoside | Bufadienolide | + | − |
| L52 | 8.3 | 299 | (C30H43O10)⁺ | 2.1 | 563.2839 | 417, 399, 381, 363, 333 | Bufotalidin-O-rhamnoside | Bufadienolide | + | − |
| L53 | 8.5 | 299 | (C24H31O5)+ | 0.9 | 399.2169 | 381, 363, 345, 223.,157 | Scilliglaucosidin | Bufadienolide | + | + |
| L54 | 8.7 | 298 | (C26H37O8)+ | 0.1 | 477.248 | 417, 399, 381, 363, 345 | Hydroxy-scillirosidin+2H | Bufadienolide | + | − |
| L55 | 8.8 | 298 | (C30H45O9)+ | 0.8 | 549.3053 | 403, 385, 367, 349, 193, 179 | Gamabufotalin-O-rhamnoside | Bufadienolide | + | − |
| L56 | 8.9 | 298 | (C24H33O5)+ | 1.9 | 401.2315 | 383, 347, 197 | Scillirubrosidin or scilliphosidin | Bufadienolide | + | + |
| L57 | 8.9 | 298 | (C30H43O9)+ | 2.9 | 547.2886 | 401,383, 347 | Scilliphaeoside “Scillipheosidin-O-rhamnoside” | Bufadienolide | + | + |
| L58 | 8.9 | 299 | (C36H53O14)+ | 2.6 | 709.3411 | 547, 417, 367, 349, 287 | Scillipheoside-O-glucoside | Bufadienolide | + | + |
| L59 | 8.9 | 285 | (C34H27O12)+ | 0.1 | 627.1498 | 401, 383, 365, 303, 269, 193 | Scillirubrosidin-O-hexoside or scilliphosidin-o-hexoside | Bufadienolide | − | + |
| N26 | 8.9 | 299 | (C36H67O26)− | 1.5 | 915.3912 | 869, 707, 545, 399, 355, 221, 161, 113 | Unknown | Unknown | − | + |
| L60 | 9.3 | 283 | (C36H55O14)+ | 4.6 | 711.3554 | 549, 531, 403, 367, 349, 253, 199 | Gamabufotalin-rhamnoglucoside | Bufadienolide | − | + |
| L61 | 9.6 | 298 | (C24H27O3)⁺ | 2.5 | 363.1946 | 345, 335, 317, 273 | Unknown | Unknown | + | − |
| L62 | 10 | 299 | (C30H41O10)⁺ | 1.1 | 561.269 | 399, 381, 363, 345, 223, 157 | Scilliglaucoside | Bufadienolide | + | + |
| L63 | 10 | 399 | (C33H49O12)+ | 2.7 | 637.3201 | 477, 417, 399, 381, 363, 345 | Hydroxyscilliroside | Bufadienolide | + | − |
| L64 | 10 | 299 | (C24H31O3)+ | 4.1 | 367.2253 | 349, 287, 175, 133 | Scillaridin A | Bufadienolide | + | + |
| L65 | 11 | 298 | (C39H59O17)+ | 7.2 | 799.3651 | 477, 399, 381, 363, 345 | Hydroxyscilliphaeosidin-O-thevetoside-glucoside-Ac | Bufadienolide | + | − |
| L66 | 11 | 282 | (C36H45O19)+ | 4.5 | 781.2514 | 325, 241, 163, 145, 115 | Unknown | Unknown | − | + |
| L67 | 12 | 298 | (C33H55O8)+ | 3.1 | 579.387 | 417, 237, 255 | Bufotalidin-O-hexoside | Bufadienolide | + | + |
| L68 | 12 | 298 | (C30H41O9)⁺ | 4.6 | 545.272 | 399, 381, 363, 353, 345, 335, 317 | Scilliglaucosidin-O-rhmnoside | Bufadienolide | + | − |
| L69 | 12 | 299 | (C36H51O14)+ | 8.4 | 707.3214 | 545,399, 381, 363, 335, 317, 275, 223 | Scilliglaucosidin-O-rhmnoside-O-hexoside | Bufadienolide | + | − |
| L70 | 12 | 299 | (C24H33O4)+ | 0 | 385.2373 | 367, 349, 289, 253 | Scillarenin | Bufadienolide | + | + |
| L71 | 12 | 283 | (C24H29O3)+ | −1.9 | 365.2118 | 349, 287, 175, 147 | Unknown aglycone of L42 | Bufadienolide | − | + |
| L72 | 12 | 296 | (C26H35O6)+ | 2.9 | 443.2415 | 425, 383, 365, 347, 319, 269, 239, 225, 197 | Cinobufagin or acetylmarinobufogenin | Bufadienolide | − | + |
| L73 | 12 | 296 | (C45H51O10)+ | 0.6 | 751.3472 | 589, 443, 425, 365, 347, 285, 225, 173 | Cinobufagin or acetylmarinobufogenin-O-rhamnoside-glucoside | Bufadienolide | − | + |
| L74 | 12 | 299 | (C17H29O7)+ | 0.4 | 345.1906 | 281, 263, 253, 193 | Unknown | Unknown | + | − |
| L75 | 12 | 283 | (C19H38NO5)+ | 3.8 | 360.2731 | 342, 324, 306, 278, 260, 240, 222 | 3-Hydroxydodecanoylcarnitine | Acylcarnitine | − | + |
| L76 | 12 | 298 | (C33H49O11)+ | 3.2 | 621.3249 | 461, 401, 383, 365, 319, 251, 213 | Scilliroside | Bufadienolide | + | − |
| L77 | 12 | 296 | (C32H45O11)+ | 5.8 | 605.2921 | 591, 572, 537, 529, 462, 443, 417, 337, 256, 237, 207, 165, 145, 135, 108 | Cinobufagin-O-hexoside or acetylmarinobufogenin-O-hexoside | Bufadienolide | − | + |
| L78 | 12 | 298 | (C24H35O6)+ | 4.5 | 419.2409 | 401, 383, 365, 347, 213 | Hellebrigenol (19-hydroxytelocinobufagin) | Bufadienolide | + | − |
| L79 | 12 | 298 | (C38H57O16)+ | 5.3 | 769.36 | 607, 461, 401 383, 365, 347, 305 | Scillirosidin-rhamnoside-glucoside+2H | Bufadienolide | + | − |
| L80 | 12 | 299 | (C39H65O13)⁺ | 12.8 | 741.4325 | 579, 461, 419, 401, 383, 365 | Hellebrigenin-3-O-D-diglucopyranoside. | Bufadienolide | + | + |
| L81 | 12 | 300 | (C38H59O19)+ | -1.4 | 819.3692 | 367, 349, 273, 255, 237 | Unknown | Unknown | − | + |
| L82 | 12 | 299 | (C24H35O4)+ | 7.6 | 387.25 | 385, 367, 349, 331, 199 | Bufalin | Bufadienolide | − | + |
| L83 | 12 | 300 | (C30H45O8)+ | 1.4 | 533.3102 | 515, 387, 367, 349, 274, 255, 199 | Dihydro-Proscillaridin (rhamnosylbufalin) | Bufadienolide | − | + |
| L84 | 12 | 298 | (C39H59O16)⁺ | 5.3 | 783.3697 | 621, 543, 461, 401, 383, 365, 347,251 | Scilliroside-O-glucoside | Bufadienolide | + | − |
| L85 | 12 | 299 | (C38H61O20)+ | 1.3 | 837.3761 | 515, 387, 349, 255, 237 | Bufalin derivative | Bufadienolide | − | + |
| L86 | 12 | 299 | (C36H53O13)+ | 4 | 693.3394 | 531, 385, 367, 349, 287 | Proscillaridin A-O-glucoside | Bufadienolide | + | + |
| L87 | 12 | 299 | 7 | 362.2876 | 344, 308, 224 | Unknown fat | Fat | − | + | |
| L88 | 12 | 299 | (C26H37O7)+ | 3.3 | 461.2549 | 401, 383, 365, 337, 329, 305, 285 | Dihydroscillirosidin | Bufadienolide | + | − |
| L89 | 12 | 298 | (C38H55O14)+ | 10.7 | 735.351 | 573, 461, 385, 367, 349, 331, 287 | Scillaren A acetate-O-rhamnoside-hexoside | Bufadienolide | + | − |
| L90 | 12 | 299 | (C32H47O11)⁺ | 3.4 | 607.3092 | 547, 401, 383, 365, 347 | Acetyl-scilliphaeoside-rhamnoside | Bufadienolide | + | − |
| L91 | 13 | 298 | (C30H43O8)+ | 1.7 | 531.2943 | 513, 385, 367, 349, 321, 303, 253, 215 | Proscillaridin A | Bufadienolide | + | + |
| L92 | 13 | 298 | C44H65O19 | 13.7 | 897.3992 | 735, 573, 385, 367, 349, 331, 287 | Scillaren A acetate-O-rhamnoside-dihexoside | Bufadienolide | + | − |
| L93 | 13 | 282 | (C16H13O5)+ | 4.9 | 285.0744 | 191 | Acacetin or prunetin | Flavonoid | − | + |
| L94 | 13 | 282 | (C17H17O6)+ | 2.8 | 317.1011 | 299, 271, 121 | Dihydroxy-dimethoxyflavanone | Flavonoid | − | + |
| L95 | 13 | 286 | (C20H42NO6)+ | 2.3 | 392.2997 | 356, 338, 278, 261, 232 | N-tetradecyl-D-gluconamide | Amide | − | + |
| L96 | 13 | 280 | (C20H42NO5)+ | 1.7 | 376.3051 | 340, 262, 245, 219 | 2-(14-Aminotetradecyl)-6-(hydroxymethyl) oxane-3,4,5-triol | Fatty alcohol | − | + |
| L97 | 13 | 280 | (C19H38NO4)+ | 1.6 | 344.279 | 326, 308, 280, 224 | 19-(hydroxyamino)-19-oxo-nonadecanoic acid | Fatty acid | − | + |
| L98 | 13 | 280 | (C19H36NO3)+ | 3.5 | 326.2678 | 308, 252 | Dodecadienyl carnitine | Fatty acyl-L-carnitine | − | + |
| L99 | 13 | 280 | (C20H40NO4)+ | 2.1 | 358.2944 | 340, 322, 294 | Tridecanoyl carnitine | Fatty acyl-L-carnitine | − | + |
| L100 | 13 | 280 | (C18H40NO4)+ | 3.7 | 334.294 | 316, 298, 280, 251, 238 | 1-(hydroperoxyamino) octadecane-1,18-diol | Fatty alcohol | − | + |
| L101 | 14 | 299 | (C32H45O9)+ | 4.4 | 573.3033 | 367, 349, 331, 253, 133 | Scillaridin-acetate-O-rhamnoside | Bufadienolide | + | − |
| L102 | 14 | 298 | (C16H27O4)+ | 3.9 | 283.1893 | 270, 265 | Fumagillol | Sesquiterpenoid | + | − |
| L103 | 14 | 298 | (C17H27O5)+ (C16H27O3)+ | 2.1 | 311.1847 (−46 Formate) | 265, 247, 209 | (4E,6Z)-3-Hydroxy-4,6,15-hexadecatrienoic acid | Acid | + | − |
| L104 | 14 | 282 | (C19H40NO4)+ | 5.1 | 346.2934 | 328, 310, 282, 264, 226 | Monomethyl phytosphingosine | Sphingolipid | − | + |
| L105 | 14 | 298 | (C17H29O6)+ | 3.7 | 329.1946 | 265, 237, 209, 191, | Spiculisporic acid | Acid | + | − |
| L106 | 14 | 282 | (C20H42NO4)+ | 1.3 | 360.3104 | 342, 324, 296 | N-acetyl phytosphingosine | Sphingolipid | − | + |
| L107 | 14 | 282 | (C17H17O5)+ | 4.6 | 301.1057 | 282, 267 | Unknown | Unknown | − | + |
| L108 | 14 | 289 | (C18H40NO3)+ | 4.2 | 318.2989 | 300, 282, 270, 264 | Phytosphingosine | Sphingolipid | − | + |
| L109 | 14 | 289 | (C19H21O5)+F | 2.5 | 329.1375 | 207, 121 | Hirsutanone | − | + | |
| L110 | 14 | - | (C30H23O10)+ | 1.8 | 543.1296 | 273, 255, 213 | Unknown | Unknown | + | − |
| L111 | 14 | - | (C18H40NO2)⁺ | 4.7 | 302.3039 | 284, 266, 254 | Sphinganine | Sphingolipid | + | + |
| L112 | 14 | - | (C17H31O5)⁺ | 5.1 | 315.215 | 265 | Unknown | Unknown | + | − |
| L113 | 14 | 280 | (C27H45O3)+ | 2.3 | 417.3354 | 273, 255, 161 | 24-Hydroperoxycholesta-5,25-dien-3beta-ol | Fatty acid | − | + |
| L114 | 15 | - | (C18H31O2)+ | 0.3 | 279.2318 | 261, 223, 173 | Octadecatrienoic acid | Fatty acid | + | + |
| N27 | 15 | - | (C18H31O3)− | 2.2 | 295.2279 | 195, 277 | Coriolic acid | Fatty acid | − | + |
| L116 | 16 | - | (C48H81O8)⁺ | 11.5 | 733.4379 | 367,253 | Dimer of unknown fatty acid | Fatty acid | + | + |
| L117 | 16 | - | (C18H29O3)+ | 5.2 | 293.2096 | 275, 223, 95 | Licanic acid | Fatty acid | + | − |
| L118 | 17 | - | (C21H39O4)+ | 0.1 | 355.2843 | 337, 263 | Glyceryl 2-linoleate | Fatty acid | + | − |
| N28 | 17 | - | (C18H29O2)− | 3.1 | 277.2164 | 250, 226, 171, 150, 109, 77, 53 | Linolenic acid | Fatty acid | − | + |
| L119 | 17 | - | (C18H27O)⁺ | 1.1 | 259.2054 | 175 | Unknown | Unknown | + | − |
| L120 | 17 | - | (C18H33O2)+ | 0.4 | 281.2476 | 263, 245, 189, | Linoleic acid | Fatty acid | + | + |
| L121 | 17 | - | (C20H33O3)+ | 1.7 | 321.243 | 305, 265, 245, 179 | 8-Hydroxyicosa-5,9,11,14-tetraenoic acid | Fatty acid | + | − |
| L122 | 17 | - | (C36H65O4)⁺ | 3.9 | 561.4899 | 543, 307, 245, 175 | Linoleic acid dimer | Fatty acid | + | − |
| L123 | 17 | - | (C21H41O4)+ | 5.4 | 357.298 | 339, 265, 247, 205, 135, 124, 112, 75 | Glyceryl Monooleate | Fatty acid | + | + |
| N29 | 17 | - | (C18H31O2)− | 0.9 | 279.2327 | 201, 167, 141, 127, 89, 70, 54 | Linoleic acid | Fatty acid | + | + |
| L124 | 17.7 | - | (C16H31O)+ | 6.7 | 239.2353 | 109, 95 | Hexadeca-10,12-dien-1-ol | Fatty acid | + | + |
| L125 | 17.7 | - | (C16H33O2)+ | 3.3 | 257.2467 | 237, 120, 103 | Hexadecanoic acid | Fatty acid | + | + |
| L126 | 17.8 | - | (C18H35O2)⁺ | 5.9 | 283.2615 | 265, 247, 191, 153, 137, 121 | Palmitic acid | Fatty acid | + | − |
| L127 | 17.8 | - | (C18H33O)+ | 6.1 | 265.251 | 247, 205, 191, 149 | Linolenyl alcohol | Fatty alcohol | + | + |
| N30 | 17.8 | - | (C18H33O2)− | 0.8 | 281.24 | 185, 155, 95, 58 | Oleic acid | Fatty acid | + | + |
| N31 | 17.8 | - | C19H35O4 | 10 | 327.2505 | 281, 185, 95 | Chaetomellic acid A | Fatty acid | + | − |
| L128 | 18 | - | (C14H23O16)+ | 1.6 | 447.0988 | 359, 341, 324, 225, 207, 149 | Unknown | Unknown | − | + |
| L129 | 18 | - | (C22H39O4)+ | 0.1 | 367.2843 | 349, 331,293, 251, 205, 179, 133 | 16,17-dihydroxydocosa-7,10,13-trienoic acid | Fatty acid | + | + |
| L130 | 18 | - | (C22H37O3)+ | 2.6 | 349.2728 | 331, 293, 183, 165 | Anacardic acid | Phenolic lipid | + | + |
| Metabolite | Assignment | δ 1H in ppm | δ 1H COSEY (ppm) | δ 13C in ppm | HMBC Correlations δ 13C in ppm |
|---|---|---|---|---|---|
| Fatty acid (M1–M3) | Olefinic carbons | 5.23–5.34 | 2.05 | 128.0–131.3 | 29.4 (bis allylic CH2), 27.9 allylic CH2 |
| allylic CH2 | 2.07 m | 5.34 | 27.9 | Olefinic 128.0–131.0, (CH2)n 31.5 | |
| ω-9 Fatty acid (M1) | t-CH3 | 0.91 (t, J = 6.9 Hz) | 1.3 (CH2)n | 14.1 | 23.9 C-2, 31.5(CH2)n |
| (CH2)n | 1.3 (br. s) | 0.89 (t-CH3), 1.61 (H-3), 2.09 (allylic CH2) | 30.4 | 32.0 (CH2)n | |
| C-2 | 2.27 (t, J = 7.4 Hz) | 1.59 | 34.7 | C-1 178.8, C-32.4, (CH2)n 31.6 | |
| C-3 | 1.59 m | 2.27 | 25.8 | C-1 177.8, (CH2)n 30.4 | |
| ω-6 Fatty acid (M2) | Bis allylic CH2 | 2.77 (t, J = 6.9 Hz) | 5.33 | 24.7 | Olefinic carbons 131.2, |
| ω-3 Fatty acid (M3) | Bis allylic CH2 | 2.87 | 5.33 | 26.3 | Olefinic carbons 131.2, |
| t-CH3 | 0.97 | 2.07 (allylic CH2) | 19.5 | 21.6 C-2 | |
| Sugars | |||||
| Rhamnoside (M4) | C-6 | 1.23 | 3.77 | 19.5 | (C-4) 69.8, (C-5) 72.8 |
| C-1 | 5.44 | - | 93. 8 | (C-2) 73.8 | |
| C-5 | 3.77 | - | 72.7 | - | |
| C-4 | 3.78 | - | 69.1 | - | |
| β-Glucose (M5) | C-1 | 4.48 (d, J = 7.8 Hz) | 3.11, 3.27, 3.32 | 97.9 | - |
| C-2 | 3.11 | 76.1 | (C-3) 77.8, (C-1)97.9 | ||
| C-3 | 3.35 | 77.8 | - | ||
| C-5 | 3.28 | 77.7 | (C-6) 62.2 | ||
| C-6 | 3.65 | 62.1 | - | ||
| α-Glucose (M6) | C-1 | 5.10 (d, J = 3.7 Hz) | 3.35 | 93.7 | (C-4) 72.7, (C-3)74.61 |
| C-2 | 3.35 | 73.5 | 74.2 (C-3) | ||
| C-3 | 3.84 | 74.2 | - | ||
| C-4 | 3.77 | 72.7 | (C-6) 62.5 | ||
| C-6 | 3.86 | 62.5 | - | ||
| Sucarose (M7) | C-1 | 5.48 (t, J = 3.6 Hz) | 3.35, 3.42, 3.69 | 93.3 | (C-3) 74.3, (C-1′) 105.0 |
| C-2 | 3.42 | 3.69 | 72.9 | (C-3) 74.3 | |
| C-3 | 3.69 | 3.35 | 74.2 | (C-2) 72.9 | |
| C-4 | 3.35 | 72.8 | (C-3) 74.3 | ||
| C-2′ | 4.08 | - | 87.9 | (C-1′) 105.0 | |
| C-3′ | 4.03 | - | 76.8 | (C-5′) 63.1, (C-1′) 105.0 | |
| C-4′ | 3.75 | - | 83.6 | (C-6′) 63.9 | |
| C-5′ | 3.76 | - | 63.1 | (C-1′) 105.0, (C-4′) 83.6 | |
| C-6′ | 3.62 | - | 63.9 | (C-1′) 105.0 | |
| Amino acids | |||||
| Alanine (M8) | C-3 | 1.47 (d, J = 7.2) | 3.64 | 16.9 | 51.5, 174.9 |
| C-2 | 3.64 | 1.47 | 51.4 | - | |
| Aaspartic acid (M9) | C-3a | 2.96 | 2.71, 3.85 | 35.3 | (C-2) 52.6, (C-4) 172.9, (C-1)174.9 |
| C-3b | 2.71 | - | 35.3 | (C-2) 52.6, (C-4) 172.9, (C-1)174.9 | |
| C-2 | 3.85 | - | 52.6 | (C-4) 172.9, (C-1) 174.9 | |
| Glycine (M10) | C-2a | 3.88 | - | 43.6 | |
| C-2b | 4.01 | - | 43.6 | (C-1) 174.7 | |
| Tyrosine (M11) | C-3 | 2.98–3.31 | 40.0 | (C-4) 127.2 | |
| C-2 | 4.14 | 50.6 | |||
| C-6, C-8 | 6.77 | 7.13 | 116.5 | (C-4) 127.2 | |
| C-5, C-9 | 7.13 | 6.77 | 131.3 | (C-7) 157.6 | |
| Tryptophan (M12) | C-2 | 3.89 | - | 56.5 | (C-3) 24.9, (C-1) 173.4 |
| C-8 | 7.05 (t, J = 7.5 Hz) | 7.12, 7.37 | 119.8 | (C-7) 112.2, (C-11) 128.3 | |
| C-9 | 7.12 (overlap) | 7.69 | 122.5 | (C-6) 138.2, (C-8) 119.0 | |
| C-5 | 7.20 (s) | - | 124.9 | (C-4) 102.1, (C-6) 138.2 | |
| C-10 | 7.69 (d, J = 7.9 Hz) | 7.37 | 118.9 | (C-9) 122.5, (C-6)138.2 | |
| C-7 | 7.37 (d, J = 8.2 Hz) | - | 112.2 | - | |
| Bufadienolides | |||||
| Bufalin and Scilliridin (M13, M14) | C-21 | 7.98 (d, J = 2.6 Hz) | 6.25 | 149.9 | |
| C-22 | 6.27 (d, J = 3.0 Hz) | 7.97 | 115.2 | 122.4, 164.3 (C-20, 23) | |
| C-24 | 7.43 (s) | 150.3 | 122.4, 164.2 (C-20, 23) | ||
| C-17 | 2.59 | 51.7 | 124.2 (C-20) | ||
| C-8 | 1.83 | 1.68 | 42.8 | 84.0, 49.0 (C-14, 13) | |
| C-9 | 1.68 | 1.83 | 43.1 | ||
| Bufalin (M13) | C-18 | 0.714 | 12.1 | (C-13) 49.0, (C-17) 51.0, (C-14) 84.0 | |
| C-19 | 0.98 | 19.0 | (C-1) 35.0, (C-2) 37.0, (C-9) 57.0 | ||
| C-3 | 3.93 | 73.5 | (C-1) 35.0 | ||
| Scilliridin (M14) | |||||
| C-3 | 5.96 | 128.6 | (C-5)141.0 | ||
| C-4 | 5.75 | 127.3 | - | ||
| C-6 | 5.71 | 127.5 | (C-5) 141.0 | ||
| C-19 | 1.02 3H | 19.2 | (C-10) 38.3, (C-9) 51.9, (C-6) 141.4 | ||
| C-18 | 0.81 | 17.7 | (C-13) 49.0, (C-17) 51.0, (C-14) 84.0 | ||
| Flavanoids | |||||
| kaempeferol derv. (M15) | C (3′, 5′) | δ 6.98 (d, J = 8.5 Hz, 2H) | - | - | |
| C (2′, 6′) | 6.56 (d, J = 8.4 Hz, 2H) | - | - | ||
| C-8 | 6.04 (d, J = 1.8 Hz, H) | - | - | ||
| C-6 | 6.04 (d, J = 1.8 Hz, H) | - | - | ||
| Coumarins | |||||
| 6-Hydroxy coumarin (M16) | C-3 | 6.19 (d, J = 9.4 Hz) | 7.84 | 112.1 | (C-10) 112.9, 157.0 |
| C-4 | 7.84 (d, J = 9.4 Hz) | 6.19 | 145.8 | (C-2) 157.0 | |
| C-8 | 6.72 (d, J = 2.3 Hz) | 103.1 | (C-6) 157.6 | ||
| C-6 | 6.80 (dd, J = 8.5, 2.3 Hz) | 7.47 | 114.25 | (C-7) 154 | |
| C-5 | 7.47 overlap (d, J = 8.5 Hz) | 6.80 | 130.43 | (C-4) 145.79 | |
| RS (MCF7) IC50 | WS (MCF7) IC50 | Dox.(MCF7) IC50 | RS (A-549) IC50 | WS (A-549) IC50 | Dox. (A-549) IC50 | RS (SKOV-3) IC50 | WS (SKOV-3) IC50 | Dox. (SKOV-3)IC50 |
|---|---|---|---|---|---|---|---|---|
| 0.165 ± 0.007 * | 0.326 ± 0.005 | 0.2 ± 0.004 * | 0.271 ± 0.005 * | 0.108 ± 0.003 * | 0.56 ± 0.003 * | 0.912 ± 0.021 | 0.690 ± 0.018 | 0.2 ± 0.01 |
Disclaimer/Publisher’s Note: The statements, opinions and data contained in all publications are solely those of the individual author(s) and contributor(s) and not of MDPI and/or the editor(s). MDPI and/or the editor(s) disclaim responsibility for any injury to people or property resulting from any ideas, methods, instructions or products referred to in the content. |
© 2023 by the authors. Licensee MDPI, Basel, Switzerland. This article is an open access article distributed under the terms and conditions of the Creative Commons Attribution (CC BY) license (https://creativecommons.org/licenses/by/4.0/).
Share and Cite
Khattab, O.M.; El-Kersh, D.M.; Khalifa, S.A.M.; Yosri, N.; El-Seedi, H.R.; Farag, M.A. Comparative MS- and NMR-Based Metabolome Mapping of Egyptian Red and White Squill Bulbs F. Liliaceae and in Relation to Their Cytotoxic Effect. Plants 2023, 12, 2078. https://doi.org/10.3390/plants12112078
Khattab OM, El-Kersh DM, Khalifa SAM, Yosri N, El-Seedi HR, Farag MA. Comparative MS- and NMR-Based Metabolome Mapping of Egyptian Red and White Squill Bulbs F. Liliaceae and in Relation to Their Cytotoxic Effect. Plants. 2023; 12(11):2078. https://doi.org/10.3390/plants12112078
Chicago/Turabian StyleKhattab, Omar M., Dina M. El-Kersh, Shaden A. M. Khalifa, Nermeen Yosri, Hesham R. El-Seedi, and Mohamed A. Farag. 2023. "Comparative MS- and NMR-Based Metabolome Mapping of Egyptian Red and White Squill Bulbs F. Liliaceae and in Relation to Their Cytotoxic Effect" Plants 12, no. 11: 2078. https://doi.org/10.3390/plants12112078
APA StyleKhattab, O. M., El-Kersh, D. M., Khalifa, S. A. M., Yosri, N., El-Seedi, H. R., & Farag, M. A. (2023). Comparative MS- and NMR-Based Metabolome Mapping of Egyptian Red and White Squill Bulbs F. Liliaceae and in Relation to Their Cytotoxic Effect. Plants, 12(11), 2078. https://doi.org/10.3390/plants12112078