You are currently viewing a new version of our website. To view the old version click .
Plants
  • Article
  • Open Access

25 July 2022

Exploring Relationships among Grapevine Chemical and Physiological Parameters and Leaf and Berry Mycobiome Composition

,
,
,
,
,
,
,
,
and
1
Food and Wine Research Institute, Research and Development Center, Eszterházy Károly Catholic University, Leányka u. 6, 3300 Eger, Hungary
2
ELKH–EKKE Lendület Environmental Microbiome Research Group, Eszterházy Károly Catholic University, Leányka u. 6, 3300 Eger, Hungary
3
Doctoral School of Environmental Sciences, Hungarian University of Agricultural and Life Sciences, Páter K. u. 1, 2100 Gödöllő, Hungary
4
Institute for Viticulture and Enology, Faculty of Natural Sciences, Eszterházy Károly Catholic University, Leányka u. 6, 3300 Eger, Hungary
This article belongs to the Special Issue Interaction of Plants and Endophytic Microorganisms: Molecular Aspects, Biological Functions, Community Composition, and Practical Applications

Abstract

Improving our knowledge on biotic and abiotic factors that influence the composition of the grapevine mycobiome is of great agricultural significance, due to potential effects on plant health, productivity, and wine characteristics. Here, we assessed the influence of scion cultivar on the diversity and composition of fungal communities in the berries and leaves of three different cultivars. We generated DNA metabarcoding data, and statistically compared the richness, relative abundance, and composition of several functional groups of fungi among cultivars, which are partly explained by measured differences in chemical composition of leaves and berries and physiological traits of leaves. Fungal communities in leaves and berries show contrasting patterns among cultivars. The richness and relative abundance of fungal functional groups statistically differ among berry and leaf samples, but less so among cultivars. Community composition of the dominant functional groups of fungi, i.e., plant pathogens in leaves and saprotrophs in berries, differs significantly among cultivars. We also detect cultivar-level differences in the macro- and microelement content of the leaves, and in acidity and sugar concentration of berries. Our findings suggest that there appears to be a relatively diverse set of fungi that make up the grapevine mycobiome at the sampled terroir that spans several cultivars, and that both berry and leaf mycobiomes are likely influenced by the chemical characteristics of berries and leaves, e.g., pH and the availability of nutrients and simple carbohydrates. Finally, the correlation between fungal community composition and physiological variables in leaves is noteworthy, and merits further research to explore causality. Our findings offer novel insights into the microbial dynamics of grapevine considering plant chemistry and physiology, with implications for viticulture.

1. Introduction

Grapevine, one of the major crops grown principally for the production of table grapes and wines, is naturally colonized by a diverse array of microorganisms modulating plant health, growth, and crop yield and quality [1,2]. Fungi constitute the dominant component of the grapevine-associated microbiota, with a wide range of ecological roles [2,3]. The phyllosphere, i.e., the ephemeral above-ground green parts comprising the shoots, leaves, and reproductive structures of vascular plants, offers a variety of niches for fungal pathogens, commensal, litter, and wood saprotrophs, as well as mutualists that promote plant growth and stress tolerance [3]. The phyllosphere is a dynamic and harsh habitat for microbial colonizers, originating from the surrounding atmosphere [4], soil [5], and animal vectors [6], due to high levels of ultraviolet (UV) radiation, and rapid fluctuations in temperature and surface moisture [7]. Population sizes of the microbial inhabitants shift in distinct seasonal trends based on the growing season and, ultimately, leaf senescence [8].
In addition to environmental factors, biotic factors, e.g., host genotype, and management type may also shape the composition and diversity of the grapevine microbiome. Lately, culture-dependent and culture-independent methods were used to investigate changes in fungal communities of above-ground grapevine tissues among different types of plant protection, geographical locations, climatic conditions, seasons, and cultivars, although the grapevine phyllosphere is still less intensively studied than the rhizosphere [9,10,11,12,13,14,15,16,17,18,19]. For example, several studies found compositional differences among geographical locations in microbial communities associated with grapevine leaves [10], plant parts [20], and cultivars [21]. These results indicate that many biotic and abiotic factors influence the grapevine microbiome, although the results are contradictory in several cases. The functionality of phyllosphere fungi, and the environmental factors influencing it, are scarcely known, and the same is true for the relationships between leaf- and berry-associated fungi, and grapevine physiology and chemistry.
In this study, we characterized taxonomic composition and inferred functionality of phyllosphere fungal communities in three grapevine cultivars, V. vinifera cv. Furmint, cv. Kadarka, and cv. Syrah, grown in the same Grand Cru vineyard. As it was suggested that identity of the host plant, as well as chemical properties and physiology, can alter the microbial community structure [21], we focused on the question of whether the grapevine cultivar influences the fungal communities inhabiting the inner and external tissues of healthy (i.e., without visible symptoms of fungal infection) leaves and berries. To better understand the relationships between the fungal community and grapevine physiology and chemistry, we also tested for correlations between mycobiome composition and physiological parameters measured in situ, as well as macro- and microelement composition of leaf samples and the sugar concentration of the grape berries.
Specifically, our goals were to (1) characterize the genotypic richness and composition of various functional groups of fungi associated with leaves and berries of grapevine, (2) to test if the observed differences in richness or community composition are related to cultivar, and (3) to explore relationships between fungal community composition and grapevine leaf physiology and leaf and berry chemistry.

2. Results

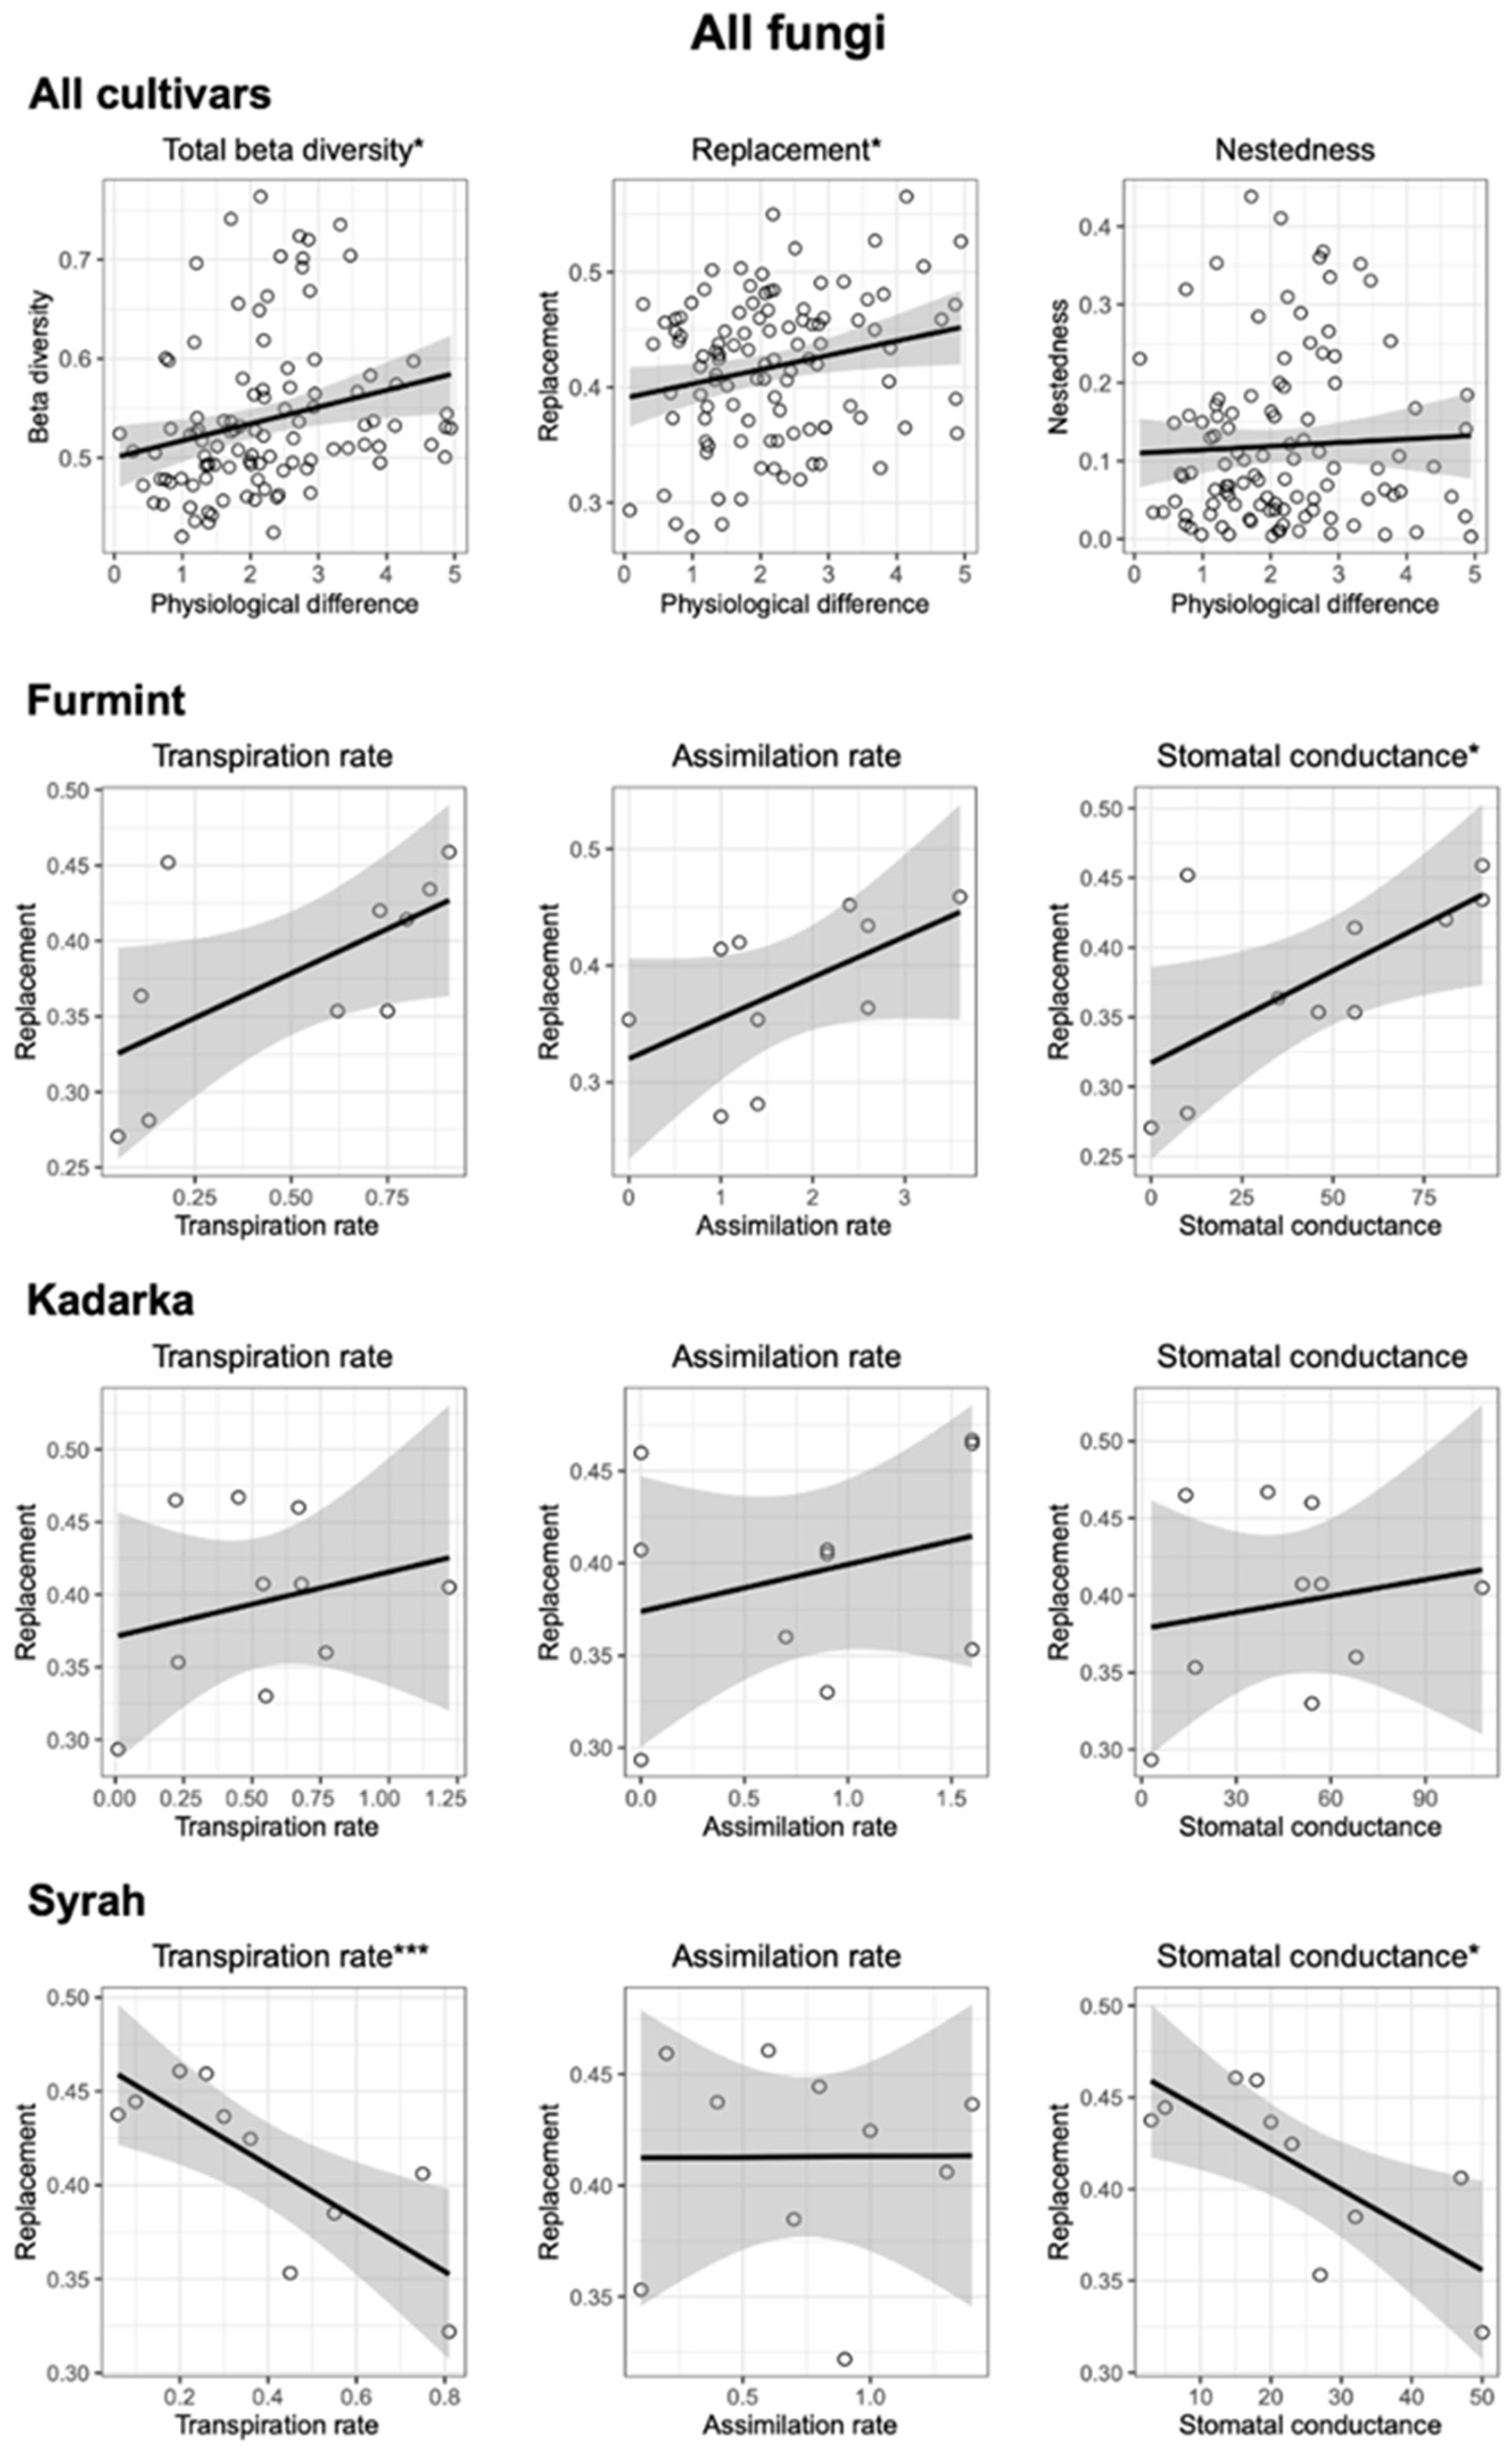
2.1. Meteorological and Physiological Data

Weather parameters (mean annual temperature and annual precipitation) of the sampling year were 11.5 °C and 638.5 mm, respectively, which is slightly higher compared to the average (10 °C according to Köppen classification). None of the measured leaf gas exchange parameters (stomatal conductance, assimilation rate, and transpiration) differ significantly among grapevine cultivars. The determined assimilation rate (Pn) values are the following: 5.2–8.8 mmol m−2 s−1 in Furmint, 7.2–8.8 mmol m−2 s−1 in Kadarka, and 6.0–7.4 mmol m−2 s−1 in Syrah. Values of stomatal conductance (gs) range from 87 mol m−2 s−1 to 178 mol m−2 s−1 in Furmint, from 73 mol m−2 s−1 to 181 mol m−2 s−1 in Kadarka, and from 53 mol m−2 s−1 to 103 mol m−2 s1 in Syrah. Transpiration (E) ranges from 1.28 mol m−2 s−1 to 2.19 mol m−2 s−1 in Furmint, from 1.15 mol m−2 s−1 to 2.37 mol m−2 s−1 in Kadarka, and from 0.87 mol m−2 s−1 to 1.68 mol m−2 s−1 in Syrah. Pre-dawn water potential measurements indicate moderate water deficit (0.3–0.4 MPa), with no differences among cultivars [22,23].

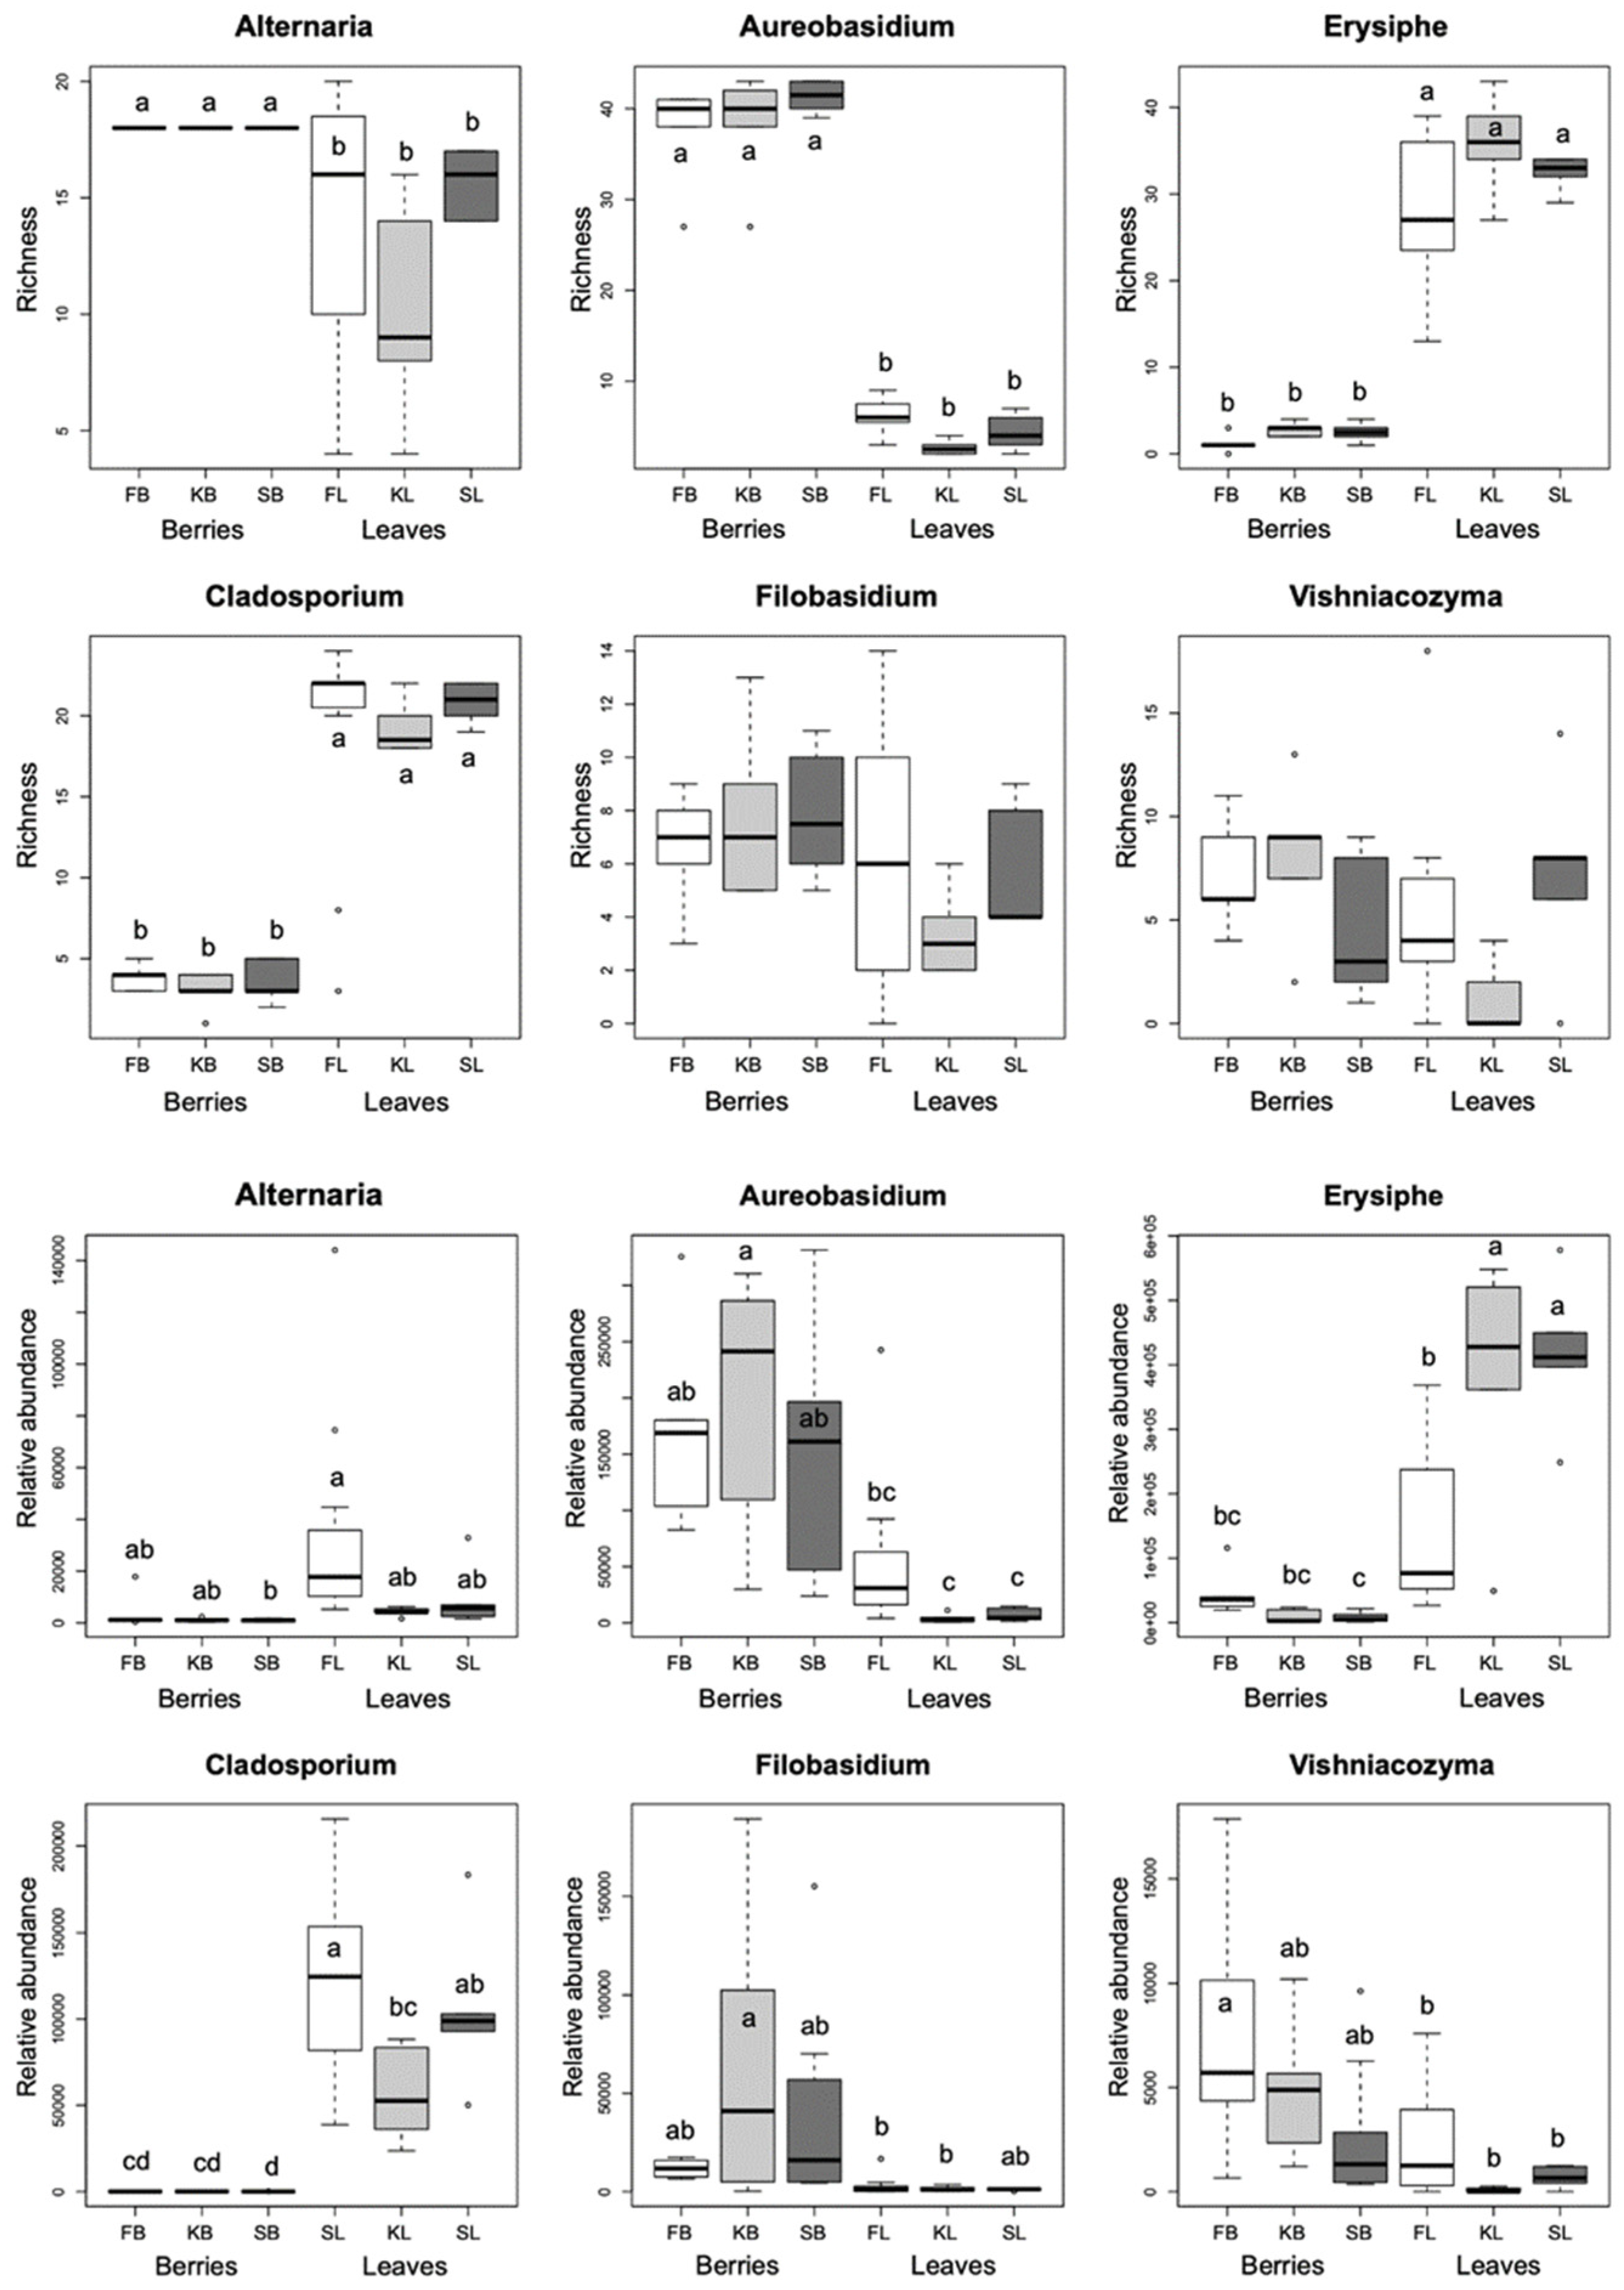
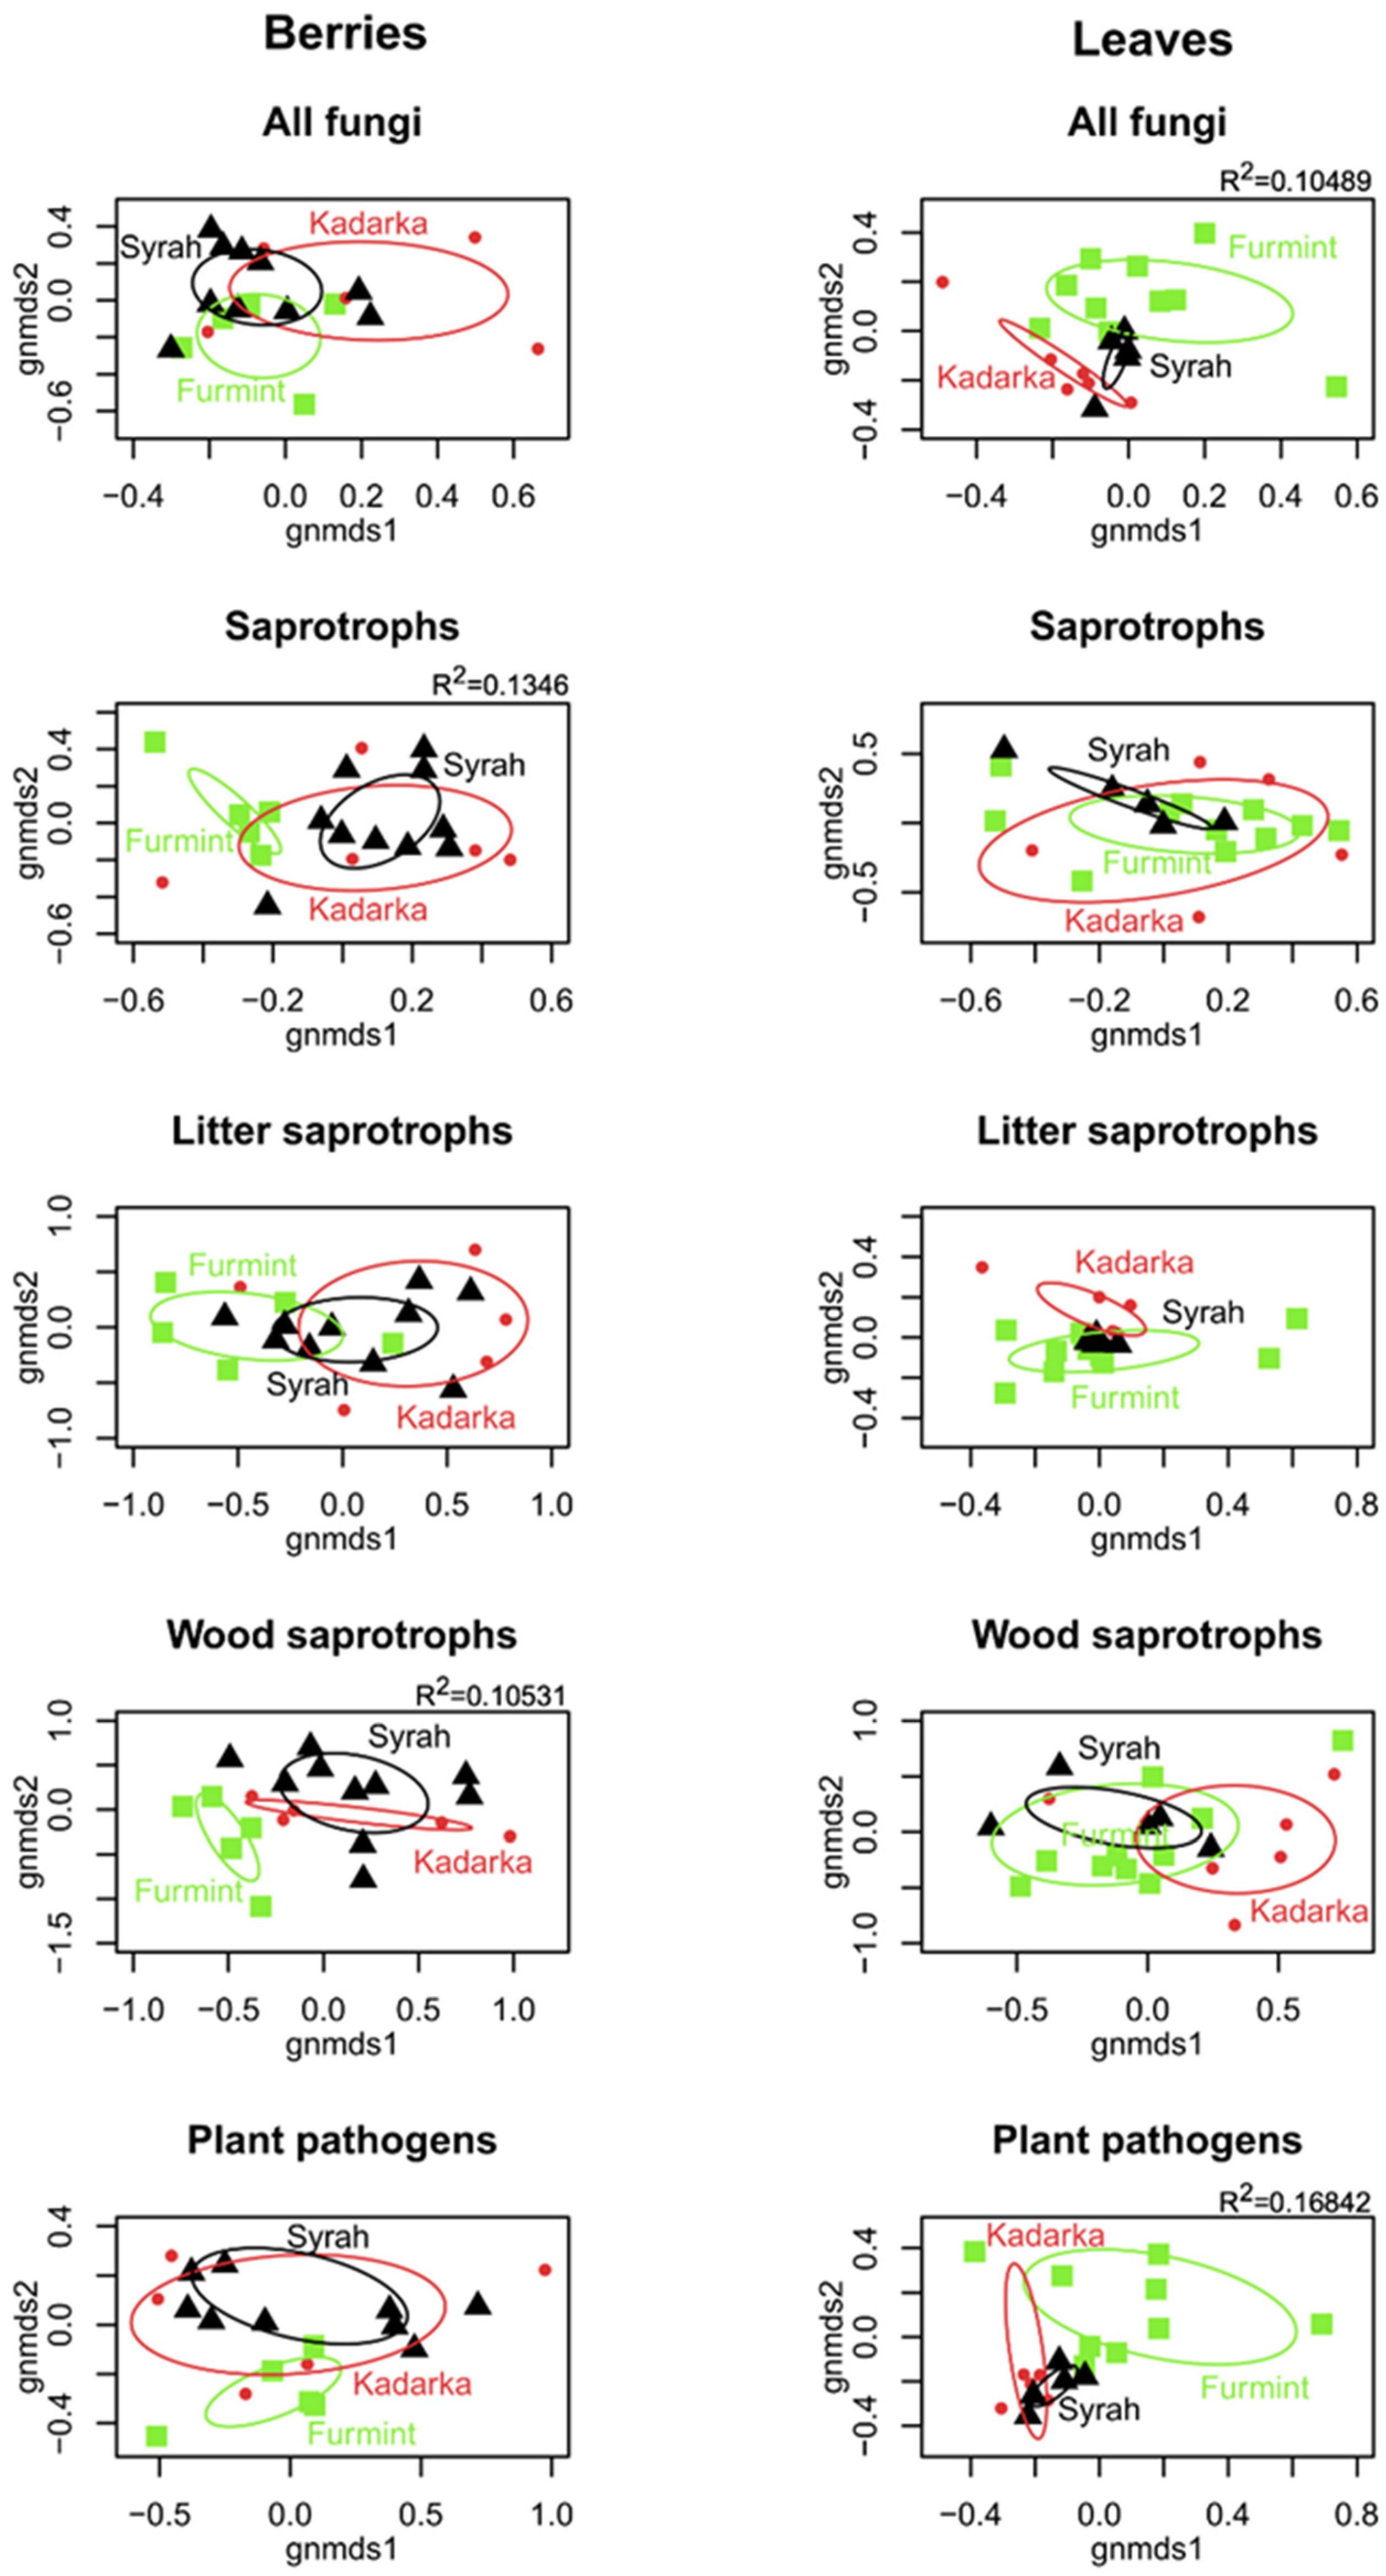
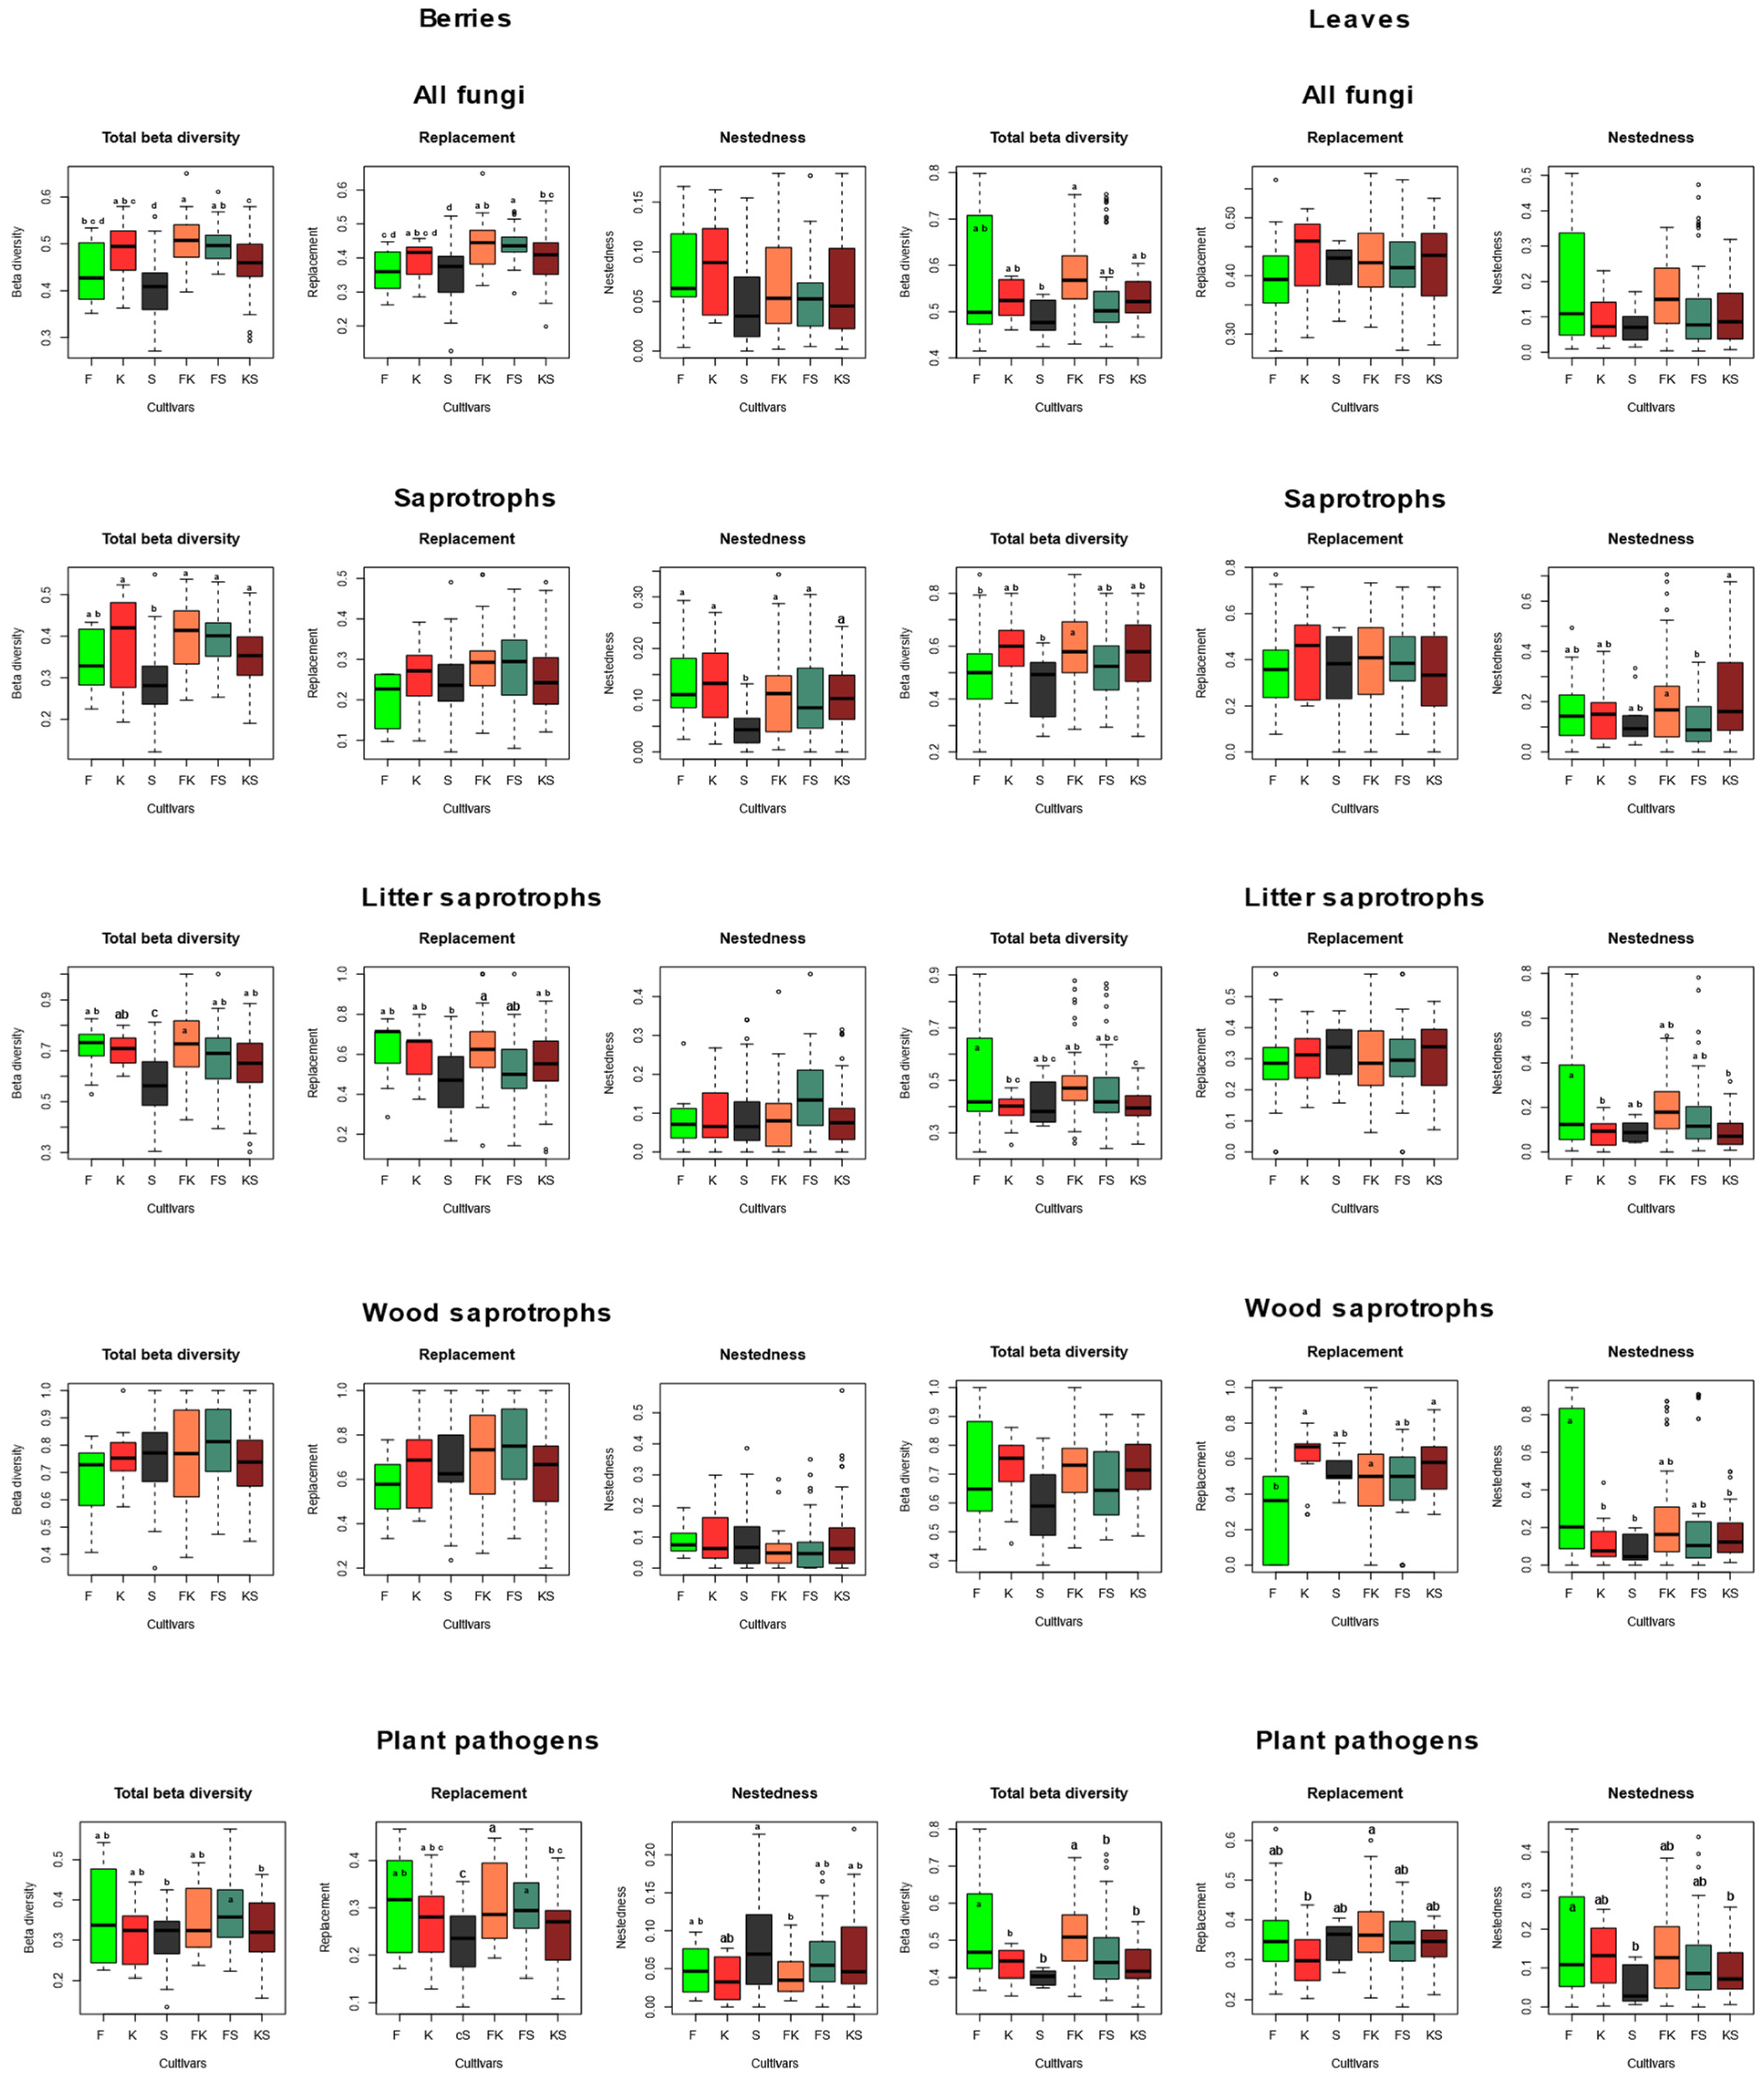
2.2. Grapevine Mycobiome

We identified at the species or genus level a total of 568 fungal amplicon sequence variants (ASVs) in healthy berries, and 797 in healthy leaves, of three different cultivars of V. vinifera. The DNA sequences of fungal ASVs were deposited in GenBank (submissions ON864449–ON865305 for berries and ON865306–ON866491 for leaves). The genera with the highest number of ASVs in berries are Aureobasidium, Alternaria, and Vishniacozyma in Furmint and Kadarka, and Aureobasidium, Alternaria, and Dioszegia in Syrah (Figure 1). Based on observed incidence in all sampled leaves, three genera dominate in all cultivars: the plant pathogenic Erysiphe and Alternaria, and the litter saprotroph Cladosporium.
Figure 1. Boxplots showing the ASV richness and the rarefied read abundance of dominant fungal genera among all samples, based on the rarefied dataset. Means were compared using ANOVA and Tukey’s HSD tests, with letters denoting significant differences within each boxplot. Abbreviations: F—Furmint, K—Kadarka, S—Syrah, B—grape berry sample, L—leaf sample.
Berry fungal communities are dominated by generalist saprotrophs, which represent the only functional guild that is significantly more diverse in berries than in leaves, while plant pathogens and litter and wood saprotrophs have the highest ASV richness in leaves (Figure 2). Relative abundance values show similar patterns to those observed in richness, except that the read counts of plant pathogenic fungi are comparable in berries and leaves. In general, neither richness nor relative abundance of the functional groups differ significantly among cultivars in leaves or berries, with the only significant difference observed in read counts between Furmint and Kadarka leaves (Figure 2).
Figure 2. Boxplots showing the ASV richness and the rarefied read abundance of functional groups of fungi among all samples, based on the rarefied dataset. Means were compared using ANOVA and Tukey’s HSD tests, with letters denoting significant differences within each boxplot. Abbreviations: F—Furmint, K—Kadarka, S—Syrah, B—grape berry sample, L—leaf sample.
NMDS ordinations of fungal communities in grape berries and leaves (Figure 3). Results from the PerMANOVA indicate a significant effect of cultivar on fungal community structure in leaves (p = 0.0008), explaining 10.49% of compositional variance among all leaf samples, while the cultivar has a non-significant effect on fungal communities in berries. When beta diversity of leaf-associated fungi is partitioned into replacement and nestedness components, we observe that replacement accounts for most of the observed beta diversity, although nestedness is relatively high (Figure 4 and Figure 5) compared to what is observed in soil fungal communities [24]. In general, pairwise beta diversity measures are comparable within and between cultivars, with the exception that community turnover among samples within Syrah tend to be significantly lower than in Syrah–Furmint and Syrah–Kadarka pairs, particularly in berries (Figure 4). Linear regression analyses indicate significant positive relationships between pairwise differences in replacement and physiological parameters, and all three cultivars combined (Figure 5). We observe similar patterns when functional groups are analyzed separately, but correlations are only significant for plant pathogens and saprotrophs (data not shown). When data from different cultivars are analyzed independently, Furmint and Kadarka show the above-mentioned positive relationship between community turnover and differences in measured physiological parameters, albeit significant correlation is only observed for stomatal conductance in Furmint. Conversely, replacement in fungal communities in Syrah shows negative correlations with differences in transpiration rate and stomatal conductance (Figure 5). In Kadarka, none of the physiological parameters correlate significantly with replacement, and no correlation is detected for nestedness in any cultivar.
Figure 3. Non-metric multidimensional scaling (NMDS) ordination plots showing the differences in community composition of various functional groups of fungi among berry and leaf samples. The ordinations were based on a Bray–Curtis distance matrix generated from the Hellinger-transformed abundance table. Ellipses show the standard deviation of the compositional differences among samples from the same cultivar. R2 values indicate the explained variance of compositional differences among samples explained by the cultivar, based on PerMANOVA analyses (only statistically significant results are shown).
Figure 4. Boxplots showing the total beta diversity and its replacement and nestedness components in various functional groups of fungi, based on pairwise comparisons of samples within and between cultivars. Means were compared using ANOVA and Tukey’s HSD tests, with letters denoting significant differences within each boxplot. Abbreviations: F—Furmint, K—Kadarka, S—Syrah.
Figure 5. Correlation of total beta diversity and its replacement and nestedness components of the total fungal community, with pairwise differences in measured physiological characteristics factors in leaf samples. Asterisks indicate significance levels: *: p < 0.05 and ***: p < 0.001.
The indicator species analysis identified several characteristic fungal species associated with berries and leaves of each studied grapevine cultivar (Table 1). In berries, indicators for Furmint include species in the genera Sporidiobolus, Hyphodontia, Rhodotorula, Sporobolomyces, Briansuttomyces, and Gibberella. Numerous ASVs in the plant pathogenic fungal genera Botryosphaeria and Alternariaster are indicators for Kadarka berries; additionally we found Pyrenochaetopsis and Vishniacozyma as indicators. The lowest number of indicator ASVs are observed in Syrah berries, and belonged to the genus Keissleriella. Taxa significantly associated with Furmint leaves are identified mainly as Aureobasidium, Sporobolomyces, and Dioszegia, alongside with the genera Microstroma and Ustilago, while indicators for Kadarka include well-known plant pathogenic genera Erysiphe, Comoclathris, Septoria, and Diplodia. Syrah leaves are characterized by a wide range of indicators that, similarly to other cultivars, include Aureobasidium, Erysiphe, and Ustilago species.
Table 1. The list of indicator ASVs significantly associated with berries or leaves of a specific scion cultivar with the corresponding p-value, matching species hypothesis, ITS2 rDNA sequence similarity (%), taxonomic classification, and assigned functional guild of the most similar matching sequence in the UNITE+INSD dynamic species hypotheses database (version released on 10 May 2021).

2.3. Chemical Parameters of Leaves and Berries

We observe significant differences in several chemical parameters of the fully mature berries of the three studied cultivars, with Furmint and Syrah being the most different, and Kadarka generally showing intermediate values. The concentration of simple sugars, measured here as Brix index, is highest in Furmint, followed by Kadarka, with Syrah containing a significantly lower amount of sugar compared to both Hungarian cultivars. A similar pattern is observed for acidity, as indicated by the decrease in total acid content and the increase in pH from Furmint to Kadarka and then Syrah. Alpha-amino nitrogen content is highest in Syrah, with significantly lower values observed in Kadarka and in Furmint (Table 2). The measured concentrations of phosphorous (P), nitrogen (N), iron (Fe), calcium (Ca), and magnesium (Mg) in leaves are significantly different among the three cultivars, although we do not observe general trends as in the berry samples (Table 2). Kadarka leaves have the highest amount of P, Furmint the most Fe, and Syrah contains the highest concentrations of Ca, Mg, and N (Table 2).
Table 2. Chemical parameters of leaf and berry samples from the three investigated grapevine cultivars: Furmint (F), Kadarka (K), and Syrah (S).

3. Discussion

This paper provides novel insights into the compositional dynamics of fungal communities in grapevine leaves and grape berries in various cultivars. Specifically, this study is among the first to simultaneously compare leaf and berry mycobiome among scion cultivars, and to explore potential links between leaf mycobiome and physiology. The data presented here show that (1) different functional groups of fungi dominate leaf and berry communities, with plant pathogens and litter decomposers dominating in leaves, and generalist saprotrophs being the most diverse and abundant functional guild in berries; (2) there are significant differences among scion cultivars in community composition of several functional guilds of fungi and in chemical parameters of leaves and berries; and (3) we identify correlation between leaf mycobiome composition and leaf physiological activity, with possible implications for grapevine condition and productivity.
Our finding regarding the lack of significant effect of cultivar on richness and relative abundance of fungal functional groups in leaves and berries agrees with previous findings on grapevine-associated fungal communities [12,15], although our paper is the first to reveal differences among functional groups dominating berry vs. leaf samples. Our observation that differences in the mycobiome are greater among green, annual plant parts of the same grapevines than among cultivars, mirror the differences in fungal communities found in perennial woody parts of grapevine by Geiger et al. [19]. The dominance of plant pathogens and litter decomposers in leaves seems logical based on the life strategies of these fungi. Many of the plant pathogenic genera are among the most common leaf endophytes that can remain asymptomatic for relatively long periods (e.g., Alternaria, Erysiphe). Similarly, many litter decomposers (e.g., Cladosporium) are known to colonize green, asymptomatic leaves, and remain latent until leaf senescence, a strategy to dominate the senescing leaf and limit competition from secondary colonizers [25]. The high richness and abundance of generalist saprotrophs in berries can be explained by the fact that ripened grapes are rich in easily degradable simple carbohydrates, as opposed to leaves, where saprotrophs capable of degrading complex carbohydrates (e.g., cellulose) dominate.
The compositional differences of fungal communities among cultivars are driven by different functional groups in leaves and berries. The compositional differences are not particularly strong, and are significant only in the most diverse functional guild in the respective plant parts. In leaves, plant pathogenic fungi are the only functional guild that show significant cultivar effect, while saprotrophs contribute most of the compositional difference in berries (Figure 2). Singh et al. [14] detected significant cultivar effect on grapevine mycobiome composition, although, unlike in our study, the differences among cultivars were somewhat greater in berries than in leaves.
Host plant genotype is known to affect phyllosphere mycobiome in various agricultural crops [26], but the mechanisms behind this phenomenon are poorly known. The observed chemical differences among the three cultivars, notably N, P, Ca, and Mg content in leaves, and acidity and sugar content in berries, likely explain at least part of the compositional differences of the leaf and berry fungal communities among the cultivars. Unlike for physiological measurements, we could not directly test for correlation between mycobiome and chemical composition of leaf and berry samples, because, although sampled at the same time, not exactly the same berries and leaves were used for the mycobiome and chemical analyses, due to the destructive nature of these methods. Therefore, we can only hypothesize regarding the possible connections between the chemical and microbial composition of these plant parts. For example, the significant differences in berry pH among the cultivars may contribute to the compositional alterations in the fungal community, particularly that of generalist saprotrophs, which is the most diverse and abundant functional guild in berries (Figure 1 and Figure 2). pH is known to be an important factor influencing fungal community composition in general, e.g., by altering nutrient availability, with most supporting data originating from soil studies (e.g., [27,28,29,30]). Similarly, the fact that Syrah has significantly higher berry and leaf N content and leaf Ca and Mg content than the local varieties may explain some of the observed differences in mycobiome composition. As in the case of pH, N and P content is known to affect fungal communities strongly, as most terrestrial habitats are N- and/or P-limited, and are characterized by high C/N ratios [27,30]. Both N and P are vital for plant growth, and are taken up from the soil in inorganic forms, mostly via symbiotic microorganisms [31,32]. Despite previous reports on the positive relationship between N and P and the abundance of plant pathogenic fungi and/or disease severity in grasslands and agricultural systems [33,34], we did not find significant differences in the relative abundance of plant pathogens among cultivars, despite the pronounced differences in N and P content. It is important to note that plant N nutrition status could have contrasting effects on the development and severity of diseases, depending on the plant genotype, environment, and the strategy of the pathogen [35]. High N availability may result in greater disease severity, because of the increased green biomass that could create a more favorable microclimate for pathogens, as well as more N available for the growth of the pathogen itself [36,37]. However, favorable N status can also enhance plant defense [38]. Of the dominant plant pathogenic genera, only the powdery mildew genus Erysiphe shows higher relative abundance in Syrah and Kadarka, the cultivars with the greatest N and P content, respectively, than in Furmint, which has medium levels of both elements. The significance of iron as a micronutrient is crucial, as its complex mediates electron transfer during photosynthesis [39]. The role of Ca in shaping fungal communities, other than influencing pH, has been documented before in soil samples [27]. Calcium is a universal signaling molecule, and plays essential roles in a wide range of cellular processes of fungi, such as growth, reproduction, stress tolerance, and pathogen virulence [40]. Calcium is absorbed by plants in an ionic form, and is involved in maintaining the water balance in the cells [41]. Magnesium is a component of chlorophyll molecules and serves as an activator of several enzymes that catalyze carbohydrate metabolism. It is also involved in cellular pH and protein synthesis regulation [42]. Although the exact mechanisms are unknown, we hypothesize that the chemical differences among the cultivars possibly alter the competitive dynamics of leaf- and berry-associated fungi, thus, representing certain environmental filters for fungi with respect to establishment and persistence in the community. Targeted future studies, ideally spanning multiple vintages, are needed to investigate the causal relationships between plant chemical characteristics and phyllosphere fungal community dynamics.
Our finding that measured leaf physiological parameters correlates significantly with fungal community composition, which implies that some leaf-associated fungi may directly influence plant physiological processes. This conclusion is based on the following: (1) while we do not find physiological differences among cultivars, the more compositionally different leaf fungal communities are when all samples are considered, the greater the physiological differences we observed among leaves; (2) although fungal communities themselves are temporarily dynamic, the temporal variability of the measured physiological parameters is much greater, as changes can occur at the scale of minutes, which precludes the physiological parameters being the drivers of fungal community composition. We cannot prove the causal relationship between the leaf mycobiome and leaf physiology with the data at hand, and more studies are most certainly needed that focus on the role of leaf fungi on plant physiology. It is interesting to note that while physiological differences, particularly stomatal conductance, show positive relationships with the replacement component of fungal beta diversity in Furmint, the relationship is negative in Syrah. It appears that in the latter, not replacement, but nestedness, i.e., gain or loss of fungal species, and possibly the resulting loss of certain functions, could contribute to the physiological change. This is also supported by the positive relationship between differences in fungal richness and in physiological parameters in Syrah (data not shown). It is possible that the loss of certain fungal species, either due to fungicide treatment, competitive interactions, or to random drift, can result in altered physiological performance from the plant. Again, specific studies targeting these hypotheses are needed to reveal the mechanisms of any causal relationships between plant mycobiome and physiology.

4. Materials and Methods

4.1. Sampling Site

Sample collection took place on the south-facing slopes of the Nagy-Eged Hill, a historical Grand Cru terroir in the Eger wine region with favorable insolation and mesoclimate, and soils with neutral pH and moderate water-holding-capacity, developed on marine limestone [43]. To minimize the environmental effects, sampling was carried out in one particular vineyard, where the three cultivars were grown in close proximity, under identical environmental and management conditions. Furmint, a white variety, is autochthonous in the Carpathian Basin, and plays important role in the production of ‘Aszú’ wines [44]. Kadarka was a prevailing red variety of the Hungarian wine regions for centuries, originating from the Balkan Peninsula [45], and Syrah is a well-known Rhône Valley red cultivar, now planted worldwide [46]. Viticultural characteristics of these cultivars are shown in Table 3. Samples were collected on 9 September 2020, from three different parcels less than 200 m from each other, and located at the same elevations of 310–380 m above sea level (Furmint: 47.922753, 20.413823; Kadarka: 47.922269, 20.411916; Syrah: 47.922298, 20.412999). Continuously recorded temperature and precipitation data were obtained for the entire year of 2020 from the automatic weather station (Boreas Ltd., Érd, Hungary) installed in 2019 in the sampled vineyard. Degree days (above 10 °C) in the growth period (1 April–30 September) were calculated based on daily mean temperature values. All cultivars were grafted onto Fercal rootstock in 2008, and the vine spacing was 2 × 1 m (inter- and intra-row, respectively). The vines were cordon-trained with the same crop load (8 buds/plant). The same conventional plant protection management was used for all three cultivars on the same spraying days, including conventional fungicide, herbicide, and insecticide treatments, with additional cold-pressed orange oil adjuvant and powdery mildew, downy mildew, and grey rot-specific treatments. Chemicals used included herbicides: Chikara Duo (6.7 g/kg flazaszulfuron + 288 g/kg gliphosate), Pledge 50 WP (500 g/kg flumioxazin), Kabubki (26.5 g/L piraflufen-etil); insecticide Wakizasi (50 g/kg lambda-cyhalothrin); leaf fertilizer Im Plonvit Calcium Turbo (260 g CaO); effect enhancer Wetcit (fatty alcohol-etoxylate); and fungicides: Sercadis (300 g/L fluxapyroxad), Mildicut (25 g/L cyazofamid), Altima (500 g/L fluazinam), Teson (250 g/L tebuconazole), Dionys 80 WG (800 g/kg folpet), Cosavet DF (80% micronized Sulphur), Karathane Star (350 g/L meptyldinocap), Cymbal 45 WG (450 g/kg cymoxanil), and Chorus 50 WG (500 g/kg cyprodinil).
Table 3. Viticultural characteristics of the investigated grapevine varieties [47,48,49].

4.2. Leaf Gas-Exchange and Pre-Dawn Water Potential

From each cultivar, the following physiological measurements related to metabolic activity of 5 fully developed, asymptomatic leaves were taken on 9 September 2020: midday net CO2 assimilation rate (Pn), stomatal conductance (gs), and transpiration rate (E) were determined. Measurements were carried out in the early afternoon (between 13:00–14:00, local time), when leaves were fully exposed to the sun, according to the local weather conditions and the south–north row orientation. A CIRAS-1 portable infrared gas analyzer (PP System, UK) (with leaf chamber type B) was used for the measurement of gas exchange parameters. All settings of the device met the specifications of the manual according to the leaf chamber used (flow rate 200 mls/min, RB 0.27 m2/s/mol, TR 0.14). Reference CO2 concentration was set to 410 ppm, and the photosynthetically active radiation (PAR) was above saturating light intensity during the measurements. All gas exchange records were taken on healthy, mature, and undamaged leaves fully exposed to the sun in five replicates per cultivar. All physiological measurements were taken within 1 h in all three cultivars, in order to obtain comparable data. In terms of light intensity (photosynthetically active radiation; PAR), vapour pressure deficit (VPD), and temperature (T), no difference was detectable in the experimental area during the sampling.
In order to assess soil water status of the sampling places, pre-dawn water potential was recorded with Scholander type pressure chamber [50]. Six undamaged healthy leaves were selected for each cultivar and the measurements were conducted between 2:00–3:00 h at night.

4.3. Sample Collection and Metagenomic DNA Extraction

Following the above-mentioned daytime physiological measurements, the same leaves were collected using sterile surgical gloves, and were placed in hermetic plastic bags. Berry samples were collected at cultivar-specific harvest times: on 22 September (Furmint), on 9 October (Kadarka), and on 20 October (Syrah). Samples were stored at −80 °C until further processing. After lyophilization, plant materials were disrupted and homogenized in a TissueLyser LT (QIAGEN, Hilden, Germany). Genomic DNA extraction was performed using NucleoSpin Plant II DNA Isolation Kit (MACHEREY-NAGEL, Düren, Germany), following the manufacturer’s instructions. ITS2 rDNA metabarcoding data were generated from all samples, using primers fITS7 [51] and ITS4 [52] appended with Illumina adaptors. Amplification and sequencing were performed on an Illumina NovaSeq at BaseClear (Leiden, The Netherlands), generating 250 base paired-end reads.

4.4. DNA Metabarcoding Data Analysis

Raw DNA sequences were processed with the dada2 package [53], implemented in R v. 3.6.2 (R Development Core Team 2013, Vienna, Austria), designed to resolve fine-scale DNA sequence variation with improved elimination of artificial sequences. As dada2 does not involve clustering sequences into OTUs, and is robust for removing spurious data, the output of unique ASVs captures both intra- and interspecific genetic variation of fungi found in the samples. This allows for the exploration of strain-level intraspecific differences. Raw sequences were truncated to 240 base pairs for forward and 200 for reverse reads, and were denoised, chimera-filtered, merged, and clustered into sequence variants. The maximum number of expected errors (maxEE) allowed in a read was 2. Taxonomic assignments of fungi were made with USEARCH v. 11 [54], based on the latest version (10 May 2021) of the UNITE database of reference sequences that represents all fungal species hypotheses (SHs) based on a dynamic delimitation [55]. We assigned fungal ASVs to putative functional guilds using the curated FungalTraits database [56], with the following modifications. Saprotrophic fungi that did not belong to litter and wood decomposers, i.e., nectar/sap saprotrophs, sooty molds, soil saprotrophs, and undefined saprotrophs, were treated as generalist saprotrophs primarily utilizing simple carbohydrates, hereafter referred to as “saprotrophs”. Also, “epiphytes” and “endophytes”, i.e., non-pathogenic leaf-associated fungi, were grouped into the category of “commensal” fungi.

4.5. Analytical Measurements

To determine the macro and micronutrients in grapevine leaves, 10 leaves were collected per cultivar on the above sampling day, and were subsequently dried and ground to powder. For each sample, 0.18 g of dried leaf powder was prepared for chemical analyses with 7 mL high-purity concentrated 68–70% of HNO3 (analytical pure grade, Fisher Chemical, Waltham, MA, USA) and 1 mL 30–32% H2O2 (ultrapure for trace metal analysis, Aristar, VWR Chemicals BDH.), and digested by Mars5 Microwave Digester System (CEM Corp., Matthews, NC, USA). After 20 min open digestion (reaction of volatile or easily oxidized compounds), the samples were digested with the plant tissue method (the original 400 W value was modified to 800 W for higher efficiency based on Sreenivasulu et al. [57]) in XP-1500 Plus-type vessels. Once cooled, the solution was diluted to 50 mL using ultrapure water. No further sample preparation was required, and no modifiers or ionization buffers were added. The sample preparation method was based on Dharmendra [58]. Two multi-element calibration standards were used, Fluka™ analytical standard for ICP 1–23 (100 mg/L each of element in 5% HNO3 matrix), and 7A (1000 mg/L K; 500 mg/L Si; 100 mg/L each of Al, B, Ba, Na, 50 mg/L Ag in 5% HNO3 matrix). All standards were prepared with 5% HNO3 (v/v) solution. The plastic rotation cubes, volumetric flask, and vessels were decontaminated with 10% HNO3 (v/v) for 24 h and, rinsed twice using 18.2 MW/cm deionized water before use [59]. The macro and microelement content of grapevine leaf samples was measured by microwave plasma–atomic emission spectrometry (MP–AES) (Model: 4200, Agilent Inc., Santa Clara, MA, USA) fitted with the nitrogen generator (Agilent 4107 type), applied double pass cyclonic spray chamber and OneNeb inert flow blurring nebulizer. Determination of carbon, nitrogen, and sulphur was carried out with an Elementar VarioMAXcube CNS analyzer (Elementar Analysensysteme GmbH, Langenselbold, Germany). A total of 100.00 mg samples of dried and shredded leaf samples were weighed into ceramic crucibles and analyzed. Calibration was carried out with 100.00 mg sulfanilic acid (>99.0% CNS standard grade, Sigma Aldrich, St. Louis, MO, USA).
In order to determine grape maturity stage, 15 clusters were collected from each cultivar. Berries were destemmed, crunched, and pressed. After pressing the berries, three replicates of must for each variety were provided for analytical measurements (50 mL per replicate). Sugar, total acid, and alpha-amino nitrogen contents, as well as the pH of the must, were determined with a WineScan™ FT 120 instrument (FOSS Analytical, Hillerød, Denmark), following the manufacturer’s protocol.

4.6. Statistical Analysis

All statistical analyses were performed in the R environment. ASVs with <10 reads in a given sample were excluded from that sample. In addition, ASVs that occurred in only one sample were deleted to minimize artifactual sequences. Normalization of the fungal community matrix (rarefaction) was performed by random subsampling to the smallest library size (353,226 reads for berry, 577,274 reads for leaf samples). The rarefied matrices contained 857 berry and 1186 leaf fungal ASVs that served as input for the subsequent analyses. To assess the effect of cultivar on general saprotrophs, wood saprotrophs, litter saprotrophs, plant pathogens, mycoparasites, and commensal fungi, ASV richness and relative abundance of these functional groups were statistically compared using ANOVA and Tukey’s HSD test, and were graphically presented as boxplots using the ggplot2 R package [60]. Dissimilarities in composition among samples were visualized by non-metric multidimensional scaling analysis (NMDS) in the vegan R package [61], with Bray–Curtis distance measure on the Hellinger-transformed matrix. To estimate the amount of variation explained by the host cultivar, permutational multivariate analysis of variance (PerMANOVA) was carried out in the vegan R package. For leaf samples, we explored relationships between leaf mycobiome composition and measured leaf physiological parameters using linear regressions. For this purpose, we partitioned total beta diversity into replacement (i.e., turnover: the substitution of a species by a different one) and nestedness (where a poor community is the strict subset of a richer one) components. We used Sørensen dissimilarity as total beta diversity, and estimated the replacement (Simpson dissimilarity) and nestedness components on presence/absence data using the betapart R package [62]. We correlated the resulting pairwise Sørensen dissimilarity, Simpson dissimilarity, and nestedness values with pairwise differences of the measured physiological parameters. Physiological parameters were correlated with beta diversity measures individually, as well as a Euclidean distance matrix of the combined parameters standardized for mean and standard deviation. Indicator species analysis [63] was performed with the multipatt function in the indicspecies package [64], in order to identify characteristic fungal taxa for each cultivar.

Author Contributions

Conceptualization, Z.Z. and J.G., methodology, Z.Z. and J.G., investigation, A.M., A.G., C.M.L., G.K., A.M.T., S.V., L.M., M.C. and G.L., data curation, J.G. and A.M., formal analysis, J.G. and A.M., writing—original draft preparation, Z.Z., J.G. and A.M., writing—review and editing, Z.Z., J.G. and A.M., visualization, J.G. and A.M., supervision, Z.Z. and J.G., resources, G.L., Z.Z., J.G., funding acquisition, J.G. and Z.Z. All authors have read and agreed to the published version of the manuscript.

Funding

This research was funded by the Lendület Programme No. 96049 (Eötvös Loránd Research Network and Hungarian Academy of Sciences) and the “Research and development to improve sustainability and climate resilience of viticulture and oenology at the Eszterházy Károly Catholic University” (TKP2021-NKTA-16) grant from the National Research, Development, and Innovation Office.

Institutional Review Board Statement

Not applicable.

Data Availability Statement

DNA sequences of fungal ASVs generated in this study were deposited in GenBank (ON864449–ON865305 for berries and ON865306–ON866491 for leaves).

Conflicts of Interest

The authors declare no conflict of interest.

References

  1. Torregrosa, L.; Vialet, S.; Adivèze, A.; Iocco-Corena, P.; Thomas, M.R. Grapevine (Vitis vinifera L.). Methods Mol. Biol. 2015, 1224, 177–194. [Google Scholar] [PubMed]
  2. Pinto, C.; Pinho, D.; Sousa, S.; Pinheiro, M.; Egas, C.; Gomes, A.C. Unravelling the diversity of grapevine microbiome. PLoS ONE 2014, 9, e85622. [Google Scholar] [CrossRef] [PubMed] [Green Version]
  3. Stone, B.W.G.; Weingarten, E.A.; Jackson, C.R. The role of the phyllosphere microbiome in plant health hand function. Annu Plant Rev. Online 2018, 1, 533–556. [Google Scholar]
  4. van Niekerk, J.M.; Calitz, F.J.; Halleen, F.; Fourie, P.H. Temporal spore dispersal patterns of grapevine trunk pathogens in South Africa. Eur. J. Plant Pathol. 2010, 127, 375–390. [Google Scholar] [CrossRef]
  5. Zarraonaindia, I.; Owens, S.M.; Weisenhorn, P.; West, K.; Hampton-Marcell, J.; Lax, S.; Bokulich, N.A.; Mills, D.A.; Martin, G.; Taghavi, S.; et al. The soil microbiome influences grapevine-associated microbiota. mBio 2015, 6, e02527-14. [Google Scholar] [CrossRef] [PubMed] [Green Version]
  6. Francesca, N.; Canale, D.E.; Settanni, L.; Moschetti, G. Dissemination of wine-related yeasts by migratory birds. Environ. Microbiol. Rep. 2012, 4, 105–112. [Google Scholar] [CrossRef] [PubMed] [Green Version]
  7. Morris, C.E. Phyllosphere. In Encyclopedia of Life Sciences; Wiley: Chichester, UK, 2002. [Google Scholar] [CrossRef]
  8. Kinkel, L.L. Fungal community dynamics. In Microbial Ecology of Leaves; Andrews, J.H., Hirano, S.S., Eds.; Springer: New York, NY, USA, 1991; pp. 253–270. [Google Scholar]
  9. Pancher, M.; Ceol, M.; Corneo, P.E.; Longa, C.M.O.; Yousaf, S.; Pertot, I.; Campisano, A. Fungal endophytic communities in grapevines (Vitis vinifera L.) respond to crop management. Appl. Environ. Microbiol. 2012, 78, 4308–4317. [Google Scholar] [CrossRef] [PubMed] [Green Version]
  10. Perazzolli, M.; Antonielli, L.; Storari, M.; Puopolo, G.; Pancher, M.; Giovannini, O.; Pindo, M.; Pertot, I. Resilience of the natural phyllosphere microbiota of the grapevine to chemical and biological pesticides. Appl. Environ. Microbiol. 2014, 80, 3585–3596. [Google Scholar] [CrossRef] [PubMed] [Green Version]
  11. Setati, M.E.; Jacobson, D.; Bauer, F.F. Sequence-based analysis of the Vitis vinifera L. cv. Cabernet Sauvignon grape must mycobiome in three South African vineyards employing distinct agronomic systems. Front. Microbiol. 2015, 6, 1358. [Google Scholar] [CrossRef] [PubMed]
  12. Varanda, C.M.R.; Oliveira, M.; Materatski, P.; Landum, M.; Clara, M.I.E.; Félix, M.R. Fungal endophytic communities associated to the phyllosphere of grapevine cultivars under different types of management. Fungal Biol. 2016, 120, 1525–1536. [Google Scholar] [CrossRef] [PubMed]
  13. Castañeda, L.E.; Miura, T.; Sánchez, R.; Barbosa, O. Effects of agricultural management on phyllosphere fungal diversity in vineyards and the association with adjacent native forests. PeerJ 2018, 6, e5715. [Google Scholar] [CrossRef] [PubMed]
  14. Singh, P.; Santoni, S.; This, P.; Péros, J.P. Genotype-environment interaction shapes the microbial assemblage in grapevine’s phyllosphere and carposphere: An NGS approach. Microorganisms 2018, 6, 96. [Google Scholar] [CrossRef] [PubMed] [Green Version]
  15. Singh, P.; Gobbi, A.; Santoni, S.; Hansen, L.H.; This, P.; Péros, J.P. Assessing the impact of plant genetic diversity in shaping the microbial community structure of Vitis vinifera phyllosphere in the Mediterranean. Front. Life Sci. 2018, 11, 35–46. [Google Scholar] [CrossRef] [Green Version]
  16. Martínez-Diz, M.D.; Eichmeier, A.; Spetik, M.; Bujanda, R.; Díaz-Fernández, Á.; Díaz-Losada, E.; Gramaje, D. Grapevine pruning time affects natural wound colonization by wood-invading fungi. Fungal Ecol. 2020, 48, 100994. [Google Scholar] [CrossRef]
  17. Knapp, D.G.; Lázár, A.; Molnár, A.; Vajna, B.; Karácsony, Z.; Váczy, K.Z.; Kovács, G.M. Above-ground parts of white grapevine Vitis vinifera cv. Furmint share core members of the fungal microbiome. Environ. Microbiol. Rep. 2021, 13, 509–520. [Google Scholar] [CrossRef]
  18. Liu, D.; Howell, K. Community succession of the grapevine fungal microbiome in the annual growth cycle. Environ. Microbiol. 2021, 23, 1842–1857. [Google Scholar] [CrossRef] [PubMed]
  19. Geiger, A.; Karácsony, Z.; Golen, R.; Váczy, K.Z.; Geml, J. The compositional turnover of grapevine-associated plant pathogenic fungal communities is greater among intraindividual microhabitats and terroirs than among healthy and Esca-diseased plants. Phytopathology 2022, 112, 1029–1035. [Google Scholar] [CrossRef] [PubMed]
  20. Müller, T.; Ruppel, S. Progress in cultivation-independent phyllosphere microbiology. FEMS Microbiol. Ecol. 2014, 87, 2–17. [Google Scholar] [CrossRef]
  21. Balint, M.; Tiffin, P.; Hallström, B.; O’Hara, R.B.; Olson, M.S.; Fankhauser, J.D.; Piepenbring, M.; Schmitt, I. Host genotype shapes the foliar fungal microbiome of balsam poplar (Populus balsamifera). PLoS ONE 2013, 8, e53987. [Google Scholar] [CrossRef] [PubMed] [Green Version]
  22. Carbonneau, A. Aspects qualitatifs. In Traite D’irrigation; Tiercelin, J.R., Ed.; Tec & Doc. Lavosier Ed: Paris, France, 1998; pp. 258–276. [Google Scholar]
  23. Deloire, A.; Carbonneau, A.; Wang, Z.; Ojeda, H. Vine and water: A short review. OENO One 2004, 38, 1–13. [Google Scholar] [CrossRef] [Green Version]
  24. Adamo, I.; Ortiz-Malavasi, E.; Chazdon, R.; Chaverri, P.; ter Steege, H.; Geml, J. Soil fungal community composition correlates with site-specific abiotic factors, tree community structure, and forest age in regenerating tropical rainforests. Biology 2021, 10, 1120. [Google Scholar] [CrossRef] [PubMed]
  25. Fanin, N.; Lin, D.; Freschet, G.T.; Keiser, A.D.; Augusto, L.; Wardle, D.A.; Veen, G.F. Home-field advantage of litter decomposition: From the phyllosphere to the soil. New Phytol. 2021, 231, 1353–1358. [Google Scholar] [CrossRef] [PubMed]
  26. Sapkota, R.; Knorr, K.; Jørgensen, L.N.; O’Hanlon, K.A.; Nicolaisen, M. Host genotype is an important determinant of the cereal phyllosphere mycobiome. New Phytol. 2015, 207, 1134–1144. [Google Scholar] [CrossRef] [PubMed]
  27. Tedersoo, L.; Bahram, M.; Põlme, S.; Kõljalg, U.; Yorou, N.S.; Wijesundera, R.; Villarreal Ruiz, L.; Vasco-Palacios, A.M.; Thu, P.Q.; Suija, A.; et al. Fungal biogeography. Global diversity and geography of soil fungi. Science 2014, 28, 346. [Google Scholar]
  28. Geml, J. Soil fungal communities reflect aspect-driven environmental structuring and vegetation types in a Pannonian forest landscape. Fungal Ecol. 2019, 39, 63–79. [Google Scholar] [CrossRef]
  29. Větrovský, T.; Kohout, P.; Kopecky, M.; Machac, A.; Man, M.; Bahnmann, B.D.; Brabcová, V.; Choi, J.; Mészárosová, L.; Human, Z.R.; et al. A meta-analysis of global fungal distribution reveals climate-driven patterns. Nat. Commun. 2019, 10, 5142. [Google Scholar] [CrossRef] [Green Version]
  30. Geml, J.; Arnold, A.E.; Semenova-Nelsen, T.A.; Nouhra, E.R.; Drechsler-Santos, E.R.; Góes-Neto, A.; Morgado, L.N.; Ódor, P.; Hegyi, B.; Grau, O.; et al. Community dynamics of soil-borne fungal communities along elevation gradients in neotropical and paleotropical forests. Mol. Ecol. 2022, 31, 2044–2060. [Google Scholar] [CrossRef]
  31. Gautier, A.T.; Merlin, I.; Doumas, P.; Cochetel, N.; Mollier, A.; Vivin, P.; Lauvergeat, V.; P’eret, B.; Cookson, S.J. Identifying roles of the scion and the rootstock in regulating plant development and functioning under different phosphorus supplies in grapevine. Environ. Exp. Bot. 2021, 185, 104405. [Google Scholar] [CrossRef]
  32. Verdenal, T.; Dienes-Nagy, Á.; Spangenberg, J.E.; Zufferey, V.; Spring, J.-L.; Viret, O.; Marin-Carbonne, J.; van Leeuwen, C. Understanding and managing nitrogen nutrition in grapevine: A review. OENO One 2021, 55, 1–43. [Google Scholar] [CrossRef]
  33. Lekberg, Y.; Arnillas, C.A.; Borer, E.T.; Bullington, L.S.; Fierer, N.; Kennedy, P.G.; Leff, J.W.; Luis, A.D.; Seabloom, E.W.; Henning, J.A. Nitrogen and phosphorus fertilization consistently favor pathogenic over mutualistic fungi in grassland soils. Nat. Commun. 2021, 12, 3484. [Google Scholar] [CrossRef]
  34. Simón, M.R.; Fleitas, M.C.; Castro, A.C.; Schierenbeck, M. How foliar fungal diseases affect nitrogen dynamics, milling, and end-use quality of wheat. Front. Plant Sci. 2020, 11, 569401. [Google Scholar] [CrossRef] [PubMed]
  35. Snoeijers, S.S.; Perez-Garcia, A.; Joosten, M.H.A.J.; De Wit, P.J.G.M. The effect of nitrogen on disease development and gene expression in bacterial and fungal plant pathogens. Eur. J. Plant Pathol. 2000, 106, 493–506. [Google Scholar] [CrossRef]
  36. Hoffland, E.; Jeger, M.J.; van Beusichem, M.L. Effect of nitrogen supply rate on disease resistance in tomato depends on the pathogen. Plant Soil 2000, 218, 239–247. [Google Scholar] [CrossRef]
  37. Neumann, S.; Paveley, N.D.; Beed, F.D.; Sylvester-Bradley, R. Nitrogen per unit leaf area affects the upper asymptote of Puccinia striiformis f. sp. tritici epidemics in winter wheat. Plant Pathol. 2004, 53, 725–732. [Google Scholar]
  38. Solomon, P.S.; Tan, K.C.; Oliver, R.P. The nutrient supply of pathogenic fungi; fertile field for study. Mol. Plant Pathol. 2003, 4, 203–210. [Google Scholar] [CrossRef]
  39. Zanetti, G.; Pandini, V. Ferredoxin. In Encyclopedia of Biological Chemistry II, 2nd ed.; Lennarz, W.J., Lane, M.D., Eds.; Academic Press, Elsevier Inc.: London, UK, 2013; pp. 296–298. [Google Scholar]
  40. Roy, A.; Kumar, A.; Baruah, D.; Tamuli, R. Calcium signaling is involved in diverse cellular processes in fungi. Mycology 2020, 12, 10–24. [Google Scholar] [CrossRef]
  41. Sala, F.; Blidariu, C. Macro- and micronutrient content in grapevine cordons under the influence of organic and mineral fertilization. Bulletin UASVM. Horticulture 2012, 69, 317–324. [Google Scholar]
  42. Capps, E.R. The Relationship between Mineral Nutrition and Late-Season Bunch Stem Necrosis of Cabernet Sauvignon (Vitis vinifera L.) Grapevines. Master’s Thesis, Virginia Polytechnic Institute and State University, Blacksburg, VA, USA, 1999. [Google Scholar]
  43. Nagy, R.; Zsófi, Z.; Papp, I.; Földvári, M.; Kerényi, A.; Szabó, S. Evaluation of the relationship between soil erosion and the mineral composition of the soil: A case study from a cool climate wine region of Hungary. Carpathian J. Earth Environ. Sci. 2012, 7, 223–230. [Google Scholar]
  44. Kocsis, M.; Ayaydin, F.; Kőrösi, L.; Teszlák, P.; Radványi, L.; Jakab, G.; Hideg, É. Contrasting acclimation mechanisms of berry color variant grapevine cultivars (Vitis vinifera L. cv. Furmint) to natural sunlight conditions. Acta Physiol. Plant 2017, 39, 178. [Google Scholar] [CrossRef]
  45. Hajdu, E. Breeding of Kadarka. Horticulture 2010, 42, 27–37. [Google Scholar]
  46. Vouillamoz, J.F.; Grando, M.S. Genealogy of wine grape cultivars: ‘Pinot’ is related to ‘Syrah’. Heredity 2006, 97, 102–110. [Google Scholar] [CrossRef] [PubMed] [Green Version]
  47. Németh, M. Ampelográfiai Album—Termesztett Borszőlőfajták 1; Mezőgazdasági Kiadó: Budapest, Hungary, 1967. [Google Scholar]
  48. Bowers, J.E.; Siret, R.; Meredith, C.P.; This, P.; Boursiquot, J.M. A single pair of parents proposed for a group of grapevine varieties in Northeastern France. Acta Hortic. 2000, 528, 129–132. [Google Scholar] [CrossRef]
  49. Organisation Internationale de la Vigne et du Vin (OIV). OIV Descriptor List for Grape Varieties and Vitis Species, 2nd ed.; OIV: Paris, France, 2009. [Google Scholar]
  50. Scholander, P.F.; Hammel, H.T.; Bradstreet, E.D.; Hemmingsen, E.A. Sap pressure in vascular plants. Science 1965, 148, 339–346. [Google Scholar] [CrossRef] [PubMed]
  51. Ihrmark, K.; Bödeker, I.T.M.; Cruz-Martinez, K.; Friberg, H.; Kubartova, A.; Schenck, J.; Strid, Y.; Stenlid, J.; Brandström-Durling, M.; Clemmensen, K.E.; et al. New primers to amplify the fungal ITS2 region–evaluation by 454-sequencing of artificial and natural communities. FEMS Microbiol. Ecol. 2012, 82, 666–677. [Google Scholar] [CrossRef] [PubMed]
  52. White, T.M.; Bruns, T.; Lee, S.; Taylor, J. Amplification and direct sequencing of fungal ribosomal RNA for phylogenetics. In PCR Protocols: A Guide to Methods and Applications; Innis, M.A., Gelfand, D.H., Sninsky, J.J., White, T.J., Eds.; Academic Press: San Diego, CA, USA, 1990; pp. 315–321. [Google Scholar]
  53. Callahan, B.; McMurdie, P.; Rosen, M. DADA2: High-resolution sample inference from Illumina amplicon data. Nat. Methods 2016, 13, 581–583. [Google Scholar] [CrossRef] [Green Version]
  54. Edgar, R.C. Search and clustering orders of magnitude faster than BLAST. Bioinformatics 2010, 26, 2460–2461. [Google Scholar] [CrossRef] [Green Version]
  55. Kõljalg, U.; Nilsson, R.H.; Abarenkov, K.; Tedersoo, L.; Taylor, A.F.; Bahram, M.; Bates, S.T.; Bruns, T.D.; Bengtsson-Palme, J.; Callaghan, T.M. Towards a unified paradigm for sequence-based identification of Fungi. Mol. Ecol. 2013, 22, 5271–5277. [Google Scholar] [CrossRef] [Green Version]
  56. Põlme, S.; Abarenkov, K.; Nilsson, R.H.; Lindahl, B.D.; Clemmensen, K.; Kauserud, H.; Nguyen, N.; Kjoller, R.; Bates, S.T.; Baldrian, P. FungalTraits: A user-friendly traits database of fungi and fungus-like stramenopiles. Fungal Divers. 2020, 105, 1–16. [Google Scholar] [CrossRef]
  57. Sreenivasulu, V.; Kumar, N.S.; Dharmendra, V.; Asif, M.; Balaram, V.; Zhengxu, H.; Zhen, Z. Determination of Boron, Phosphorus, and Molybdenum Content in Biosludge Samples by Microwave Plasma Atomic Emission Spectrometry (MP-AES). Appl. Sci. 2017, 7, 264. [Google Scholar]
  58. Dharmendra, V. Total metals analysis of digested plant tissue using an Agilent 4200 Microwave. In Microwave Plasma Atomic Emission Spectroscopy (MP-AES). Application eHandbook; Agilent Technologies Plasma-AES: New Delhi, India, 2016; pp. 69–71. [Google Scholar]
  59. Liberato, C.G.; Barros, J.A.V.A.; Virgilio, A.; Machado, R.C.; Nogueira, A.R.A.; Nóbrega, J.A.; Schiavo, D. Determination of Macro and Micronutrients in Plants Using the Agilent 4200 MP AES; Agilent Technologies: New Delhi, India, 2017; pp. 1–5. [Google Scholar]
  60. Wickham, H. ggplot2: Elegant Graphics for Data Analysis; Springer: New York, NY, USA, 2016; ISBN 978-3-319-24277-4. Available online: https://ggplot2.tidyverse.org (accessed on 25 February 2022).
  61. Oksanen, J.; Blanchet, F.G.; Kindt, R.; Legendre, P.; Minchin, P.R.; O’Hara, R.; Simpson, G.L.; Solymos, P.; Stevens, M.H.H.; Szoecs, E. Package ‘Vegan’. Community Ecology Package, Version 2. 2013. Available online: http://CRAN.R-project.org/package=vegan (accessed on 25 February 2022).
  62. Baselga, A.; Orme, C.D.L. betapart: An R package for the study of beta diversity. Methods Ecol. Evol. 2012, 3, 808–812. [Google Scholar] [CrossRef]
  63. Dufrêne, M.; Legendre, P. Species assemblages and indicator species: The need for a flexible asymmetrical approach. Ecol. Monogr. 1997, 67, 345–366. [Google Scholar] [CrossRef]
  64. De Cáceres, M.; Legendre, P.; Wiser, S.K.; Brotons, L. Using species combinations in indicator analyses. Methods Ecol. Evol. 2012, 3, 973–982. [Google Scholar] [CrossRef]
Publisher’s Note: MDPI stays neutral with regard to jurisdictional claims in published maps and institutional affiliations.

Article Metrics

Citations

Article Access Statistics

Multiple requests from the same IP address are counted as one view.