Abstract
Growth-regulating factors (GRFs) encode plant-specific transcription factors that play a vital role in regulation of plant growth, development, and stress response. Although GRFs have been identified in various plants, there is no reported work available in Actinidia (commonly known as kiwifruit) so far. In the present study, we identified 22 GRF genes on A. chinensis (hereafter A. chinensis is referred to as Ac, and GRF genes in A. chinensis are referred to as AcGRF) distributed on 17 chromosomes and one contig, and 26 GRF genes in A. eriantha (hereafter A. eriantha is referred to as Ae, and GRF genes in A. eriantha are referred to as AeGRF) distributed on 21 chromosomes. Phylogenetic analysis showed that kiwifruit GRF proteins were clustered into five distinct groups. Additionally, kiwifruit GRFs showed motif composition and gene structure similarities within the same group. Synteny analysis showed that whole-genome duplication played a key role in the expansion of the GRF family in kiwifruit. The higher expression levels of kiwifruit GRFs in young tissues and under stress conditions indicated their regulatory role in kiwifruit growth and development. We observed two genes in Ae (AeGRF6.1, AeGRF6.2) and two genes in Ac (AcGRF6.1, AeGRF6.2) significantly upregulated in different RNA-seq datasets. The presence of conserved protein structures and cis-regulatory elements caused functional divergence in duplicated gene pairs. The subcellular localization indicated the presence of kiwifruit GRFs in the nucleus of the plant cell. Protein-protein interaction analysis predicted AtGIF protein orthologs for AcGRFs and AeGRFs. Taken together, we systematically analyzed the characterization of kiwifruit GRF family members for their potential role in kiwifruit development and Pseudomonas syringae pv. actinidiae (Psa.) invasion response. Further functional studies of kiwifruit GRFs in plant growth, development, and stress response will provide valuable insights for kiwifruit breeders.
1. Introduction
Transcription factors (TFs) are well known for their regulatory roles in plants. Growth regulating factors (GRFs) are plant-specific TFs that regulate growth, development, and abiotic stress tolerance [1]. The GRF gene was first reported in rice (OsGRF1) which encodes a protein for gibberellin to promote stem elongation [2]. Since then, there has been extensive work on the identification and evolutionary analysis of the GRF gene family in various plant species. So far, researchers have identified nine GRF members in Arabidopsis thaliana [3], 12 in Oryza sativa [4], 14 in Zea mays [5], 10 in Brachypodium distachyon [6], 30 in Triticum aestivum [7], 35 in Brassica napus [8], 22 in Glycine max [9], and 10 in Jatropha curcus [10].
Numerous studies on GRF members in plants demonstrated that there are two highly conserved domains (QLQ and WRC) present in the N-terminal. The QLQ (Gln, Leu, Gln, IPR014978) domain, present on the SW12/SNF2 protein, is specific for protein-protein interaction, while WRC (Trp, Arg, Cys, IPR014977) is a plant-specific domain that possesses a C3H motif for DNA binding [4,11]. In contrast to the conserved nature of the N-terminal, the C-terminal in GRFs is composed of variable amino acid residue and is responsible for transcriptional activation. Additionally, the C-terminal of GRF proteins also contains some less conserved motifs such as TQL (Thr, Gln, Leu) and FFD (Phe, Phe, Asp) [5,12].
Previous findings have demonstrated the involvement of GRF in plant growth and development. Members of the GRF family are highly expressed in young plant tissues indicating their regulatory role in plant tissue and organ formation [13]. Arabidopsis and rice GRF mutants exhibited dwarfism [14,15]. The rice plants overexpressing GRF exhibited increased growth parameters [16]. The AtGRF7 interacted with DREB2A (dehydration responsive element-binding protein 2A) to regulate the osmotic stress response in A. thaliana [1]. Furthermore, the GRFs control the root growth, flower development, and size of seeds in plants [17]. The GRFs are regulated by miR396 to control the growth and development of plants [18]. Additionally, the GRF-GIF (GRF- interacting factors) transcriptional complex regulates the size of leaf and plant architecture [19].
The genus Actinida (kiwifruit), originating in the Yangtze river valley in China, is an economically important fruit plant comprised of 54 species and 75 taxa [20]. The economically important horticultural species within Actinidia include A. chinensis Planchon, A. deliciosa (A. chinensis var. deliciosa A. Chevalier), A. arguta (Siebold and Zuccarini) Planchon ex Miquel, and A. eriantha Bentham [21]. All Actinida species are perennial, deciduous, and dioecious with climbing or straggling growth habit. Most of the kiwifruit species are reticulate polyploids with a chromosome number of x = 29 [22]. The kiwifruit is gaining popularity among consumers owing to its high vitamin C, mineral contents, and vibrant colors of fruit flesh [23]. So far, there is no reported knowledge available on systematic investigation and functional analysis of the GRF gene family in kiwifruit. Therefore, the present study was designed to comprehensively analyze the structure and expression of GRF family members in previously reported whole genomes of A. erinatha (green-fleshed cultivar ‘White’, hereafter referred to as Ae) and A. chinensis (red-fleshed cultivar ‘Hongyang’, hereafter referred to as Ac) [24,25]. Current findings will provide valuable insights into the structure, function, and evolution of GRF family members in both kiwifruit species.
2. Results
2.1. Identification of Kiwifruit GRFs
Based on the Hidden Markov Model (HMM) of WRC and QLQ domains, we identified a total of 26 proteins from Ae genome (A. eriantha, proteins named as AeGRF) and 22 proteins from Ac genome (A. chinensis, proteins named as AcGRF) (Figure 1 and Figure S1). The proteins in both kiwifruit genomes were named after their A. thaliana homologs. All the proteins contained both conserved domains except AeGRF2.2, AeGRF1.2, AcGRF2.1, AcGRF9, AeGRF9.1, AeGRF9.2, AeGRF9.3, AeGRF5.1, AeGRF3.2, and AeGRF5.2, which contained only one of the conserved domains. The coding sequences (CDS) length in AeGRFs and AcGRFs ranged between 522–1644 bp and 588–1773 bp, respectively. The length of putative AeGRF and AcGRF proteins were between 173–547 aa and 195–590 aa, respectively. The molecular weight (MW) of AeGRF and AcGRF proteins ranged between 19.42–59.45 kDa and 21.55–62.20 kDa, respectively. Moreover, the theoretical isoelectric point (pI) for AeGRF and AcGRF proteins varied between 5.8–9.69 and 6.31–9.70, respectively. The grand average of hydropathy (GRAVY) for AeGRF and AcGRF proteins ranged from −0.31 to −1.18 and −0.28 to −0.94, respectively (Table S1). The sub-cellular localization analysis predicted all kiwifruit GRF proteins localized in the nucleus of plant cells.
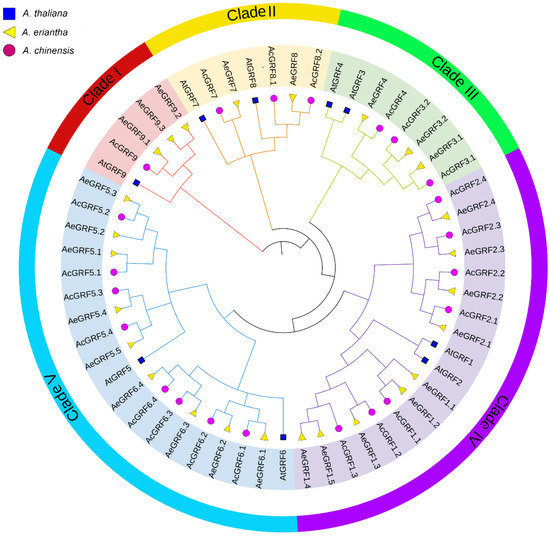
Figure 1.
Phylogenetic analysis of AcGRF and AeGRF and AtGRF proteins. Each clade is represented by a different color. The circle shape denotes AcGRF proteins, the triangle shape represents AeGRF proteins and the square shape represents AtGRF proteins.
2.2. Sequence and Phylogenetic Analysis of Kiwifruit GRFs
All the kiwifruit GRF proteins contained one or both QLQ and WRC conserved domains or in their N-terminal regions (Figure S1). To gain insights into evolutionary relationships among kiwifruit GRFs, a phylogenetic tree was constructed by the neighbor-joining method for AtGRF (9), AeGRF (26), and AcGRF (22) proteins. All 55 proteins from different species were clustered into five clades (I–V) (Figure 1). Each clade contained proteins from all three species. Among five clades, clades I, II, and III were relatively small and contained five, seven, and eight proteins, respectively. By contrast, clade IV and V contained relatively large number of proteins (18 proteins in clades IV and 19 proteins in clade V). The phylogenetic tree suggested that kiwifruit GRFs showed a close relationship with AtGRFs partially because of the same dicotyledonous nature (Figure 1).
2.3. Chromosomal Localization of Kiwifruit GRFs
Kiwifruit GRF genes were unevenly distributed across the chromosomes (Figure 2). Results showed that 22 AcGRFs were distributed on 17 chromosomes and one contig. All the chromosomes contained only one gene except Chr 05, 08, 09, 11, and 14 which contained two genes on each chromosome (Figure 2A and Figure S2A). Similarly, the 26 AeGRFs were distributed on 21 chromosomes. All chromosomes contained only one gene except LG 00, 06, 25, and 27 which possessed two genes on each chromosome (Figure 2B and Figure S2B).
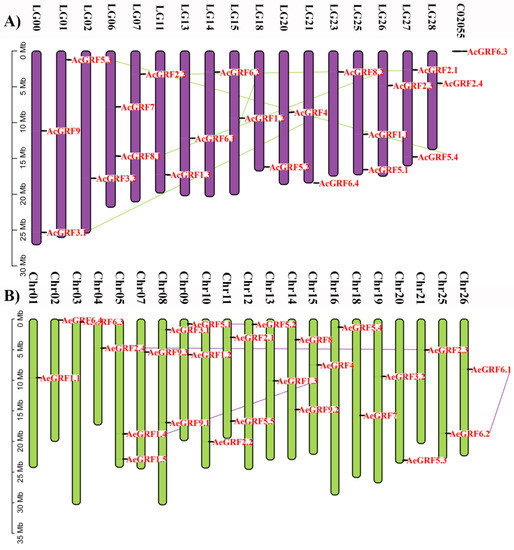
Figure 2.
Chromosomal distribution of (A) AcGRF genes, and (B) AeGRF genes. The colored lines in the background show homologous gene pairs.
2.4. Structural Analysis of Kiwifruit GRFs
We analyzed gene structure and motif characteristics to further explore the evolutionary relationship among kiwifruit GRF genes. The exon-intron analysis provides clues about the functional diversification of members of a gene family. The exon-intron number in kiwifruit GRFs ranged between 1–6. The AcGR2.1 possessed a higher exon-intron number among all kiwifruit GRFs (Figure 3A and Figure S3). The MEME web server and Pfam database were employed to predict conserved domains and motifs in kiwifruit GRFs. All kiwifruit GRFs contained one or both QLQ and WRC conserved domain in their N-terminal region (Figure 3B). In total, 15 conserved motifs were predicted in kiwifruit GRFs. The maximum number of conserved motifs on single kiwifruit GRF ranged from 1 to 13. The GRFs belonging to the same clade have a similar motif composition. The clade III contained the maximum number of motifs, while clade I contained the minimum number. Additionally, some motifs appeared only in a specific clade. For example, purple and orange colored motifs are unique to clade III and V. Overall, structural analysis strongly supported the inferred phylogenetic relationships of kiwifruit GRFs (Figure 3C). The Logos for all conserved motifs in kiwifruit GRFs are presented in (Figure S4) and the sequences for motifs are presented in (Table S3).
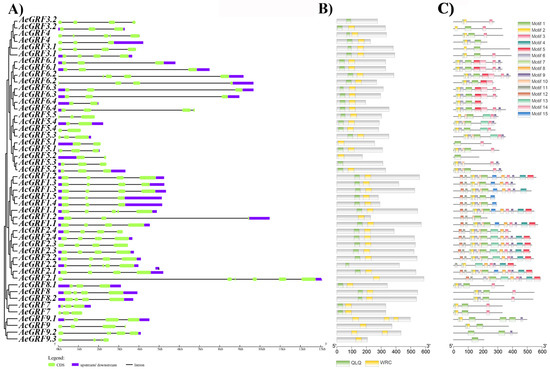
Figure 3.
Structural analysis of kiwifruit GRFs. (A) Exon-intron analysis, (B) Identification of conserved domains, (C) Prediction of conserved motifs. The motif sequences are presented in Table S4.
2.5. Collinearity Analysis of Kiwifruit GRFs
To show the syntenic relationships, the whole genomes of Ac and Ae were aligned by Blastp to do an all-to-all blast and analyzed with MCScanX software for identification of syntenic blocks and duplicated gene pairs. The comparison between Ae vs. Ac genomes resulted in the identification of 27 ortholog gene pairs (Figure 4A). Similarly, the comparison between Ac vs. Ac resulted in six paralog gene pairs, and the comparison between Ae vs. Ae genomes resulted in five paralog gene pairs (Figure 4B). Gene duplication is an important phenomenon that forms a cornerstone for genetic novelty in plants and expansion or contraction of gene families. For an instance, over 90% of functional and developmental genes in A. thaliana have evolved by gene duplication [26]. The most common way to measure the ongoing adaptive evolution in genes is by calculating the ratio of non-synonymous (Ka) to synonymous (Ks) nucleotide substitution in duplicated gene pairs. We determined the selection pressure in duplicated gene pairs of kiwifruit GRF by calculating Ka, Ks, Ka/Ks, and T (divergence time). Generally, Ka/Ks >1 indicates positive selection, Ka/Ks = 1 represents neutral selection, and Ka/Ks < 1 denotes purifying selection [27]. Our results showed Ka/Ks < 1 for all paralog and ortholog gene pairs except AeGRF5.5/AcGRF5.4, suggesting that purifying selection was the main source of evolution for the kiwifruit GRF family (Figure 4C). The divergence time for AcGRF and AeGRF paralog gene pairs ranged between 15.25–50.87 and 19.97–79.55 MYA, respectively. Similarly, the divergence time for ortholog gene pairs between Ac and Ae genomes ranged from 3.29 to 33.83. Additionally, the divergence time for GRF ortholog gene pairs between Ac and Ae genomes was the smallest, while the divergence time of GRF paralog gene pairs in Ae was the greatest (Figure 4D and Table S2).
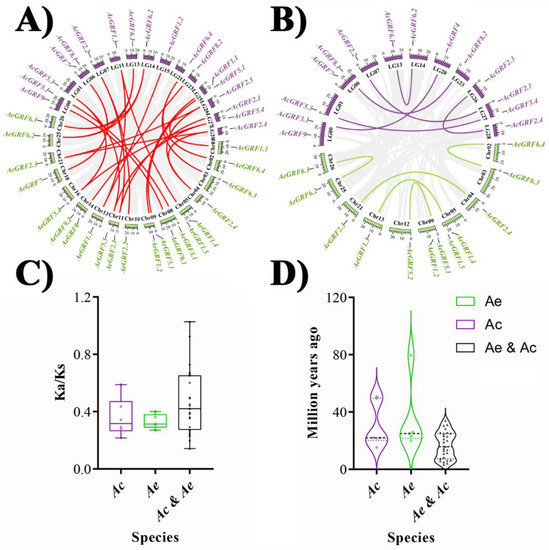
Figure 4.
Collinearity analysis for kiwifruit GRFs. (A) Identification of ortholog gene pairs for Ae vs. Ac genomes. (B) Identification of paralog genes pairs for Ac vs. Ac genomes and Ae vs. Ae genomes. (C) Selection pressure calculation for GRF ortholog and paralog gene pairs between and within Ae and Ac genomes. (D) Calculation of divergence time (T). The grey lines in the background indicate all syntenic blocks between and within Ae and Ac genome, and colored lines indicate syntenic kiwifruit GRFs gene pairs.
2.6. Expression Analysis of Kiwifruit GRFs
To investigate the expression analysis of kiwifruit GRF genes, we obtained three RNA-seq datasets from KGD and re-analyzed them. The first RNA-seq dataset was carried out in Ac and Ae under Psa. invasion, and in leaves, roots, and stems of Ac. Results showed 11 genes highly expressed in both kiwifruit species under Psa. invasion, and 12 GRFs significantly expressed in leaves, roots, and stems of Ac. However, the expression profile for GRF genes was relatively stronger in Ae compared to Ac under Psa. invasion (Figure 5A and Figure S5A). In the second RNA-seq dataset, the eight GRFs from Ac were specifically expressed in immature fruit. In contrast, AcGRF7 and AcGRF8.2 were highly expressed in ripen fruit of Ac. We also observed a few genes weakly expressed in mature fruit (Figure S5B). The third RNA-seq dataset consists of samples taken at different time points from Ac and Ae under Psa. invasion. The results showed that eight AcGRF transcripts were specifically expressed in samples taken from Ac and Ae (Figure S5C). Interestingly, most of the highly expressing kiwifruit GRFs had a close phylogenetic relationship, indicating their functional similarities in kiwifruit. We selected nine highly expressing genes commonly found in all RNA-seq datasets. Then, we did RT-qPCR for these genes to confirm their expression levels in young leaves (YL), old leaves (OL), and calluses under light (LC) and dark (DC) treatment (Figure 5B). The results showed a highly tissue-specific expression profile for selected genes. Most of the genes showed higher expression in young leaves and calluses. Interestingly, the expression profile for most of GRFs was relatively higher in young leaves and callus under dark conditions, indicating their vital role in plant growth and response to stress conditions (Figure 5C).
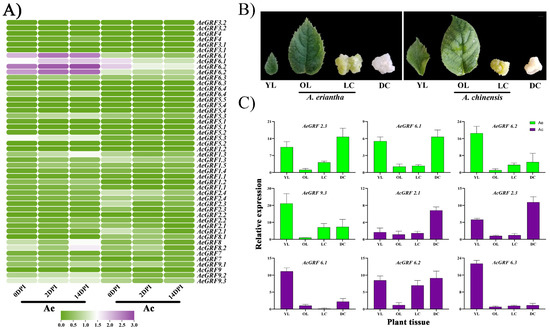
Figure 5.
Expression analysis of GRFs in kiwifruit. (A) Heatmap for 22 AcGRFs and 26 AeGRFs under Psa. invasion in Ac and Ae. (B) Phenotype for different kiwifruit tissues used for RT-qPCR analysis. (C) RT-qPCR analysis for nine highly expressed genes from four different RNA-seq datasets. The YL stands for young leaves, OL stands for old leaves, LC stands for callus under light treatment, DC stands for callus under dark treatment, and DPI stands for days post-inoculation of Psa.
2.7. Promoter Analysis in Kiwifruit GRFs
Finding cis-regulatory elements in the promoter region provide insights into the regulation of downstream genes. In the present study, we did promoter analysis in the 1000 bp upstream promoter region to find out potential cis-regulatory elements responsible for the regulation of kiwifruit GRFs. Our results showed seven growth and development responsive elements, seven defense responsive elements, five phytohormones responsive elements and two storage protein responsive elements in kiwifruit GRFs. The cis-regulatory element distribution in the upstream promoter region of nine highly expressing kiwifruit GRFs is given in (Table 1) and for all kiwifruit GRFs is given in (Figure S6). The results showed that cis-elements were randomly distributed in promoter regions of kiwifruit GRFs. For example, circadian cycle responsive element (CCRE) was present only in AeGRF2.1. Similarly, wound responsive element (WRE) was found only in AeGRF6.2. In contrast, light-responsive elements (LRE) were abundantly present in all kiwifruit GRFs.

Table 1.
Prediction of cis-regulatory elements in the upstream promoter region of nine highly expressing kiwifruit GRFs from different RNA-seq datasets of kiwifruits. A list of full names for acronyms is added in Table S4.
2.8. Protein-Protein Association and Protein Structure Analysis
STRING database was employed to predict protein-protein interaction association by finding kiwifruit GRFs orthologs in A. thaliana. Results for Ac proteins showed that AcGRF 2.1, 2.3, 6.1, 6.2, and 6.3 showed association with AN3 (GIF1) and GIF2 (Figure 6A). Similarly, AeGRF 2.3, 6.1, 6.2, and 9.3 showed association with AN3 (GIF1), GIF2, and GIF 3 (Figure 6B). These results indicated that the above-mentioned proteins have affinity to form GRF-GIF regulatory complex in kiwifruit. Three-dimensional structures of nine highly expressing proteins from different RNA-seq datasets were predicted and visualized by Phyre 2 online tool. The results showed highly similar structures for all selected AcGRF and AeGRF proteins, indicating their functional similarity in kiwifruit (Figure S7).
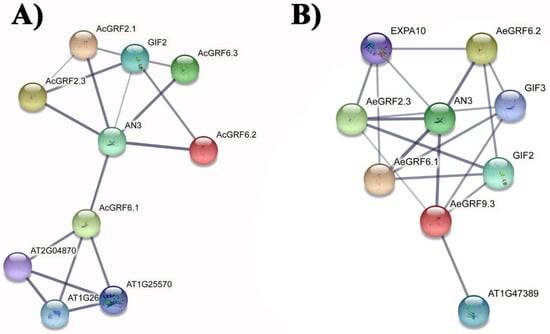
Figure 6.
Prediction of protein-protein interaction networks for kiwifruit GRFs based on A. thaliana orthologs. (A) Protein-protein interaction networks for AcGRF proteins. (B) Protein-protein interaction networks for AcGRF proteins. Grey line thickness indicates the strength of protein-protein interaction.
3. Discussion
Whole-genome sequencing has been done in many plants owing to the rapid development of sequencing technologies [28,29]. Growth-regulating factors (GRFs) are plant-specific regulation factors responsible for regulation of growth and development in plants under normal and stress conditions [30]. The number of GRFs in plants varies between 8–20, however it is less in lower plant taxa (only two GRFs in mosses) [31]. Due to the unavailability of reported knowledge, it was prudent to carry out identification and characterization of GRFs in kiwifruit.
3.1. Identification of Kiwifruit GRFs and Gene Structure Analysis
In the present study, we identified 22 AcGRFs and 26 AeGRFs in whole genomes of Ac and Ae, respectively. Gene structure provides valuable insights into gene functioning in plants. Previously, two highly conserved domains QLQ and WRC has been reported in N-terminal of A. thaliana GRF proteins [3]. The QLQ domain is specific for interacting with GIF, while the WRC domain acts as a transcriptional regulator by interacting with cis-regulatory elements of downstream genes. We observed some kiwifruit GRFs lacking one of the conserved domains, however, it will be interesting to know if GRFs with a single conserved domain play a role similar to GRFs with both conserved domains. It is believed that some less conserved domains (TQL, GGPL, and FFD) in the C-terminal possibly can play a role in functional diversification of some GRFs [11]; therefore, it is important to consider the C-terminal while assessing the function of kiwifruit GRFs. The divergence in coding or non-coding region of genes is a key step to understand their functional and evolutionary relationships [32]. Additionally, the gain or loss of introns and exons brings functional differences in genes. We observed two to four intron/exons in kiwifruit GRFs similar to A. thaliana. Almost 50% of kiwifruit GRFs contained three introns and four exons, indicating that kiwifruit GRFs have highly conserved structural evolution.
3.2. Phylogenetic Analysis in Kiwifruit GRFs
Previously, the different phylogenetic groups in monocots and dicots indicated the differences in evolution patterns and gene characteristics of GRFs in both plant groups [3,5,8,11]. We observed five distinct phylogenetic groups in kiwifruit similar to A. thaliana due to the dicotyledonous nature of both plants. Additionally, the phylogenetic group VI and V in kiwifruit were larger in number than other groups (I, II, and III), implying the occurrence of independent events of gene gain/loss in these groups.
3.3. Gene Duplication/Deletion Analysis in Kiwifruit GRFs
The whole genomes (Ae and Ac) used in this study belong to diploid kiwifruit, and logically, they must have one extra copy of a gene for each homolog of A. thaliana. However, some genes in Ac only have a single copy (for example AcGRF9) and others have several copies in both genomes, indicating that kiwifruit genomes underwent intensive genome gain and loss events. Gene duplication events play a major role in the formation of gene families. Although the kiwifruit genomes were five times larger in size than the A. thaliana genome (Ae = 690.6 Mb, Ac = 616.1 Mb, and A. thaliana = 125 Mb) [22,24,33], the kiwifruit GRFs (26 members in Ae and 22 members in Ac) were only three times higher in number than A. thaliana (nine genes), indicating a significant amount of genome loss during duplication/deletion events in kiwifruit. Previous results indicated the occurrence of whole-genome triplication events in kiwifruit similar to the eudicot ancestors [34]. In the present study, we observed whole-genome duplication a major source of kiwifruit GRFs evolution. The kiwifruit GRFs showed strong collinearity and homology both within and between the species. Additionally, the purification selection was the main source of evolution in kiwifruit GRFs. The non-synonymous (Ks) mutations are a limiting factor for determining the type of selection in gene pairs. An increase or decrease in non-synonymous mutations will affect the final results. In case of our results, lower non-synonymous mutations (Ks) in ortholog and paralog gene pairs played a key role in identifying the purification selection that occurred in them. The above-mentioned phenomena indicated that kiwifruit GRFs followed a highly conservative evolution model.
3.4. Gene Expression Analysis
Previously, researchers reported higher expression levels of plant GRFs in actively developing tissues than in mature tissues [31,35]. For example, altered expression of AtGRFs caused significant changes in growth phenotypes of plants [11,36,37]. Similarly, the application of plant growth hormones and various stress conditions also altered the expression profile of GRFs in plants [1,38,39]. In the present study, higher expression levels of kiwifruit GRFs in immature tissue and under Psa. invasion indicated their regulatory role in plant growth, development, and stress tolerance. The presence of stress and growth-related cis-regulatory element in the promoter region of kiwifruit GRFs complimented their higher expression levels in transcriptomic data. Similarly, the higher expression levels of selected kiwifruit GRFs observed by RT-qPCR in actively dividing cells of callus and young leaves not only validated RNA-seq data but supported our argument about their role in the growth and development of kiwifruit. Additionally, higher expression levels of genes in callus under dark conditions confirm their role in shade stress similar to the previous findings in soybean [9].
To summarize, we identified GRF family members in whole genomes of Ac and Ae. A series of analyses was carried out to characterize the GRF family members in both kiwifruit genomes. We found higher expression levels for two genes from Ac (AcGRF6.1 and AcGRF6.2) and two genes from Ae (AeGRF6.1 and AeGRF6.2) in the different transcriptomic datasets, which can be a valuable source for future studies. Further investigations are required to functionally characterize these genes in kiwifruit for growth, development, and stress responses.
4. Materials and Methods
4.1. Gene Identification
The protein sequences and genome annotations for AcGRF and AeGRF were retrieved from the Kiwifruit Genome Database (KGD) [40]. The AtGRF protein sequences were retrieved from The Arabidopsis Information Resources (TAIR) [41] and used to predict GRF proteins in KGD, based on their homology. The resulting protein sequences were used to construct the kiwifruit-specific HMM model for identification of AcGRFs and AeGRFs proteins by HMMER 3.0 software [42]. The conserved domains were verified by the Conserved Domain Database (CDD) [43], and the Simple Modular Architecture Research Tool (SMART) [44]. The predicted proteins were considered as AcGRFs and AeGRFs only if they contained one or both QLQ (PF0889) and WRC (PF0880) conserved domains.
4.2. Gene Structure Analysis for Kiwifruit GRFs
The genomic and coding sequences for kiwifruit GRFs were retrieved from KGD [40]. The protein length, molecular weight (MW), isoelectric point (theoretical pI), and grand average of hydropathicity (GRAVY) were computed by ExPASy server [45]. The exon-intron distribution patterns of kiwifruit GRFs were investigated by Gene Structure Display Server (GSD 2.0) [46]. The conserved motifs were predicted by MEME software [47] with a maximum number of 15 motifs. The chromosome length and the chromosomal distribution of genes were retrieved from KGD.
4.3. Multiple Sequence Alignments and Phylogenetic Analysis
The multiple sequence alignment of AtGRFs, AcGRFs, and AeGRFs proteins was performed by ClustalX with default parameters [48]. The phylogenetic tress was built with GenomeNet Database Resources (https://www.genome.jp/, accessed on 10 December 2021) by using a phylogenetic analysis pipeline from ETE3 with default parameters (Aligner = mafft_default, Alignment cleaner = none, Model tester = none, and Tree builder = iqtree_default), and visualized by iTOOLs software [49]. The sub-cellular localization of the candidate protein was predicted by CELLO software [50].
4.4. Gene Duplication and Evolution Analysis
The kiwifruit genome of Ac and Ae were subjected to an all-to-all blast by Blastp, and the MCScan program with default parameters was used to analyze the duplication events in kiwifruit GRFs [51]. The duplicated GRF gene pairs were subjected to TBtools software for calculation of synonymous (Ka) and non-synonymous (Ks) substitution rates [52]. The divergence time was calculated by following formula: T = (Ks/2r) × 10−6, where Ks is the non-synonymous substitution rate, T stands for divergence time, and r denotes the neutral substitution rate (r = 3.39 × 10⁻⁹). The resulting values were divided by 1 million (10−6) to convert them into million years [25]. The collinearity blocks across the whole genome were produced by using MCScan software with default parameters [51]. The paralog and ortholog gene pairs were visualized by using TBtools software [52].
4.5. Cis-Regulatory Elements Analysis in the Upstream Promoter Region and of Kiwifruit GRFs
We retrieved 1000 bp upstream sequences of kiwifruit GRFs as the promoter region from KGD [40]. The cis-regulatory elements were predicted by the PlantCARE database [53] and visualized by TBtools software [52].
4.6. Protein-Protein Association Networks and Protein Structure Analysis for Kiwifruit GRFs
The protein association network analysis for kiwifruit GRFs was done by using STRING database [54]. Similarly, the protein structures for kiwifruit GRFs were predicted by Phyre 2 online tool [55] and visualized by JSmol interactive viewer [56].
4.7. Expression Analysis of Kiwifruit GRFs
We downloaded three published RNA-seq datasets (PRJNA187369, PRJNA328414, and PRJNA514180) from NCBI (National Center for Biotechnology Information) to investigate the expression profile of kiwifruit GRFs. The datasets were re-analyzed against reference genomes of “White” and “Hong Yang” cultivars [24,25]. The HISAT2 (v2.0.1) software was used to perform the alignment for reads [57]. The transcript assembly and quantification were performed by STRINGTIE (v2.1.5) [58]. The FPKM values for kiwifruit GRFs were used to draw heatmaps.
4.8. RT-qPCR Analysis
Plant samples for RT-qPCR were taken from young leaves (YL), old leaves (OL), callus under light conditions (LC), and callus under dark condition (DC) of Ac and Ae. A HiPure plant RNA mini kit was used to extract total RNA by following manufacturer protocol (Angen Biotech, Guangzhou, China). The RNA degradation and contamination were determined by subjecting samples to agarose gel electrophoresis, and RNA purity was tested on a NanPhotometer® (Huake, Zhejiang, China) by using OD260/OD280. Similarly, the cDNA was synthesized by TransScript® One-Step gDNA Removal and cDNA Synthesis SuperMix kit by following the manufacturer protocol (TransGen Biotech, Beijing, China). The reaction mixture was prepared by using a PerfectStartTM Green qPCR SuperMix kit by following the given instructions ((TransGen Biotech, Beijing, China)). The qRT-PCR was performed on a CFX Connect Real-Time PCR Detection System (BIO-RAD, Hercules, CA, USA). The reactions were prepared in a total volume of 20 µL containing: 1 µL of template, 10 µL of MonAMPTM ChemoHS qPCR Mix, 0.5 µL of each specific primer. The following conditions were set to perform the reactions: initial denaturation step at 95 °C for 5 min followed by 45 cycles of 95 °C for 10 sec, 60 °C for 20 sec, and 72 °C for 20 sec [59]. Thekiwifruit β-actin gene was used as an internal control for normalization [60]. All the reactions were replicated thrice. The relative expression was calculated by 2−ΔΔCt method [61]. Primer pairs used in this study are listed in Table S5.
Supplementary Materials
The following supporting information can be downloaded at: https://www.mdpi.com/article/10.3390/plants11131633/s1, Figure S1. Multiple sequence alignment of AcGRF and AeGRF proteins. Identical amino acids (aa) are indicated by colored background. The QLQ and WRC domains are presented by colored rectangle boxes. Figure S2. Number of genes on each chromosome of Ac and Ae. Figure S3. Occurrence of exons and introns in AcGRF and AeGRF genes. Figure S4. Logos for conserved motifs in AcGRF and AeGRF proteins. Figure S5. Heatmaps for different transcriptomic data of kiwifruit. (A) Heatmap showing expression profile of AcGRFs and AeGRFs in different plant tissues of Ac under Psa. invasion. (B) Heatmap representing expression profile of AcGRFs and AeGRFs in Ac and Ae under Psa. invasion. (C) Expression profile of AcGRFs in fruit samples of Ac taken at different developmental stages. Figure S6. Promoter analysis of AcGRFs and AeGRFs for cis-regulatory elements. Figure S7. Protein structure analysis for AeGRFs and AcGRFs. Table S1. Characterization of kiwifruit GRFs. Table S2. Collinearity analysis of kiwifruit GRFs. Table S3. Sequences for motifs predicted in kiwifruit GRFs. Table S4. Detail for acronyms used in cis-regulatory elements in Table 1. Table S5. List of pair of primers used in RT-qPCR analysis.
Author Contributions
Conceptualization, M.A., P.G. and Z.W.; Methodology, M.A.; Software, M.A. and C.F.; Formal Analysis, M.A, J.L. and J.T.; Investigation, M.A.; Resources, M.A.; Data Curation, M.A., Y.Z. and X.C.; Writing—Original Draft Preparation, M.A.; Writing—Review & Editing, P.G. and Z.W.; Visualization, M.A.; Supervision, P.G. and Z.W.; Project Administration, P.G. and M.A.; Funding Acquisition, M.A. and P.G. All authors have read and agreed to the published version of the manuscript.
Funding
This research was funded by the Special Research Funding for Plants in Lushan Botanical Garden (for Muhammad Abid, 2021ZWZX21), and the Plant Germplasm Innovation Program, Biological Resources Program, the Chinese Academy of Sciences (For Puxing Gao, KFJ-BRP-007-001).
Institutional Review Board Statement
Not applicable.
Informed Consent Statement
Not applicable.
Data Availability Statement
The data supporting reported results can be found at https://kiwifruitgenome.org/.
Conflicts of Interest
The authors declare no conflict of interest.
References
- Kim, J.-S.; Mizoi, J.; Kidokoro, S.; Maruyama, K.; Nakajima, J.; Nakashima, K.; Mitsuda, N.; Takiguchi, Y.; Ohme-Takagi, M.; Kondou, Y. Arabidopsis GROWTH-REGULATING FACTOR7 functions as a transcriptional repressor of abscisic acid–and osmotic stress–responsive genes, including DREB2A. Plant Cell 2012, 24, 3393–3405. [Google Scholar] [CrossRef] [PubMed] [Green Version]
- Van der Knaap, E.; Kim, J.H.; Kende, H. A novel gibberellin-induced gene from rice and its potential regulatory role in stem growth. Plant Physiol. 2000, 122, 695–704. [Google Scholar] [CrossRef] [PubMed] [Green Version]
- Kim, J.H.; Choi, D.; Kende, H. The AtGRF family of putative transcription factors is involved in leaf and cotyledon growth in Arabidopsis. Plant J. 2003, 36, 94–104. [Google Scholar] [CrossRef] [PubMed]
- Choi, D.; Kim, J.H.; Kende, H. Whole genome analysis of the OsGRF gene family encoding plant-specific putative transcription activators in rice (Oryza sativa L.). Plant Cell Physiol. 2004, 45, 897–904. [Google Scholar] [CrossRef] [PubMed] [Green Version]
- Zhang, D.-F.; Li, B.; Jia, G.-Q.; Zhang, T.-F.; Dai, J.-R.; Li, J.-S.; Wang, S.-C. Isolation and characterization of genes encoding GRF transcription factors and GIF transcriptional coactivators in Maize (Zea mays L.). Plant Sci. 2008, 175, 809–817. [Google Scholar] [CrossRef]
- Filiz, E.; Koc, I.; Tombuloğlu, H. Genome-wide identification and analysis of growth regulating factor genes in Brachypodium distachyon: In Silico approaches. Turk. J. Biol. 2014, 38, 296–306. [Google Scholar] [CrossRef]
- Zan, T.; Zhang, L.; Xie, T.; Li, L. Genome-Wide Identification and Analysis of the Growth-Regulating Factor (GRF) Gene Family and GRF-Interacting Factor Family in Triticum aestivum L. Biochem. Genet. 2020, 58, 705–724. [Google Scholar] [CrossRef]
- Ma, J.-Q.; Jian, H.-J.; Yang, B.; Lu, K.; Zhang, A.-X.; Liu, P.; Li, J.-N. Genome-wide analysis and expression profiling of the GRF gene family in oilseed rape (Brassica napus L.). Gene 2017, 620, 36–45. [Google Scholar] [CrossRef]
- Chen, F.; Yang, Y.; Luo, X.; Zhou, W.; Dai, Y.; Zheng, C.; Liu, W.; Yang, W.; Shu, K. Genome-wide identification of GRF transcription factors in soybean and expression analysis of GmGRF family under shade stress. BMC Plant Biol. 2019, 19, 269. [Google Scholar] [CrossRef]
- Tang, Y.; Cheng, W.; Li, S.; Li, Y.; Wang, X.; Xie, J.; He, Y.; Wang, Y.; Niu, Y.; Bao, X. Genome-wide identification and expression analysis of the growth regulating factor (GRF) family in Jatropha curcas. PLoS ONE 2021, 16, e0254711. [Google Scholar] [CrossRef]
- Kim, J.H.; Kende, H. A transcriptional coactivator, AtGIF1, is involved in regulating leaf growth and morphology in Arabidopsis. Proc. Natl. Acad. Sci. USA 2004, 101, 13374–13379. [Google Scholar] [CrossRef] [PubMed] [Green Version]
- Liu, H.; Guo, S.; Xu, Y.; Li, C.; Zhang, Z.; Zhang, D.; Xu, S.; Zhang, C.; Chong, K. OsmiR396d-regulated OsGRFs function in floral organogenesis in rice through binding to their targets OsJMJ706 and OsCR4. Plant Physiol. 2014, 165, 160–174. [Google Scholar] [CrossRef] [PubMed] [Green Version]
- Liang, G.; He, H.; Li, Y.; Wang, F.; Yu, D. Molecular mechanism of microRNA396 mediating pistil development in Arabidopsis. Plant Physiol. 2014, 164, 249–258. [Google Scholar] [CrossRef] [PubMed] [Green Version]
- Debernardi, J.M.; Mecchia, M.A.; Vercruyssen, L.; Smaczniak, C.; Kaufmann, K.; Inze, D.; Rodriguez, R.E.; Palatnik, J.F. Post-transcriptional control of GRF transcription factors by micro RNA miR396 and GIF co-activator affects leaf size and longevity. Plant J. 2014, 79, 413–426. [Google Scholar] [CrossRef]
- Kuijt, S.J.H.; Greco, R.; Agalou, A.; Shao, J.; ‘t Hoen, C.C.J.; Övernäs, E.; Osnato, M.; Curiale, S.; Meynard, D.; van Gulik, R. Interaction between the GROWTH-REGULATING FACTOR and KNOTTED1-LIKE HOMEOBOX families of transcription factors. Plant Physiol. 2014, 164, 1952–1966. [Google Scholar] [CrossRef] [Green Version]
- Li, S.; Gao, F.; Xie, K.; Zeng, X.; Cao, Y.; Zeng, J.; He, Z.; Ren, Y.; Li, W.; Deng, Q. The OsmiR396c-OsGRF4-OsGIF1 regulatory module determines grain size and yield in rice. Plant Biotechnol. J. 2016, 14, 2134–2146. [Google Scholar] [CrossRef]
- Jones-Rhoades, M.W.; Bartel, D.P.; Bartel, B. MicroRNAs and their regulatory roles in plants. Annu. Rev. Plant Biol. 2006, 57, 19–53. [Google Scholar] [CrossRef]
- Rodriguez, R.E.; Mecchia, M.A.; Debernardi, J.M.; Schommer, C.; Weigel, D.; Palatnik, J.F. Control of cell proliferation in Arabidopsis thaliana by microRNA miR396. Development 2010, 137, 103–112. [Google Scholar] [CrossRef] [Green Version]
- Kim, J.H. Biological roles and an evolutionary sketch of the GRF-GIF transcriptional complex in plants. BMB Rep. 2019, 52, 227. [Google Scholar] [CrossRef] [Green Version]
- Huang, H.-W.; Ferguson, A.R. Actinidia in China: Natural diversity, phylogeographical evolution, interspecific gene flow and kiwifruit cultivar improvement. In Proceedings of the VI International Symposium on Kiwifruit 753, Rotorua, New Zealand, 20–24 February 2006; pp. 31–40. [Google Scholar]
- Chat, J.; Jáuregui, B.; Petit, R.J.; Nadot, S. Reticulate evolution in kiwifruit (Actinidia, Actinidiaceae) identified by comparing their maternal and paternal phylogenies. Am. J. Bot. 2004, 91, 736–747. [Google Scholar] [CrossRef]
- Huang, S.; Ding, J.; Deng, D.; Tang, W.; Sun, H.; Liu, D.; Zhang, L.; Niu, X.; Zhang, X.; Meng, M. Draft genome of the kiwifruit Actinidia chinensis. Nat. Commun. 2013, 4, 2640. [Google Scholar] [CrossRef] [PubMed]
- Stonehouse, W.; Gammon, C.S.; Beck, K.L.; Conlon, C.A.; von Hurst, P.R.; Kruger, R. Kiwifruit: Our daily prescription for health. Can. J. Physiol. Pharmacol. 2013, 91, 442–447. [Google Scholar] [CrossRef] [PubMed]
- Tang, W.; Sun, X.; Yue, J.; Tang, X.; Jiao, C.; Yang, Y.; Niu, X.; Miao, M.; Zhang, D.; Huang, S. Chromosome-scale genome assembly of kiwifruit Actinidia eriantha with single-molecule sequencing and chromatin interaction mapping. Gigascience 2019, 8, giz027. [Google Scholar] [CrossRef] [PubMed] [Green Version]
- Wu, H.; Ma, T.; Kang, M.; Ai, F.; Zhang, J.; Dong, G.; Liu, J. A high-quality Actinidia chinensis (kiwifruit) genome. Hortic. Res. 2019, 6, 117. [Google Scholar] [CrossRef] [PubMed] [Green Version]
- Maere, S.; De Bodt, S.; Raes, J.; Casneuf, T.; Van Montagu, M.; Kuiper, M.; Van de Peer, Y. Modeling gene and genome duplications in eukaryotes. Proc. Natl. Acad. Sci. USA 2005, 102, 5454–5459. [Google Scholar] [CrossRef] [PubMed] [Green Version]
- Hurst, L.D. The Ka/Ks ratio: Diagnosing the form of sequence evolution. Trends Genet. TIG 2002, 18, 486. [Google Scholar] [CrossRef]
- Kress, W.J.; Soltis, D.E.; Kersey, P.J.; Wegrzyn, J.L.; Leebens-Mack, J.H.; Gostel, M.R.; Liu, X.; Soltis, P.S. Green plant genomes: What we know in an era of rapidly expanding opportunities. Proc. Natl. Acad. Sci. USA 2022, 119, e2115640118. [Google Scholar] [CrossRef]
- Edwards, D.; Batley, J. Plant genome sequencing: Applications for crop improvement. Plant Biotechnol. J. 2010, 8, 2–9. [Google Scholar] [CrossRef]
- Chen, H.; Ge, W. Identification, Molecular Characteristics, and Evolution of GRF Gene Family in Foxtail Millet (Setaria italica L.). Front. Genet. 2022, 12, 727674. [Google Scholar] [CrossRef]
- Omidbakhshfard, M.A.; Proost, S.; Fujikura, U.; Mueller-Roeber, B. Growth-regulating factors (GRFs): A small transcription factor family with important functions in plant biology. Mol. Plant 2015, 8, 998–1010. [Google Scholar] [CrossRef] [Green Version]
- Xu, G.; Guo, C.; Shan, H.; Kong, H. Divergence of duplicate genes in exon–intron structure. Proc. Natl. Acad. Sci. USA 2012, 109, 1187–1192. [Google Scholar] [CrossRef] [PubMed] [Green Version]
- Bennett, M.D.; Leitch, I.J. Plant genome size research: A field in focus. Ann. Bot. 2005, 95, 1–6. [Google Scholar] [CrossRef] [PubMed] [Green Version]
- Shi, T.; Huang, H.; Barker, M.S. Ancient genome duplications during the evolution of kiwifruit (Actinidia) and related Ericales. Ann. Bot. 2010, 106, 497–504. [Google Scholar] [CrossRef] [Green Version]
- Xu, R.; Gao, M.; Li, M.; Whitham, S.-A.; Zhang, S.; Xu, Y. Identification of MdGRF genes and the necessary role of MdGRF02 in apple root growth regulation. Sci. Hortic. 2022, 295, 110866. [Google Scholar] [CrossRef]
- Horiguchi, G.; Kim, G.; Tsukaya, H. The transcription factor AtGRF5 and the transcription coactivator AN3 regulate cell proliferation in leaf primordia of Arabidopsis thaliana. Plant J. 2005, 43, 68–78. [Google Scholar] [CrossRef]
- Kim, J.H.; Lee, B.H. Growth-regulating FACTOR4 of Arabidopsis thaliana is required for development of leaves, cotyledons, and shoot apical meristem. J. Plant Biol. 2006, 49, 463–468. [Google Scholar] [CrossRef]
- Lantzouni, O.; Alkofer, A.; Falter-Braun, P.; Schwechheimer, C. GROWTH-REGULATING FACTORS interact with DELLAs and regulate growth in cold stress. Plant Cell 2020, 32, 1018–1034. [Google Scholar] [CrossRef]
- Hewezi, T.; Maier, T.R.; Nettleton, D.; Baum, T.J. The Arabidopsis microRNA396-GRF1/GRF3 regulatory module acts as a developmental regulator in the reprogramming of root cells during cyst nematode infection. Plant Physiol. 2012, 159, 321–335. [Google Scholar] [CrossRef] [Green Version]
- Yue, J.; Liu, J.; Tang, W.; Wu, Y.Q.; Tang, X.; Li, W.; Yang, Y.; Wang, L.; Huang, S.; Fang, C. Kiwifruit Genome Database (KGD): A comprehensive resource for kiwifruit genomics. Hortic. Res. 2020, 7, 117. [Google Scholar] [CrossRef]
- Berardini, T.Z.; Reiser, L.; Li, D.; Mezheritsky, Y.; Muller, R.; Strait, E.; Huala, E. The Arabidopsis information resource: Making and mining the “gold standard” annotated reference plant genome. Genesis 2015, 53, 474–485. [Google Scholar] [CrossRef] [Green Version]
- Wheeler, T.J.; Eddy, S.R. nhmmer: DNA homology search with profile HMMs. Bioinformatics 2013, 29, 2487–2489. [Google Scholar] [CrossRef] [PubMed] [Green Version]
- Lu, S.; Wang, J.; Chitsaz, F.; Derbyshire, M.K.; Geer, R.C.; Gonzales, N.R.; Gwadz, M.; Hurwitz, I.D.; Marchler, G.H.; Song, J.S.; et al. CDD/SPARCLE: The conserved domain database. Nucleic Acids Res. 2020, 48, 265–268. [Google Scholar] [CrossRef] [PubMed] [Green Version]
- Letunic, I.; Khedkar, S.; Bork, P. SMART: Recent updates, new developments and status in 2020. Nucleic Acids Res. 2021, 49, D458–D460. [Google Scholar] [CrossRef] [PubMed]
- Wilkins, M.R.; Gasteiger, E.; Bairoch, A.; Sanchez, J.C.; Williams, K.L.; Appel, R.D.; Hochstrasser, D.F. Protein identification and analysis tools on the ExPASy server. Methods Mol. Biol. 1999, 112, 531–552. [Google Scholar] [PubMed]
- Hu, B.; Jin, J.; Guo, A.-Y.; Zhang, H.; Luo, J.; Gao, G. GSDS 2.0: An upgraded gene feature visualization server. Bioinformatics 2015, 31, 1296–1297. [Google Scholar] [CrossRef] [Green Version]
- Bailey, T.L.; Johnson, J.; Grant, C.E.; Noble, W.S. The MEME suite. Nucleic Acids Res. 2015, 43, W39–W49. [Google Scholar] [CrossRef] [Green Version]
- Thompson, J.D.; Gibson, T.J.; Higgins, D.G. Multiple sequence alignment using ClustalW and ClustalX. Curr. Protoc. Bioinform. 2003, 2, 2–3. [Google Scholar] [CrossRef]
- Letunic, I.; Bork, P. Interactive Tree Of Life (iTOL): An online tool for phylogenetic tree display and annotation. Bioinformatics 2007, 23, 127–128. [Google Scholar] [CrossRef] [Green Version]
- Yu, C.; Chen, Y.; Lu, C.; Hwang, J. Prediction of protein subcellular localization. Proteins Struct. Funct. Bioinform. 2006, 64, 643–651. [Google Scholar] [CrossRef]
- Wang, Y.; Tang, H.; DeBarry, J.D.; Tan, X.; Li, J.; Wang, X.; Lee, T.; Jin, H.; Marler, B.; Guo, H. MCScanX: A toolkit for detection and evolutionary analysis of gene synteny and collinearity. Nucleic Acids Res. 2012, 40, e49. [Google Scholar] [CrossRef] [Green Version]
- Chen, C.; Chen, H.; Zhang, Y.; Thomas, H.R.; Frank, M.H.; He, Y.; Xia, R. TBtools: An integrative toolkit developed for interactive analyses of big biological data. Mol. Plant 2020, 13, 1194–1202. [Google Scholar] [CrossRef] [PubMed]
- Lescot, M.; Déhais, P.; Thijs, G.; Marchal, K.; Moreau, Y.; Van de Peer, Y.; Rouzé, P.; Rombauts, S. PlantCARE, a database of plant cis-acting regulatory elements and a portal to tools for in silico analysis of promoter sequences. Nucleic Acids Res. 2002, 30, 325–327. [Google Scholar] [CrossRef] [PubMed]
- Szklarczyk, D.; Gable, A.L.; Nastou, K.C.; Lyon, D.; Kirsch, R.; Pyysalo, S.; Doncheva, N.T.; Legeay, M.; Fang, T.; Bork, P. The STRING database in 2021: Customizable protein–protein networks, and functional characterization of user-uploaded gene/measurement sets. Nucleic Acids Res. 2021, 49, D605–D612. [Google Scholar] [CrossRef] [PubMed]
- Kelley, L.A.; Mezulis, S.; Yates, C.M.; Wass, M.N.; Sternberg, M.J.E. The Phyre2 web portal for protein modeling, prediction and analysis. Nat. Protoc. 2015, 10, 845–858. [Google Scholar] [CrossRef] [Green Version]
- Scalfani, V.F.; Williams, A.J.; Tkachenko, V.; Karapetyan, K.; Pshenichnov, A.; Hanson, R.M.; Liddie, J.M.; Bara, J.E. Programmatic conversion of crystal structures into 3D printable files using Jmol. J. Cheminform. 2016, 8, 56. [Google Scholar] [CrossRef] [PubMed] [Green Version]
- Kim, D.; Langmead, B.; Salzberg, S.L. HISAT: Hierarchical indexing for spliced alignment of transcripts. BioRxiv 2014, 12591. [Google Scholar]
- Pertea, M.; Kim, D.; Pertea, G.M.; Leek, J.T.; Salzberg, S.L. Transcript-level expression analysis of RNA-seq experiments with HISAT, StringTie and Ballgown. Nat. Protoc. 2016, 11, 1650–1667. [Google Scholar] [CrossRef]
- Huang, H.; Abid, M.; Lin, M.; Wang, R.; Gu, H.; Li, Y.; Qi, X. Comparative Transcriptome Analysis of Different Actinidia arguta Fruit Parts Reveals Difference of Light Response during Fruit Coloration. Biology 2021, 10, 648. [Google Scholar] [CrossRef]
- Liao, G.; He, Y.; Li, X.; Zhong, M.; Huang, C.; Yi, S.; Liu, Q.; Xu, X. Effects of bagging on fruit flavor quality and related gene expression of AsA synthesis in Actinidia eriantha. Sci. Hortic. 2019, 256, 108511. [Google Scholar] [CrossRef]
- Vandesompele, J.; De Preter, K.; Pattyn, F.; Poppe, B.; Van Roy, N.; De Paepe, A.; Speleman, F. Accurate normalization of real-time quantitative RT-PCR data by geometric averaging of multiple internal control genes. Genome Biol. 2002, 3, 1–11. [Google Scholar] [CrossRef] [Green Version]
Publisher’s Note: MDPI stays neutral with regard to jurisdictional claims in published maps and institutional affiliations. |
© 2022 by the authors. Licensee MDPI, Basel, Switzerland. This article is an open access article distributed under the terms and conditions of the Creative Commons Attribution (CC BY) license (https://creativecommons.org/licenses/by/4.0/).