Article

Chromosome and Molecular Analyses Reveal Significant Karyotype Diversity and Provide New Evidence on the Origin of Aegilops columnaris

by
Ekaterina D. Badaeva
1,2,*,
Nadezhda N. Chikida
3,
Andrey N. Fisenko
1,
Sergei A. Surzhikov
2,
Maria K. Belousova
3,
Hakan Özkan
4,
Alexandra Y. Dragovich
1 and
Elena Z. Kochieva
5
1
N. I. Vavilov Institute of General Genetics, Russian Academy of Sciences, Gubkina Street 3, GSP–1, 119991 Moscow, Russia
2
Engelhardt Institute of Molecular Biology, Russian Academy of Sciences, Vavilova Street 34, GSP–1, 119991 Moscow, Russia
3
Federal Research Center, N. I. Vavilov All-Russian Institute of Plant Genetic Resources, Bolshaya Morskaya Street 44, 190121 St. Petersburg, Russia
4
Department of Field Crops, Faculty of Agriculture, University of Çukurova, 01330 Adana, Turkey
5
Federal Research Center “Fundamentals of Biotechnology”, Russian Academy of Sciences, 60 let Oktjabrya Prospect 7, Build. 1, 117312 Moscow, Russia
*
Author to whom correspondence should be addressed.
Plants 2021, 10(5), 956; https://doi.org/10.3390/plants10050956
Submission received: 13 April 2021 / Revised: 28 April 2021 / Accepted: 6 May 2021 / Published: 11 May 2021
(This article belongs to the Special Issue Cytogenetics of Cereal Species)

Abstract

:
Aegilops columnaris Zhuk. is tetraploid grass species (2n = 4x = 28, UcUcXcXc) closely related to Ae. neglecta and growing in Western Asia and a western part of the Fertile Crescent. Genetic diversity of Ae. columnaris was assessed using C-banding, FISH, nuclear and chloroplast (cp) DNA analyses, and gliadin electrophoresis. Cytogenetically Ae. columnaris was subdivided into two groups, C-I and C-II, showing different karyotype structure, C-banding, and FISH patterns. C-I group was more similar to Ae. neglecta. All types of markers revealed significant heterogeneity in C-II group, although group C-I was also polymorphic. Two chromosomal groups were consistent with plastogroups identified in a current study based on sequencing of three chloroplast intergenic spacer regions. The similarity of group C-I of Ae. columnaris with Ae. neglecta and their distinctness from C-II indicate that divergence of the C-I group was associated with minor genome modifications. Group C-II could emerge from C-I relatively recently, probably due to introgression from another Aegilops species followed by a reorganization of the parental genomes. Most C-II accessions were collected from a very narrow geographic region, and they might originate from a common ancestor. We suggest that the C-II group is at the initial stage of species divergence and undergoing an extensive speciation process.

1. Introduction

Aegilops columnaris Zhuk. is annual tetraploid (2n = 4x = 28) grass species naturally growing in Western Asia, mainly in Turkey, Armenia, and in a western part of the Fertile Crescent [1,2,3]. It is also native to Crete, Iraq, Lebanon, Azerbaijan, and Iran but found as adventive species in France, near Marseille [1]. Despite a relatively broad distribution area, Ae. columnaris is uncommon throughout its range. Biodiversity Collecting Mission Database included 816 Ae. columnaris site records (https://www.gbif.org/), and according to Genesys, 763 accessions are currently maintained in gene banks worldwide (https://www.genesys-pgr.org/). This number, however, may be overestimated owing to a large number of potentially duplicated and incorrectly classified accessions. From the other hand, many new sites were recently discovered during collection missions. However, the new samples (e.g., reported in [4] or materials analyzed in a current study) were not included in these databases.
Ae. columnaris was first collected on the Ghalat plateau close to Ankara and on the slopes of Dizgurt-Dagh mountains, Turkey, by the Russian botanist P.M. Zhukovsky during expeditions of 1925–1927 to Asia Minor [5]. Since then, this species was found in other locations, mainly in Turkey, Syria, and Transcaucasia, but also in Lebanon, Iraq, Iran, and Aegean Greece (Rodos, Crete) [1,6,7]. Ae. columnaris grows in dry fields, roads, and hillsides [1,5], mainly on limestones, rarer on basalts on wetter environments than most Aegilops L. species [1,2]. In most locations, Ae. columnaris is found together with other Aegilops species, often in a mix with Ae. neglecta Req. ex Bertol., Ae. biuncialis Vis., Ae. peregrina (Hack. in J. Fraser) Maire and Weiller, or Ae. triuncialis L. [8].
Ae. columnaris is known to be closely related to tetraploid Ae. neglecta [9,10,11,12,13,14,15], but the origin of these two species was a subject of long debates and is still not clear. Analysis of meiotic chromosome pairing in intraspecific hybrids [15,16,17,18], comparison of karyotype structure [19] and C-banding patterns [13,20], molecular analysis on nuclear [11,12] and cytoplasmic DNAs [21,22] showed that one of the Ae. columnaris and Ae. neglecta genomes was contributed by the diploid species Ae. umbellulata Zhuk. (2n = 2x = 14, UU). Comparative sequence analysis of the nuclear U-genome specific U31 fragment in 48 accessions of each Ae. columnaris and Ae. neglecta in comparison with 72 accessions of Ae. umbellulata allowed to suggest that the U-genomes of Ae. columnaris and Ae. neglecta may have multiple origins [23]. Cytoplasmic genomes of Ae. columnaris (U2) and Ae. neglecta (U) are also similar to the cytoplasmic genome of Ae. umbellulata (U), indicating that Ae. umbellulata was the maternal parent of these tetraploid species [22,24].
The source of the second genome of Ae. columnaris and Ae. neglecta is still unknown. H. Kihara [17] suggested that it could be related to the M-genome of Ae. comosa Sm. in Sibth. and Sm. based on morphological comparisons and analysis of meiotic chromosome pairing in Ae. columnaris x Ae. biuncialis (2n = 4x = 28, UUMM) hybrids. He designated this genome as “modified M,” and this symbol is still used in most taxonomical systems [1,2,10,16,17,19,25]. However, the F1 hybrids of Ae. columnaris x Ae. comosa exhibited low chromosome pairing [15]. Differences in the patterns of variation of the repetitive nucleotide sequences [11,26], RAPD-spectra [9], the results of DArTseq-based analysis [12], comparison of karyotype structures [19], C-banding, and Fluorescence in situ hybridization (FISH)-patterns [13,20] contradicted this hypothesis. Taking into consideration the distinctness of Ae. columnaris genomes Dvořák [26] suggested to change its genome formula from the UM to UX1. More recent data of DArTseq-based analysis revealed higher similarity of the second genome of Ae. columnaris and Ae. neglecta with the genome of Ae. speltoides Tausch or Ae. mutica Boiss. [12], therefore, a new genomic formula, UTs, was proposed for these tetraploid species.
In a previous publication [13], we uncovered the significant karyotype diversity of Ae. columnaris, which was expressed in a variation of the C-banding patterns and, despite a small number of accessions studied, translocation polymorphism. In this paper, however, the translocations were classified tentatively due to the lack of standard genetic nomenclature of Ae. columnaris chromosomes. The problem of chromosome classification was solved later when a set of wheat-Ae. columnaris (K−1193) introgression lines was developed and cytogenetically characterized [20].
These introgression lines also enabled the identification of gliadin components encoded by particular Ae. columnaris chromosomes [27]. Although extensive polymorphism of electrophoretic spectra of gliadins was demonstrated for durum and common wheat [28], these markers have been broadly exploited for wheat cultivar identification [29] diversity of gliadin profiles of Aegilops species, including Ae. columnaris, is much lesser studied. Publications were mainly focused on Ae. tauschii, the D-genome donor of common wheat [30,31], and only a few papers described other Aegilops species [32,33,34].
The aim of the present study was the analysis of intraspecific diversity of Ae. columnaris on a broader sample of accessions using cytogenetic (C-banding, FISH with various DNA probes), biochemical (seed storage proteins—gliadins), and molecular (comparative sequence analysis of nuclear and chloroplast DNA fragments) markers.

2. Results

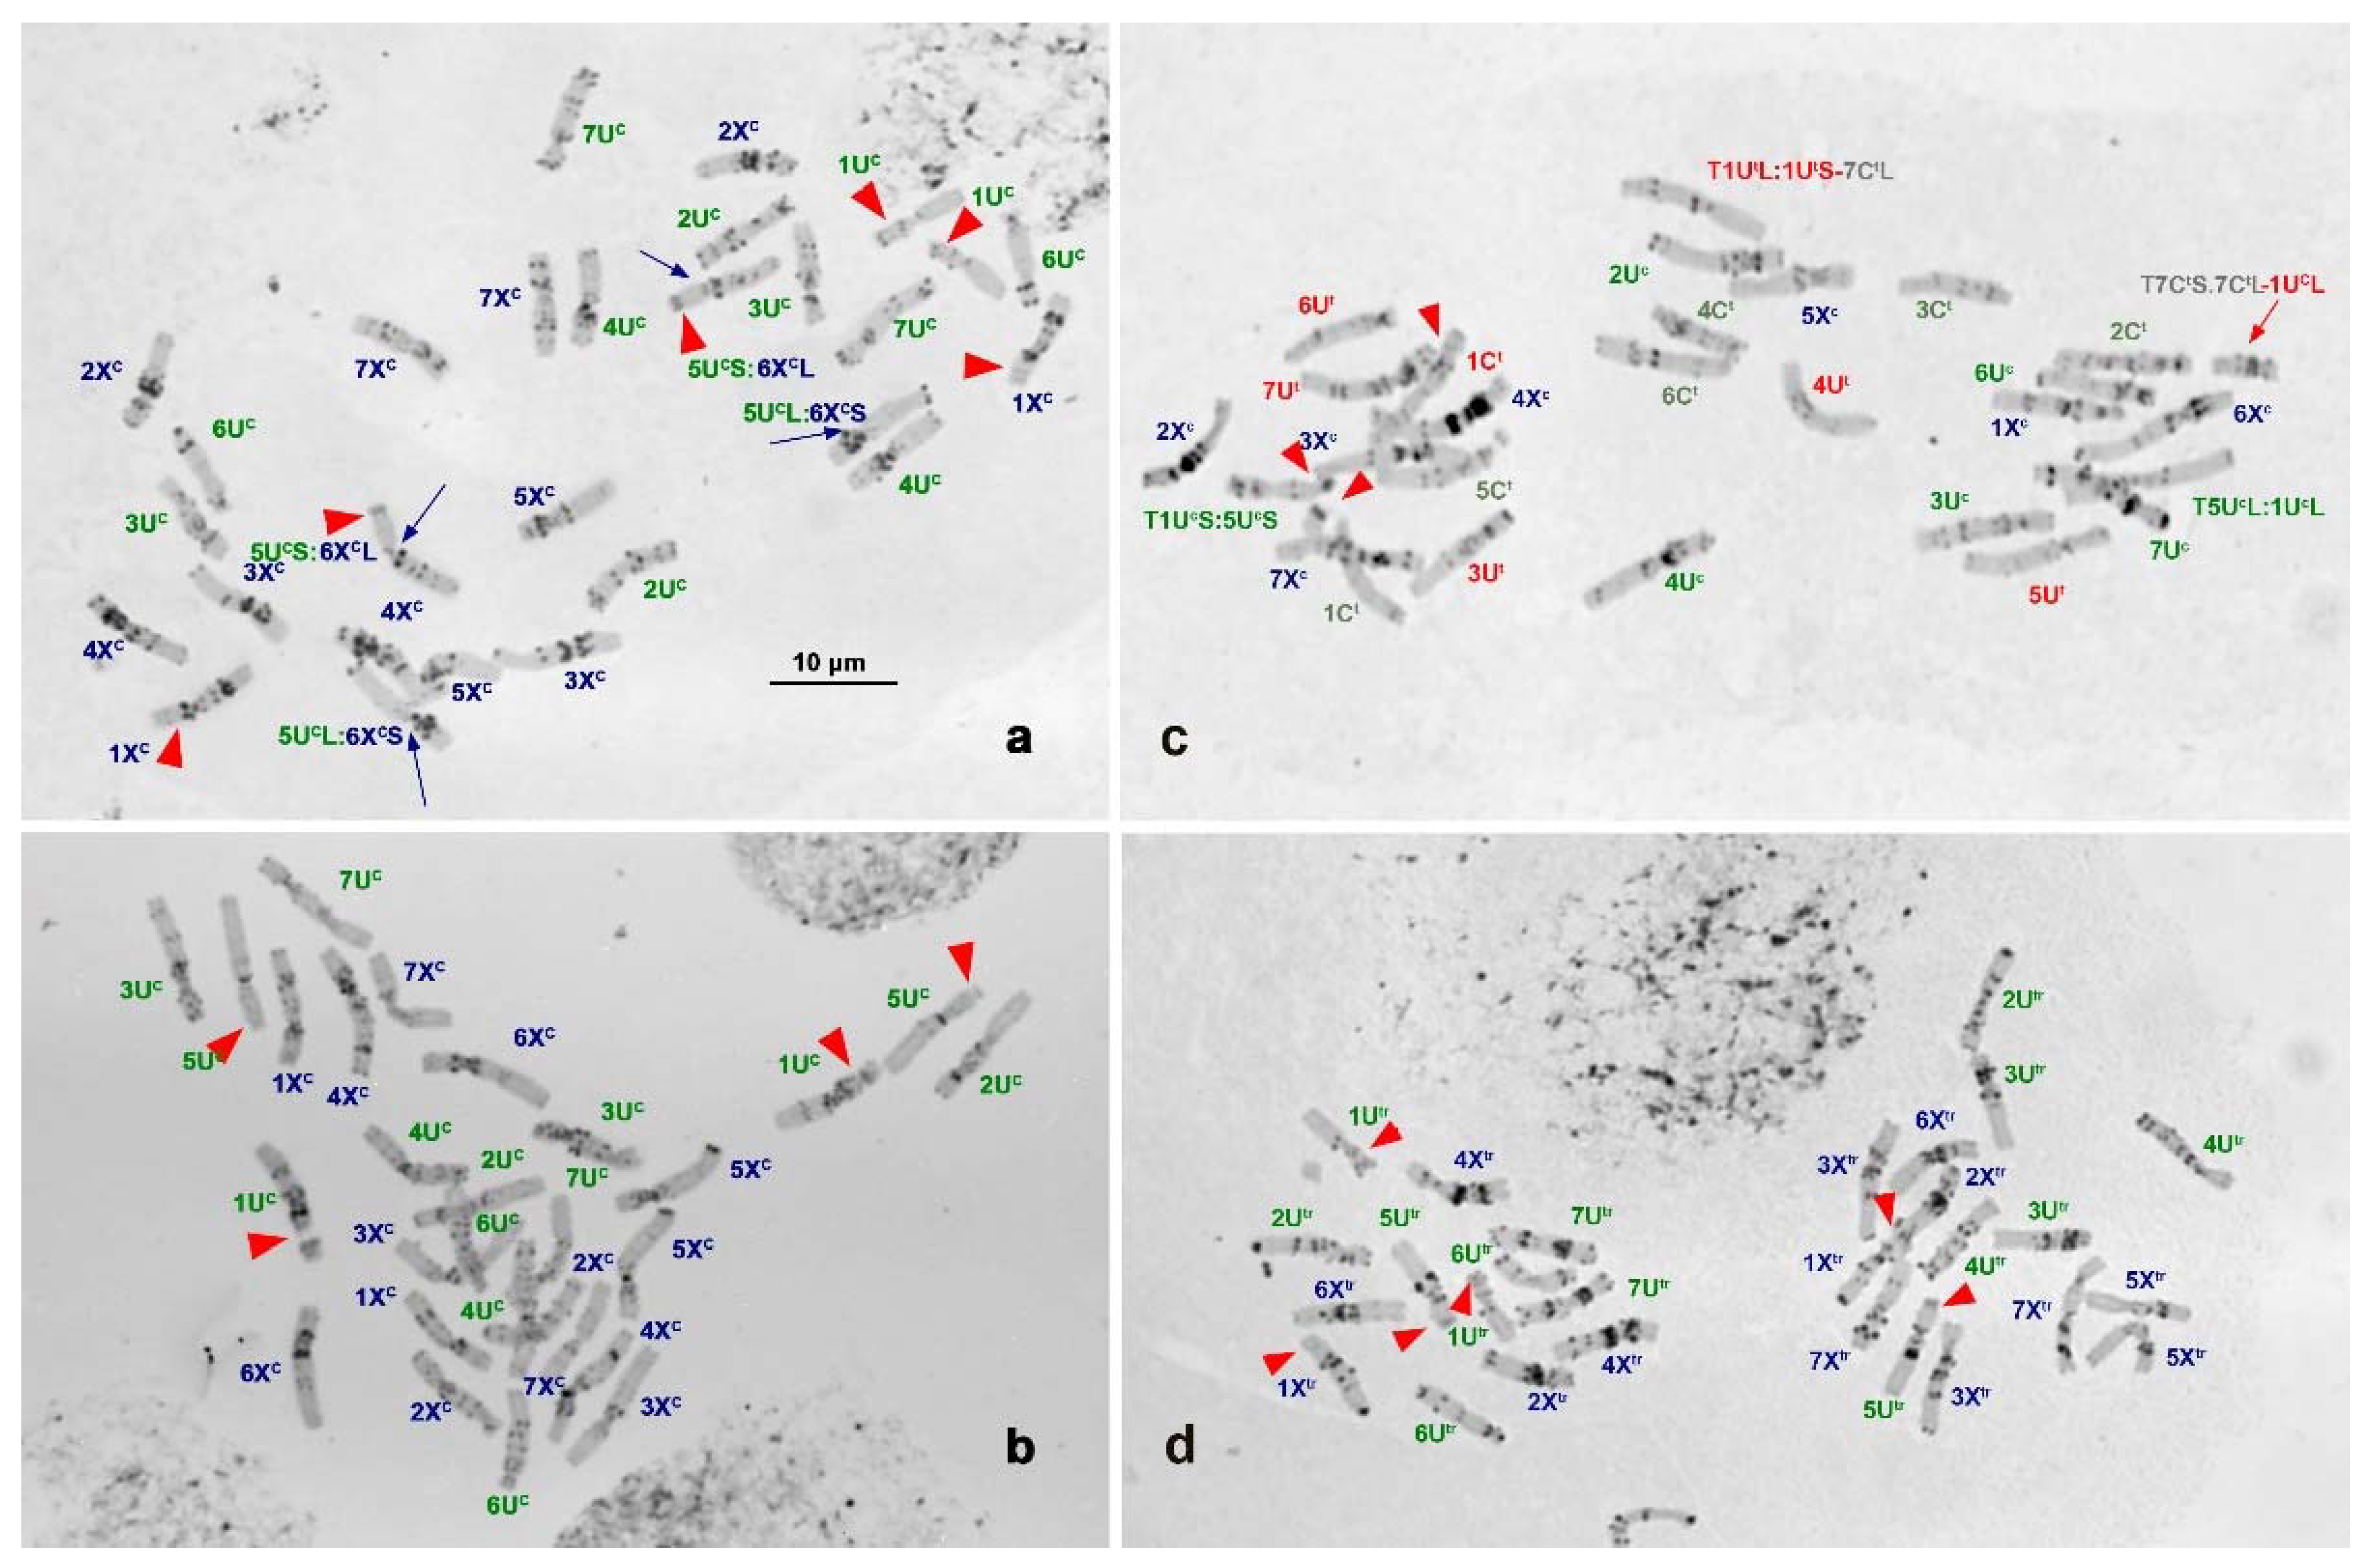
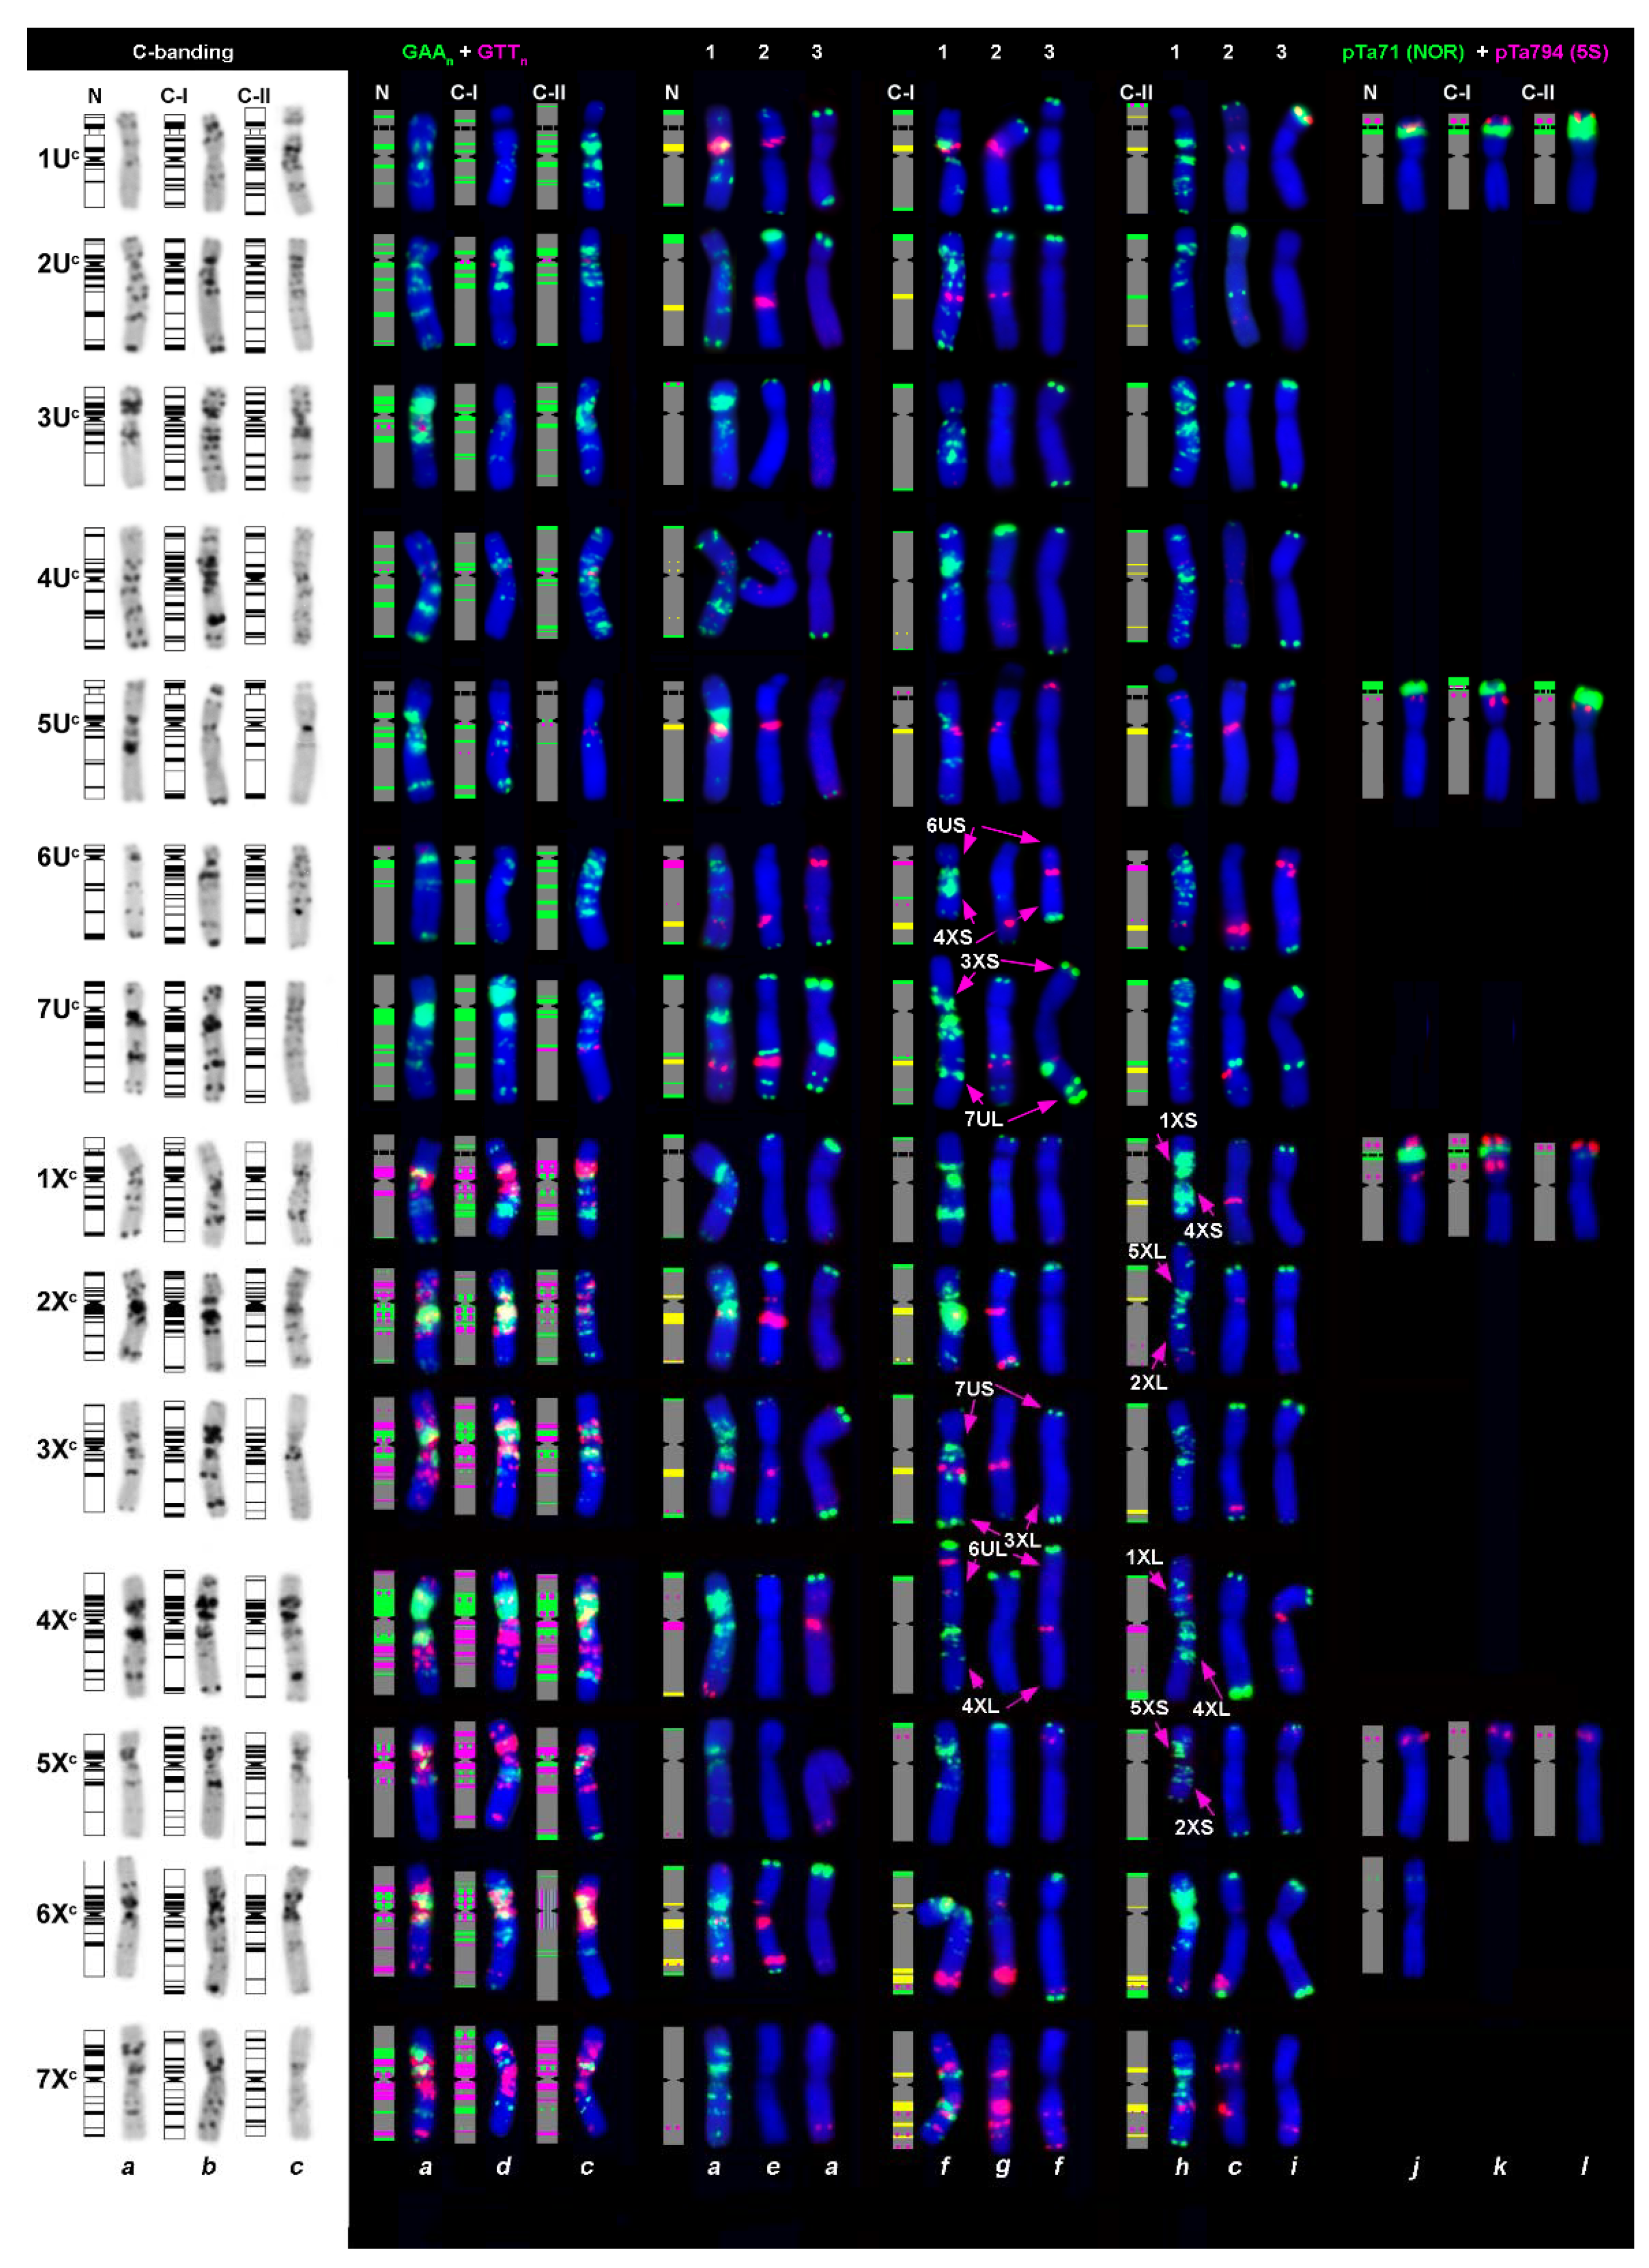
2.1. C-Banding Analysis of Ae. columnaris

We showed that most of Ae. columnaris accessions were karyotypically uniform, but two, K−4224 and a sample provided by Drs. E.A. Nazarova and A.G. Gukasyan in 1998, consisted each of three distinct biotypes, while PI 554187—of two biotypes (Table 1).
Three accessions (PI 564182 from Turkey and K−4553 and K−4233 from Armenia) maintained in gene banks under the name Ae. columnaris were found to be taxonomically misclassified and were in fact Ae. neglecta. Accession IG 49067 was the mix of Ae. columnaris and Ae. biuncialis, whereas accessions K−2344 from Armenia and AE 1607 of unknown origin—the mix of Ae. columnaris and Ae. triuncialis. One plant in K−4224 accession was found to be the F1 hybrid between Ae. columnaris and Ae. triuncialis (Figure 1c).
The C-banding analysis revealed that Ae. columnaris gene pool consists of two distinct karyotypic groups that differed from each other and from Ae. neglecta (Figure 1a,b,d) in karyotype structure, the number of satellite chromosomes, and C-banding patterns. The larger group was designated C-I, whereas the smaller one—C-II. Group C-I included 62 accessions collected from an entire distribution range, while C-II comprised only seven accessions, six from the southeast coastal part of Turkey and one from Iraq (Figure 2). Both Ae. columnaris groups demonstrated high diversity in the C-banding patterns and, in the case of C-I, broad translocation polymorphism (Figure 3, Figure 4, Figure 5, Figure 6 and Figure 7). Thus, karyotypes of 31 C-I accessions (50%) differed from each other only in the presence/absence or the size of Giemsa C-bands in particular positions; this karyotypic variant was considered basic or “normal (N).” Karyotypes of 31 accessions derived from normal as a result of one or more structural chromosome rearrangements. Accessions collected from geographically closer regions usually had more similar banding patterns than accessions from distant locations, and this trend was also observed in genotypes with chromosomal rearrangements. The highest C-banding and translocation polymorphisms were observed in Turkey.
Ae. neglecta was similar to Ae. columnaris in the amount and distribution of C-bands on most chromosomes, but differed in the morphology of 6Xc, which was more metacentric (arm ratio L/S = 1.173 vs. 1.924). In contrast to the C-II group, Ae. neglecta carried three pairs of satellite chromosomes as the C-I accessions (Figure 1a,d). Three accessions of Ae. neglecta had similar C-banding patterns (Figure 3t–v) and did not possess chromosomal rearrangements.
Twenty-six C-I accessions were collected in different regions of Turkey (Table 1; Figure 4). Nearly half of them (12 accessions) had normal karyotypes (N), and 14 (including segregating accession AE 1607) carried 11 variants of chromosomal rearrangements (Table 2; Figure 4 and Figure 5). Pericentric inversion of the chromosome 7Uc (Figure 5, Inv3) was the most frequent variant, which was found in three accessions (Figure 4u,v,x,y). This rearrangement gave rise to a secondary translocation inv7Uc + T4Uc:4Xc (T1) identified in the sample H−2 collected in Turkey 132 km NW from Nevşehir (Figure 4w). Double translocation T3Xc:7Uc + T4Xc:6Uc—T19 (Figure 4d) was detected in two unrelated accessions, PI 486281 and PI 554181 (Table 2), with identical C-banding patterns. Accession PI 542171 and two AE1607 biotypes carried pericentric inversions of the 2Xc chromosome (Figure 4t; Figure 6s), which differed in breakpoint positions resulting in different structures of rearranged chromosomes (Figure 5, Inv1 and inv2Xc−2). Five translocation variants: T3Uc:1Xc (T8) and its derivative T1Uc:5Uc + T3Uc:1Xc (T13), T2Uc:2Xc (T6), T2Uc:4Xc (T7), T4Uc:5Uc (T9), T3Xc:7Xc (T4), and T2Xc:4Xc—T14 (Figure 5; Figure 4a–c,h,j,m, respectively), were found in one accession each (Table 2).
Transcaucasia was represented by 19 Armenian and one Azerbaijani accession (Table 1). Nine accessions had normal karyotypes, and five variants of translocations were identified in the remaining ten accessions (Table 2; Figure 5). Translocation T1Uc:5Uc—T10 (Figure 6f,g) was present in five Armenian accessions and in PI 488258 of unknown origin. This translocation gave rise to two double translocations: T1Uc:5Uc + T3Uc:5Xc (T13) T1Uc:5Uc + T4Uc:6Uc (T12) found in one accession each and one triple translocation T1Uc:5Uc + T7Uc:3Xc + T3Uc:4Uc—T17 (Figure 6e,i–k) detected in two accessions (Table 2). Interestingly, another complex translocation, the derivative of T1Uc:5Uc—T13, was found in Turkey (Figure 4b). The only translocation not related to T1Uc:5Uc was T3Uc:4Xc (T3) identified in two Armenian accessions (Figure 6o,p).
Two of the four Iranian accessions analyzed in a current study carried chromosomal rearrangements (Figure 6s–v). These were a single translocation T5Uc:6Xc (T5) and double cyclic translocation T2Xc:4Xc:6Xc (T15).
Lebanese group of Ae. columnaris contained eight accessions, one of which consisted of two karyotypically normal biotypes differing only in the C-banding patterns (Figure 3g,h). Of them, accession K−4241b (Figure 3h) was almost identical to K−4004 (Figure 3i) in the C-banding pattern. Most Lebanese Ae. columnaris had normal karyotypes, and two types of chromosomal rearrangements were identified in three accessions. Thus, K−4003 and K−4407 carried T7Uc:2Xc–T10 translocation (Figure 3j,k), while a pericentric inversion of the chromosome 6Xc (inv2) was detected in K−4406 (Figure 3l).
Five accessions were from Syria. Three of them had normal karyotypes, and two different complex translocations were identified in the remaining two accessions (Figure 3a,b). K−4372 and K−4362 carried T2Uc:4Xc + T4Uc:6Xc (T18) and T2Uc:5Xc + T4Uc:2Xc (T20), respectively. In both cases, the original single translocations were not found.
The origin of four accessions, AE 1512, AE1607, TX01, and CIae 34, was unknown. We found that AE 1607 consisted of two biotypes differing in chromosomal rearrangements (inv2Xc/inv2Xc−2 + T6Uc:7Xc) and the C-banding patterns. This accession also contained Ae. triuncialis seeds. Three accessions, CIae34, TX01, and AE 1521, carried pericentric inversion of 7Uc (Figure 3p–r). This rearrangement was recorded only in Ae. columnaris collected from Central Anatolian in Turkey (Figure 2, outlined with green dotted lines); therefore, we suggested that these three accessions may originate from the same region.
Seven Ae. columnaris accessions, six from Turkey and one from Iraq, were karyotypically distinct from all other accessions of the species and exhibited significant variation in the C-banding patterns (Figure 7). They were assigned to the C-II group. Accession TA2084 carried at least two whole-arm reciprocal translocations; unidentifiable minor translocations may present in other accessions causing variation in the C-banding patterns. Despite heterogeneity, karyotypes of all C-II accessions shared some distinct features discriminating them from the C-I group and Ae. neglecta:
(1) They had only two pairs of the satellite (SAT) chromosomes;
(2) Chromosome 1Uc was more heterochromatic;
(3) Chromosome 4Uc of C-II contained less heterochromatin compared to C-I (Figure 7);
(4) Chromosome 7Uc did not possess a prominent C-band complex in a proximal part of the long arm, which was found in the orthologous chromosomes of all C-I or Ae. neglecta accessions.
Morphology and the C-banding pattern of chromosome 5Uc in both C-I and C-II accessions were similar; however, 1Uc of C-II was more heterochromatic than the 1Uc in C-I (Figure 7 and Figure 8). Significant differences existed in C-banding patterns of other C-I and C-II chromosomes, although some polymorphisms could result from introgression. Thus, chromosome 3Uc of PI 554182 (Figure 7d) had the C-banding pattern typical for Turkish and Transcaucasian C-I accessions (i.e., PI 554186, PI 554187 on Figure 4e,i) and may originate via introgression between C-I and C-II groups. A C-banding pattern of chromosome 4Xc of PI 564180 was more similar to 4Xt of Ae. neglecta (Figure 3t–v) than other C-II or C-I accessions.

2.2. FISH Analysis of Ae. columnaris

In order to get a deeper insight into genetic differences between groups C-I and C-II of Ae. columnaris and to assess their relationship with Ae. neglecta, we applied FISH with ribosomal DNA probes pTa71 (45S rDNA), pTa794 (5S rDNA), three microsatellite sequences (GAA)n, (GTT)n, (ACT)n, and three families of the Triticeae-specific satellite DNA sequences pSc119.2, pAs1, and pTa−713. The pTa−535 probe was not considered because it produced signals only on a few chromosomes (Figure S1, o; green signals), uninformative for our analyses.
Hybridization of pTa71 and pTa794 probes revealed three pairs of major, nearly equal pTa71 signals on chromosomes of C-I and Ae. neglecta, but only two pairs of major NORs in the C-II accessions (Figure 8; Figure S1a,b; Figure S2a,c). Instead, all C-II accessions possessed faint pTa71 signals on a chromosome pair carrying a clear distal 5S rDNA locus. This chromosome was classified as 1Xc based on results of sequential FISH with 5S + 45S rDNAs followed by (GAA)n + (GTT)n/pTa−713 probes (Figure S2b,d). An additional minor NORs were found in the middle of 6U*L (Figure S3) of all Ae. columnaris and Ae. neglecta accessions. Ae. neglecta differed from Ae. columnaris in the presence of a minor 45S rDNA site in a distal part of an arm of a pair of large metacentric X*-genome chromosome tentatively designated as 6Xt (Figure 8; Figure S1c, arrowed; Figure 2e; Figure S3a). The application of FAM-labeled oligo-probes allowed us to detect very weak minor pTa71-signals at the terminus of 5X*L, a distal quarter of 1U*L, and in a proximal part of 3XcS (Figure S3). Similar signals were obtained on chromosomes of the C-II accession PI 564181 (data not shown). However, these minor sites never appeared when the plasmid DNA was used as a probe, and they were not considered in the analysis.
Apparent differences between C-I, C-II groups, and Ae. neglecta existed in the pattern of 5S rDNA probe. All Ae. columnaris C-I and Ae. neglecta accessions contained ten 5S rDNA signals distributed among four chromosome pairs (Figure S2a,e; Figure S3). The chromosome 1X* possessed two pTa794 sites: one located distally to the NOR, while the second—proximally to it (Figure 8; Figure S1a,c; Figure S2a,e). By contrast, four chromosome pairs in all C-II accessions carried a single 5S rDNA signal each.
In Ae. columnaris and Ae. neglecta labeling patterns of (GAA)n probe were largely consistent with the C-banding patterns, while the (GTT)n hybridized predominantly on the Xc chromosomes (Figure S1g–i). Only 2U*, 4U*, and 5U* contained small (GTT)n sites in pericentromeric/ proximal regions, and a faint signal was present in the middle of the 7UcL arm (Figure 8) in four of the five C-II accessions. By contrast, all Xc genome chromosomes demonstrated prominent (GTT)n signals located predominantly in the proximal chromosome regions. Positions of the (GTT)n clusters on the Xc chromosomes only partially overlapped with the (GAA)n locations; some chromosomes (e.g., 5Xc or 7Xc) that were poorly labeled with (GAA)n, showed extremely heavy labeling with (GTT)n (Figure 8). Hybridization patterns of (ACT)n probe were almost identical to that of (GTT)n (Figure S1m,n).
The pSc119.2 probe hybridized to subtelomeric regions of one or both arms of most Ae. columnaris chromosomes except for 7Xc, which lacks pSc119.2 signals in all C-I and most C-II accessions (Figure 8; Figure S1j,k,n,o). Intercalary sites appeared only on the long arm of 7Uc and rarely on 6UcL, as in a diploid Ae. umbellulata. Labeling patterns of the pSc119.2 probe were polymorphic between and among C-I and C-II accessions (Figure 8). Four of the five C-II accessions studied by FISH possessed intercalary pSc119.2 site also on the chromosome 2UcL (Figure 8c), but this site was never observed in C-I or Ae. neglecta. On the other side, the C-II accession PI 564181 did not possess any pSc119.2 signals on chromosome 2Uc (Figure 8i).
The D-genome specific probes pAs1 and especially pTa−535 were not very informative for chromosome identification in Ae. columnaris and Ae. neglecta. Distinct pAs1 sites were observed in the pericentromeric region of 6U* and 4X* chromosomes of all studied species, whereas 2–3 weak signals were present on 4X*S and 7X*L arms. The chromosome 5Xc of C-I also contained a single, small pAs1 site in the distal half of the short arm. Hybridization sites of the pTa−535 probe emerged on the 6UcL arm, but only in a few accessions studied (Figure S1o; Figure S3b).
The pTa−713 probe hybridized to most Ae. columnaris (C-I and C-II) and Ae. neglecta chromosomes, while 3Uc, 4Xc, and 5Xc (in Ae. neglecta—also 7Xt) lacked the signals completely. In most cases, the distribution of pTa−713 sites on chromosomes of all three groups was similar; however, some differences between them were observed (Figure 8; Figure S4). In particular, a large pTa−713 signal was present on the short arm of 1Uc of all C-I and Ae. neglecta accessions, but it was absent in the C-II. Most C-I and one Ae. neglecta (K−4233) possessed a distinct site in the proximal half of 2UcL, which was not found in C-II and two Ae. neglecta accessions (Figure S4g,h). We did not observe proximal pTa−713 sites in the short arm of 2XcL and 3XcL in the C-II group, but they were present in all C-I and Ae. neglecta accessions. A large pTa−713 signal present on the 1XcL arm of all C-II accessions was never observed in the C-I group or Ae. neglecta (Figure S4). Position of hybridization sites on 5Uc, 6Uc, and 7Uc, was similar in all three groups, but Ae. columnaris differed from Ae. neglecta in morphology and/ or labeling patterns of chromosomes 6X* and 7X* (Figure 8).

2.3. Analysis of Gliadin Spectra of Ae. columnaris

Electrophoretic analysis revealed a high diversity of gliadin spectra in 25 Ae. columnaris accessions and their distinctness from the spectra of Ae. neglecta (Figure S5). Only two of 25 Ae. columnaris accessions, K−4413 and K−4418 from Iran, shared similar gliadin spectra, whereas four C-II accessions included in our analysis were highly diverse. However, all contained electrophoretic (EP) components, whose position did not match the overall pattern specific for Ae. columnaris C-I accessions (Figure 9).
Thus, electrophoretic profiles of PI 564180 and PI 542191 were characterized by low-intense, virtually invisible (“minor”) components in the α-zone; their intensities and position were distinct from other accessions of Ae. columnaris (Figure 9c,d; Figure S5). Based on comparison with the K−1193 spectrum, we proposed that these components can be encoded by both the Xc and Uc genomes (Figure 9).
Protein components located in the ω-zone of the spectra of all Ae. columnaris C-I accessions were similar in intensity and position (Figure S5). Among them, components designated as “2” and “3” (Figure 9, indicated with red dots) corresponded to components detected in the spectrum of K−1193, which were coded by chromosome 1Xc. In contrast to other materials, accession PI 564181 contained the unique double band instead of “component 3” (Figure 9d). In addition, it displayed a distinct distribution of components located in the β–γ zone, which, by comparison with the K−1193 spectrum, can be coded by group-6 chromosomes of the Uc and Xc genomes. Such distribution was more typical for common wheat, and the respective zone was controlled by wheat chromosomes 6B and 6D [35].
Protein components encoded by chromosome 1Uc were characterized by low intensities (Figure 9a,c; indicated by yellow dots). By contrast, the spectra of TA 2084 and PI 564180 possessed several intense components in the upper part of ω-zone designated 1′, 2′, and 3′. By comparing with the spectrum of K−1193, we hypothesized that they could be controlled by the chromosome 1Uc (Figure 9b,c). TA 2084 and PI 564180 spectra shared components 2′ and 3′with similar mobility and intensity, but they differed in the presence of additional minor component 1′, which showed slower mobility in TA2084.

2.4. Variability of the U-Genome Specific U31 Nuclear Fragment in Ae. columnaris and Ae. neglecta

Amplification and further sequencing of the U-genome-specific U31 nuclear fragment was performed with primers U31a and U31b in 15 accessions, including ten Ae. columnaris (K−4225, K−4228, K−4409, K−4413, and PI554186 from different countries and representing chromosomal group C-I, and PI542191, PI564179, PI 564180, PI564181, and TA2084 all from Turkey representing group C-II), two Ae. neglecta from Algeria and Turkey (PI 170209 and AE 646) in comparison with three accessions of their diploid parental species Ae. umbellulata (AE 1339, AE 155, and AE 820) of different geographic origin (Table 1). All accessions analyzed generated 363 bp fragments, except for Ae. columnaris PI 554186. In this accession, the fragment length was reduced to 270 bp due to a 123 bp deletion (Figure 10; Figure S6).
The sequence of the U31 fragment obtained from Ae. columnaris accessions fall into three types, which corresponded to designations proposed earlier by Kadosumi et al. [23] based on fragment length and the presence of MspI restriction site (CCGG). Type-I having the full-length U31 fragment and an intact MspI site was found in seven Ae. columnaris accessions as well as in all analyzed Ae. neglecta and Ae. umbellulata accessions (Figure S6; Figure 10).
The type-II U31 fragment was identified in two Ae. columnaris accessions, both from the C-II chromosomal group (Figure 10). It emerged as a result of sequence changes at the MspI restriction site: a mononucleotide deletion in position 292 was found in TA2084, while C/T290 substitution in PI 564181. Accession PI 554186 (C-I) possessed the type-III U31 fragment with a 123 bp deletion (Figure S6). All U31-alleles assigned to type-II corresponded to those reported by Kadosumi et al. [23] in Ae. columnaris or Ae. neglecta. Among U31 type-I accessions of Ae. columnaris, four allelic variants were found, three of which were novel alleles (Figure 10). Two of them were identified in C-II and one in C-I accession.
The U31 sequences of Ae. umbellulata accessions AE 155 and AE 820 and both Ae. neglecta accessions (PI 170209 and AE 646) belonged to type-I and showed just a few (1–2) nucleotide substitutions, while almost 12 SNPs were detected in the U31 sequence of Ae. umbellulata, AE 1339 from Greece, which was also assigned to type-I (Figure S6). Most of the U31 alleles of Ae. umbellulata or Ae. neglecta discovered in this study (Figure 10) were not identified earlier, and only Ae. neglecta accession PI 170209 carried the same allele as Ae. columnaris (KU−2953A) from Armenia, described earlier by Kadosumi et al. [23].
An ML tree (Figure 11) shows the possible evolutionary relationship between accessions and species based on comparative sequencing of the U31 alleles. All Aegilops accessions except AE 1339 (Ae. umbellulata) formed one common cluster on the tree obtained. No species-specific or ploidy-specific clusters have been observed. Three Ae. columnaris accessions including two of type-II U31 alleles (PI 564179 and PI 564180) and one type-III accession (PI 554186) formed a separate sub-cluster with 79% bootstrap support. Other accessions representing different species (Ae. columnaris and Ae. neglecta) and different U31 allele types (I and II) fall into one common sub-cluster with Ae. umbellulata (AE 115 and AE 820) showing a closer relationship. Ae. neglecta accession (AE 646) form an individual branch.

2.5. Variability of Three Plastome Intergenic Spacers in Ae. columnaris and Ae. neglecta

Variability of three plastome fragments, trnH(gtg)-psbA, trnT(ugu)-trnL(uaa), and rpL32-trnL(tag) DNA, were assessed on the same set of 10 Ae. columnaris accessions as for nuclear U31 fragment. The total length of plastome sequences obtained corresponded to 1825 bp (trnH-psbA—558 bp, trnT-trnL—577 bp, and rpL32-trnL—690 bp). Polymorphism levels differed between the analyzed fragments: only three SNPs were found in the trnT-trnL spacer, while rpL32-trnL and trnH-psbA sequences were much more polymorphic. In contrast to Ae. columnaris, spacer sequences of two Ae. umbellulata accessions (AE 155 and AE 1339) were invariable (Figure 12).
According to the analysis of all three plastome regions, 10 Ae. columnaris accessions split into two groups (plastogroups). Four C-I accessions (K−4225, K−4228, K−4409, and PI 554186) had identical sequences of the plastome spacers, while K−4413 (C-I, Iran) differed at a single site: substitution of the hexamer sequence CCTCAT by ATGAGG at position 470−475 of the rpl32-trnL spacer (Figure 12). Accessions in group C-II, PI542191, PI564179, PI 564180, PI564181, and TA2084, showed significantly higher sequence polymorphisms at all three plastome regions. Nevertheless, they all shared the same deletion of one of the two AAGAA 5-bp repeats, as well as the deletion of the mononucleotide T at position 446. (Figure 12). In addition, they all carried G/T substitution at position 468 of trnT-trnL, as Ae. neglecta and Ae. umbellulata accessions.
C-II accession PI 564179 possessed the highest number of mutations, especially in the rpL32-trnL sequence. Together with C-II accession PI 564181 and Iranian C-I K−4413, it carried ATGAGG/CCTCAT sequence substitution. The same substitution was also identified in Ae. umbellulata and Ae. neglecta (Figure 12). Comparison of the observed plastogroups with groups discriminated based on C-banding and FISH analyses showed that all Ae. columnaris accessions characterized by an increased variability (PI542191, PI564179, PI 564180, PI564181, and TA2084) belonged to group C-II, while low polymorphic accessions (K−4225, K−4228, K−4409, K−4413, PI 554186) fall to C-I.
On the ML tree (Figure S7), all Ae. columnaris accessions with invariable plastome sequences clustered together, whereas K−4413 formed a separate branch in a common sub-cluster with two Ae. umbellulata accessions (bootstrap = 67). Five genetically variable Ae. columnaris accessions fall either in a common sub-group with Ae. neglecta (TA2084, PI 542191, and PI 564180), or formed separate branches (PI 564179, PI 564181) (Figure S7).

3. Discussion

Cytogenetic (C-banding, FISH), biochemical (seed storage proteins—gliadins), and molecular (sequence analysis of polymorphic U31 nuclear fragment and three intergenic regions of cpDNA) analyses showed close genetic relationships between Ae. columnaris and Ae. neglecta, which is in agreements with previous studies [2,4,11,12,15,19,23]. From the other hand, chromosome analysis revealed higher genetic diversity of Ae. columnaris compared to that reported for Ae. neglecta [4,13,23], which was expressed in higher C-banding/FISH-polymorphisms and broader spectra of chromosomal rearrangements as well as by a higher number of U31 alleles and higher variability of cpDNA identified in these species.
Two karyotypic groups, C-I and C-II, have been discriminated within Ae. columnaris based on chromosome analysis and each group displayed characteristic C-banding and FISH patterns. Group C-I was mainly similar to Ae. neglecta, whereas C-II differed from the C-I group of Ae. columnaris and Ae. neglecta in karyotype structure, heterochromatin distribution, and in the patterns of rDNA loci. Such heterogeneity of ribosomal loci was not reported for other Aegilops species [13,36,37,38,39]. Although these karyotypic groups were not supported by comparing gliadin profiles or sequences of the U31 nuclear fragment, they fully agreed with plastogroups discriminated based on cpDNA analysis.
Groups C-I and C-II karyotypically differed from each other, but the divergence level varied between individual chromosomes. Thus, no significant changes were observed in 2Uc, 5Uc, 2Xc, and 6Xc, while 3Uc, 4Uc, 7Uc, 1Xc, 5Xc, and 7Xc of the C-II were modified. Despite it, we found chromosomes among C-II accessions which matched chromosomes of C-I (e.g., 3Uc of PI 554182) or Ae. neglecta (e.g., 4Xc of PI 564180), which can be caused by introgressions. Another evidence of gene flow between species and chromosomal groups came from the analysis of the U31 nuclear fragment: Type-II U31 allele identified in C-II accession PI 564181 (Figure 12) was earlier detected by Kadosumi et al. [23] in four accessions of Ae. neglecta and three Ae. umbellulata, but not in Ae. columnaris. A similar trend was observed in the presence of ATGAGG/CCTCAT substitution in the rpl32-trnL spacer region, which was present in one C-I and two C-II accessions of Ae. columnaris, but also in Ae. neglecta and Ae. umbellulata (Figure 12).
All methods used in our study highlighted significant genetic diversity in both C-I and C-II chromosomal groups, but each of them exhibited a different type of polymorphism. Karyotype divergence in the C-I group was associated with variation in the presence and size of C-bands in particular positions and chromosomal rearrangements identified here in 55% of the accessions studied. However, no polymorphisms that could be associated with introgressions or unbalanced rearrangements have been found. The results of electrophoretic analysis of seed storage proteins led to the same conclusion. Although 25 accessions of Ae. columnaris had unique gliadin profiles, the spectra of most C-I genotypes shared several characteristic bands, especially in the α-zone. The number of U31 alleles identified here in the C-I accessions (Figure 10) was relatively small, and this group displayed very low polymorphism in the intergenic spacers of cpDNA; only one 6-bp-substitution in position 470 of rpl32-trnL was found (Figure 12).
By contrast, accessions constituting the C-II group were highly heterogeneous. Although karyotypes of all accessions carried several diagnostic features discriminating them from the C-I group and Ae. neglecta, the observed variation cannot be explained by polymorphism of heterochromatic regions only. Some variants can be due to introgressions and heterochromatin re-patterning. In contrast to group C-I, chromosomal rearrangements did not play such an essential role in the divergence of the C-II group: translocations were detected only in TA2084, which is geographically distant from others (Table 1; Figure 2). However, minor translocations may exist in other C-II accessions, but they cannot be identified due to the lack of appropriate markers. Significant heterogeneity of the C-II group was also shown by gliadin analysis. All four C-II accessions had different gliadin profiles, which did not possess any common components. The spectra of each of the C-II accessions (PI 564180, PI 564181, TA2084, and PI 542191), however, carried a number of features (band loss or gain; bands that differed in intensity or position) which were not observed in the C-I group.
The comparative sequence analysis of the U31 nuclear fragment and three plastome intergenic spacer regions also revealed the highly heterogeneous composition of the C-II groups. Thus, the U31 fragment of type-I was found in three C-II accessions (Figure 10), but two of them carried mutant alleles. All accessions with type-II U31 fragment belonged to the C-II group. It was an interesting observation because, according to Kadosumi et al. [23], type-II U31 fragment occurred extremely rare in Ae. columnaris, although frequently in Ae. umbellulata. Both type-II alleles identified here in the C-II accessions corresponded to those described earlier by these authors, but they found one allele in Ae. columnaris from Syria, while the second—in Ae. neglecta. Kadosumi et al. [23] also identified an additional type-II U31 allele, not found in this work, in Ae. columnaris from Iran; however, the karyotypic group of this accession was not determined.
In contrast to the relatively conservative C-I group, from three to 27 SNPs covering all three intergenic spacer regions of cpDNA were identified among accessions of the C-II group.
An interesting fact uncovered by molecular analysis of the U31 nuclear fragment was an unexpectedly high number of SNPs (12) identified in Ae. umbellulata accession AE 1339 from Greece (Figure S6), which showed no changes in the cpDNA (Figure 12). According to FISH [40], this accession was karyotypically normal and similar to other Ae. umbellulata genotypes in the distribution of repetitive DNA probes [4,41,42,43,44,45,46]. All these indicated that the observed mutations in AE 1339 were not caused by chromosomal rearrangement. From the other hand, Kawahara [47] has already uncovered the distinctness of Ae. umbellulata population from Greek Islands based on morphological and isozyme markers.
Summarizing our results, we can conclude that Ae. columnaris is phylogenetically very close to Ae. neglecta, and probably derived from this species (or their common ancestor). It is supported by the following observations.
Owing to a species-specific inversion in chromosome 6Xc, the karyotype of Ae. columnaris becomes more “asymmetric” compared to Ae. neglecta. According to Stebbins [48], an increase in karyotype asymmetry is a trend of evolution in plant species and, therefore, Ae. neglecta karyotype should be considered “more primitive”, while Ae. columnaris—“more advanced”;
  • The chromosome 6Xt of Ae. neglecta possesses a minor 45S rDNA locus, which probably pre-existed in the progenitor Aegilops species; however, this locus is absent in Ae. columnaris.
  • Ae. columnaris is characterized by chromosome instability expressed in a higher proportion and broader diversity of chromosomal rearrangements (20 variants in more than 55% of accessions). Chromosome instability is an essential factor of speciation [49,50] and is usually more expressed in phylogenetically new species. In addition, we found significant intraspecific polymorphism in Ae. columnaris plastome, although the only low variation of the chloroplast DNA sequences was recorded in Triticum and Aegilops species [51,52].
The similarity of rDNA and repetitive DNA patterns of chromosomes of Ae. neglecta and group C-I of Ae. columnaris and their distinctness from chromosomes of the C-II accessions indicate that the C-I group diverged from Ae. neglecta or their common ancestor as a result of minor genome modifications. Group C-II could derive from a progenitor presumably belonging to group C-I of Ae. columnaris relatively recently, probably due to introgression from another Aegilops species, accompanied by significant reorganization of the parental genomes. As most C-II accessions with known collection sites originated from a very narrow geographic region of the southeastern coastal part of Turkey (Figure 2, red boxes), they might originate from one common ancestor. Significant heterogeneity of the C-II accessions in karyotype structure, C-banding, and FISH patterns, gliadin composition, and nuclear and chloroplast DNA sequences may indicate that they are currently at the initial stage of species divergence; most likely, this group is undergoing an extensive speciation process.

4. Materials and Methods

Intraspecific diversity of Aegilops columnaris Zhuk. (2n = 4x = 28, UcUcXcXc) was assessed on a set of 69 accessions of various geographic origin in comparison with the related tetraploid species Ae. neglecta Req. ex Bertol. (2n = 4x = 28, UtUtXtXt) —four accessions and Ae. umbellulata Zhuk. (2n = 2x = 14, UU), the diploid U-genome progenitor of Ae. columnaris and Ae. neglecta—three accessions. All 69 accessions were analyzed using C-banding, while 16 Ae. columnaris, three Ae. neglecta, and two Ae. umbellulata accessions were studied by FISH. Gliadin profiles were examined on 25 Ae. columnaris accessions of various geographic origins and one Ae. neglecta (Table 1), whereas 10 Ae. columnaris (five from C-I and five from C-II groups), two Ae. neglecta and three Ae. umbellulata accessions were selected for subsequent molecular analysis.
The materials were obtained from the gene banks of the N.I. Vavilov Institute of Plant Genetic Resources, S.-Petersburg, Russia; USDA-ARS (Aberdeen, Idaho, USA); Wheat Genetics and Genomics Resource Centre (WGGRC), Kansas State University, Kansas, USA; and Leibniz Institute of Plant Genetics and Crop Plant Research (IPK), Gatersleben, Germany. One sample of Ae. columnaris was collected by Drs. E.A. Nazarova and A.G. Gukasyan (Erevan, Armenia) during an expedition of Takhtadjan Institute of Botany (1997) near the village Urznadzor, Armenia. Nine samples were collected in 2005–2006 by Dr. H. Özkan during expeditions to different regions of Turkey.

4.1. DNA Probes

The following DNA probes were used:
  • pTa71 was used as plasmid DNA (a 9 kb long sequence of common wheat encoding 18S, 5.8S and 26S rRNA genes including spacers [53] or the 5′ FAM-end-labeled (Syntol, Moscow, Russia) oligo-probe 5′-GGG CAA AAC CAC GTA CGT GGC ACA CGC CGC CTA-3′ [54];
  • pTa794 was used as plasmid DNA (a 420 bp long sequence of wheat containing the 5S rRNA gene and intergenic spacer [55] or as the 5′ Cy−3-end-labeled (Evrogen, Moscow, Russia) oligo-probe 5′-TCA GAA CTC CGA AGT TAA GCG TGC TTG GGC GAG AGT AGT AC-3′ [56];
  • pSc119.2—a 120 bp long sequence isolated from rye [57];
  • pAs1—a 1 kb fragment derived from Ae. tauschii and belonging to Afa family [58];
  • pTa535−1 was used as 5’ 6-carboxyfluorescein (6-FAM) or 6-carboxytetra-methylrhodamine (TAMRA) end-labeled (MWG, Germany) oligo-probe (5′-AAA AAC TTG ACG CAC GTC ACG TAC AAA TTG GAC AAA CTC TTT CGG AGT ATC AGG GTT TC-3′) [54,59];
  • pTa−713 was used as 5′6-carboxytetra-methylrhodamine (TAMRA) or Cy3 end-labeled oligo-probe (5′-GTC GCG GTA GCG ACG ACG GAC GCC GAG ACG AGC ACG TGA CAC CAT TCC CAC CCT GTC TA-3′) [54,59];
  • The oligo-(GTT)9 probe labeled at the 3′-end with fluorescein−12-dUTP was synthesized in the laboratory of biological microchips at the Engelhardt Institute of Molecular Biology, Moscow, Russia.
  • The oligo-(GAA)10 probe labeled at the 3′-end with fluorescein−12-dUTP or Cy3 was synthesized in the laboratory of biological microchips at the Engelhardt Institute of Molecular Biology, Moscow, Russia.
  • The oligo-(ACT)10 probe labeled at the 3′-end with Cy3 was synthesized in the laboratory of biological microchips at the Engelhardt Institute of Molecular Biology, Moscow, Russia.

4.2. Giemsa C-Banding Method

The C-banding procedure was carried out as described in Badaeva et al. [60]. Chromosomes of Ae. columnaris were classified according to genetic nomenclature developed earlier by Badaeva et al. [20] based on analysis of introgressive lines. Chromosomes of Ae. neglecta were classified according to similarity with Ae. columnaris chromosomes. Designation of Ae. umbellulata chromosomes followed the nomenclature suggested by Friebe et al. [41].

4.3. Fluorescence In Situ Hybridization

FISH was carried out according to the protocol described in Badaeva et al. [61]. The probes labeled with fluorescein were detected using anti-fluorescein/Oregon green®, rabbit IgG fraction, Alexa Fluor® 488 conjugate (Molecular Probes, Eugene, OR, USA). The slides were counter-stained with DAPI (4′,6-diamidino-2-phenylindole) in Vectashield mounting media (Vector Laboratories, Peterborough, UK) and examined on a Zeiss Imager D−1 microscope. Selected metaphase cells were captured with AxioCam MRm digital camera using software AxioVision, version 4.6. Images were processed in Adobe PhotoshopR, version CS5 (Adobe Systems, Edinburgh, UK).

4.4. Seed Storage Protein (Gliadin) Analysis

Electrophoresis (EP) in polyacrylamide gel (PAG) according to the previously published protocol [62] was employed to obtain gliadin spectra of the 25 Ae. columnaris and one Ae. neglecta accessions. The spectra of wheat cultivar Bezostaya−1 (a standard for gliadin spectra of common wheat) and Ae. columnaris K−1193 with the known genetic control of gliadin components [27] were used to compare gliadin profiles of other Aegilops accessions (Figure 9a).

4.5. DNA Extraction, PCR Amplification, and DNA Sequencing

Ten accessions of Ae. columnaris (five C-I representing five countries and five C-II from Turkey), Ae. umbellulata (3 accessions) and Ae. neglecta (2 accessions) were selected for analyses by molecular methods. Genomic DNA was extracted from 10-day-old seedlings using the DNeasy Plant Mini kit (QIAGEN, Hilden, Germany). DNA quantitative and qualitative evaluation was performed using NanoDrop 2000c spectrophotometer (ThermoFisher-Scientific, Madison, WI, USA).
Amplification of the U-genome-specific U31 nuclear fragment was performed using primers U31a and U31b [23] with PCR conditions: an initial denaturation step of 95 °C for 5 min followed by 30 cycles of 94 °C for 1 min, 55 °C for 1 min, and 72 °C for 1 min with a final extension step at 72 °C for 3 min. The amplified fragments were sequenced directly from both ends with the same U31a and U31b primers.
Amplification of the three intergenic spacers regions (trnH(ugu)-psbA, rpl32-trnL(tag), trnT(ugu)-trnL(uaa)) of the plastome DNA of Aegilops accessions was performed using primer sets listed in Table S1. PCR amplification was performed in a 15 μL reaction mixture containing approximately 50 ng genomic DNA, 1.5 μL of 10× PCR buffer, 1.5 mM MgCl2, 0.2 mM of dNTPs, 0.3 μM of each primer, and 0.5 unit of Taq DNA polymerase. The PCR conditions were as follows: an initial denaturation step of 95 °C for 5 min, followed by 30 cycles of 94 °C for 1 min, annealing at the appropriate Tm for 1 min, and 72 °C for 1 min with a final extension step at 72 °C for 5 min. Annealing temperatures for trnH-psbA was 58 °C; trnL-rpl32—56 °C; and trnT-trnL—55 °C. The same primers were used to sequence the obtained chloroplast DNA fragments; PCR products were cleaned before sequencing using the QIAquick PCR purification kit (QIAGEN, Hilden, Germany). PCR products were sequenced using standard protocols with the ABI Prism Big Dye Terminator cycle sequencing kit v. 3.1. Sequences were resolved on an ABI Prism 3100 automated sequencer.
A phylogenetic tree was constructed based on U31 data and combined chloroplast sequence data using MEGA 7 [63] based on ML (maximum likelihood) method. Kimura 2-parameter model was used for U31 and Tamura−3 parameter model for cpDNA, which was selected using Modeltest; 1000 bootstrap replicates were applied for the branch support evaluation. The SNP data from 10 Ae. columnaris genotypes were taken for subsequent analyses. The SNP position was determined from the first nucleotide of U31 or of each of the analyzed chloroplast spacers.

Supplementary Materials

The following are available online at https://www.mdpi.com/article/10.3390/plants10050956/s1, Figure S1. Hybridization of different DNA probes on chromosomes of C-I (a,d,g,j,n,o) and C-II (b,e,h,k,m) groups of Ae. columnaris in comparison with Ae. neglecta—T (c,f,i,l,m). Chromosomal group, accession numbers, and probe combinations are given on corresponding cell images; the labeling of probe color corresponds to signal color. Chromosomes are numbered according to genetic nomenclature; the Uc chromosomes are labeled with yellow, while the Xc–white letters. Scale bar–10 µm. Figure S2. Sequential FISH with 5S (red) and 45S (green) rDNA probes (a,c,e) followed by hybridization with (GAA)n (green) and pTa-713 (red) (b,d,f) on chromosomes of Ae. columnaris accessions AE 1607 (C-I, (a,b)), PI 542191 (C-II, (c,d)), and Ae. neglecta accession PI 564182. Chromosomes are designated according to genetic nomenclature, the Uc chromosomes are labeled with white and Xc with yellow letters. Translocated T6Uc:7Xc chromosomes are indicated with red arrowheads (b); white arrows point to the positions of minor NORs on chromosome 1Xc (c). Green arrows point to minor NORs on chromosome 6Xtr (f). Owing to a limited space of metaphase images, the superscripts “c” and ‘tr’ are omitted in the figure. Figure S3. Location of minor NORs on chromosomes of Ae. neglecta, PI 564182, by sequential FISH with oligo-probes pTa71-1 (green) and pTa794 (red)–(a), followed by (GAA)n (red) and pAs1 (green)–(b). Minor NORs are indicated with arrows (a), and the respective chromosomes are identified according to their (GAA)n-FISH patterns (b). Figure S4. Diversity of the pTa-713 probe patterns on chromosomes of Ae. columnaris, C-I (a–f) in comparison with Ae. neglecta, T (g,h) and Ae. columnaris, C-II (i–l): (a)–AE 1607; (b)–K-4241; (c)–K-1193; (d)–i-570045); (e)–PI 486281; (f)–PI 554178; (g)–PI 564182; (h)–IG 170209; (i)–PI 542191; (j)–PI 564181; (k)–TA2084; (l)–PI 564180. Chromosomes are classified based on pSc119.2 (a,l) or (GAA)n-labelling patterns (b–k), green signals. Hybridization sites of pTa-713 probe are visualized in red. Chromosomes are classified according to genetic nomenclature; translocated chromosomes are designated. Invariable pTa-713 sites are underlined with yellow dotted lines. Figure S5. Diversity of gliadin spectra of Ae. columnaris accessions collected from different countries in comparison with Ae. neglecta (N). Accession numbers are shown on the top, while their geographic origin—on the bottom of the figure. α, β, γ, and ω—zones in electrophoretic spectra. Figure S6. Nucleotide variability in the U31 region of analyzed Aegilops accessions. The MspI restriction site is highlighted in yellow. Figure S7. Maximum-Likelihood (Tamura-3 parameter model) phylogenetic tree of combined trnH-psbA, trnT-trnL, rpL32-trnL sequences; the numbers above the branches indicate bootstrap values: branch length was measured in a number of substitutions per site. Table S1. Primers for amplification and sequencing of plastome fragments.

Author Contributions

E.D.B. planned experiments; performed C-banding and FISH analyses, wrote the manuscript; N.N.C., M.K.B., H.Ö.—provided material for the analysis, S.A.S.—synthesized oligo-probes for FISH analysis; A.N.F. and A.Y.D.—performed gliadin analysis; E.Z.K.—performed the analysis of nuclear and chloroplast DNA, and wrote the manuscript. All authors have read and agreed to the published version of the manuscript.

Funding

The work was performed within the framework of the State Task according to the theme plan, Projects No. 0662-2019-0006 (VIR), No 0112-2019-0002 (VIGG), No. 19-119021490115-2 (Research Center of Biotechnology), and with partial support from the Russian Foundation for Basic Research (project No. 20-04-00284a).

Institutional Review Board Statement

The study was conducted according to the guidelines of the Declaration of Helsinki, and approved by the Institutional Ethics Committee of N. I. Vavilov Institute of General Genetics, Russian Academy of Sciences, Moscow, Russia.

Informed Consent Statement

Informed consent was obtained from all subjects.

Data Availability Statement

The data presented in this study are available in Supplementary Material, Figure S6.

Acknowledgments

Materials for analysis were obtained from collections of N. I. Vavilov Institute of Plant Genetic Resources (VIR), St-Petersburg, Russia; small grain collection of USDA-ARS, Aberdeen, Idaho, USA; Wheat Genetics and Genomics Resource Centre, Kansas State University, Kansas, USA; IPK, Gatersleben, Germany. Nine samples were collected by H. Özkan in Turkey, and one sample was kindly provided by E.A. Nazarova and A.G. Gukasyan, Institute of Botany after A. Takhtajyan, Academy of Sciences of the Republic of Armenia, Erevan

Conflicts of Interest

The authors declare no conflict of interest.

References

  1. Van Slageren, M.W. Wild Wheats: A Monograph of Aegilops L. and Amblyopyrum (Jaub. et Spach) Eig (Poaceae); Wageningen Agricultural University: Wageningen, The Netherlands, 1994; p. 514. [Google Scholar]
  2. Kilian, B.; Mammen, K.; Millet, E.; Sharma, R.; Graner, A.; Salamini, F.; Hammer, K.; Özkan, H. Aegilops. Wild Crop Relatives: Genomic and Breeding Resources; Kole, C., Ed.; Springer: Berlin/Heidelberg, Germany, 2011; pp. 1–76. [Google Scholar]
  3. Witcombe, J.R. A Guide to the Species of Aegilops l. Their Taxonomy, Morphology and Distribution; IBPGR Secretariat: Rome, Italy, 1983; p. 74. [Google Scholar]
  4. Abdolmalaki, Z.; Mirzaghaderi, G.; Mason, A.S.; Badaeva, E.D. Molecular cytogenetic analysis reveals evolutionary relationships between polyploid Aegilops species. Plant Syst. Evol. 2019, 305, 459–475. [Google Scholar] [CrossRef]
  5. Zhukovsky, P.M. A critical-systematical survey of the species of the genus Aegilops L. Bull. Appl. Bot. Genet. Plant Breed. 1928, 18, 417–609. (In Russian) [Google Scholar]
  6. Eldarov, M.; Aminov, N.; van Slageren, M. Distribution and ecological diversity of Aegilops L. in the Greater and Lesser Caucasus Regions of Azerbaijan. Genet. Resour. Crop. Evol. 2015, 62, 265–273. [Google Scholar] [CrossRef]
  7. Haruntyunyan, M.; Dulloo, M.E.; Yeritsyan, N.; Danielyan, A. Red List assessment of nine Aegilops species in Armenia. Genet. Resour. Crop. Evol. 2010, 57, 1177–1189. [Google Scholar] [CrossRef] [Green Version]
  8. Ohta, S.; Iwasaki, R.; Mori, N.; Ozkan, H. Geographical Distribution of Two Varieties of Aegilops neglecta and Ae. columnaris in Southern Turkey Revealed by the Field Researches from 2003 to 2005; Fukui Prefectural University: Eiheiji, Japan, 2006; pp. 38–43. [Google Scholar]
  9. Goryunova, S.V.; Chikida, N.N.; Kochieva, E.Z. RAPD analysis of the intraspecific and interspecific variation and phylogenetic relationships of Aegilops L. species with the U genome. Russ. J. Genet. 2010, 46, 841–854. [Google Scholar] [CrossRef]
  10. Kimber, G.; Feldman, M. Wild Wheat, An Introduction; Special Report 353; College of Agriculture University of Missouri: Columbia, SC, USA, 1987; p. 142. [Google Scholar]
  11. Resta, P.; Zhang, H.-B.; Dubcovsky, J.; Dvorak, J. The Origins of the Genomes of Triticum biunciale, T. ovatum, T. neglectum, T. columnare, and T. rectum (Poaceae) Based on Variation in Repeated Nucleotide Sequences. Am. J. Bot. 1996, 83, 1556. [Google Scholar] [CrossRef] [Green Version]
  12. Edet, O.U.; Gorafi, Y.S.A.; Nasuda, S.; Tsujimoto, H. DArTseq-based analysis of genomic relationships among species of tribe Triticeae. Sci. Rep. 2018, 8, 16397. [Google Scholar] [CrossRef] [PubMed]
  13. Badaeva, E.D.; Amosova, A.V.; Samatadze, T.E.; Zoshchuk, S.A.; Shostak, N.G.; Chikida, N.N.; Zelenin, A.V.; Raupp, W.J.; Friebe, B.; Gill, B.S. Genome differentiation in Aegilops. 4. Evolution of the U-genome cluster. Plant Syst. Evol. 2004, 246, 45–76. [Google Scholar] [CrossRef]
  14. Cui, L.; Ren, Y.; Murray, T.D.; Yan, W.; Guo, Q.; Niu, Y.; Sun, Y.; Li, H. Development of Perennial Wheat Through Hybridization Between Wheat and Wheatgrasses: A Review. Engineering 2018, 4, 507–513. [Google Scholar] [CrossRef]
  15. Kihara, H. Genomanalyse bei Triticum und Aegilops IX. Cytologia 1949, 14, 135–144. [Google Scholar] [CrossRef] [Green Version]
  16. Kihara, H. Considerations on the Evolution and Distribution of Aegilops Species Based on the Analyser-method. Cytologia 1954, 19, 336–357. [Google Scholar] [CrossRef] [Green Version]
  17. Kihara, H. Interspecific relationship in Triticum and Aegilops. Seiken Ziho 1963, 15, 1–12. [Google Scholar]
  18. Kimber, G.; Yen, Y. Hybrids involving wheat relatives and autotetraploid Triticum umbellulatum. Genome 1989, 32, 1–5. [Google Scholar] [CrossRef]
  19. Chennaveeraiah, M.S. Karyomorphologic and cytotaxonomic studies in Aegilops. Acta Hort. Gotobg. 1960, 23, 85–186. [Google Scholar]
  20. Badaeva, E.D.; Ruban, A.S.; Shishkina, A.A.; Sibikeev, S.N.; Druzhin, A.E.; Surzhikov, S.A.; Dragovich, A.Y. Genetic classification of Aegilops columnaris Zhuk. (2n = 4x = 28, UcUcXcXc) chromosomes based on FISH analysis and substitution patterns in common wheat × Ae. columnaris introgressive lines. Genome 2018, 61, 131–143. [Google Scholar] [CrossRef]
  21. Ogihara, Y.; Tsunewaki, K. Molecular basis of the genetic diversity of the cytoplasm in Triticum and Aegilops. I. Diversity of the chloroplast genome and its lineage revealed by the restriction pattern of ct-DNAs. Jpn. J. Genet. 1982, 57, 371–396. [Google Scholar] [CrossRef] [Green Version]
  22. Tsunewaki, K. Plasmon analysis as the counterpart of genome analysis. In Methods of Genome Analysis in Plant: Their Merits and Pitfalls; Jauhar, P.P., Ed.; CRC Press: Boca Raton, FL, USA, 1996; pp. 271–299. [Google Scholar]
  23. Kadosumi, S.; Kawahara, T.; Sasanuma, T. Multiple origins of U genome in two UM genome tetraploid Aegilops species, Ae. columnaris and Ae. triaristata, revealed based on the polymorphism of a genome-specific PCR fragment. Genes Genet. Syst. 2005, 80, 105–111. [Google Scholar] [CrossRef] [Green Version]
  24. Tsunewaki, K.; Mukai, Y.; Endo, T.R.; Tsuji, S.; Murata, M. Genetic diversity of the cytoplasm in Triticum and Aegilops. V. Classification of 23 cytoplasms into eight plasma types. Jpn. J. Genet. 1976, 51, 175–191. [Google Scholar] [CrossRef] [Green Version]
  25. Kimber, G.; Tsunewaki, K. Genome Symbols and Plasma Types in the Wheat Group, Proceedings of the 7th International Wheat Genetics Symposium, Cambridge, UK, 13−19 July 1988; Miller, T.E., Koebner, R.M.D., Eds.; Institute of Plant Science Research: Cambridge, UK, 1988; pp. 1209–1210. [Google Scholar]
  26. Dvořák, J. Genome Analysis in the Triticum-Aegilops Alliance. In Proceedings of the 9th International Wheat Genetics Symposium, Saskatoon, Saskatchewan, 2−7 August 1998; pp. 8–11. [Google Scholar]
  27. Novoselskaya-Dragovich, A.Y.; Yankovskaya, A.A.; Badaeva, E.D. Alien introgressions and chromosomal rearrangements do not affect the activity of gliadin-coding genes in hybrid lines of Triticum aestivum L. × Aegilops columnaris Zhuk. Vavilov J. Genet. Breed. 2018, 22, 507–514. [Google Scholar] [CrossRef]
  28. Metakovsky, E.; Branlard, G.; Graybosch, R. Chapter 2—Gliadins of Common Wheat: Polymorphism and Genetics. In Gliadin and Glutenin: The Unique Balance of Wheat Quality; Wrigley, C., Békés, F., Bushuk, W., Eds.; AACC Internat: Saint Paul, MN, USA, 2006; pp. 35–84. [Google Scholar]
  29. Metakovsky, E.; Graybosch, R. Chapter 3—Gliadin Alleles in Wheat: Identification and Applications. In Gliadin and Glutenin: The Unique Balance of Wheat Quality; Wrigley, C., Békés, F., Bushuk, W., Eds.; AACC Internat: Saint Paul, MN, USA, 2006; pp. 85–114. [Google Scholar]
  30. Dudnikov, A.J. Polymorphism of gliadins in Aegilops tauschii Coss. local populations in two primary habitats in Dagestan. Genet. Resour. Crop. Evol. 2017, 65, 845–854. [Google Scholar] [CrossRef]
  31. Yan, Y.M.; Hsam, S.L.K.; Yu, J.Z.; Jiang, Y.; Zeller, F.J. Genetic polymorphisms at Gli-Dt gliadin loci in Aegilops tauschii as revealed by acid polyacrylamide gel and capillary electrophoresis. Plant Breed. 2003, 122, 120–124. [Google Scholar] [CrossRef]
  32. Konarev, V.G. Wheat Proteins; Kolos: Moscow, Russia, 1980; p. 351. (In Russian) [Google Scholar]
  33. Cole, E.W.; Fullington, J.G.; Kasarda, D.D. Grain protein variability among species of Triticum and Aegilops: Quantitative SDS-PAGE studies. Theor. Appl. Genet. 1981, 60, 17–30. [Google Scholar] [CrossRef]
  34. Medouri, A.; Bellil, L.; Khelifi, D. The genetic diversity of gliadins in Aegilops geniculata from Algeria. Czech J. Genet. Plant Breed. 2016, 51, 9–15. [Google Scholar] [CrossRef] [Green Version]
  35. Metakovsky, E.V. Gliadin allele identification in common wheat. II. Catalogue of gliadin alleles in common wheat. J. Genet. Breed 1991, 45, 325–344. [Google Scholar]
  36. Badaeva, E.D.; Friebe, B.; Gill, B.S. Genome differentiation in Aegilops. 2. Physical mapping of 5S and 18S–26S ribosomal RNA gene families in diploid species. Genome 1996, 39, 1150–1158. [Google Scholar] [CrossRef]
  37. Badaeva, E.D.; Amosova, A.V.; Muravenko, O.V.; Samatadze, T.E.; Chikida, N.N.; Zelenin, A.V.; Friebe, B.; Gill, B.S. Genome differentiation in Aegilops. 3. Evolution of the D-genome cluster. Plant Syst. Evol. 2002, 231, 163–190. [Google Scholar] [CrossRef]
  38. Yamamoto, M. Distribution of Ribosomal RNA Genes in Aegilops and Triticum Chromosomes; Bulletin of Kansai Women’s College: Osaka, Japan, 1992; Volume 2, pp. 25–37. (In Japanese) [Google Scholar]
  39. Yamamoto, M. Detection of Ribosomal RNA Genes in Aegilops by in Situ Hybridization; Bulletin of Osaka Private College Association: Osaka, Japan, 1992; Volume 29, pp. 77–82. (In Japanese) [Google Scholar]
  40. Badaeva, E.D.; Chikida, N.N.; Belousova, M.K.; Ruban, A.S.; Surzhikov, S.A.; Zoshchuk, S.A. A new insight on the evolution of polyploid Aegilops species from the complex Crassa: Molecular-cytogenetic analysis. Plant Syst. Evol. 2021, 307, 1–18. [Google Scholar] [CrossRef]
  41. Friebe, B.; Jiang, J.; Tuleen, N.; Gill, B.S. Standard karyotype of Triticum umbellulatum and the characterization of derived chromosome addition and translocation lines in common wheat. Theor. Appl. Genet. 1995, 90, 150–156. [Google Scholar] [CrossRef]
  42. Molnár, I.; Molnár-Láng, M. Visualization of U and M genome chromosomes by multicolour genomic in situ hybridization in Aegilops biuncialis and Triticum aestivum-Ae. biuncialis amphiploids. Acta Agron. Hung. 2010, 58, 195–202. [Google Scholar] [CrossRef]
  43. Molnár, I.; Kubaláková, M.; Šimková, H.; Cseh, A.; Molnár-Láng, M.; Doležel, J. Chromosome Isolation by Flow Sorting in Aegilops umbellulata and Ae. comosa and Their Allotetraploid Hybrids Ae. biuncialis and Ae. geniculata. PLoS ONE 2011, 6, e27708. [Google Scholar] [CrossRef]
  44. Molnár, M.L.; Vrána, J.; Burešová, V.; Cápal, P.; Farkas, A.; Darkó, É.; Cseh, A.A.; Kubaláková, M.; Molnár-Láng, M.; Doležel, J. Dissecting the U, M, S and C genomes of wild relatives of bread wheat (Aegilops spp.) into chromosomes and exploring their synteny with wheat. Plant J. 2016, 88, 452–467. [Google Scholar] [CrossRef] [PubMed] [Green Version]
  45. Song, Z.; Dai, S.; Bao, T.; Zuo, Y.; Xiang, Q.; Li, J.; Liu, G.; Yan, Z. Analysis of Structural Genomic Diversity in Aegilops umbellulata, Ae. markgrafii, Ae. comosa, and Ae. uniaristata by Fluorescence In Situ Hybridization Karyotyping. Front. Plant Sci. 2020, 11, 710. [Google Scholar] [CrossRef] [PubMed]
  46. Badaeva, E.D.; Friebe, B.; Gill, B.S. Genome differentiation in Aegilops. 1. Distribution of highly repetitive DNA sequences on chromosomes of diploid species. Genome 1996, 39, 293–306. [Google Scholar] [CrossRef]
  47. Kawahara, T. Morphological and isozyme variation in genebank accessions of Aegilops umbellulata Zhuk., a wild relative of wheat. Genet. Resour. Crop. Evol. 2002, 49, 89–94. [Google Scholar] [CrossRef]
  48. Stebbins, L. Chromosomal Evolution in Higher Plants; Addison-Wesley: London, UK, 1971; p. 216. [Google Scholar]
  49. Dion-Côté, A.-M.; Barbash, D.A. Beyond speciation genes: An overview of genome stability in evolution and speciation. Curr. Opin. Genet. Dev. 2017, 47, 17–23. [Google Scholar] [CrossRef]
  50. Fishman, L.; Stathos, A.; Beardsley, P.M.; Williams, C.F.; Hill, J.P. Chromosomal Rearrangements and the Genetics of Reproductive Barriers Inmimulus (Monkey Flowers). Evolution 2013, 67, 2547–2560. [Google Scholar] [CrossRef] [PubMed]
  51. Gornicki, P.; Zhu, H.; Wang, J.; Challa, G.S.; Zhang, Z.; Gill, B.S.; Li, W. The chloroplast view of the evolution of polyploid wheat. New Phytol. 2014, 204, 704–714. [Google Scholar] [CrossRef] [PubMed]
  52. Bernhardt, N.; Brassac, J.; Kilian, B.; Blattner, F.R. Dated tribe-wide whole chloroplast genome phylogeny indicates recurrent hybridizations within Triticeae. BMC Evol. Biol. 2017, 17, 1–16. [Google Scholar] [CrossRef] [Green Version]
  53. Gerlach, W.L.; Bedbrook, J.R. Cloning and characterization of ribosomal RNA genes from wheat and barley. Nucleic Acids Res. 1979, 7, 1869–1885. [Google Scholar] [CrossRef]
  54. Tang, Z.; Yang, Z.; Fu, S. Oligonucleotides replacing the roles of repetitive sequences pAs1, pSc119.2, pTa-535, pTa71, CCS1, and pAWRC.1 for FISH analysis. J. Appl. Genet. 2014, 55, 313–318. [Google Scholar] [CrossRef]
  55. Gerlach, W.; Dyer, T. Sequence organization of the repeating units in the nucleus of wheat which contain 5S rRNA genes. Nucleic Acids Res. 1980, 8, 4851–4865. [Google Scholar] [CrossRef] [Green Version]
  56. Yu, Z.; Wang, H.; Xu, Y.; Li, Y.; Lang, T.; Yang, Z.; Li, G. Characterization of Chromosomal Rearrangement in New Wheat—Thinopyrum intermedium Addition Lines Carrying Thinopyrum—Specific Grain Hardness Genes. Agronomy 2019, 9, 18. [Google Scholar] [CrossRef] [Green Version]
  57. Bedbrook, J.; Jones, J.; O’Dell, M.; Thompson, R.; Flavell, R. A molecular description of telomeric heterochromatin in Secale species. Cell 1980, 19, 545–560. [Google Scholar] [CrossRef]
  58. Rayburn, A.L.; Gill, B.S. Isolation of a D-genome specific repeated DNA sequence from Aegilops squarrosa. Plant Mol. Biol. Rep. 1986, 4, 102–109. [Google Scholar] [CrossRef]
  59. Komuro, S.; Endo, R.; Shikata, K.; Kato, A. Genomic and chromosomal distribution patterns of various repeated DNA sequences in wheat revealed by a fluorescence in situ hybridization procedure. Genome 2013, 56, 131–137. [Google Scholar] [CrossRef] [PubMed]
  60. Badaeva, E.D.; Badaev, N.S.; Gill, B.S.; Filatenko, A.A. Intraspecific karyotype divergence in Triticum araraticum (Poaceae). Plant Syst. Evol. 1994, 192, 117–145. [Google Scholar] [CrossRef]
  61. Badaeva, E.D.; Ruban, A.S.; Aliyeva-Schnorr, L.; Municio, C.; Hesse, S.; Houben, A. In Situ Hybridization to Plant Chromosomes. In Fluorescence In Situ Hybridization (FISH) Application Guide; Liehr, T., Ed.; Springer: Berlin, Germany, 2017; pp. 477–494. [Google Scholar]
  62. Metakovsky, E.V.; Novoselskaya, A.Y. Gliadin allele identification in common wheat 1. Methodological aspects of the analysis of gliadin patterns by one-dimensional polyacrylamide gel electrophoresis. J. Genet. Breed. 1991, 45, 317–324. [Google Scholar]
  63. Kumar, S.; Stecher, G.; Tamura, K. MEGA7: Molecular Evolutionary Genetics Analysis Version 7.0 for Bigger Datasets. Mol. Biol. Evol. 2016, 33, 1870–1874. [Google Scholar] [CrossRef] [PubMed] [Green Version]
Figure 1. C-banded metaphase cells of accessions representing two karyotypic groups of Ae. columnaris (ac) in comparison with Ae. neglecta (d): (a)—IG 48818 (C-I); (b)—PI 564180 (C-II), (c)—the F1 hybrid of Ae. columnaris (K−4224) × Ae. triuncialis (genotype unknown) carrying reciprocal translocations 1Uc:5Uc derived from Ae. columnaris and 1Ut:7Ct derived from Ae. triuncialis; (d)—Ae. neglecta (K−4553). Chromosomes are designated according to genetic nomenclature; the Uc/Utr chromosomes are labeled in dark green, the Xc/Xtr chromosomes in dark blue, the Ct of Ae. triuncialis—in red, and the Ut in grey color). Red arrowheads point to satellite chromosomes. Blue arrows show translocated 5Uc:6Xc chromosomes (a).
Plants 10 00956 g001
Figure 2. Geographic distribution of the C-I (blue boxes) and C-II (red boxes) accessions of Ae. columnaris with known collection sites. Accessions carrying pericentric inversion of 7Uc are outlined with a green dotted line.
Plants 10 00956 g002
Figure 3. Polymorphisms of the C-banding patterns of Syrian and Lebanese accessions of Ae. columnaris (as) in comparison with Ae. neglecta (tv): (a)—K−4372; (b)—K−4362; (c)—PI 486196; (d)—K−2680; (e)—PI 487198; (f)—K−4009 (Syria); (g)—K−4241a; (h)—K−4241b; (i)—K−4004; (j)—K−4003; (k)—K−4407; (l)—K−4406; (m)—K−4007; (n)—IG 49067; (o)—K−4409 (Lebanon); (p)—TX01; (q)—Clae34; (r)—AE 1521; (s)—AE 1607a (unknown origin); (t)—PI 564182 (Turkey); (u)—K−4233; (v)—K−4553 (Armenia). 1Uc–7Xc—chromosomes; translocated chromosomes are indicated with arrows and designated, respectively.
Plants 10 00956 g003
Figure 4. Polymorphisms of the C-banding patterns of Turkish C-I accessions of Ae. columnaris: (a)—PI 560506; (b)—K-PI 554180; (c)—PI 560507; (d)—PI 486281; (e)—PI 554186; (f)—PI 554188; (g)—PI 554190; (h)—PI 554185; (i)—PI 554187N; (j)—PI 554187T; (k)—PI 554178; (l)—PI 554186; (m)—K−4002; (n)—H−6; (o)—H−7; (p)—H−10; (q)—H−3; (r)—H−9; (s)—H−4; (t)—PI 542171; (u)—PI 554184; (v)—H−8; (w)—H−1; (x)—i−570045; (y)—TA2106. 1Uc–7Xc—chromosomes; translocated chromosomes are indicated with arrows and designated, respectively.
Plants 10 00956 g004
Figure 5. Translocation variants identified among 62 Ae. columnaris accessions belonging to group C-I. T1–T20—translocation variants; normal chromosomes are labeled with black letters and are shown below the respective chromosomes; arm combinations in translocated chromosomes are labeled with red letters. Inversions are identified—with blue. Red arrows point to possible translocation breakpoints, and blue arrows point to possible breakpoint positions in inverted chromosomes. Long black arrows define translocation lineages.
Plants 10 00956 g005
Figure 6. Polymorphisms of the C-banding patterns of Transcaucasian (ar) and Iranian (sv) accessions of Ae. columnaris: (a)—K−2344; (b)—K−4224a; (c)—K−4229; (d)—K−1512; (e)—K–4228; (f)—K−1178; (g)—K−1495; (h)—PI 499258; (i)—K−1193; (j)—K−4225; (k)—K−4551; (l)—N−1; (m)—N−2; (n)—N−3; (o)—K−4224b; (p)—K−564; (q)—PI 276457; (r)—PI 574457; (s)—K−4240; (t)—K−4418; (u)—IG 48818; (v)—K−4413. 1Uc–7Xc—chromosomes; translocated chromosomes are indicated with arrows and designated, respectively.
Plants 10 00956 g006
Figure 7. Polymorphisms of the C-banding patterns of Ae. columnaris accessions belonging to group C-II in comparison with C-I accession (i−570045). (a)—K−3899 (Iraq); (b)—PI 542191; (c)—PI 564181; (d)—PI 554182; (e)—PI 564180; (f)—PI 564179; (g)—TA2084 (all from Turkey). C-I accession i−570045 (=PI 554184) from Turkey is shown for comparison. Rearranged chromosomes are indicated with black arrows. The red arrow indicates a chromosome, which was presumably introgressed from the C-I group; green arrow shows the chromosome, which could be introgressed from Ae. neglecta.
Plants 10 00956 g007
Figure 8. Comparison of the C-banding patterns with the distribution of different types of repeats on chromosomes of Ae. neglecta (N) and C-I and C-II groups of Ae. columnaris. The color of (GAA)n, (GTT)n, pTa71, and pTa794 probes on the respective idiograms corresponds to their color on chromosomal images. Probe combinations: 1—(GAA)n (green) + pTa−713 (red); 2—pSc119.2 (green) + pTa−713 (red); 3—pSc119.2 (green) + pAs1 (red). Positions of pSc119.2 sites on idiograms are shown in green, pAs1—in pink, and pTa713—in yellow. Accessions codes: (a)—PI 564182, (e)—K−4233; (j)—PI 170209 (Ae. neglecta); (b)—H−1 (sample provided by Dr. H. Ozkan); (d)—i−570045; (f)—PI 554181; (g)—K−2680; (k)—AE 1607 (Ae. columnaris, C-I); (c)—PI 564180; (h)—TA2084; (i)—PI 564181; (l)—PI 542181 (Ae. columnaris, C-II). Arm combinations on rearranged chromosomes are labeled.
Plants 10 00956 g008
Figure 9. Ae. columnaris with the most distinct gliadin spectra: (a) gliadin spectrum of a model Ae. columnaris accession K−1193 in comparison with etalon spectrum of wheat cultivar Bezostaya−1 (Bez−1). Blocks of linked electrophoretic gliadin components controlled by a single locus of the particular Ae. columnaris chromosome [27] are shown schematically at the right side of the electrophoretic spectrum; (b) EP spectrum of the accession TA2084 in comparison with wheat cultivar Bezostaya−1; (c) EP spectrum of PI 564180; (d) EP spectra of Ae. columnaris accessions illustrating protein components presumably encoded by the Xc (red dots) and Uc (yellow dots) chromosomes. The unique components, which were not found in any other Ae. columnaris accessions, are shown schematically (parts (bd)).
Plants 10 00956 g009
Figure 10. Nucleotide substitutions in the U31 region in 15 Ae. columnaris (UcUcXcXc), Ae. neglecta (UtUtXtXt), and Ae. umbellulata (UU) sequences. Dots correspond to nucleotides identical to consensus sequences. The MspI restriction site is highlighted in red.
Plants 10 00956 g010
Figure 11. Maximum-likelihood (Kimura 2-parameter model) tree of the U-genome-specific U31 nuclear sequence. The numbers above the branches indicate bootstrap values; the C-banding group is shown in red, U31 allele type—in green.
Plants 10 00956 g011
Figure 12. Nucleotide substitutions in trnH-psbA, trnT-trnL, rpL32-trnL plastome regions in 13 Ae. columnaris (UcUcXcXc), Ae. neglecta (UtUtXtXt), and Ae. umbellulata (UU) sequences. Dots correspond to nucleotides identical to consensus sequences.
Plants 10 00956 g012
Table 1. The list of materials studied and their origins.
NoAccession #DuplicatesCountry of OriginCollection SiteLatitude
(N)
Longitude
(E)
Alt.
(h, m)
Analyzed by FISH
1 1K−1178-ArmeniaAznaburt vil., near Dash Agl mountain39.433345.28331600-
2 1K−1193-ArmeniaAbovyan, near village of Shor-Bulakh40.133345.63331300+
3 1K−1495IG 48026ArmeniaNaxchivan, Djulfinskii reg., N of Arbakunis vil.39.116745.63331350-
4K−1512AE 1188Armenianear Erevan, valley of Razdan river40.244.5333136-
5 1K−2344-ArmeniaEkhegnadzor reg., along Elpin-Agavnadzor road39.783345.1833776-
6 1K−4224 (3)IG 48738ArmeniaErevan region, 2 km SE of Jrvezh40.166744.6780-
7 1,2k−4228IG 48757ArmeniaShorap, 20 km W of Erevan40.2544.33331350-
8K−4229IG 126249ArmeniaAbovyan reg., Erebuni Natural Reserve40.283344.63331072-
9 1,2K−4225IG 48740ArmeniaOutskirt NE Erevan40.116744.51671400.0-
10 1K−4366IG 48745ArmeniaAbovyan reg., NE of Erevan, N. Dzervesh; Gegadir; Muchavan40.283344.63331045-
11 1K−4551-ArmeniaVanadzor, after Gadzor39.783345.3667363-
12K−564-ArmeniaAzizbekovskii reg., around vil. Khandzorut39.5545.351685+
13NAZ (3)-Armenianear the village of Urznadzor----
14PI 499258-unknownobtained from China----
15PI 574457K−512; AE111Azerbaijanunknown----
16IG 48818-IranDamavand35.733352.06672474-
17 1K−4240IG 49138Iran10 km SW Horand from Ahar38.7547.16671110-
18 1,2K−4413 *IG 49087Iran20 km W Takestan to Zia Abad road to Zanjan36.033349.51320-
19K−4418IG 49107Iran31 km Urumiyeh to Oshnaviyeh Kazem Lo Valley37.2545.13331380-
20K−3899 IIIG 49010IraqNinawa; Jebel Maqloub near Deir Matti36.543.4167850-
21IG 49067 - LebanonRachaiya, 1 km E of Aita Al Foukhar33.633335.91350-
22K−4003IG 48072LebanonTerbol region W slope Anti Lebanon Mts. (zone A)33.936.1--
23K−4004IG 48091LebanonSanin region E slope Lebanon Mts. (zone B)33.933335.8333--
24K−4007IG 48107LebanonIrsal region; W slope Anti Lebanon Mts. (zone C)34.2536.66670-
25 1K−4406IG 49047LebanonBaalbek 4 km W Baalbek road to Bcharre laat vil.34.033336.16671050-
26 1K−4241ai−611188LebanonSanin region E slope Lebanon Mts. (zone B)33.933335.8333--
27 1K−4241bi−611189LebanonAl Alia; 40 km N of Karak31.9535.9333800-
28K−4407IG 49047LebanonBaalbek 4 km W Baalbek road to Bcharre Iaat vil.34.033336.16671050-
29 2K−4409IG 49053Lebanon3 km from Deir Ahmar road to Ain Ata34.133336.11370-
30 1K−2680PI 487198Syria7 km from Atareb to Qalaat Samaan, Aleppo36.202236.7758460-
31K−4009i−571713SyriaAl Hasakah; just N of Jabal Abd El-Aziz36.466740.3333600+
32 1K−4362IG 48729SyriaDamascus May Saloun; 4 km before Tukeya33.636.06671468-
33 1K−4372IG 48800Syria2 km NE of Sa’an road from Shabki32.736.84171400-
34PI 487196-SyriaAleppo Province36.166736.8333450-
35CIae 34-Turkey-----
36K−4002IG 47875Turkey14 km NW Keskin39.716733.4333520-
37#12006−6−25−8−2Turkey132 km NW from Nevşehir39.162233.93251060-
38#102006−6−21−5−1Turkey50 km NE from Kilis to Gaziantep37.31537.7347510-
39#22006−6−17−7−2Turkey29 km NE from Kilis to Gaziantep36.924237.0786730-
40#32006−6−21−12−1Turkey57 km NE from Kilis to Gaziantep37.267837.5208700-
41#42006−7−12−2Turkey34 km NE from Kilis to Gaziantep37.0966737.0406970-
42#62006−6−21−9−1Turkey54 km NE from Kilis to Gaziantep37.373937.8458700-
43#72006−6−17−10−2Turkey32 km NE from Kilis to Gaziantep36.994437.9664950-
44#82006−6−25−6−3Turkey114 km NW from Nevşehir39.044234.0414880-
45#92006−6−21−1−2Turkey46 km NE from Kilis to Gaziantep37.213937.4903831-
46 1i−570045PI 554184TurkeyKars, 5 km S Sivas Malatya border39.733337.051500+
47PI 276968-TurkeyKonya37.833332.5--
48PI 486281IG 46886Turkey42 km southeast of Ercis-Karayollari Bakimevi38.916743.61700+
491PI 542171-Turkey19 km north of Gaziantep toward Yavuzeli37.183337.4667800+
50 1,2PI 542191 II-TurkeyAegean Agric. Research Inst. Gene Bank, Menemen--30+
51PI 554178IG 47040Turkey22 km north of Van38.743.33331734+
52PI 554180IG 46997Turkey35 km west of Tuzluca40.1543.36671010-
53PI 554181IG 47042TurkeyAydin, 10 km north of Kusadasi37.916727.2833130+
54PI 554182 IIIG 47048TurkeyIcel, 24 km southwest of Erdemli, Mersin across from Boy Scout Recreation Center36.466734.133330-
55PI 554185IG 47117Turkey2 km southeast of Van on route to Gurpinar38.543.36671790-
56 1,2PI 554186IG 47166TurkeyVan, 6 km southeast of Van38.466743.38331990-
57 1PI 554187 (2)IG 47125TurkeyVan, 2 km north of Van38.533343.33331710-
58PI 554188-TurkeyVan, 29 km north of Van38.7543.36671790-
59PI 554190IG 47170TurkeyVan, 29 km north of Van38.7543.3667--
60PI 560506-TurkeyRoadside along Lake Van. About 3 km W of Ermisler38.866743.46671630-
61PI 560507-TurkeyVan, About 2 km N of village of Yalnizagac38.743.51837-
62 2PI 564179 II-Turkey23 km southeast of Manavgat, near Okucalar village36.683331.633350+
631,2PI 564180 II-Turkey58 km southwest of Silifke; 4 km west of Ovacik, Mersin36.1833333.6333250+
64 1,2PI 564181 II-Turkey49 km southwest of Silifke, Mersin36.233.7150+
65 1,2TA 2084 II-Turkey1 km N of Iskenderum (Alexandretta)36.600136.196950+
66TA 2106KU11−2TurkeyKonya, collected by Dr. Johnson in 1965.37.866732.48331030-
67AE 1521-unknown-----
68AE 1607 (2)-unknownobtained from UK---+
69TX 01-unknown,provided by Dr. M. Feldman----
Aegilops neglecta
70PI 564182 *-Turkey9 km southeast of Ayvacik39.58333326.483333420+
71 1K−4553 *IG 126975ArmeniaKapan distr. road from Kapan to Charaten39.190346.43970-
72 2PI 170209-Turkey17 km south of Canakkale40.03333326.35100+
73 2AE 646-Algeriaunknown---+
Aegilops umbellulata
74 2AE 155K−1234Azerbaijanunknown---+
75 2AE 820-Turkey3 km E Kemalpasa----
76 2AE 1339-GreeceKreta---+
Column 1 (No): 1—accessions used for electrophoretic analysis; 2—accessions used for molecular analysis. Column 2 (Accession #): *—accessions that were erroneously classified as Ae. columnaris; II—accessions belonging to group II.
Table 2. Variants of chromosomal rearrangements identified in Ae. columnaris, type I accessions.
No.Trans. CodeTranslocation TypeStructure of Translocated ChromosomesAccessionsOrigin
1inv1perInv2Xc-PI 542171; AE 1607bTurkey
2inv2perInv 6Xc-K−4406Lebanon
3inv3perInv 7Uc-i−570045; CIae 34; K−4002; TA2106; AE 1521; H−8; TX01Turkey
4T1perInv7Uc + T4Uc:4Xc4UcS:4XcS + 4UcL:4XcLH−2Turkey
5T2perInv2Xc−2 + T6Uc:7XcperInv2Xc−2 + 6UcS.6UcL−7XcS +T6UcL−7XcS.7XcLAE 1607aunknown
6T3T3Uc:4Xc3UcS:4XcL + 3UcL:4XcSK−4224c; K−564Armenia
7T4T3Xc:7Xc3XcL.3XcS−7XcS + 3XcS−7XcS.7XcLPI 276968
PI 574457 (K−512)
Turkey
Azerbaijan
8T5T5Uc:6Xc5UcS:6XcL + 5UcS:6XcLK−4418Iran
9T6T2Uc:2Xc2UcS.2UcL−2XcL + 2UcL−2XcL.2XcSPI 554185Turkey
10T7T2Uc:4Xc2UcS:4XcL + 2UcS:4XcLPI 554187tTurkey
11T8T3Uc:1Xc3UcS.3UcL−1Xc + 3UcL−1XcS.1XcLK−560506Turkey
12T9T4Uc:5Uc4UcL.4UcS−5UcL + 4UcS−5UcL.5UcSK−4002Turkey
13T10T7Uc:2Xc7UcS. 7UcL−2Xc + 7UcL−2XcL.2XcSK−4003; K−4407Lebanon
14T11T1Uc:5Uc1UcS:5UcS + 1UcL:5UcLPI 499258; K−1178; K−1495; K−4224; K−4366Armenia
15T12T1Uc:5Uc + T4Uc:6Uc1UcS:5UcS + 1UcL:5UcL + 4UcL.4UcS−6UcS + 4UcS−6UcS.6UcLK−1193Armenia
16T13T1Uc:5Uc + T3Uc:1Xc1UcS:5UcS + 1UcL:5UcL + 3UcS.3UcL−1Xc + 3UcL−1XcS.1XcLPI 554180Turkey
17T14T2Xc:4Xc2XcS:4XcS + 2XcL:4XcLPI 560507Turkey
18T15T2Xc:4Xc:6Xc2XcS:4XcS + 2XcL:6XcS + 6XcL:4XcLK−4240Iran
19T16T1Uc:5Uc + T3Uc:5Xc1UcS:5UcS + 1UcL:5UcL + 3UcS:5XcL + 3UcL:5XcSK−4224B; K−4228Armenia
20T17T1Uc:5Uc + T7Uc:3Xc + T3Uc:4Uc1UcS:5UcS + 1UcL:5UcL + 7UcS:3XcS + 7UcL:3XcL + 3UcS:4UcS + 3UcL:4UcLK−4225; K−4551Armenia
21T18T2Uc:4Xc + T4Uc:6Xc2UcS:4XcS + 2UcL:4XcL + 4UcS:6XcS + 4UcL:6XcLK−4372Syria
22T19T6Uc:4Xc + T7Uc:3Xc6UcS:4XcS + 6UcL:4XcL + 7UcS:3XcL + 7UcL:3XcSPI 486281; PI 554181Turkey
23T20T2Uc:5Xc + T4Uc:2Xc2UcL.2UcS−5Xc + 2UcS−5XcL.5XcS + 4UcS:2XcL + 4UcL:2XcSK−4362Syria
Publisher’s Note: MDPI stays neutral with regard to jurisdictional claims in published maps and institutional affiliations.

