
Effects of Light Spectral Quality on the Micropropagated Raspberry Plants during Ex Vitro Adaptation


 ,
, 

Abstract
:1. Introduction
2. Results
2.1. Raspberry Plant Responses to Various Red–Far-Red Light Ratios
2.1.1. Growth Responses
2.1.2. CO2–H2O Exchange
2.1.3. Photosynthetic Pigments
2.1.4. Chlorophyll a Fluorescence
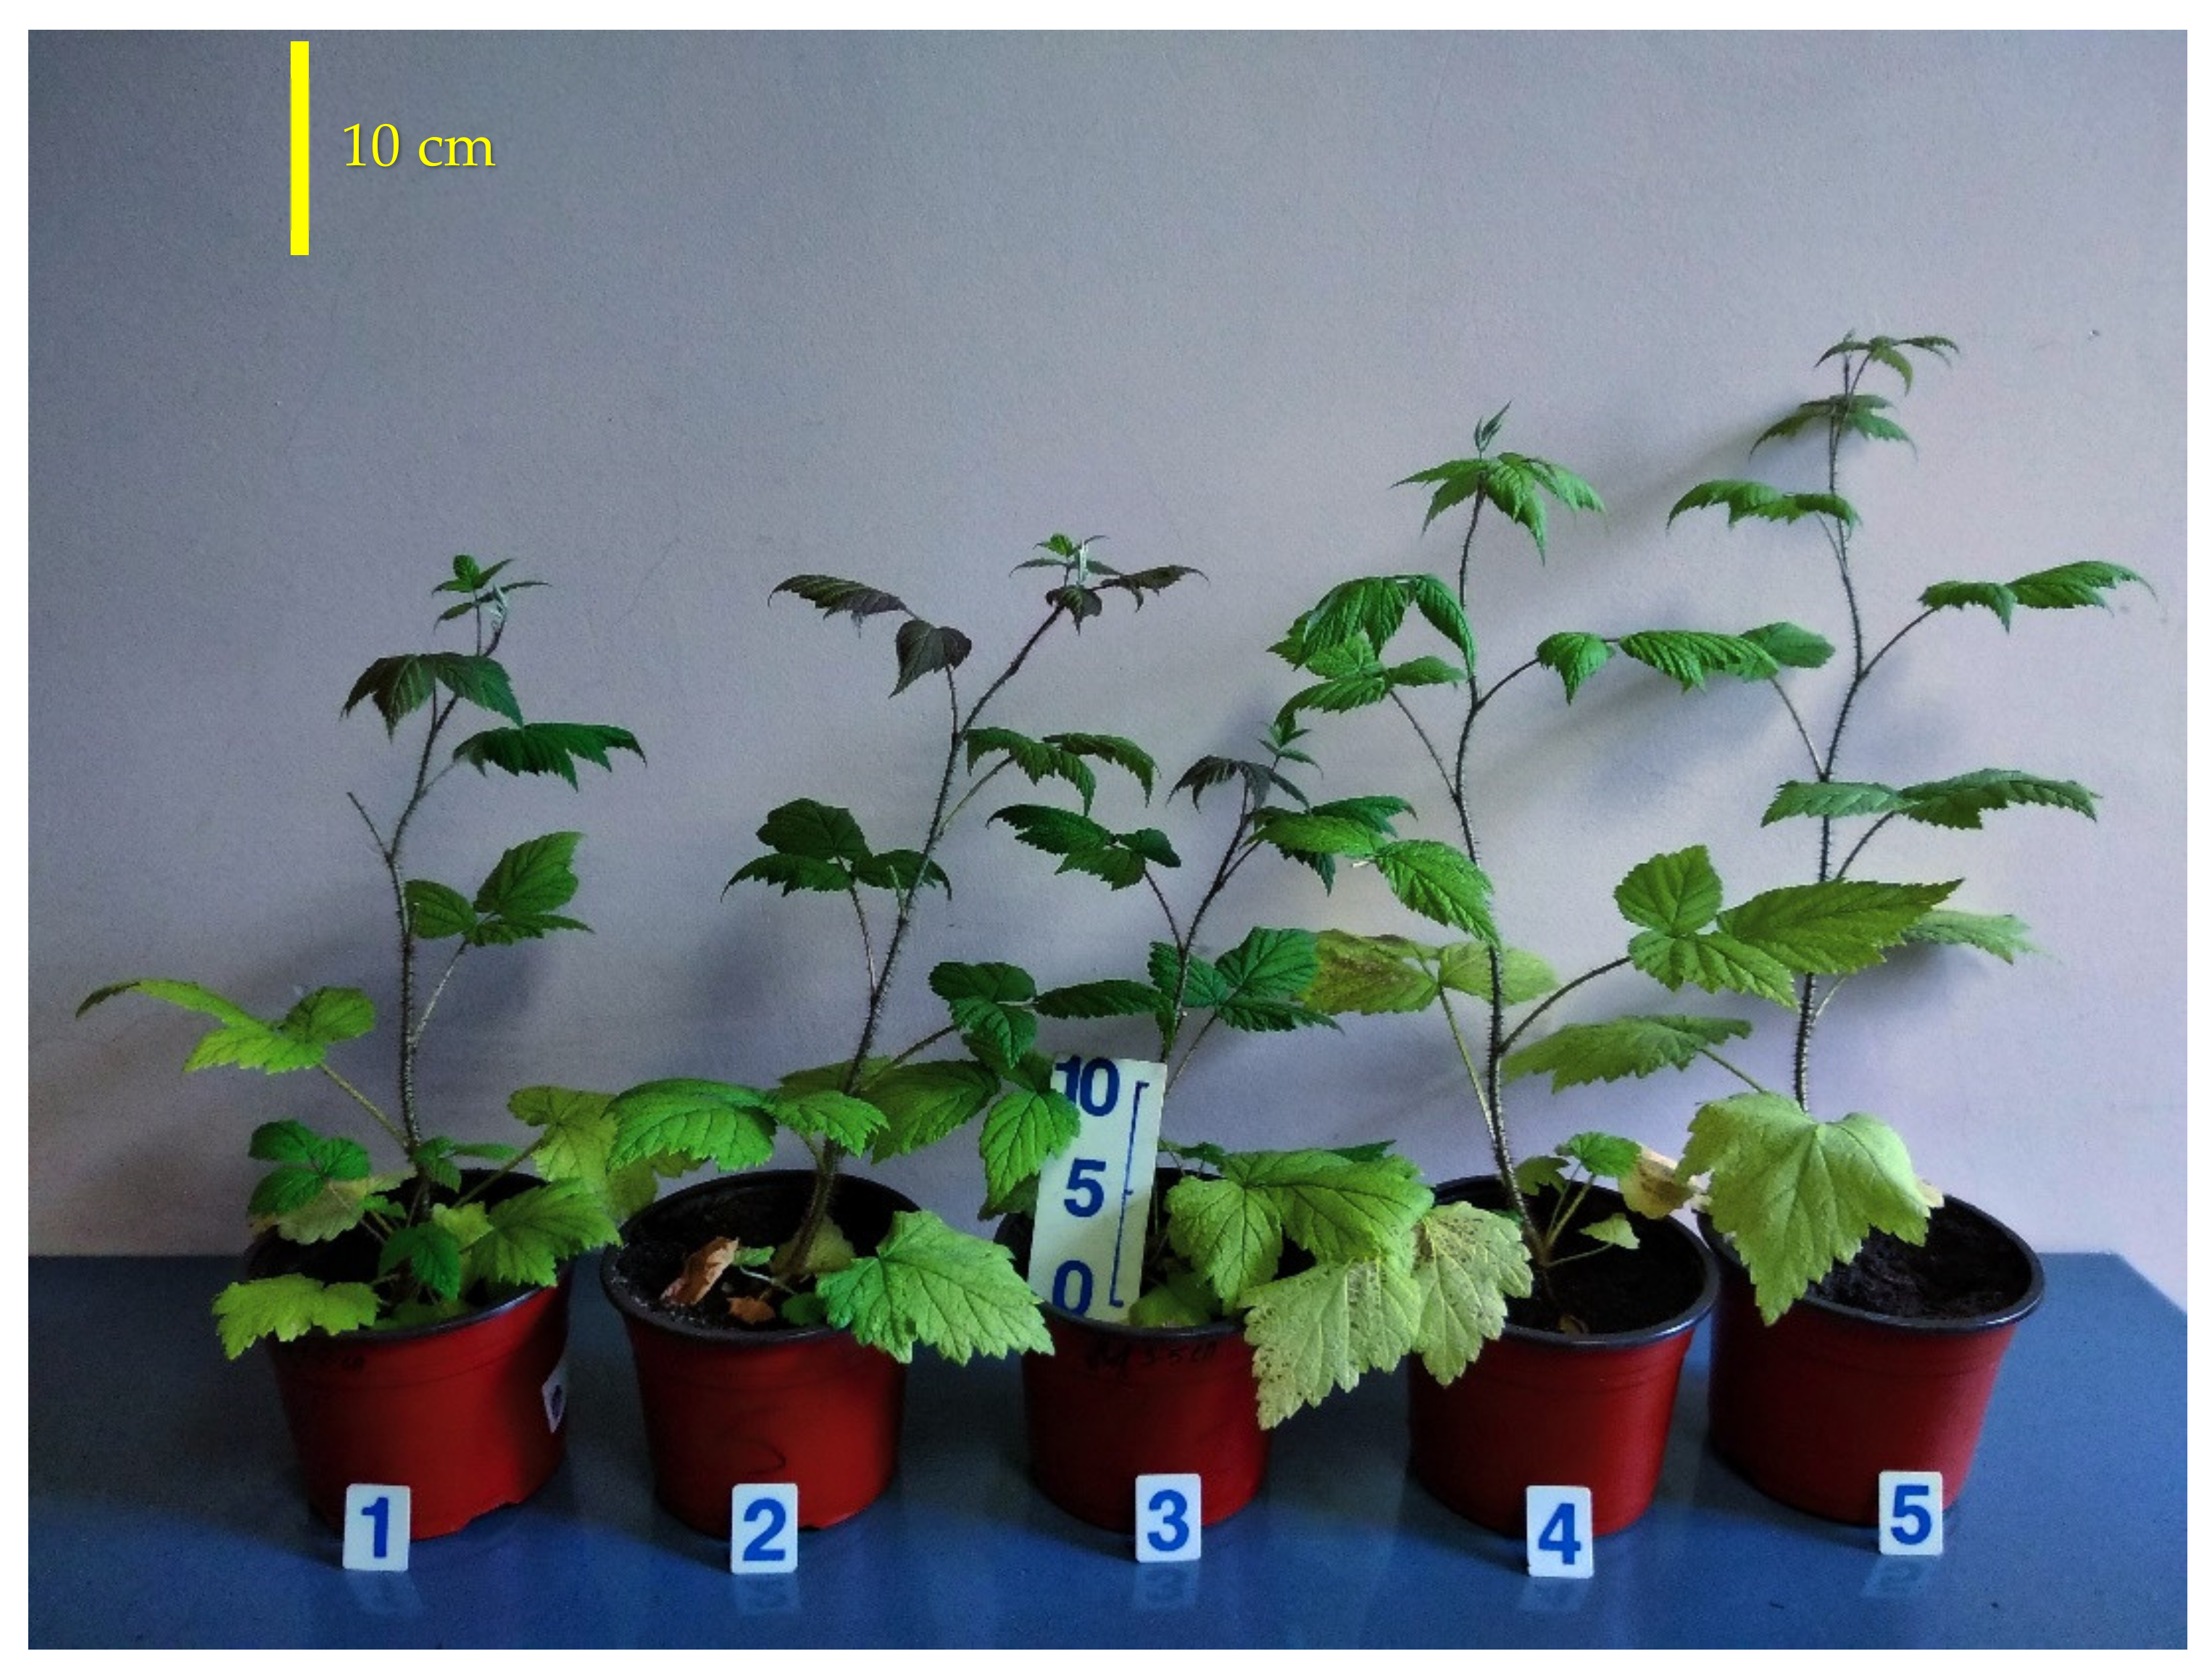
2.2. Raspberry Plant Responses to Variation in Red, Green, and Blue Light Distribution in the Spectrum of Optical Radiation
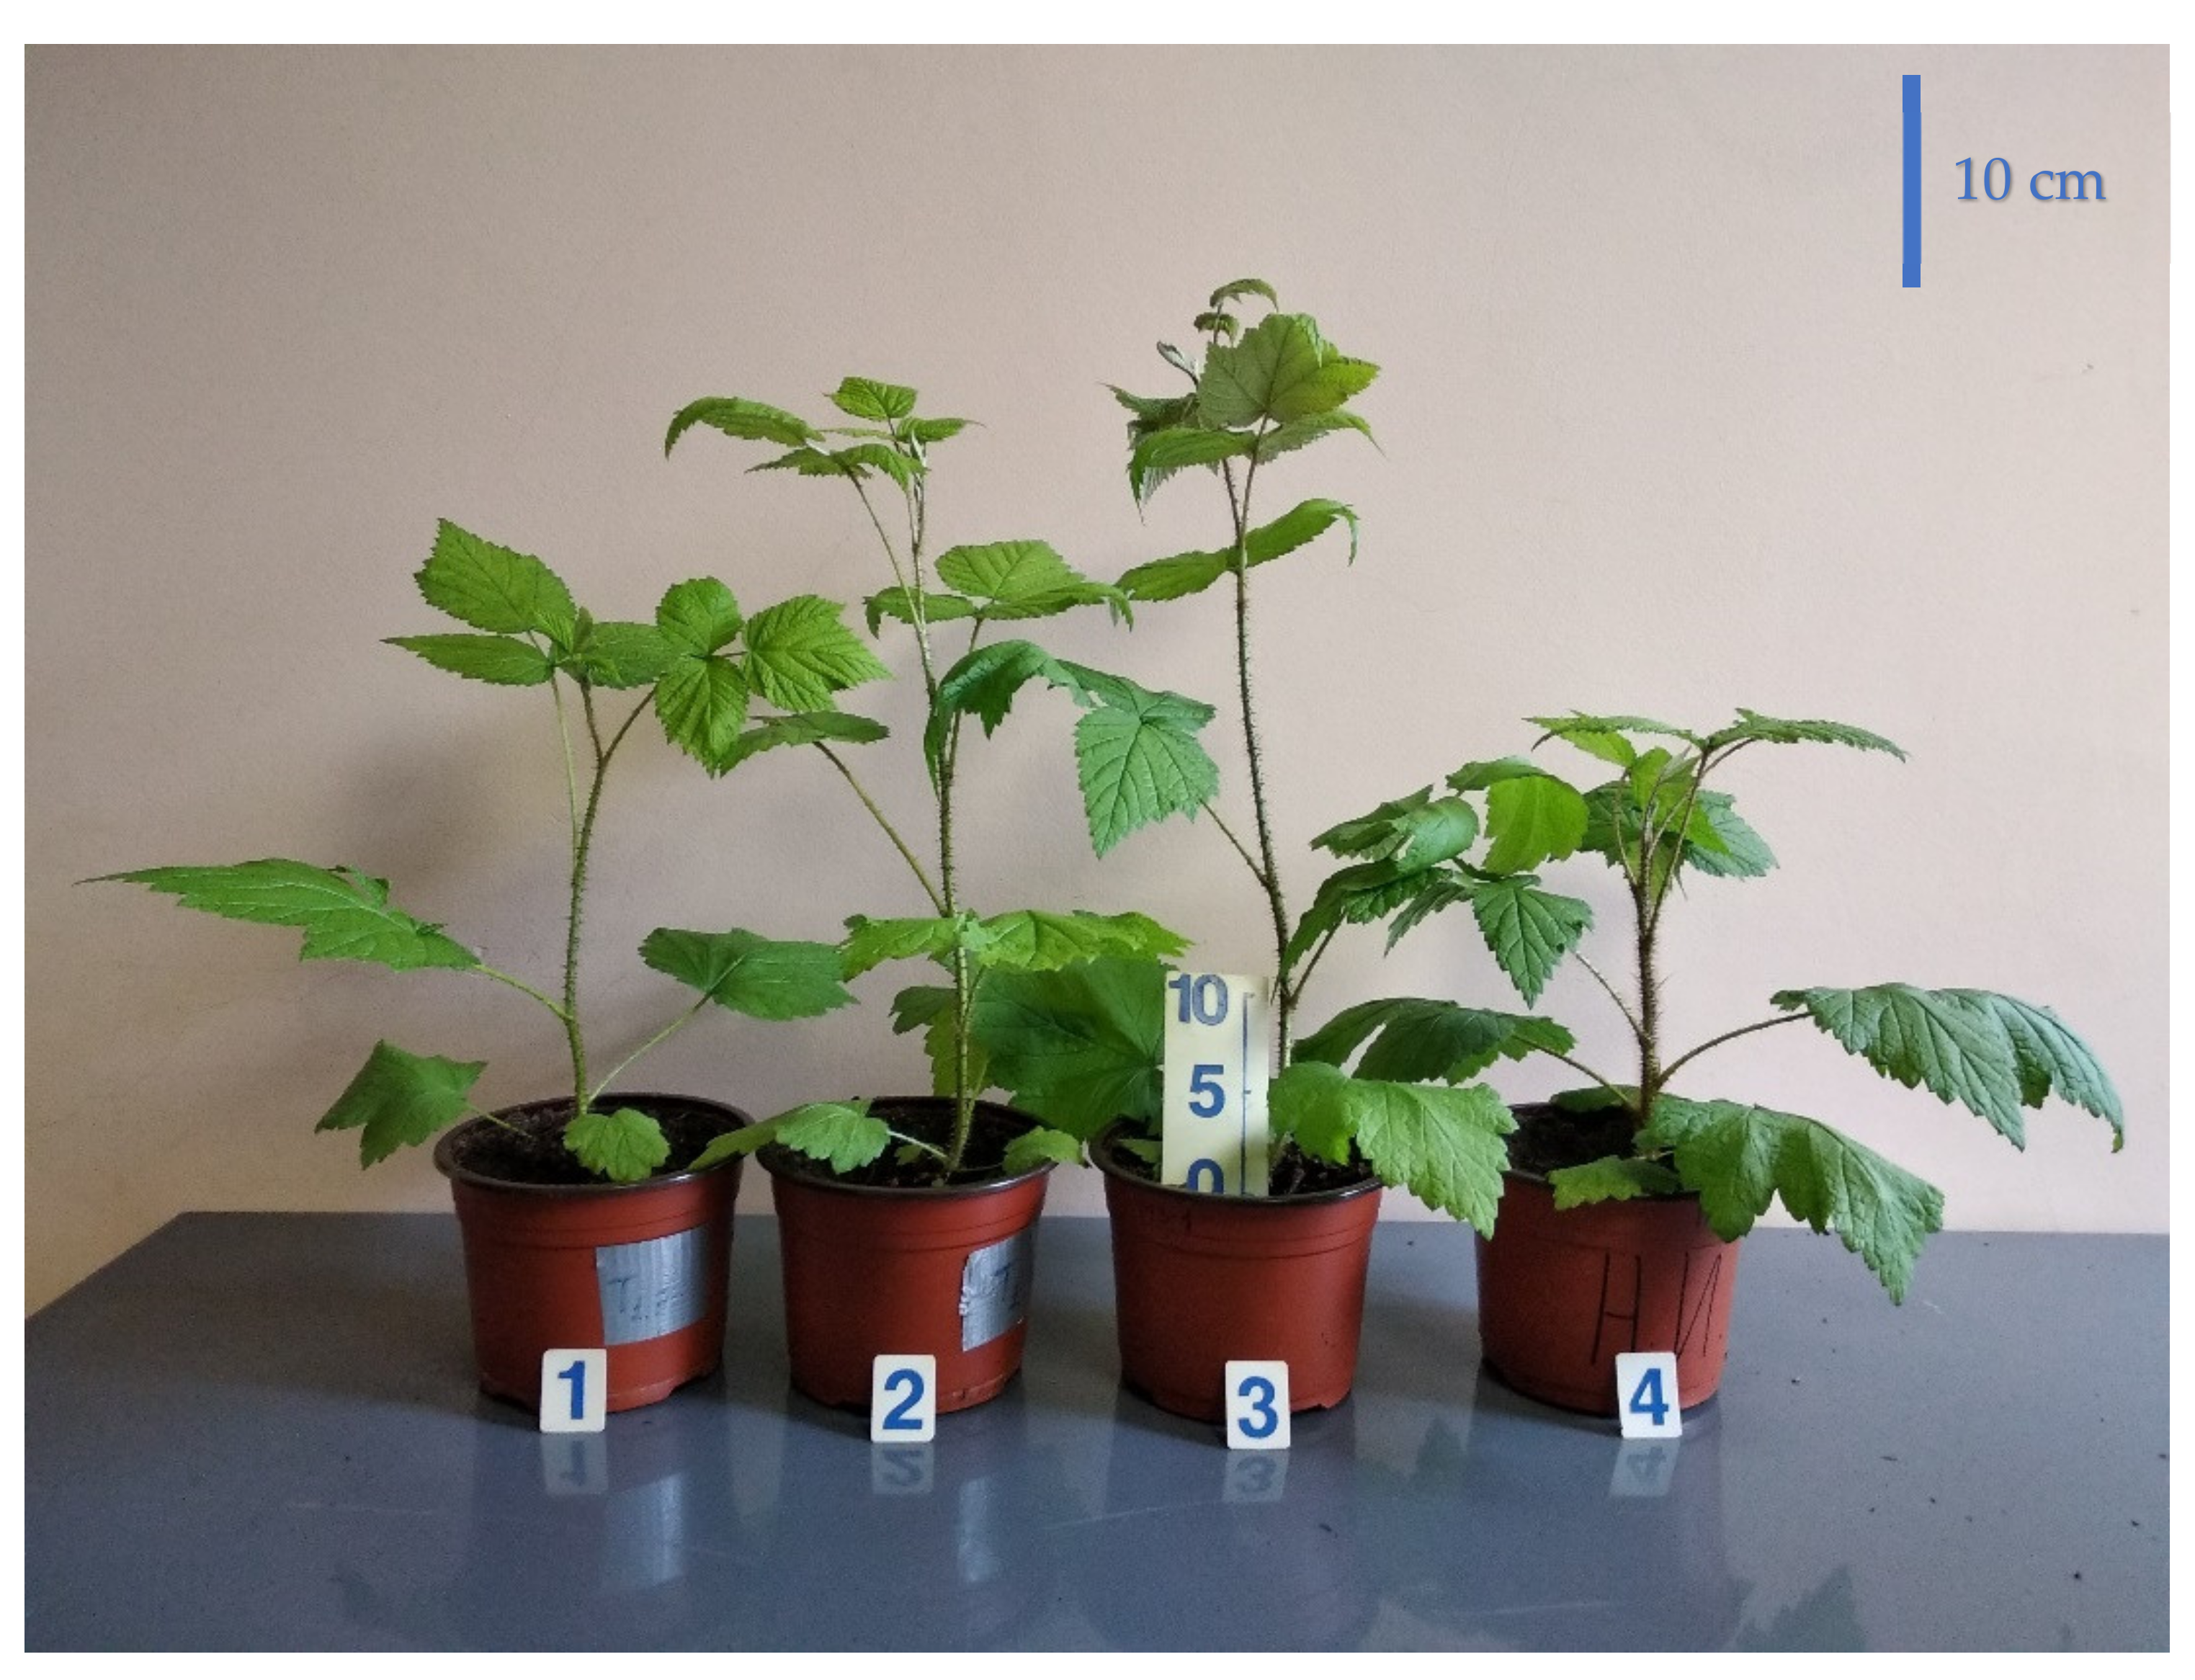
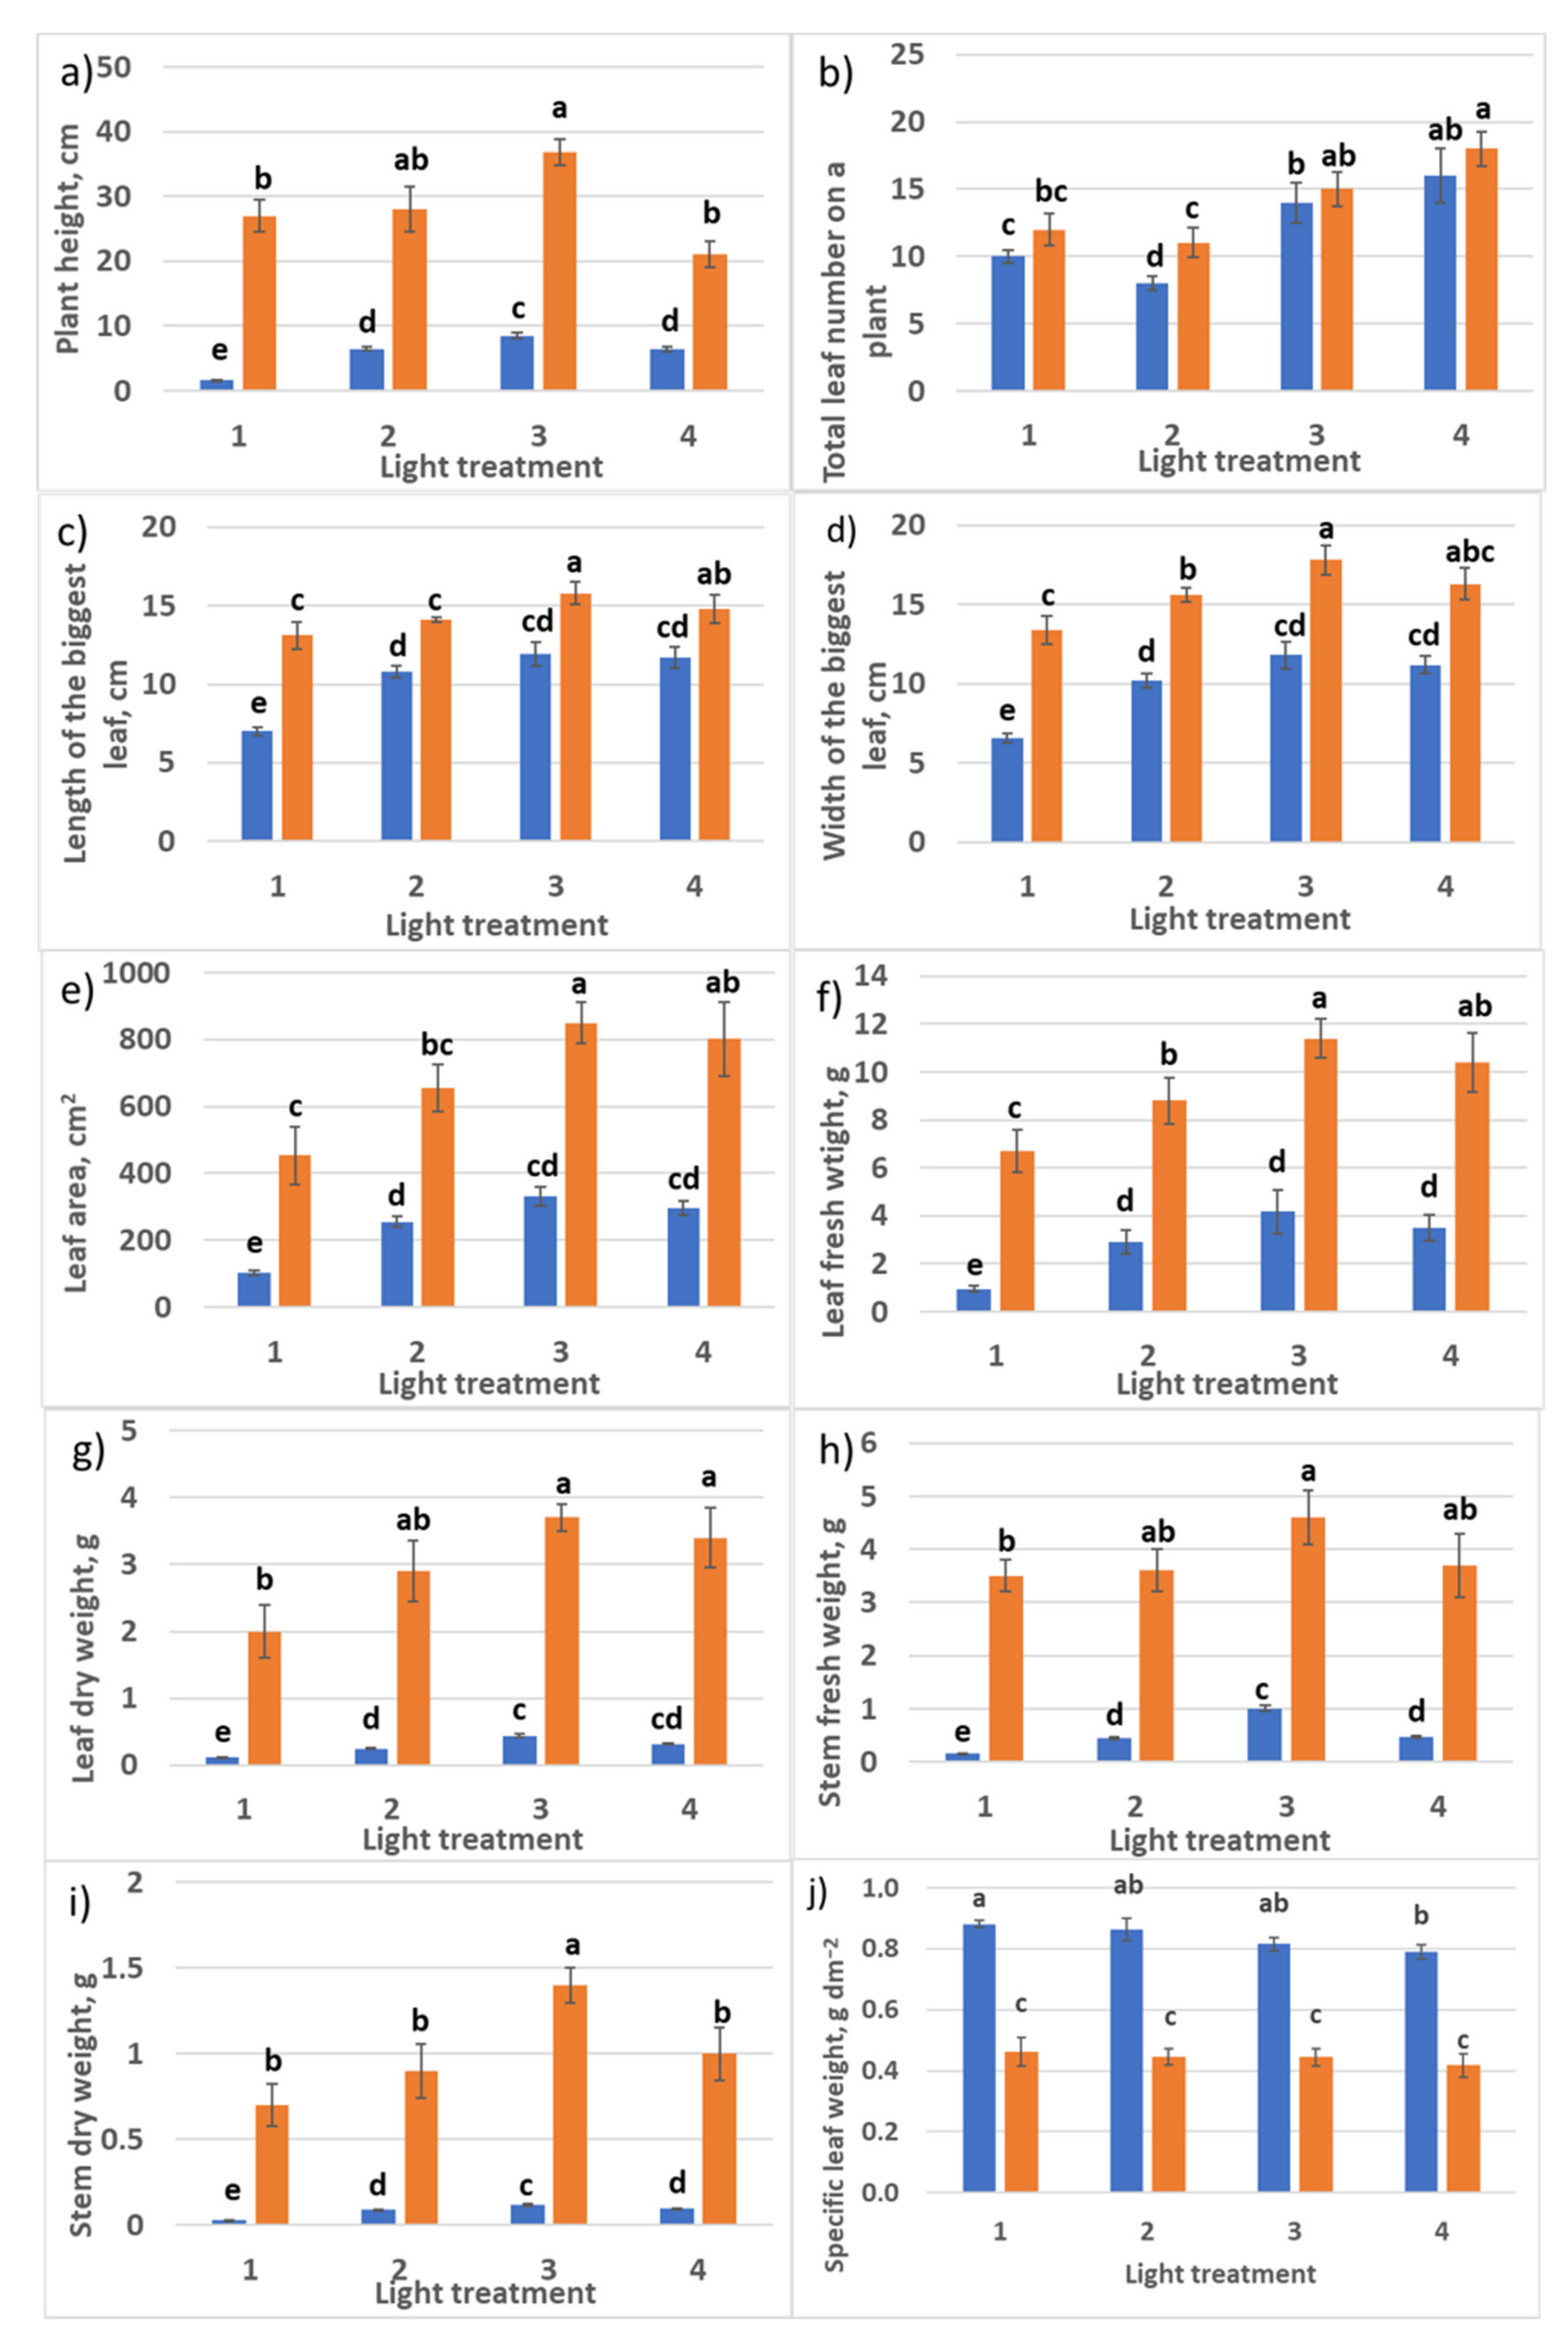
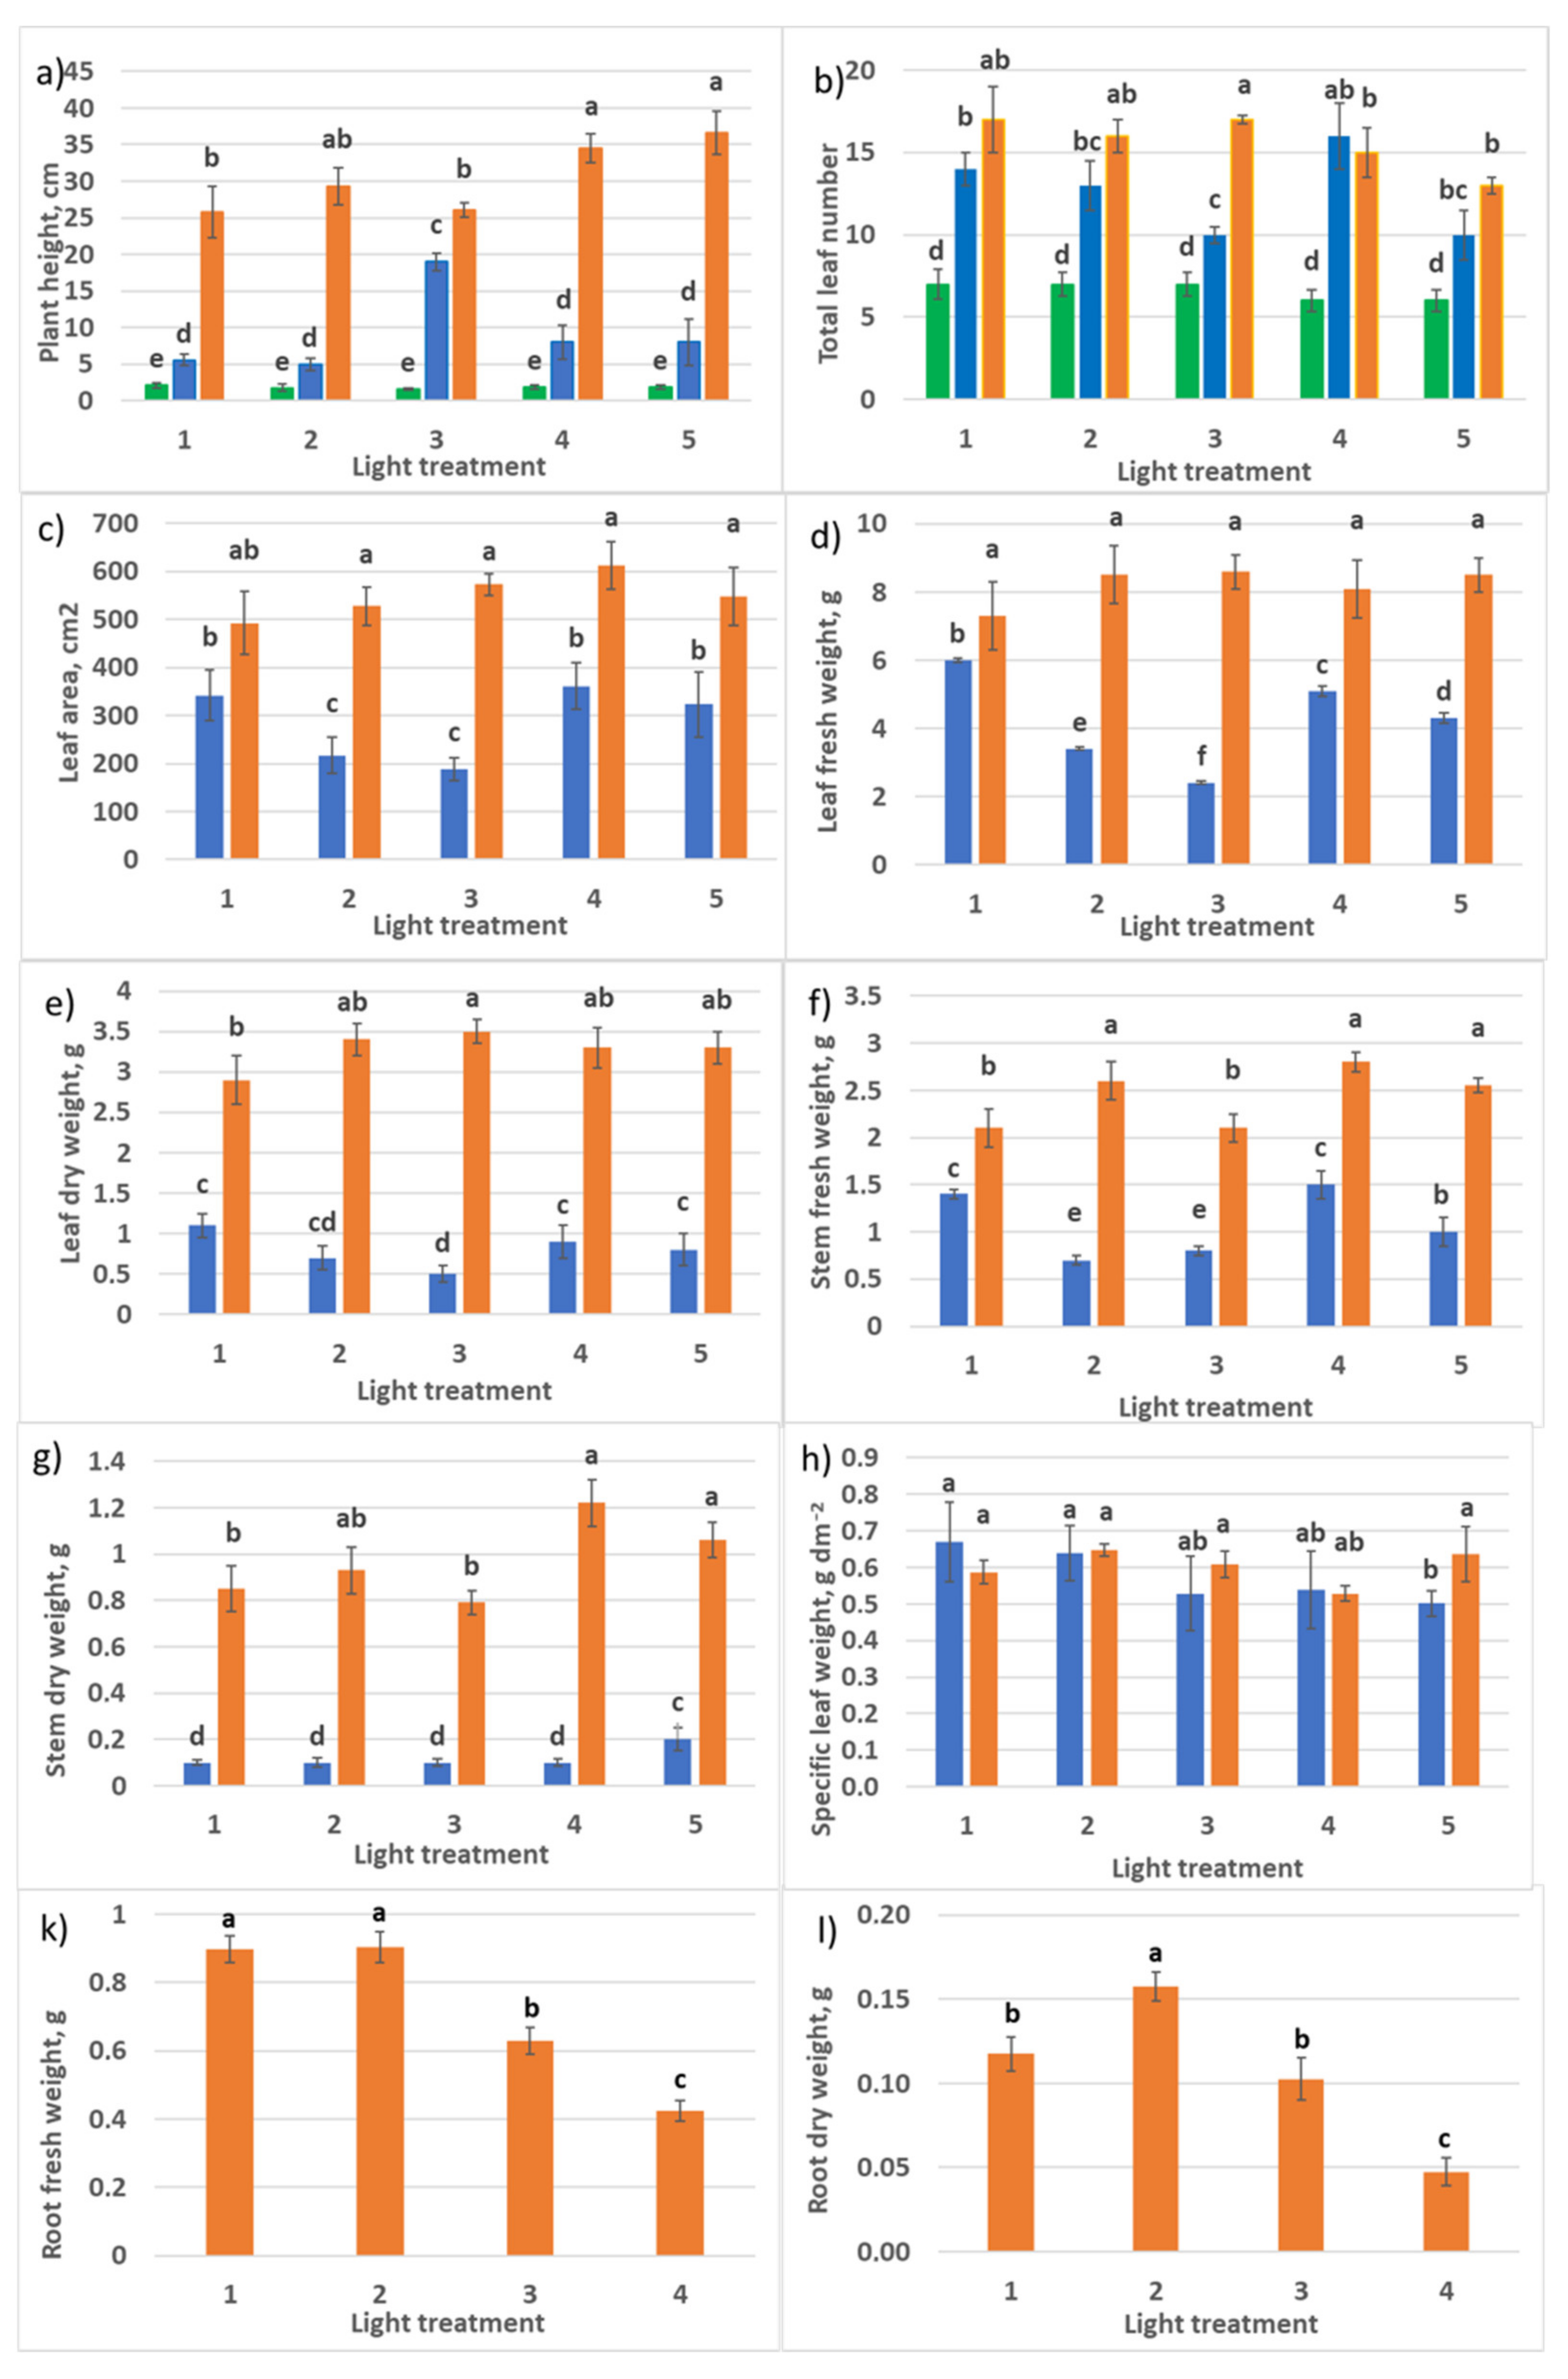
2.2.1. Growth Responses
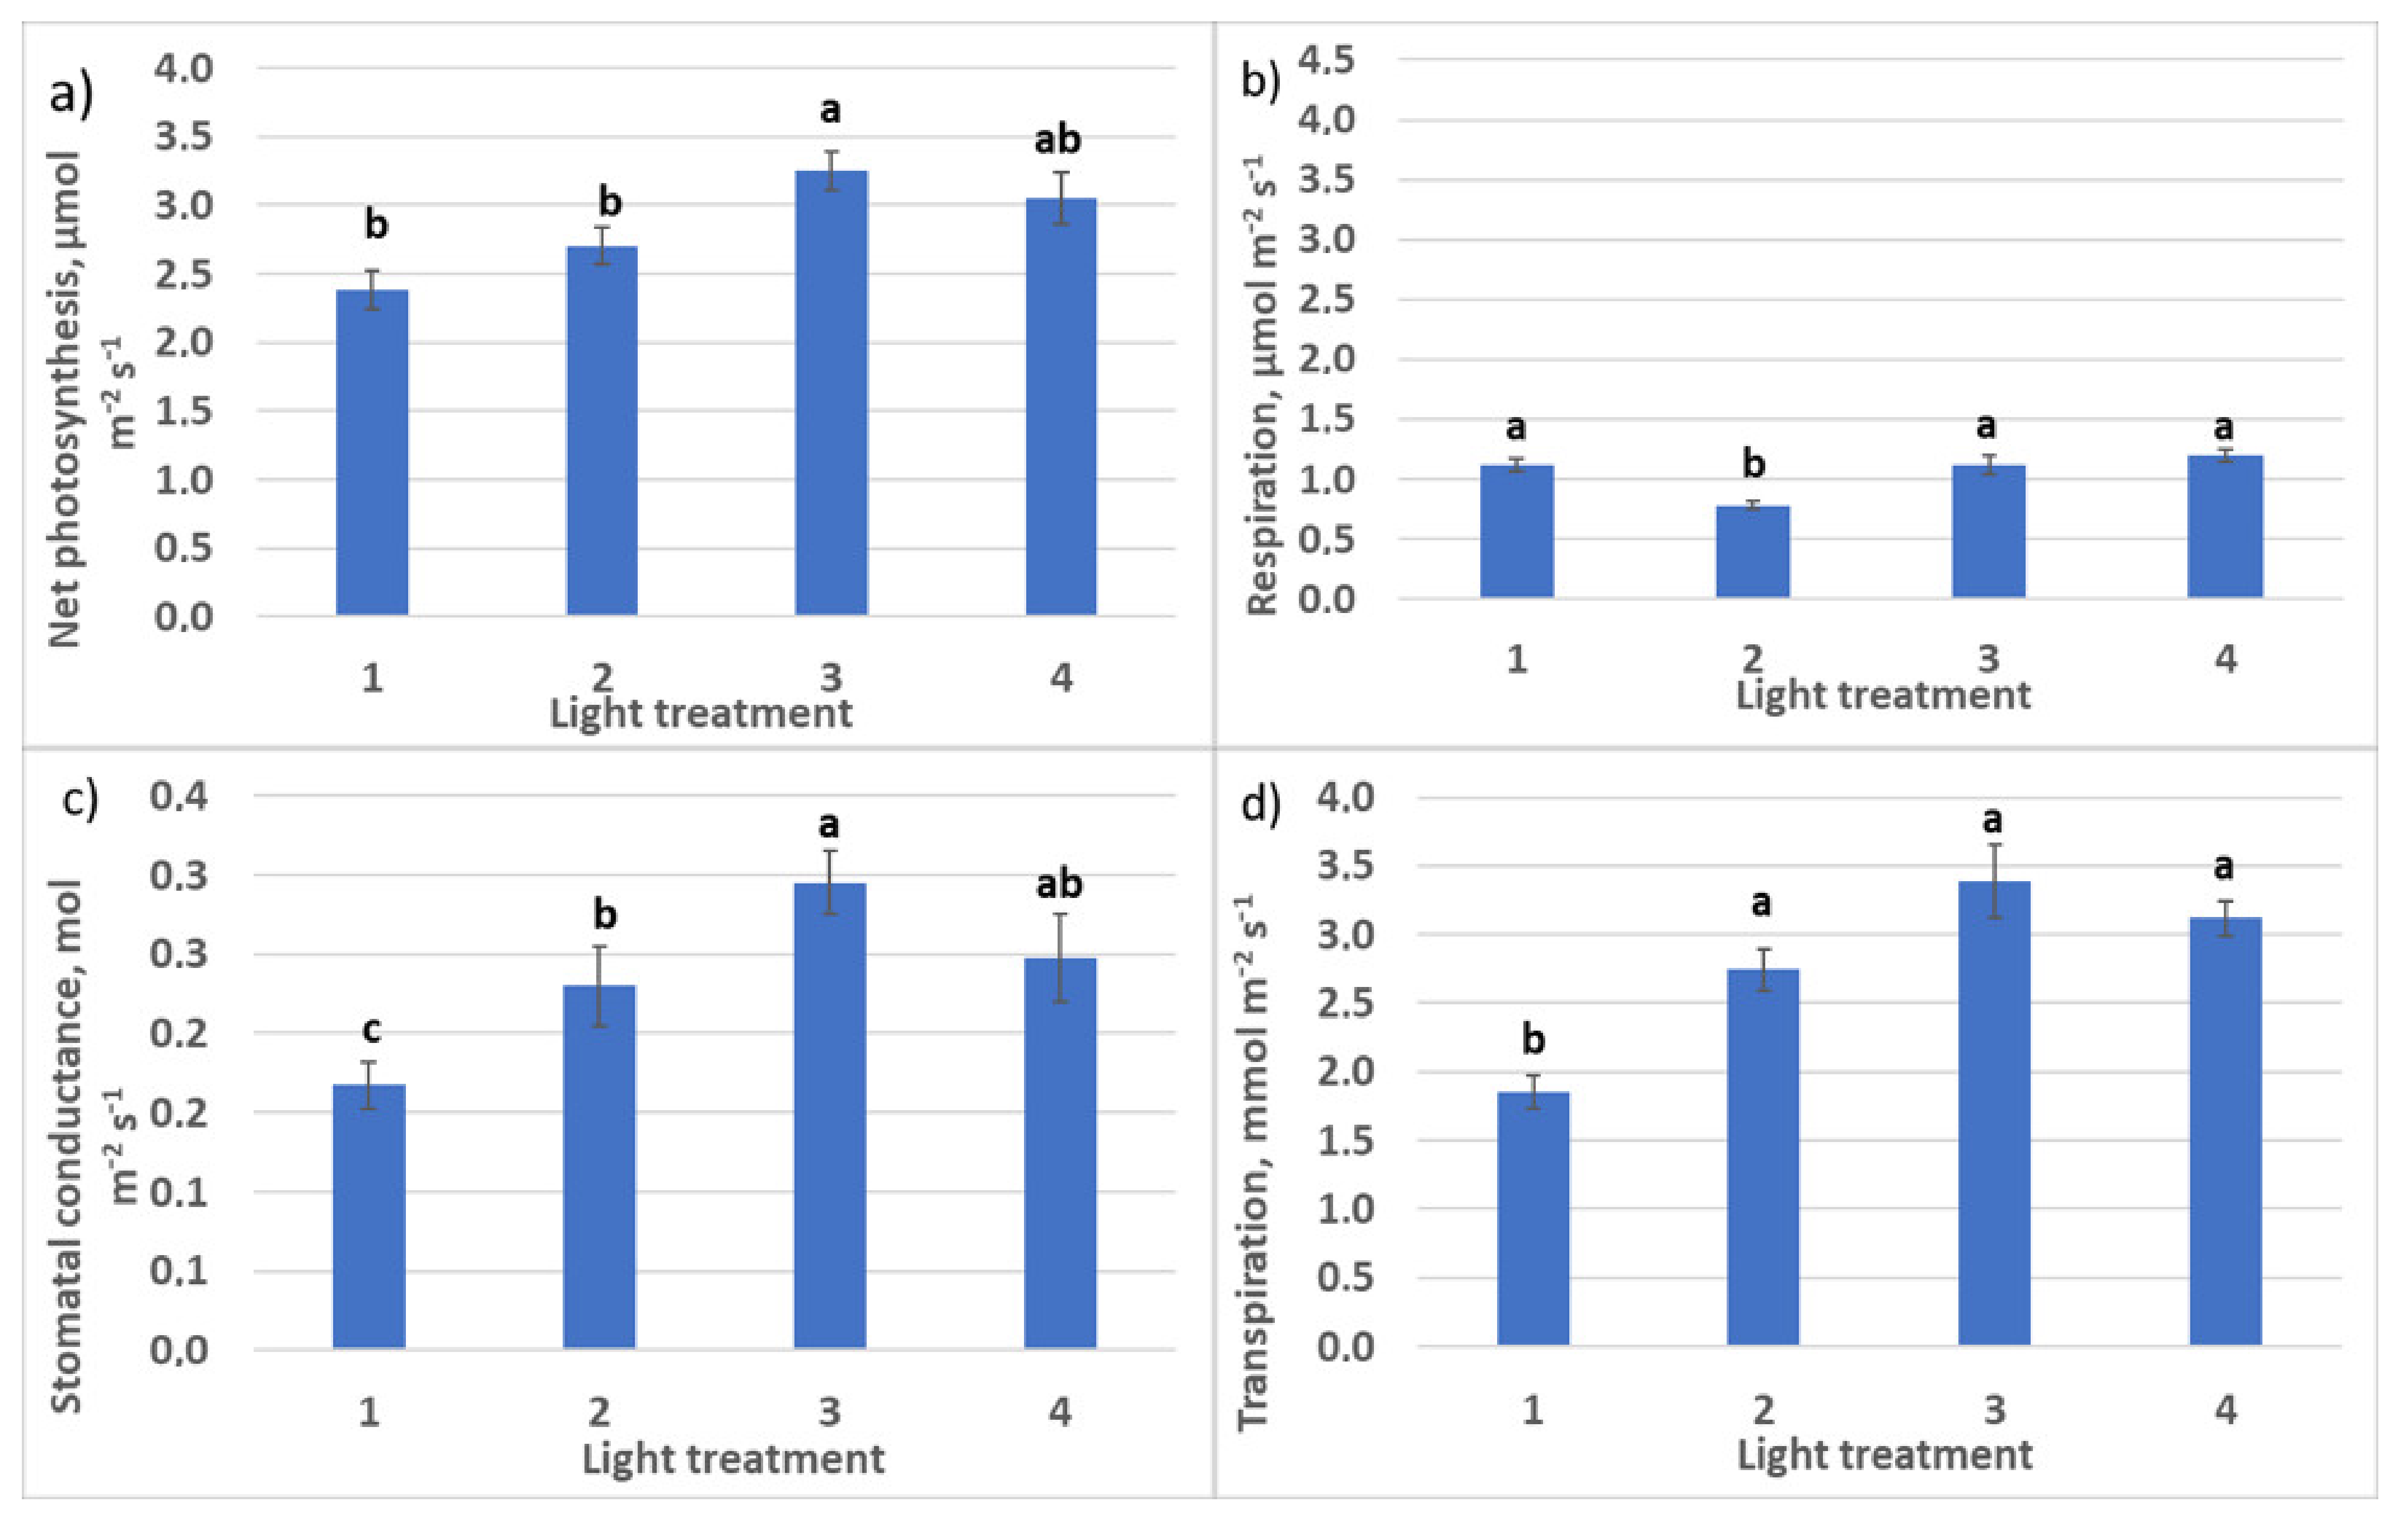
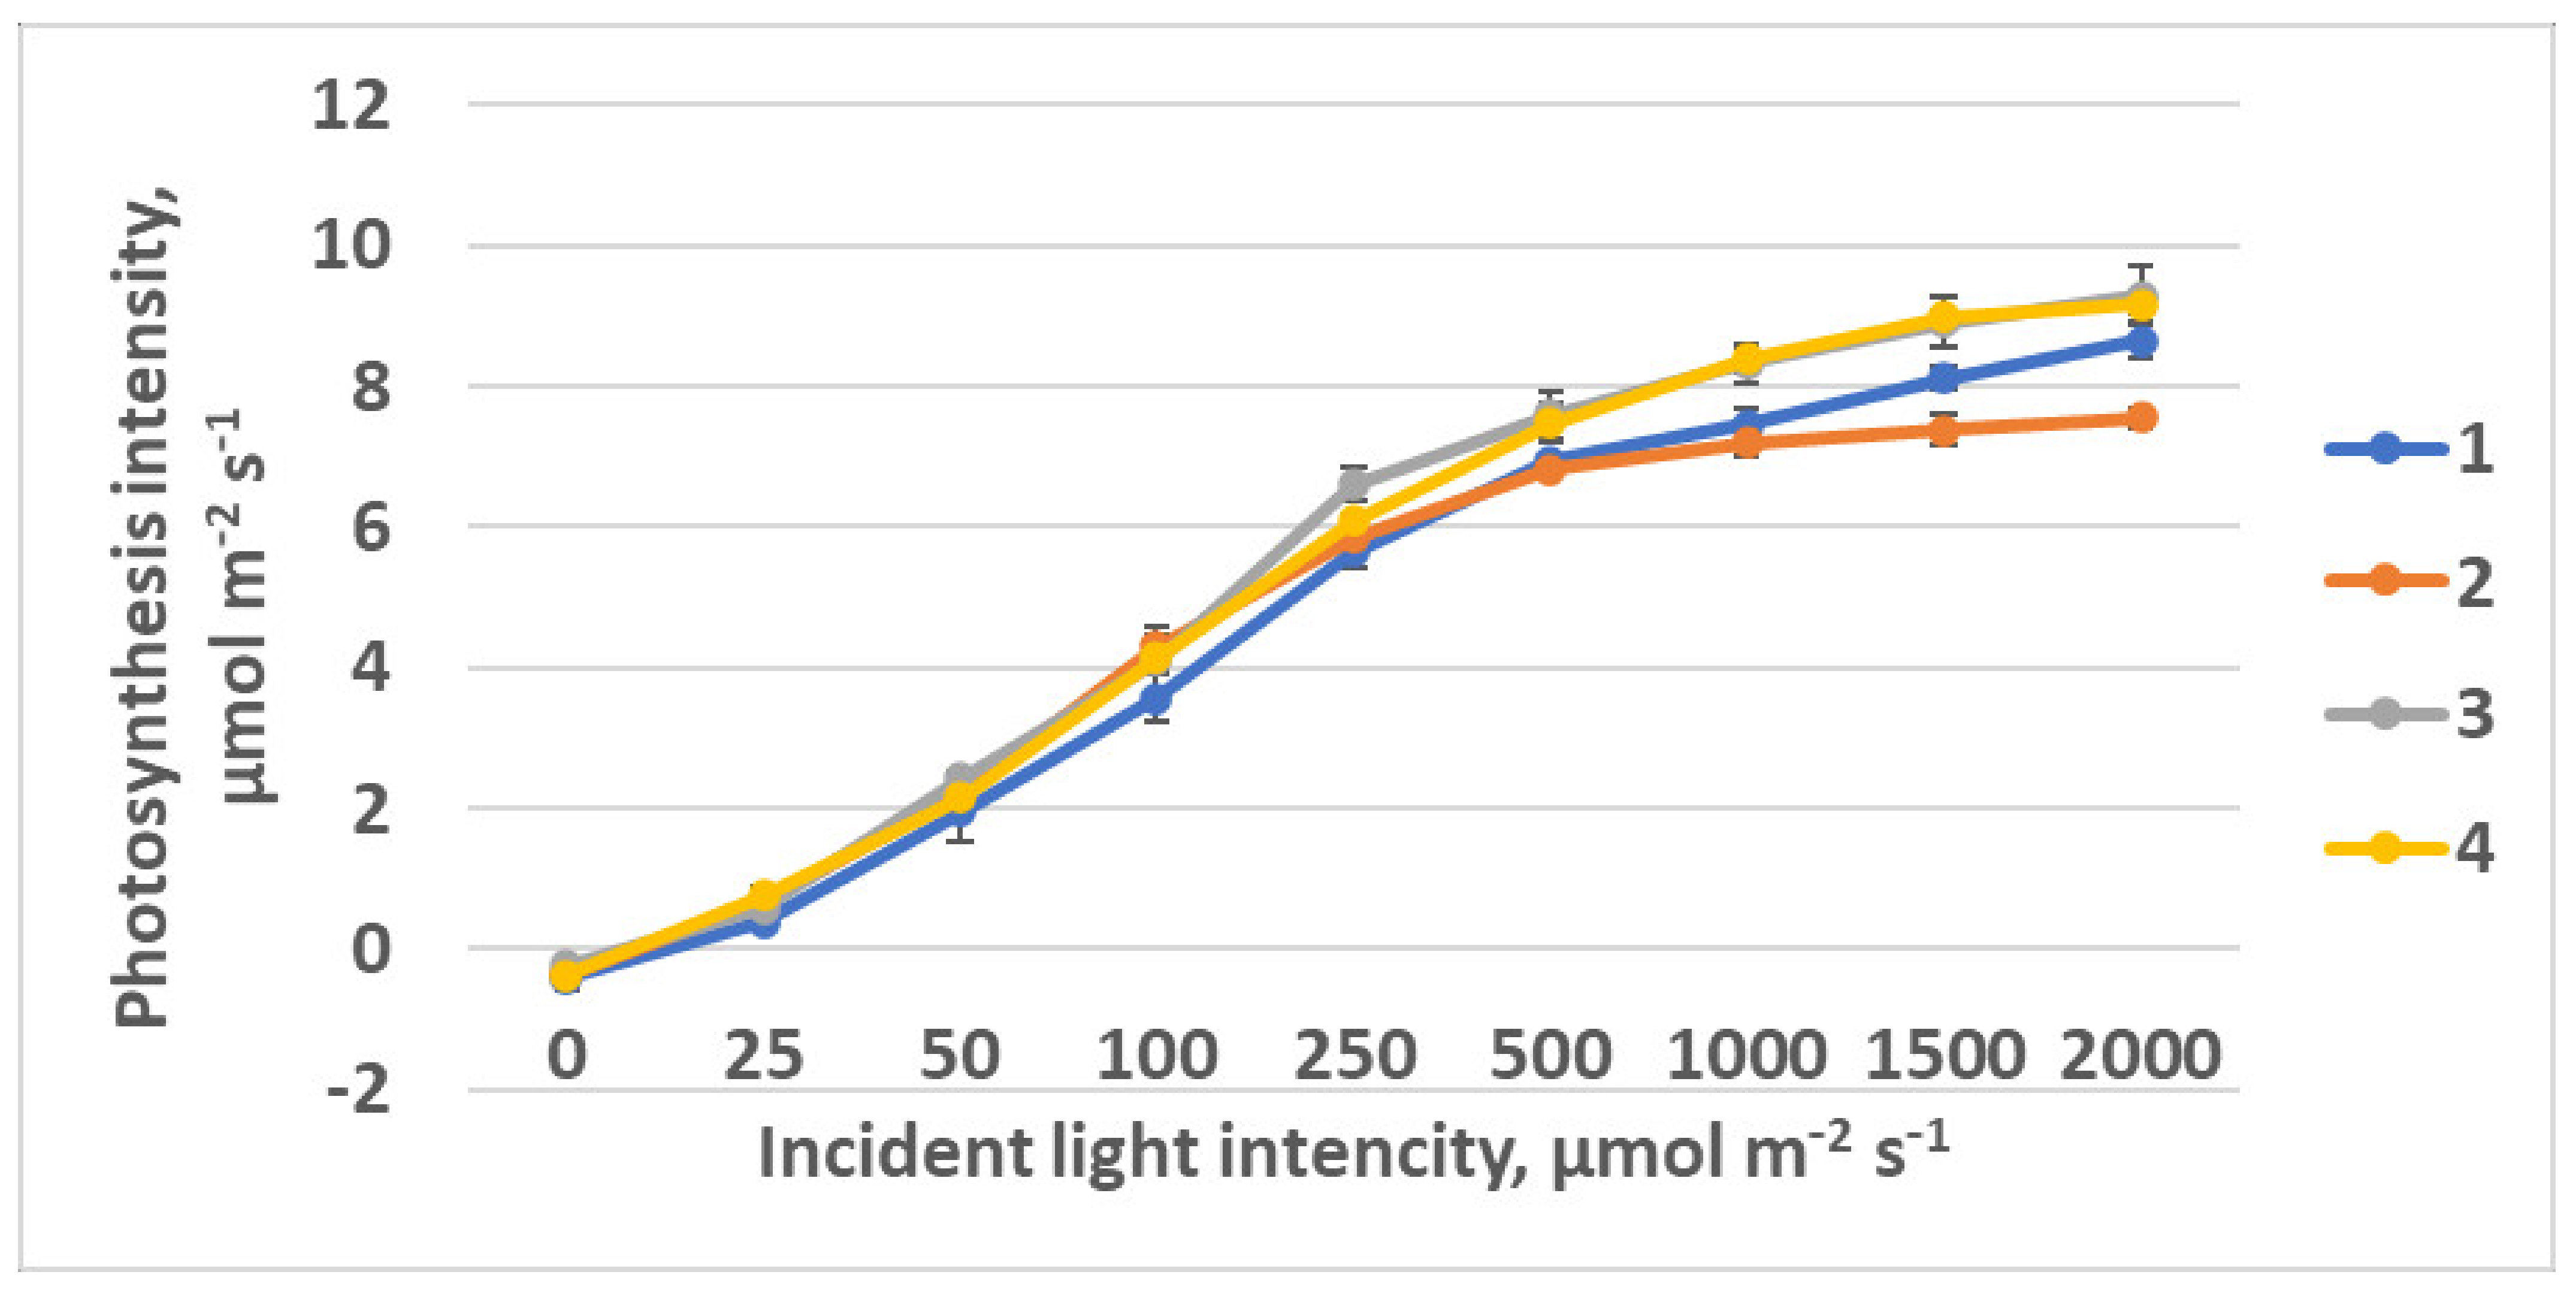
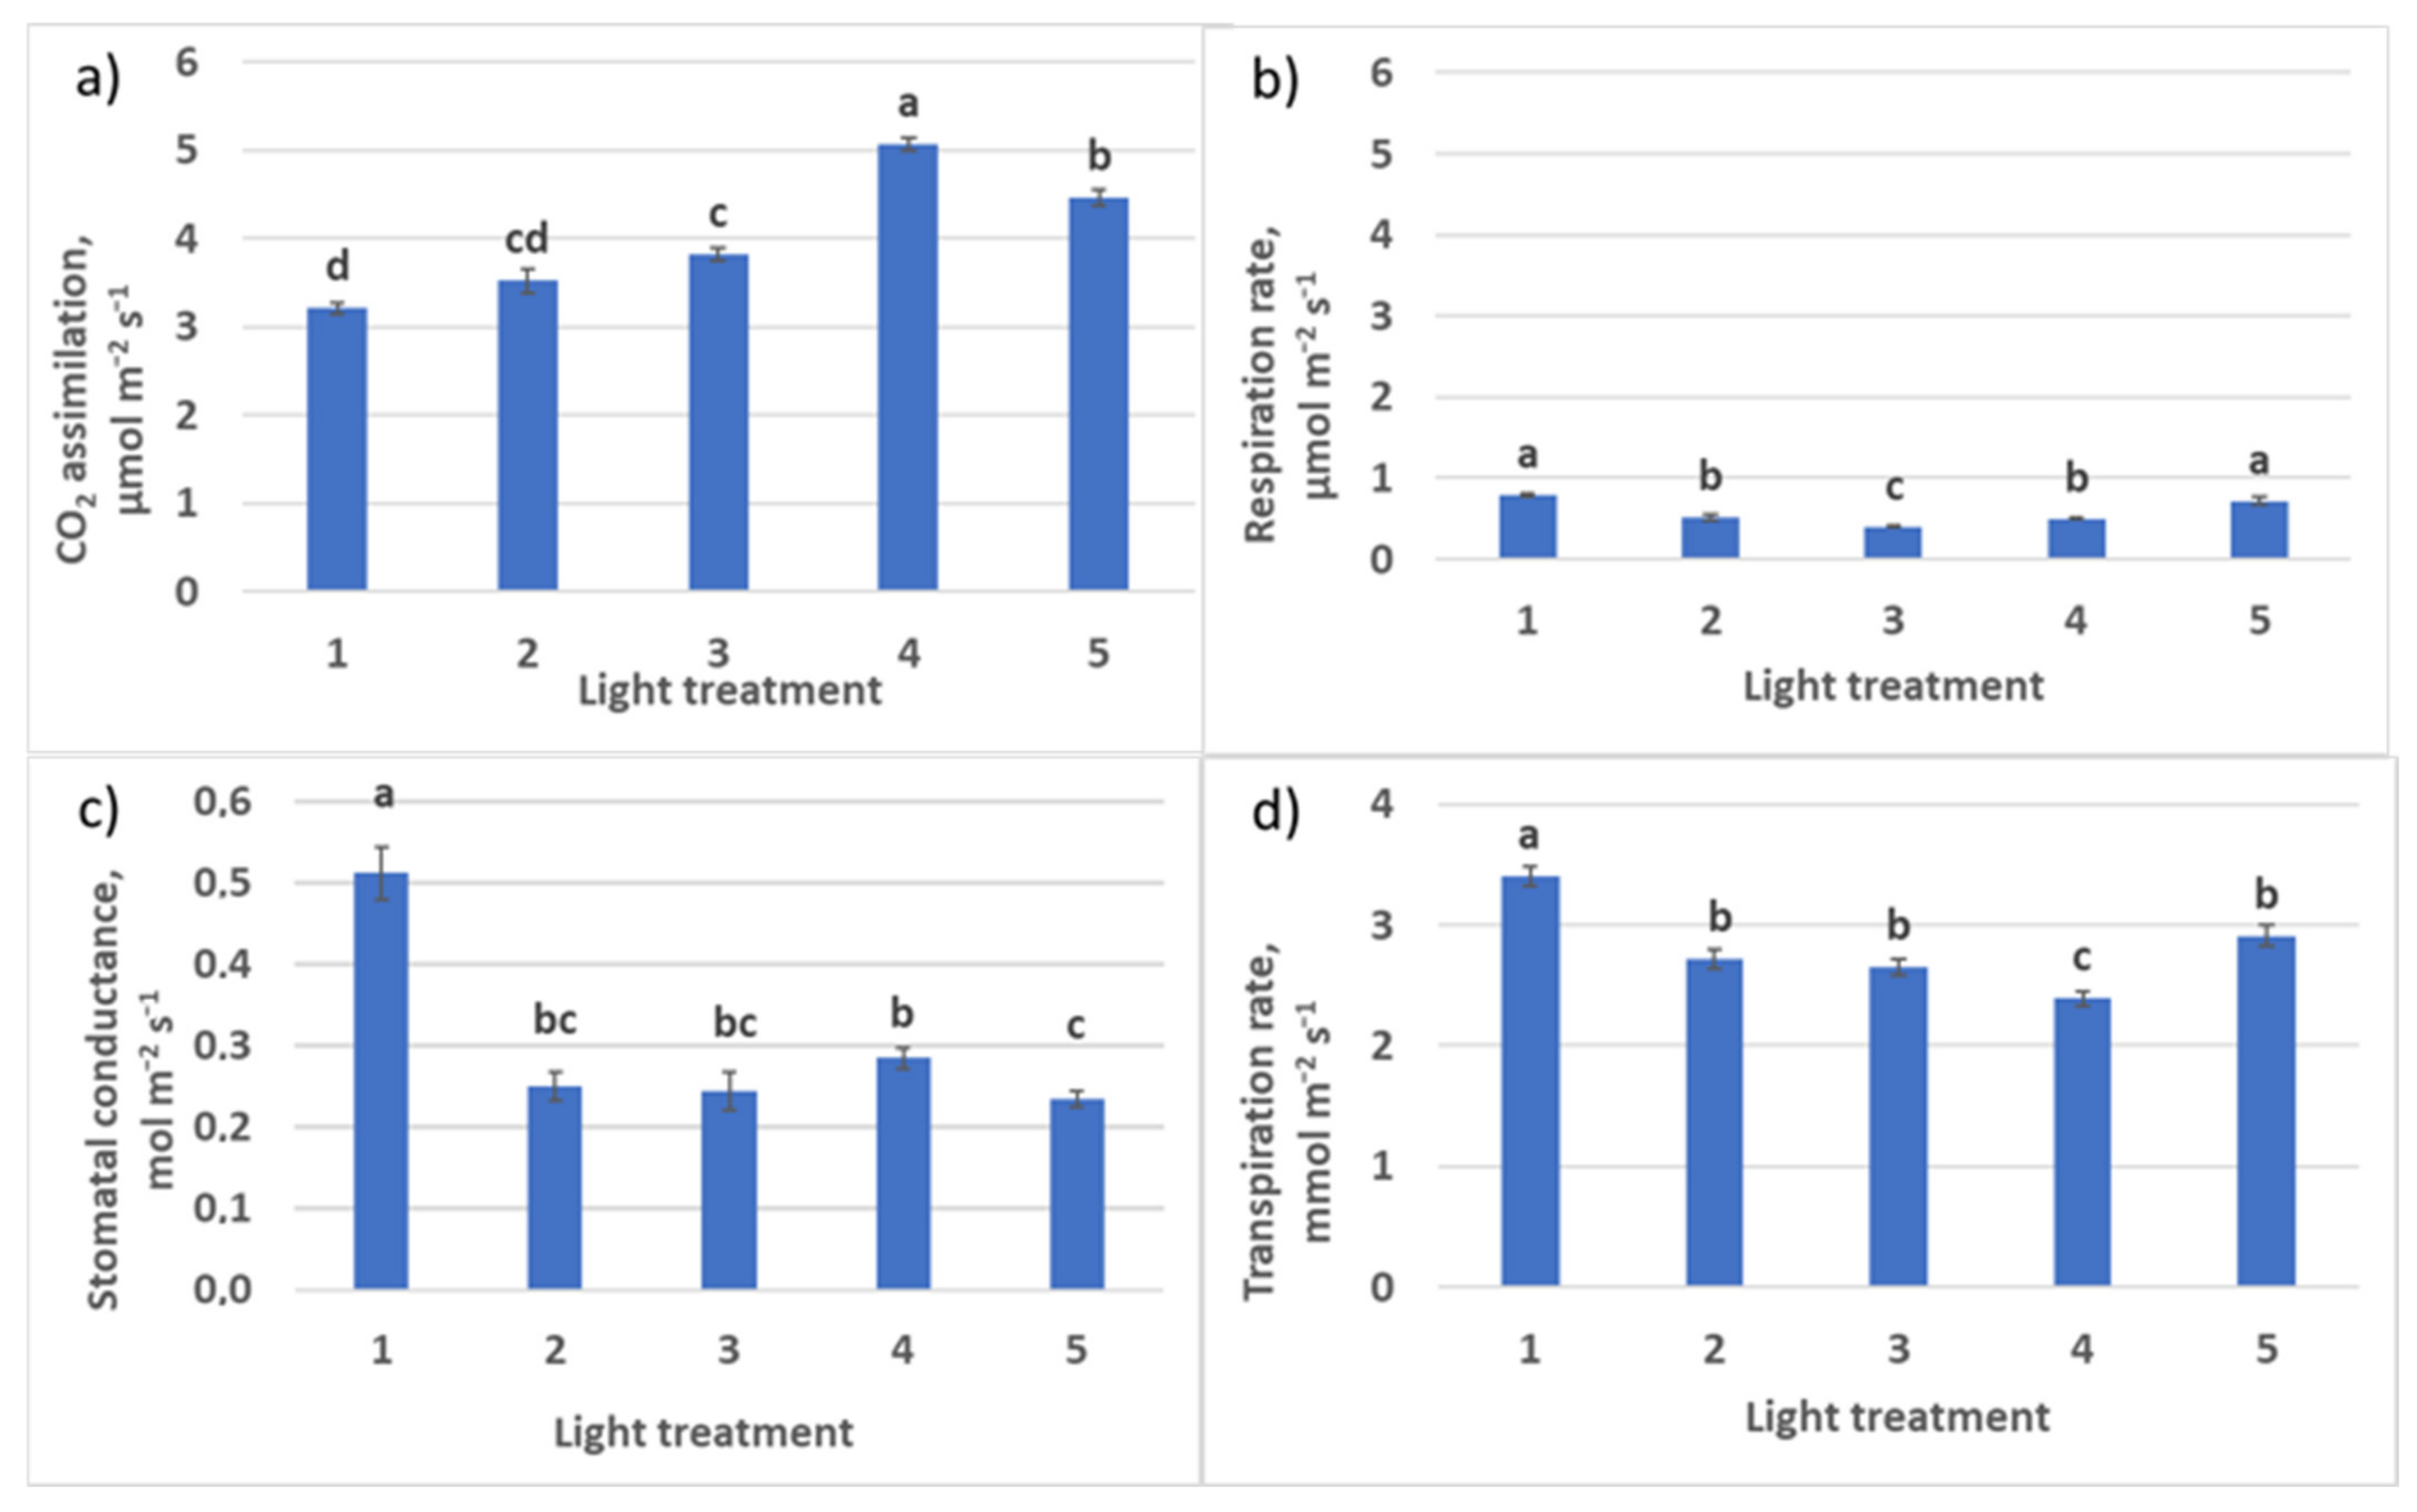
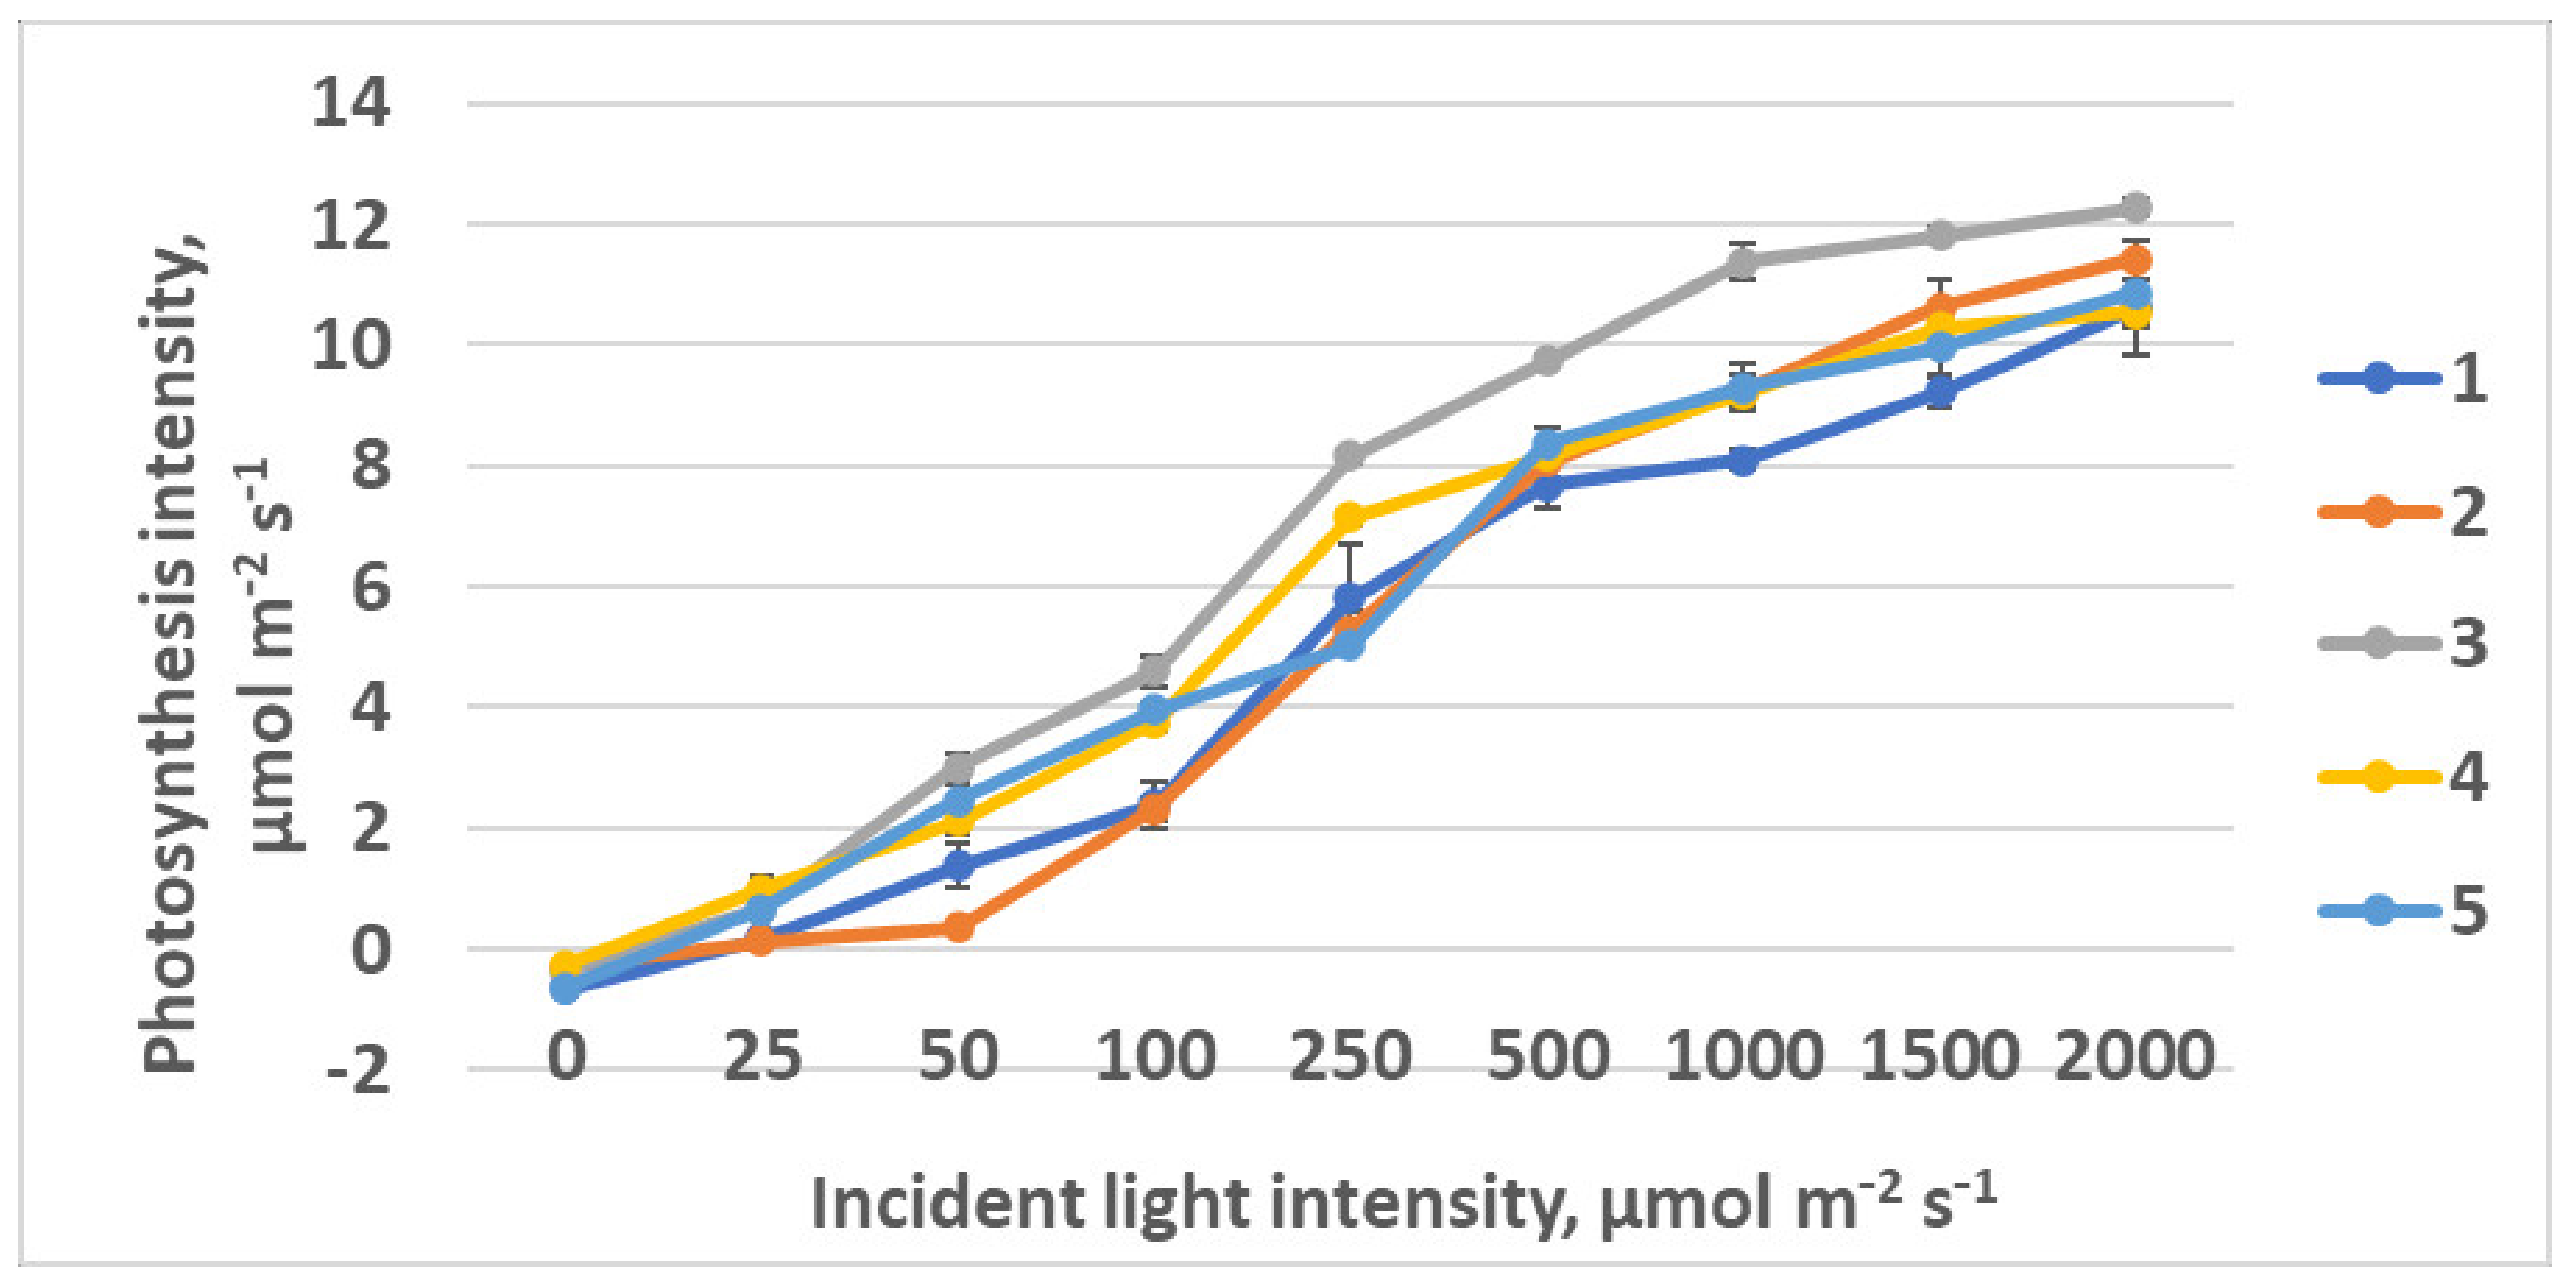
2.2.2. CO2–H2O Exchange
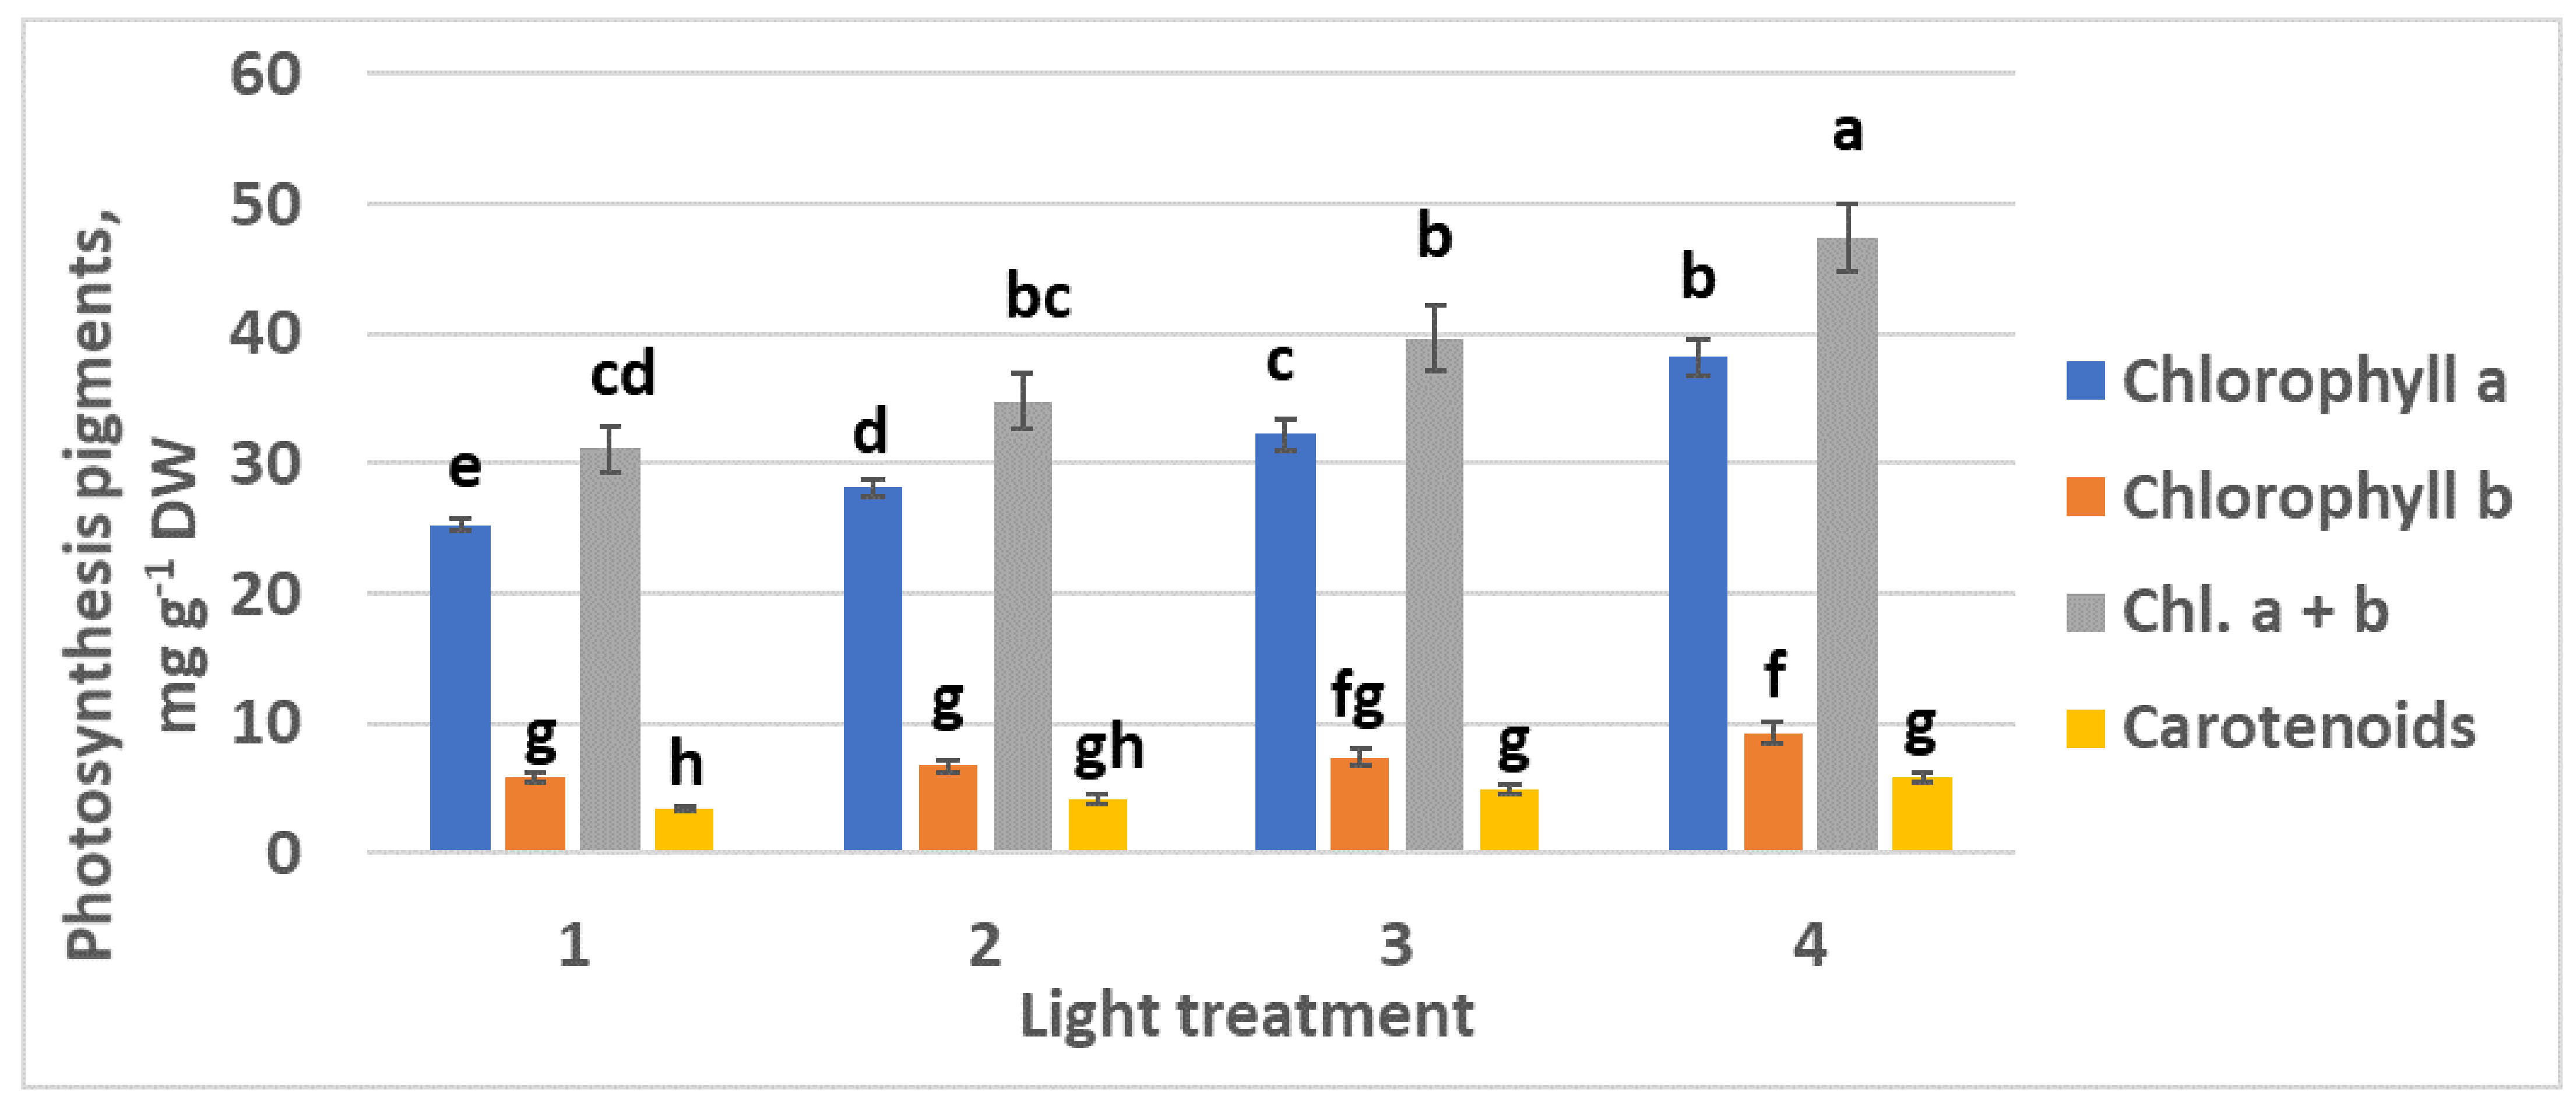
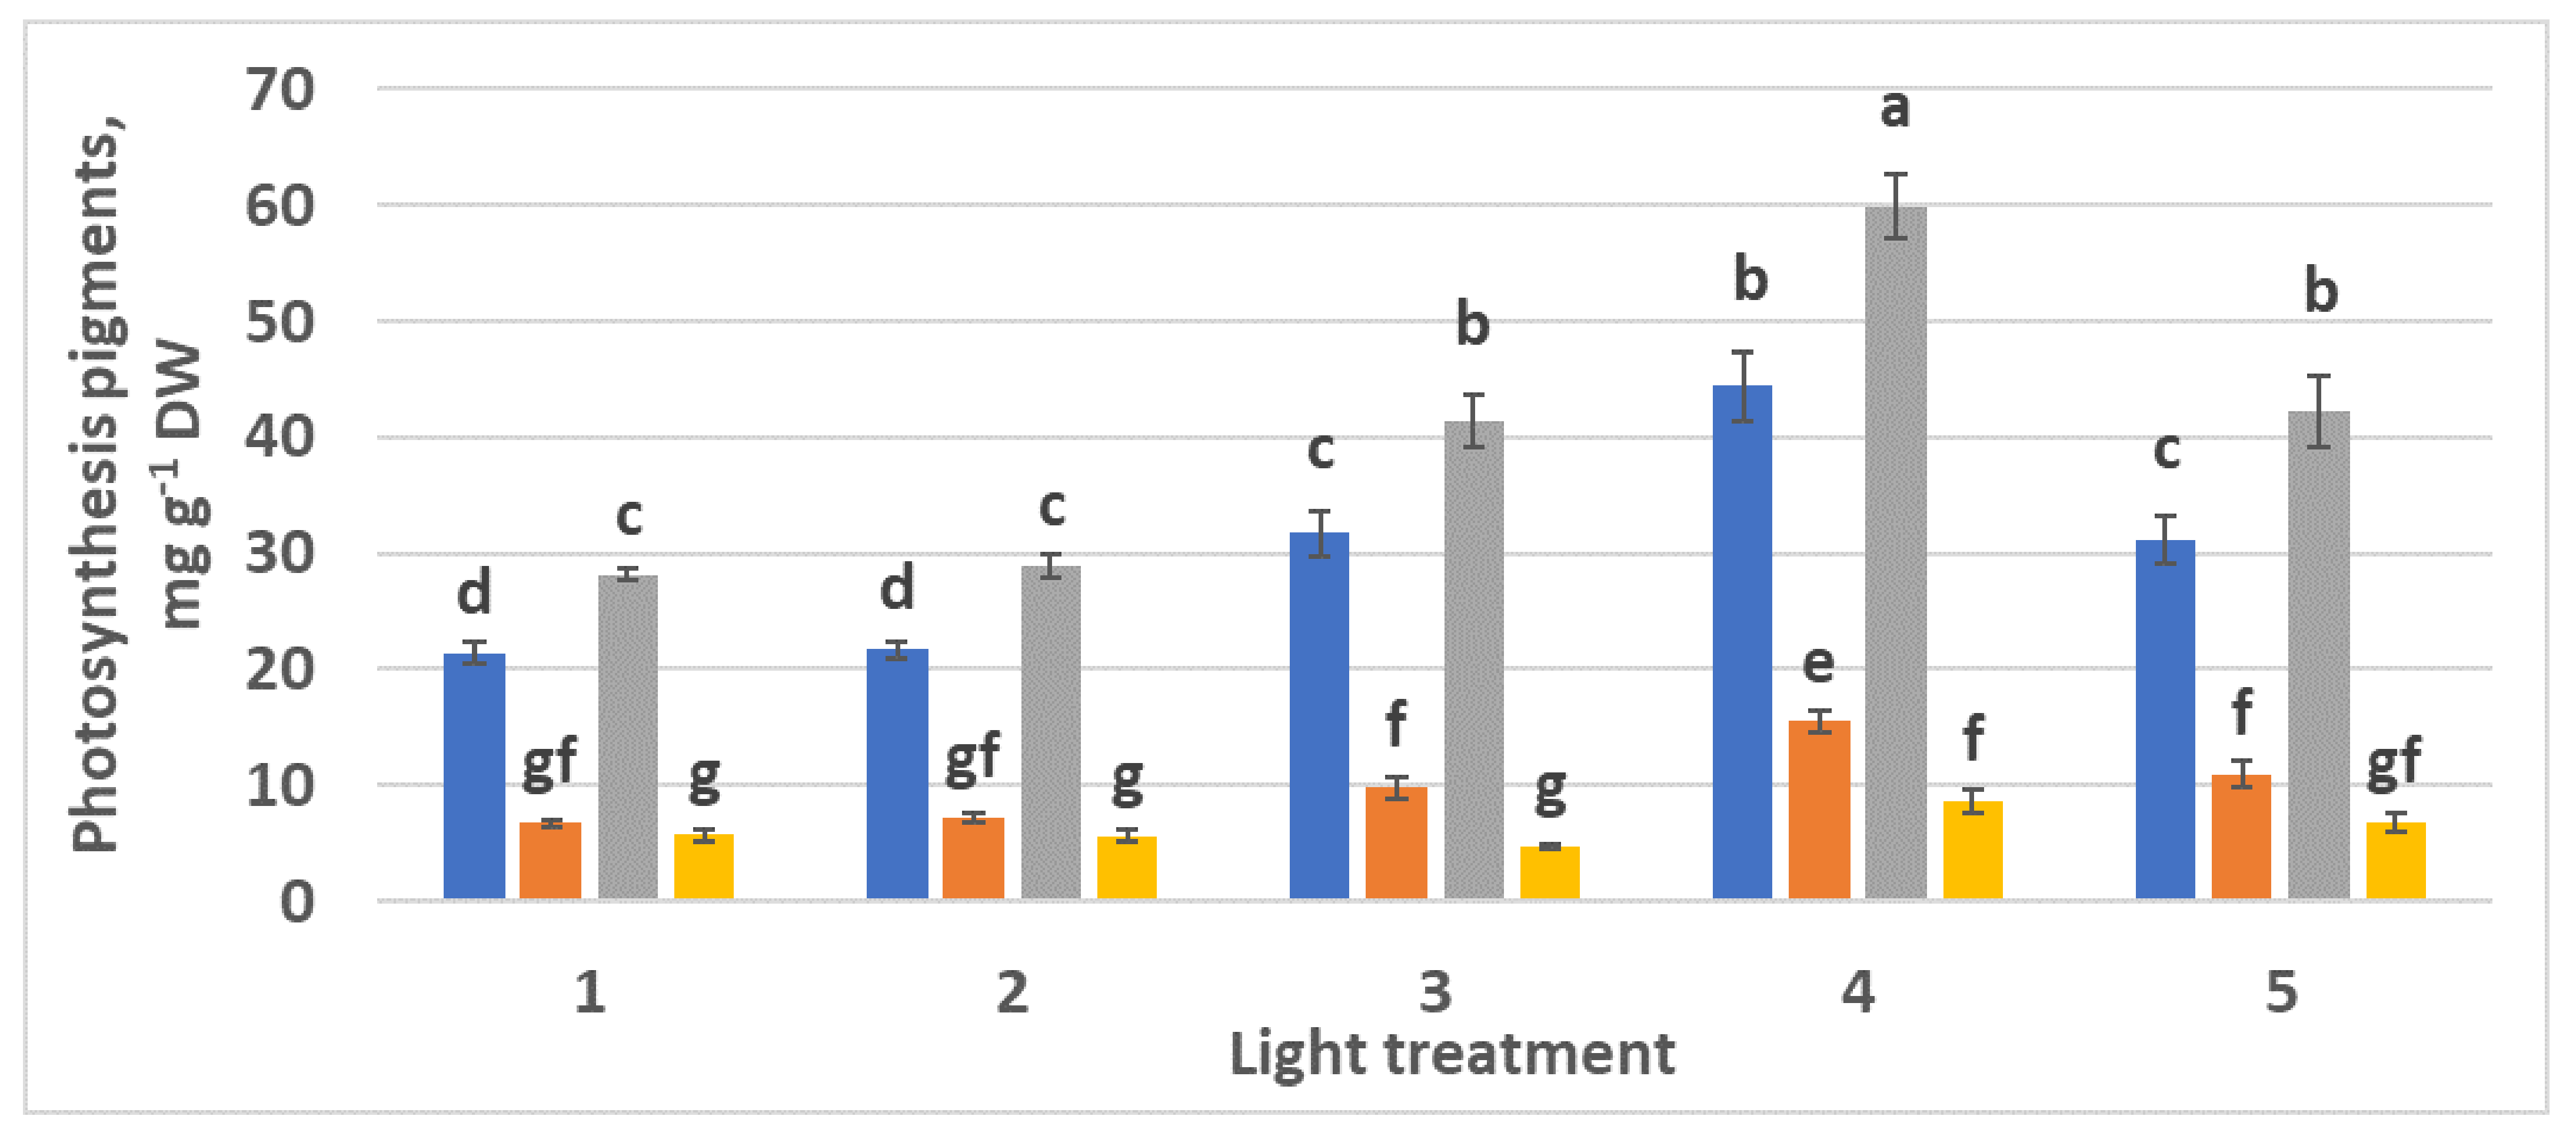
2.2.3. Photosynthetic Pigments
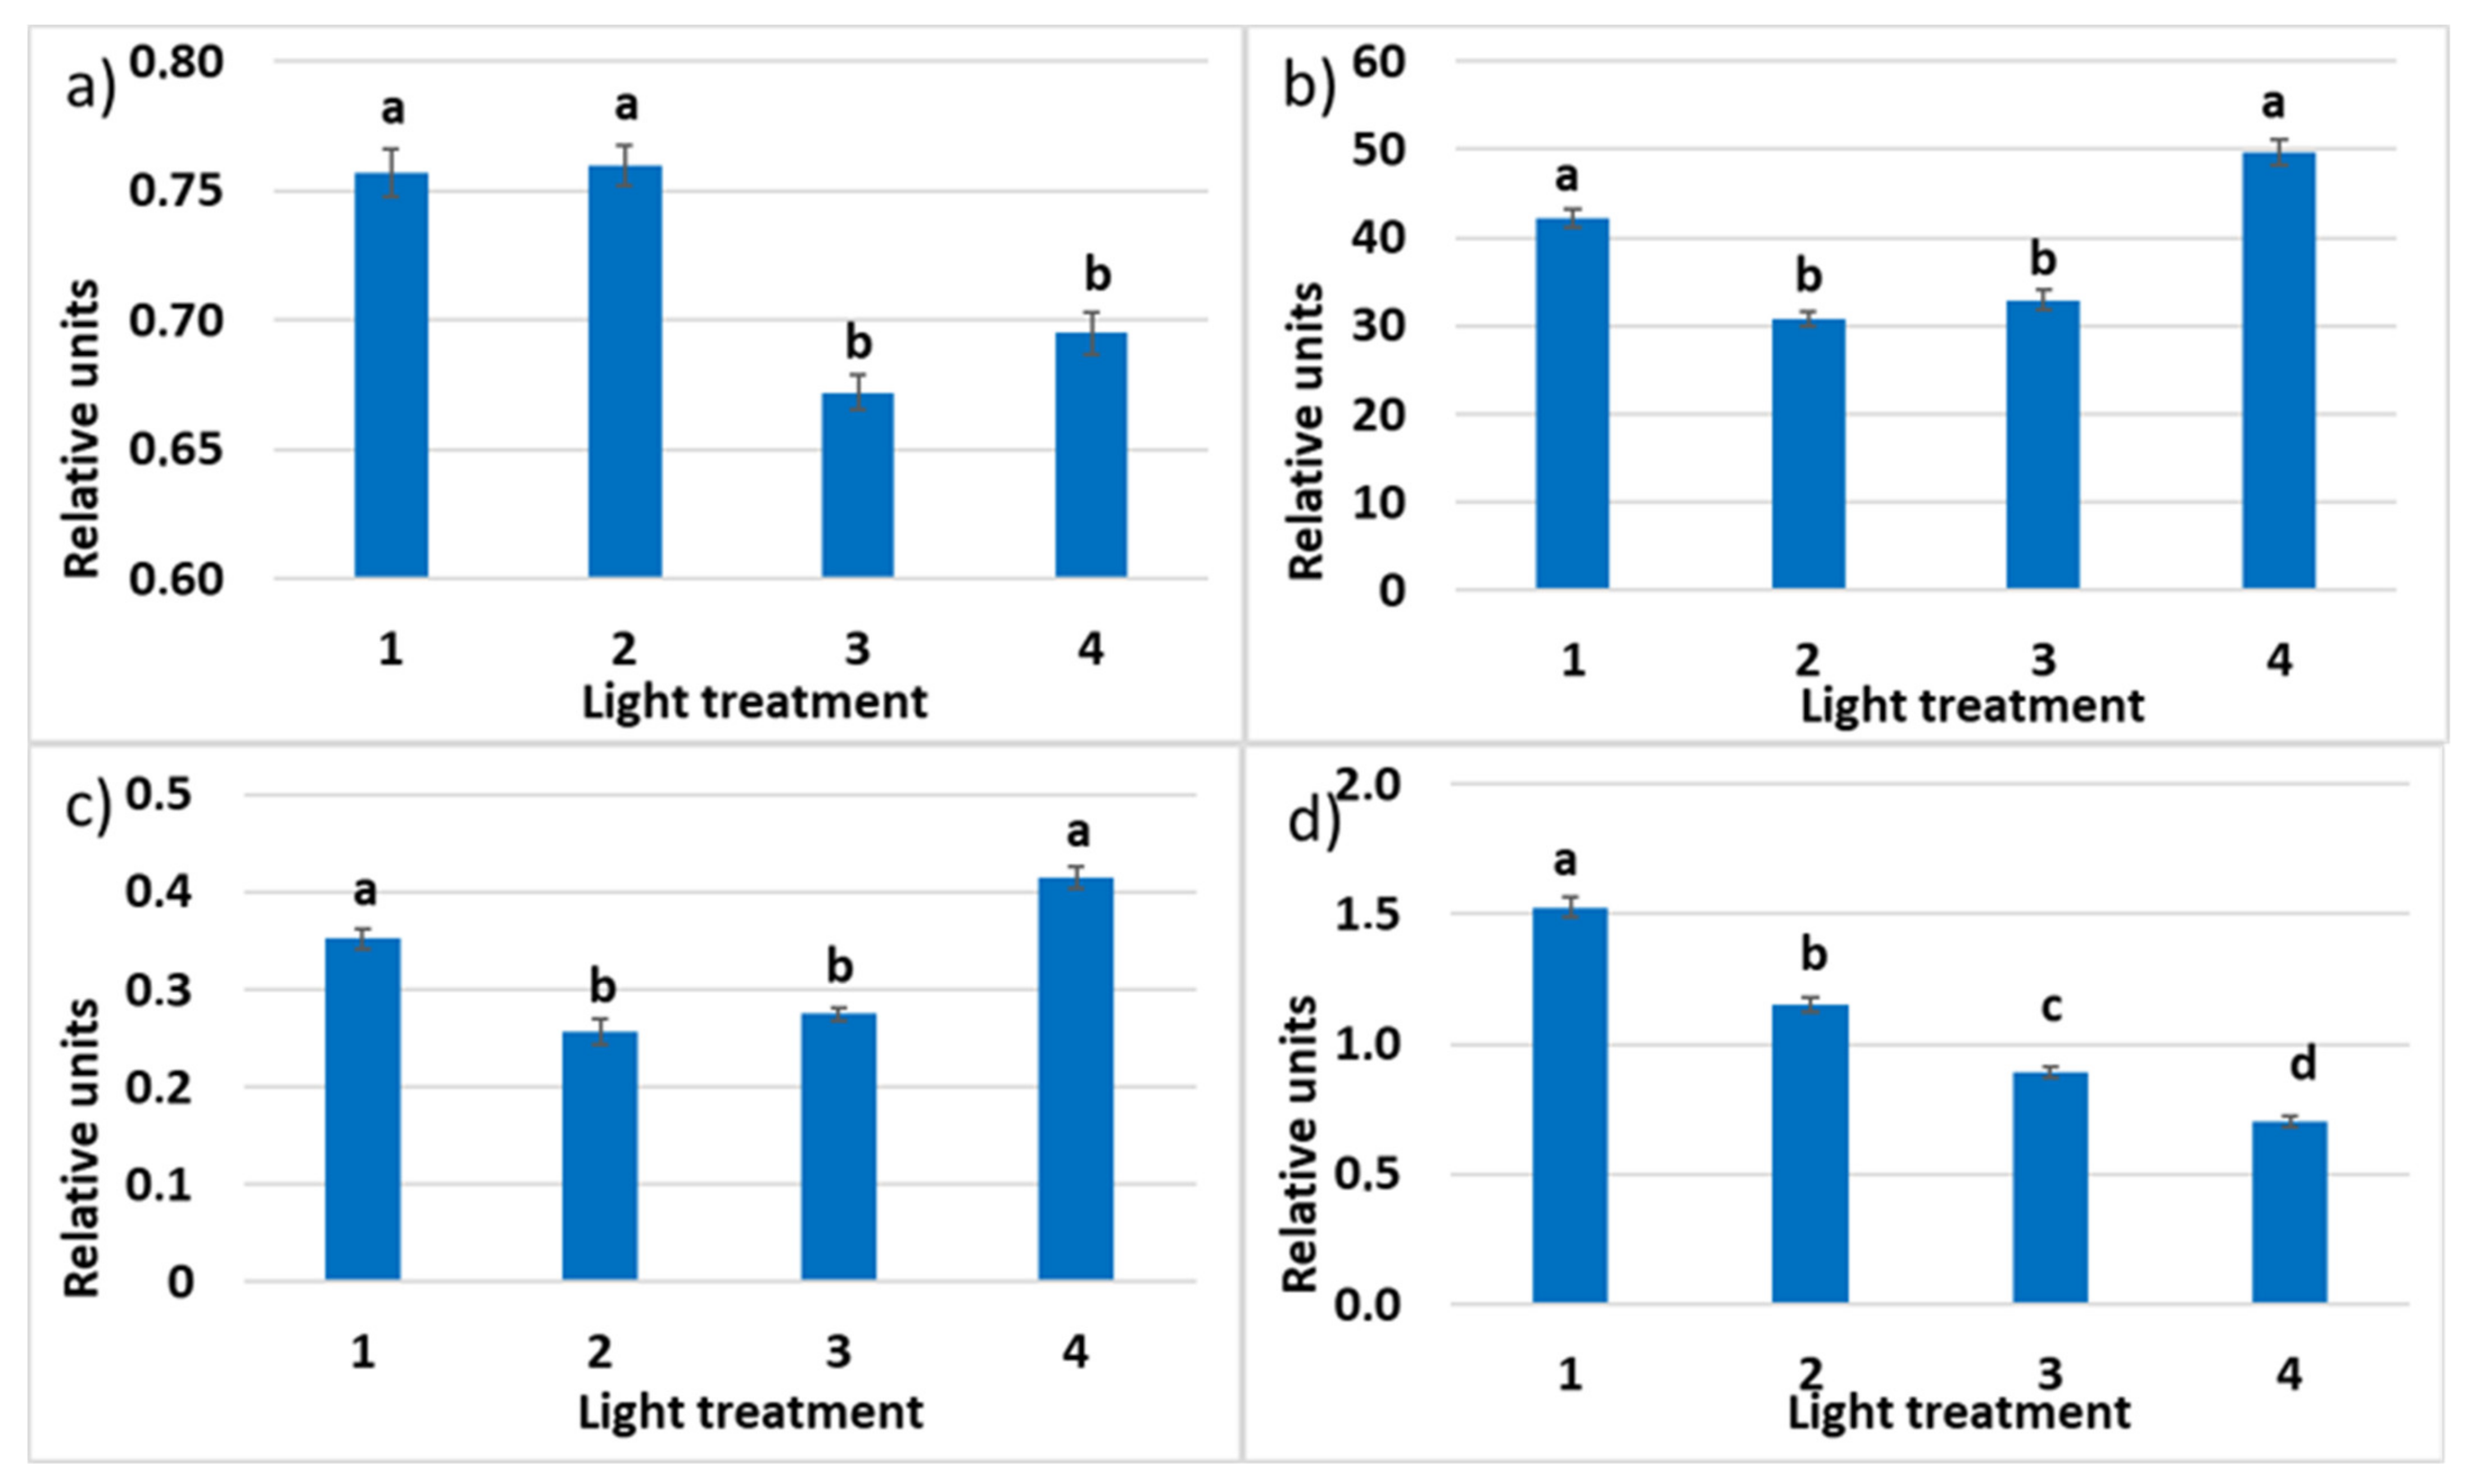
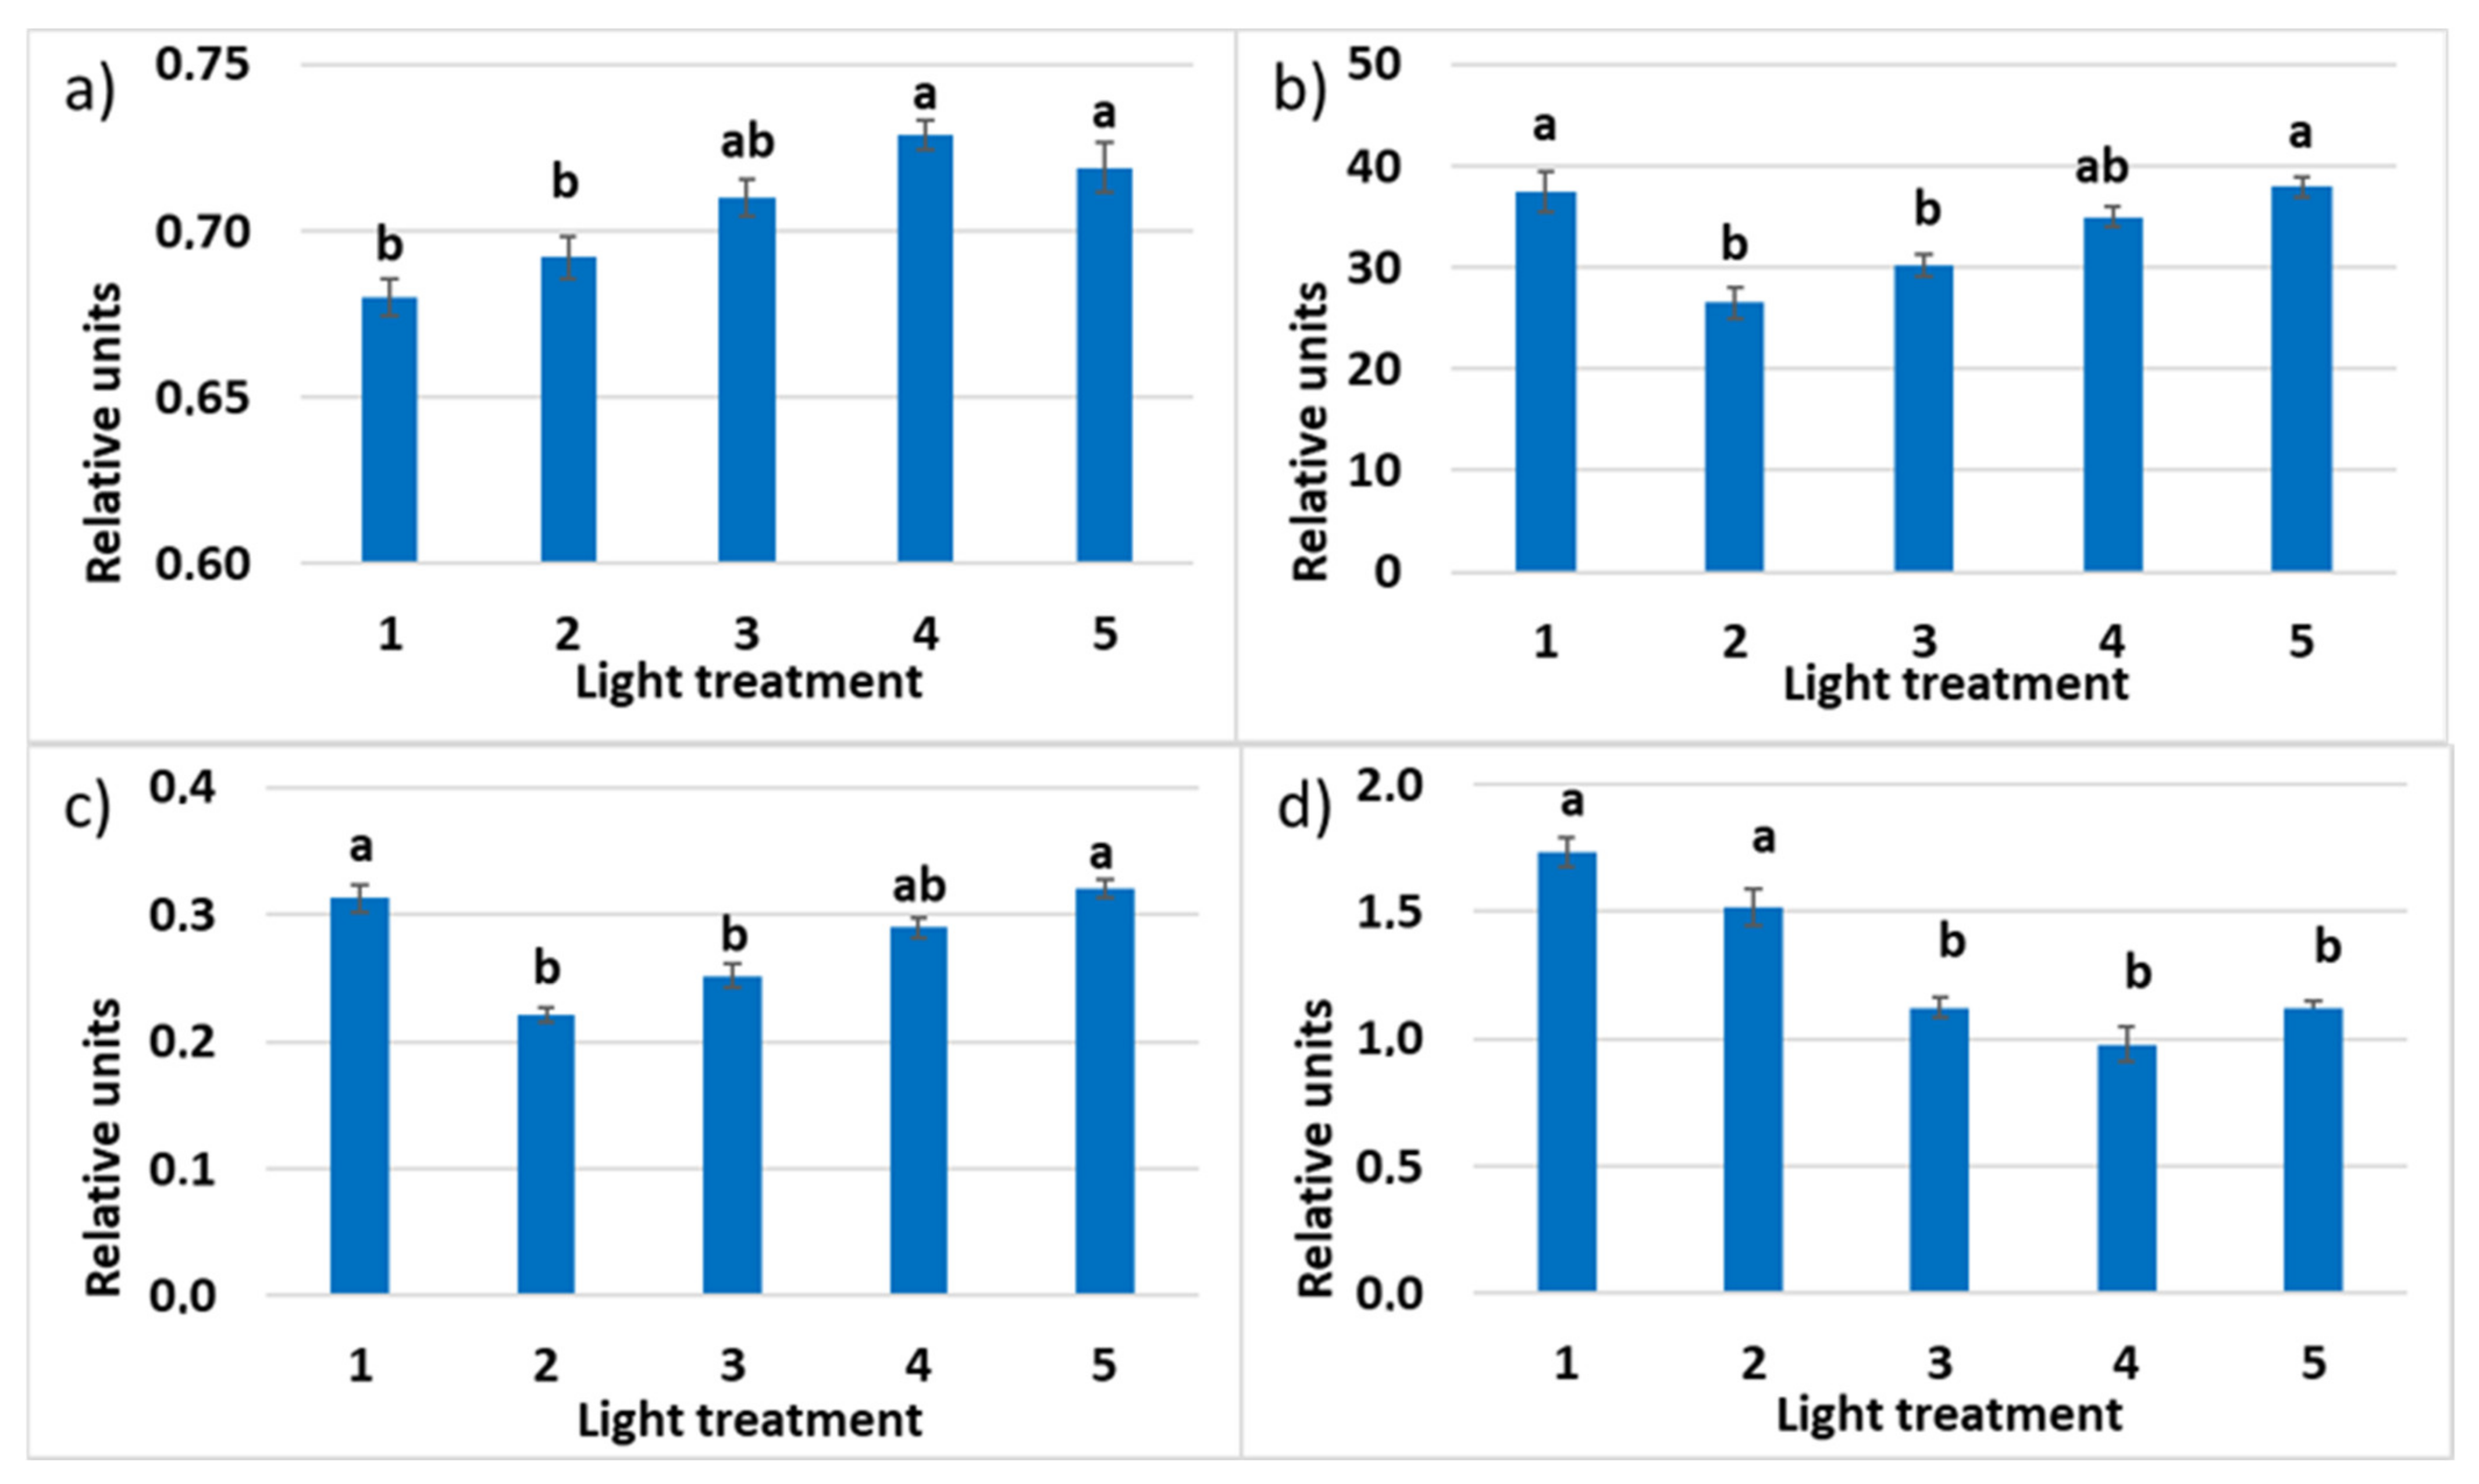
2.2.4. Chlorophyll a Fluorescence
3. Discussion
3.1. Raspberry Plant Responses to Various Red–Far-Red Light Ratios
3.2. Raspberry Plant Responses to Variation in Red, Green, and Blue Light in the Spectrum of Optical Radiation
4. Materials and Methods
4.1. Plant Material
4.2. Plant Growing In vitro
4.3. Plant Growing Ex vitro
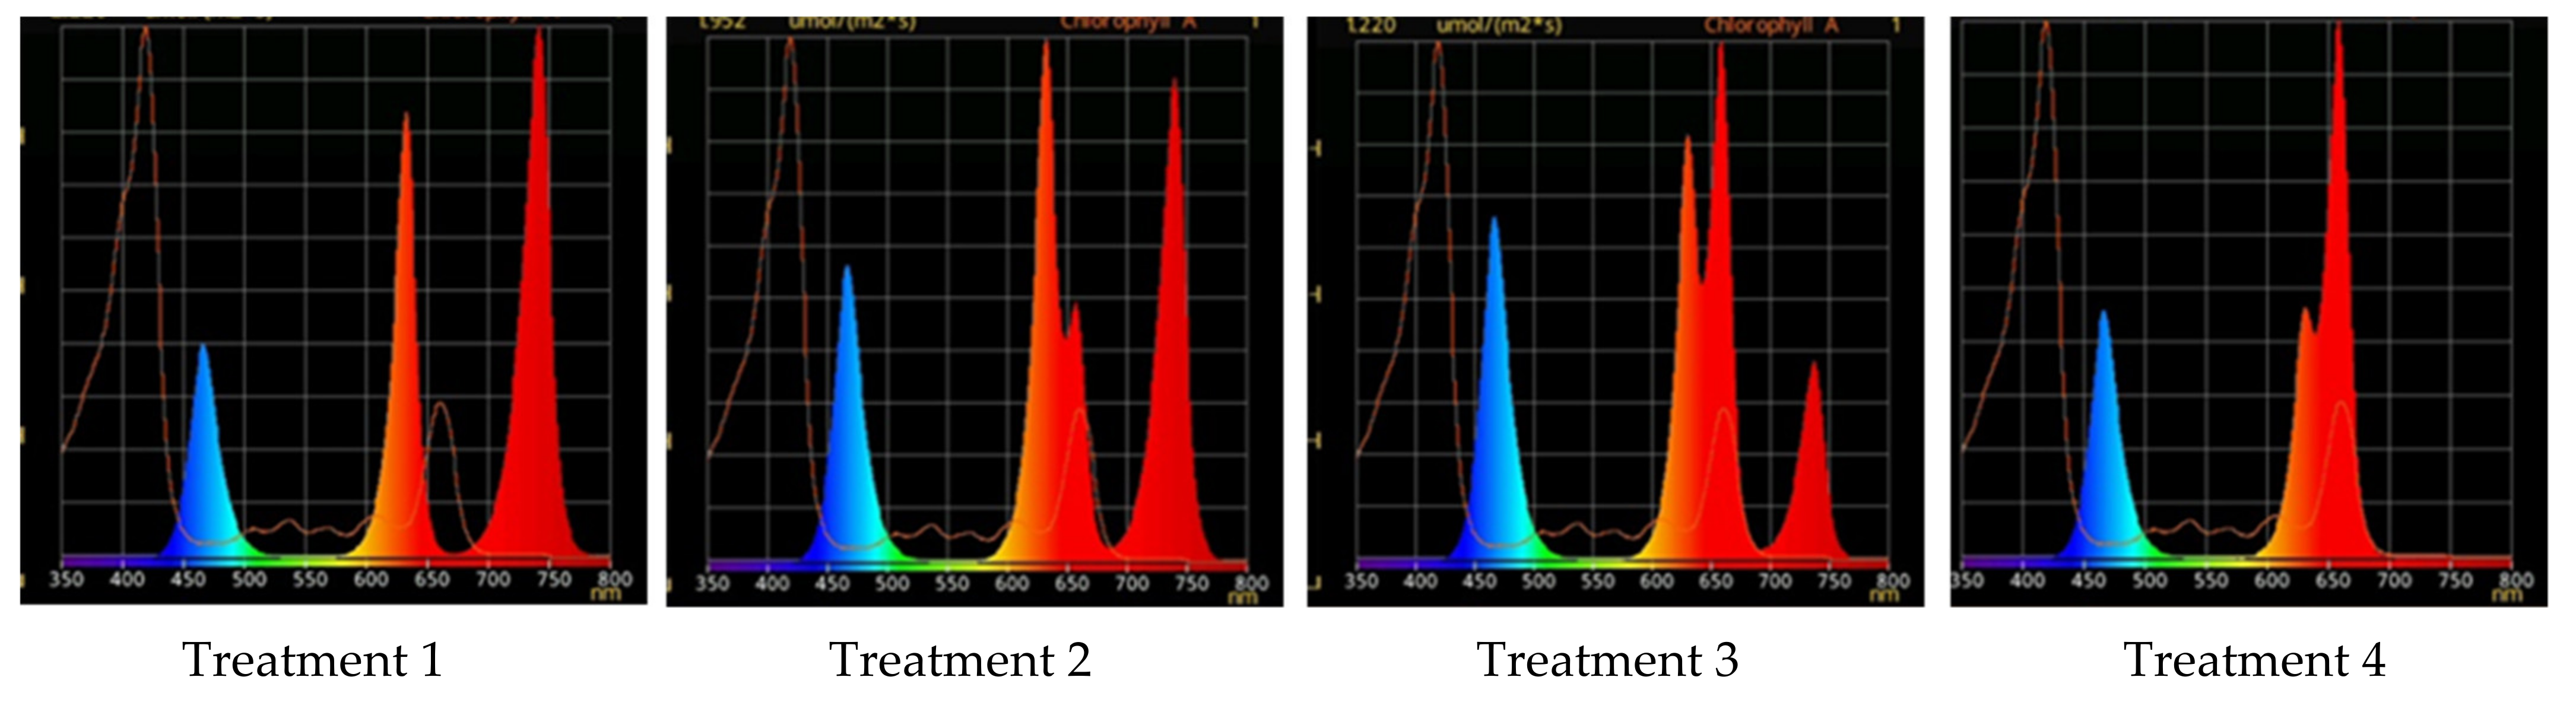
4.4. Different Light Conditions Experimental Design
4.5. Plant Growth Analyses
4.6. CO2–H2O Leaf Exchange Determination
4.7. Photosynthetic Pigments Determination
4.8. Chlorophyll a Fluorescence Determination
4.9. Statistical Analysis of Experimental Data
5. Conclusions
Author Contributions
Funding
Institutional Review Board Statement
Informed Consent Statement
Data Availability Statement
Acknowledgments
Conflicts of Interest
References
- Tarakanov, I.; Yakovleva, O.; Konovalova, I.; Paliutina, G.; Anisimov, A. Light-emitting diodes: On the way to combinatorial lighting technologies for basic research and crop production. Acta Hortic. 2012, 956, 171–178. [Google Scholar] [CrossRef]
- Bello-Bello, J.J.; Pérez-Sato, J.A.; Cruz-Cruz, C.A.; Martínez-Estrada, E. Light-Emitting Diodes: Progress in Plant Micropropagation. In Chlorophyll; Jacopo-Lopes, E., Queiroz, M.I., Zepka, L.Q., Eds.; INTECH: London, UK, 2017; pp. 93–103. [Google Scholar]
- Hashim, M.; Ahmad, B.; Drouet, S.; Hano, C.; Abbasi, B.H.; Anjum, S. Comparative Effects of Different Light Sources on the Production of Key Secondary Metabolites in Plants In Vitro Cultures. Plants 2021, 10, 1521. [Google Scholar] [CrossRef]
- McCree, K.J. The action spectrum, absorptance and quantum yield of photosynthesis in crop plants. Agric. Meteorol. 1972, 9, 191–216. [Google Scholar] [CrossRef]
- Inada, K. Action spectra for photosynthesis in higher plants. Plant Cell Physiol. 1976, 17, 355–365. [Google Scholar]
- Evans, J.R. The dependence of quantum yield on wavelength and growth irradiance. Aust. J. Plant Physiol. 1987, 14, 69–79. [Google Scholar] [CrossRef]
- Sager, J.C.; Smith, W.O.; Edwards, J.L.; Cyr, K.L. Photosynthetic efficiency and phytochrome photoequilibria determination using spectral data. Trans. ASAE 1988, 31, 1882–1889. [Google Scholar]
- Claypool, N.B.; Lieth, J.H. Green Light Improves Photosystem Stoichiometry in Cucumber Seedlings (Cucumis sativus) Compared to Monochromatic Red Light. Plants 2021, 10, 824. [Google Scholar] [CrossRef] [PubMed]
- Chen, X.L.; Yang, Q.C.; Song, W.P.; Wang, L.C.; Guo, W.Z.; Xue, X.Z. Growth and nutritional properties of lettuce affected by different alternating intervals of red and blue LED irradiation. Sci. Hortic. 2017, 223, 44–52. [Google Scholar] [CrossRef]
- Trouwborst, G.; Hogewoning, S.W.; van Kooten, O.; Harbinson, J.; van Ieperen, W. Plasticity of photosynthesis after the ‘red light syndrome’ in cucumber. Environ. Exp. Bot. 2016, 121, 75–82. [Google Scholar]
- Hogewoning, S.W.; Trouwborst, G.; Maljaars, H.; Poorter, H.; van Ieperen, W.; Harbinson, J. Blue light dose-response of leaf photosynthesis, morphology, and chemical composition of Cucumis sativus grown under different combinations of red and blue light. J. Exp. Bot. 2010, 61, 3107–3117. [Google Scholar] [CrossRef]
- Miao, Y.; Wang, X.; Gao, L.; Chen, Q.; Mei, Q. Blue light is more essential than red light for maintaining the activities of photosystem II and I and photosynthetic electron transport capacity in cucumber leaves. J. Integr. Agric. 2016, 15, 87–100. [Google Scholar] [CrossRef] [Green Version]
- Miao, Y.; Chen, Q.; Qu, M.; Gao, L.; Hou, L. Blue light alleviates ‘red light syndrome’ by regulating chloroplast ultrastructure, photosynthetic traits and nutrient accumulation in cucumber plants. Sci. Hortic. 2019, 257, 108680. [Google Scholar] [CrossRef]
- Davis, P.A.; Burns, C. Photobiology in protected horticulture. Food Energy Secur. 2016, 5, 223–238. [Google Scholar] [CrossRef]
- Sergejeva, D.; Alsina, I.; Duma, M.; Dubova, L.; Augspole, I.; Erdberga, I.; Berzina, K. Evaluation of different lighting sources on the growth and chemical composition of lettuce. Agron. Res. 2018, 16, 892–899. [Google Scholar]
- Prikupets, L.B.; Boos, G.V.; Terekhov, V.G.; Tarakanov, I.G. Research into influence from different ranges of PAR radiation on efficiency and biochemical composition of green salad foliage biomass. Light Eng. 2018, 26, 38–47. [Google Scholar] [CrossRef]
- Kim, H.H.; Wheeler, R.; Sager, J.; Norikane, J. Photosynthesis of lettuce exposed to different short-term light qualities. Environ. Control Biol. 2005, 43, 113–119. [Google Scholar] [CrossRef] [Green Version]
- Kim, S.J.; Hahn, E.J.; Heo, J.W.; Paek, K.Y. Effects of LEDs on net photosynthetic rate, growth and leaf stomata of chrysanthemum plantlets in vitro. Hort. Sci. 2004, 101, 143–151. [Google Scholar]
- Kim, H.H.; Goi, G.D.; Wheeler, R.M.; Sager, J.C. Green-light supplementation for enhanced lettuce growth under red- and blue-light-emitting diodes. Hort. Sci. 2004, 39, 1617–1622. [Google Scholar] [CrossRef] [Green Version]
- Trouwborst, G.; Oosterkamp, J.; Hogewoning, S.W.; Harbinson, J.; van Ieperen, W. The responses of light interception, photosynthesis and fruit yield of cucumber to LED-lighting within the canopy. Physiol. Plant. 2010, 138, 289–300. [Google Scholar] [CrossRef]
- Hernández, R.; Kubota, C. Physiological responses of cucumber seedlings under different blue and red photon flux ratios using LEDs. Environ. Exp. Bot. 2016, 121, 66–74. [Google Scholar] [CrossRef]
- Yorio, N.C.; Goins, G.D.; Kagie, H.R.; Wheeler, R.M.; Sager, J.C. Improving spinach, radish, and lettuce growth under red light-emitting diodes (LEDs) with blue light supplementation. HortScience 2001, 36, 380–383. [Google Scholar] [CrossRef] [Green Version]
- Matsuda, R.; Ohashi-Kaneko, K.; Fujiwara, K.; Goto, E.; Kurata, K. Photosynthetic characteristics of rice leaves grown under red light with or without supplemental blue light. Plant Cell Physiol. 2004, 45, 1870–1874. [Google Scholar] [CrossRef]
- Wang, Y.; Zhang, T.; Folta, K.M. Green light augments far-red-light-induced shade response. Plant Growth Regul. 2013, 77, 145–155. [Google Scholar] [CrossRef]
- Golovatskaya, I.F.; Karnachuk, R.A. Role of green light in physiological activity of plants. Russ. J. Plant Physiol. 2014, 62, 727–740. [Google Scholar] [CrossRef]
- Smith, H.L.; McAusland, L.; Murchie, E.H. Don’t ignore the green light: Exploring diverse roles in plant processes. J. Exp. Bot. 2017, 68, 2099–2110. [Google Scholar] [CrossRef]
- Prikupets, L.B.; Boos, G.V.; Terekhov, V.G.; Tarakanov, I.G. Optimization of lighting parameters of irradiation in light culture of lettuce plants using LED emitters. Light Eng. 2019, 27, 43–54. [Google Scholar] [CrossRef]
- McCoshum, S.; Kiss, J.Z. Green light affects blue-light-based phototropism in hypocotyls of Arabidopsis thaliana. J. Torrey Bot. Soc. 2011, 138, 409–417. [Google Scholar] [CrossRef]
- Frechilla, S.; Talbott, L.D.; Bogomolni, R.A.; Zeiger, E. Reversal of bluelight-stimulated stomatal opening by green light. Plant Cell Physiol. 2000, 41, 171–176. [Google Scholar] [CrossRef] [PubMed] [Green Version]
- Talbott, L.D.; Nikolova, G.; Ortix, A.; Shmayevich, I.; Zeiger, E. Green light reversal of blue-light-stimulated stomatal opening is found in a diversity of plant species. Am. J. Bot. 2002, 89, 366–368. [Google Scholar] [CrossRef] [PubMed] [Green Version]
- Terashima, I.; Fujita, T.; Inoue, T.; Chow, W.S.; Oguchi, R. Green light drives leaf photosynthesis more efficiently than red light in strong white light: Revisiting the enigmatic question of why leaves are green. Plant Cell Physiol. 2009, 50, 684–697. [Google Scholar] [CrossRef] [Green Version]
- Park, Y.; Runkle, E.S. Far-red radiation promotes growth of seedlings by increasing leaf expansion and whole-plant net assimilation. Environ. Exp. Bot. 2017, 136, 41–49. [Google Scholar] [CrossRef] [Green Version]
- Avercheva, O.V.; Berkovich, Y.A.; Konovalova, I.O.; Radchenko, S.G.; Lapach, S.N.; Bassarskaya, E.M.; Kochetova, G.V.; Zhigalova, T.V.; Yakovleva, O.S.; Tarakanov, I.G. Optimizing LED lighting for space plant growth unit: Joint effects of photon flux density, red to white ratios and intermittent light pulses. Life Sci. Space Res. 2016, 11, 29–42. [Google Scholar] [CrossRef]
- Berkovich, Y.A.; Konovalova, I.O.; Smolyanina, S.O.; Erokhin, A.N.; Avercheva, O.V.; Bassarskaya, E.M.; Kochetova, G.V.; Zhigalova, T.V.; Yakovleva, O.S.; Tarakanov, I.G. LED crop illumination inside space greenhouses. Reach. Rev. Hum. Space Explor. 2017, 6, 11–24. [Google Scholar] [CrossRef]
- Berkovich, Y.A.; Konovalova, I.O.; Erokhin, A.N.; Smolyanina, S.O.; Smolyanin, V.G.; Yakovleva, O.S.; Tarakanov, I.G.; Ivanov, T.M. LED lighting optimization as applied to a vitamin space plant growth facility. Life Sci. Space Res. 2019, 20, 93–100. [Google Scholar] [CrossRef] [PubMed]
- Desjardins, Y.; Dubuc, J.; Badr, A. In Vitro Culture of Plants: A Stressful Activity. Acta Hortic. 2009, 812, 2950. [Google Scholar] [CrossRef]
- Brainerd, K.E.; Fuchigami, L.H. Acclimatization of Aseptically cultured Apple Plants to Low Relative Humidity. J. Am. Soc. Hortic. Sci. 1981, 106, 515–518. [Google Scholar] [CrossRef]
- Donnelly, D.; Tisdall, L. Acclimatization Strategies for Micropropagated Plants. Micropropagation of Woody Plants; Kluwer Academic: Dordrecht, The Netherlands, 1993; pp. 153–166. [Google Scholar]
- Gupta, S.; Jatothu, B. Fundamentals and applications of light-emitting diodes (LEDs) in in vitro plant growth and morphogenesis. Plant Biotechnol. Rep. 2013, 7, 211–220. [Google Scholar] [CrossRef]
- Shulgina, A.A.; Kalashnikova, E.A.; Tarakanov, I.G.; Kirakosyan, R.N.; Cherednichenko, M.Y.; Polivanova, O.B.; Baranova, E.N.; Khaliluev, M.R. Influence of Light Conditions and Medium Composition on Morphophysiological Characteristics of Stevia rebaudiana Bertoni In Vitro and In Vivo. Horticulturae 2021, 7, 195. [Google Scholar] [CrossRef]
- Hahn, E.J.; Kozai, T.; Paek, K.Y. Blue and red light-emitting diodes with or without sucrose and ventilation affect in vitro growth of Rehmannia glutinosa plantlets. J. Plant Biol. 2000, 43, 247–250. [Google Scholar] [CrossRef]
- Nhut, D.T.; Takamura, T.; Watanabe, H. Responses of strawberry plantlets cultured in vitro under superbright red and blue light-emitting diodes (LEDs). Plant Cell Tissue Organ Cult. 2003, 73, 43–52. [Google Scholar] [CrossRef]
- Jao, R.C.; Lai, C.C.; Fang, W.; Chang, S.F. Effect of red light on the growth of Zantedeschia plantlets in vitro and tuber formation using light emitting diodes. HortScience 2005, 40, 436–438. [Google Scholar] [CrossRef] [Green Version]
- Shin, S.K.; Murthy, N.H.; Heo, W.J.; Hahn, J.E.; Paek, Y.K. The effect of light quality on the growth and development of in vitro cultured Doritaenopsis plants. Acta Physiol. Plant. 2008, 30, 339–343. [Google Scholar] [CrossRef]
- Li, H.; Xu, Z.; Tang, C. Effect of lightemitting diodes on growth and morphogenesis of upland cotton (Gossypium hirsutum L.) plantlets in vitro. Plant Cell Tissue Organ Cult. 2010, 103, 155–163. [Google Scholar] [CrossRef]
- Gupta, D.; Sahoo, T. Light emitting diode (LED)-induced alteration of oxidative events during in vitro shoot organogenesis of Curculigo orchioides Gaertn. Acta Physiol. Plant. 2015, 37, 233. [Google Scholar] [CrossRef]
- Nacheva, L.; Dimitrova, N.; Koleva-Valkova, L.; Tarakanov, I.; Vassilev, A. Effect of LED lighting on the growth of raspberry (Rubus idaeus L.) plants in vitro. Agric. Sci. 2021, 13, 126–140. [Google Scholar] [CrossRef]
- Rocha, P.S.; Oliveira, R.P.; Scivittaro, W.B. LED—New light source for multiplication and rooting in vitro of raspberry. Pesqui. Agropecu. Gaúcha 2013, 19, 98–105. [Google Scholar]
- Poncetta, P.; Ioratti, D.; Mignani, I.; Giongo, L. In vitro propagation of red raspberry under light-emitting diodes (LEDs). Acta Hortic. 2017, 1155, 369374. [Google Scholar] [CrossRef]
- Prioul, J.L.; Chartier, P. Partitioning of transfer and carboxilation components of intracellular resistance to photosynthetic CO2 fixation: A critical analysis of the methods used. Ann. Bot. 1977, 41, 789–800. [Google Scholar] [CrossRef]
- Parsons, R.; Ogston, S.A. Photosyn Assistant. In Software for Analysis of Photosynthesis; Dundee Scientific: Scotland, UK, 1998; 54p. [Google Scholar]
- Björkman, O.; Demmig, B. Photon yield of O2 evolution and chlorophyll fluorescence characteristics at 77 K among vascular plants of diverse origins. Planta 1987, 170, 489–504. [Google Scholar] [CrossRef]
- Bolhar-Nordenkampf, H.; Oquist, G. Chlorophyll fluorescence as a tool in photosynthesis research. In Photosynthesis and Production in a Changing Environment: A Field and Laboratory Manual; Chapman & Hall: London, UK, 1993; pp. 193–206. [Google Scholar]
- Jayalath, T.C.; van Iersel, M.W. Canopy Size and Light Use Efficiency Explain Growth Differences between Lettuce and Mizuna in Vertical Farms. Plants 2021, 10, 704. [Google Scholar] [CrossRef]
- Goins, G.D.; Yorio, N.C.; Sanwo, M.M.; Brown, C.S. Photomorphogenesis, photosynthesis, and seed yield of wheat plants grown under red light-emitting diodes (LEDs) with and without supplemental blue lighting. J. Exp. Bot. 1997, 48, 1407–1413. [Google Scholar] [CrossRef] [PubMed] [Green Version]
- Hogewoning, S.W. On the Photosynthetic and Developmental Responses of Leaves to the Spectral Composition of Light. Ph.D. Thesis, Wageningen University, Wageningen, The Netherlands, 2010; p. 107. [Google Scholar]
- Zhen, S.Y.; van Iersel, M.W. Far-red light is needed for efficient photochemistry and photosynthesis. J. Plant Physiol. 2017, 209, 115–122. [Google Scholar] [CrossRef] [PubMed] [Green Version]
- Zhen, S.; Bugbee, B. Substituting Far-Red for Traditionally Defined Photosynthetic Photons Results in Equal Canopy Quantum Yield for CO2 Fixation and Increased Photon Capture During Long-Term Studies: Implications for Re-Defining PAR. Front. Plant Sci. 2020, 11, 581156. [Google Scholar] [CrossRef] [PubMed]
- Kreslavski, V.D.; Los, D.A.; Schmitt, F.-J.; Zharmukhamedov, S.K.; Kuznetsov, V.V.; Allakhverdiev, S.I. The impact of the phytochromes on photosynthetic processes. Biochim. Biophys. (BBA) Bioenerg. 2018, 1859, 400–408. [Google Scholar] [CrossRef] [PubMed]
- Lee, M.-J.; Son, K.-H.; Oh, M.-M. Increase in biomass and bioactive compounds in lettuce under various ratios of red to far-red LED light supplemented with blue LED light. Hortic. Environ. Biotechnol. 2016, 57, 139–147. [Google Scholar] [CrossRef]
- Murchie, E.H.; Pinto, M.; Horton, P. Agriculture and the new challenges for photosynthesis research. New Phytol. 2008, 181, 532–552. [Google Scholar] [CrossRef]
- Emerson, R.; Chalmers, R.; Cederstrand, C. Some factors influencing the long-wave limit of photosynthesis. Proc. Natl. Acad. Sci. USA 1957, 43, 133–143. [Google Scholar] [CrossRef] [PubMed] [Green Version]
- Casal, J.J. Photoreceptor signaling networks in plant responses to shade. Annu. Rev. Plant Biol. 2013, 64, 403–427. [Google Scholar] [CrossRef] [PubMed]
- Paucek, I.; Pennisi, G.; Pistillo, A.; Appolloni, E.; Crepaldi, A.; Calegari, B.; Spinelli, F.; Cellini, A.; Gabarrell, X.; Orsini, F.; et al. Supplementary LED Interlighting Improves Yield and Precocity of Greenhouse Tomatoes in the Mediterranean. Agronomy 2020, 10, 1002. [Google Scholar] [CrossRef]
- Jin, W.; Urbina, J.L.; Heuvelink, E.; Marcelis, L.F.M. Adding far-red to red-blue light-emitting diode light promotes yield of lettuce at different planting densities. Front. Plant Sci. 2020, 15, 609977. [Google Scholar]
- Gommers, C.M.M.; Visser, E.J.V.; St Onge, K.R.; Voesenek, L.A.C.J.; Pierik, R. Shade tolerance: When growing tall is not an option. Trends Plant Sci. 2013, 18, 65–71. [Google Scholar] [CrossRef] [PubMed]
- De Keyser, E.; Dhooghe, E.; Christiaens, A.; Van Labeke, M.-C.; Van Huylenbroeck, J. LED light quality intensifies leaf pigmentation in ornamental pot plants. Sci. Hortic. 2019, 253, 270–275. [Google Scholar] [CrossRef]
- Li, Q.; Kubota, C. Effects of supplemental light quality on growth and phytochemicals of baby leaf lettuce. Environ. Exp. Bot. 2009, 67, 59–64. [Google Scholar] [CrossRef]
- Kim, H.-J.; Yang, T.; Choi, S.; Wang, Y.-J.; Lin, M.-Y.; Liceaga, A.M. Supplemental intracanopy far-red radiation to red LED light improves fruit quality attributes of greenhouse tomatoes. Sci. Hortic. 2020, 261, 108985. [Google Scholar] [CrossRef]
- Jeong, H.W.; Lee, H.R.; Kim, H.M.; Hwang, H.S.; Hwand, S.J. Using light quality for growth control of cucumber seedlings in closed-type plant production system. Plants 2020, 9, 639. [Google Scholar] [CrossRef]
- Baker, N.R. Chlorophyll fluorescence: A probe of photosynthesis in vivo. Annu. Rev. Plant Biol. 2008, 59, 89–113. [Google Scholar] [CrossRef] [Green Version]
- Bauerle, W.L.; Weston, D.J.; Bowden, J.D.; Dudley, J.B.; Toler, J.E. Leaf absorptance of photosynthetically active radiation in relation to chlorophyll meter estimates among woody plant species. Sci. Hortic. 2004, 101, 169–178. [Google Scholar] [CrossRef]
- Kochetova, G.V.; Belyaeva, O.V.; Gorshkova, D.S.; Vlasova, T.A.; Bassarskaya, E.M.; Zhigalova, T.V.; Avercheva, O.V. Long-term acclimation of barley photosynthetic apparatus to narrow-band red and blue light. Photosynthetica 2018, 56, 851–860. [Google Scholar] [CrossRef]
- Bergstrand, K.J.; Suthaparan, A.; Mortensen, L.M.; Gislerød, H.G. Photosynthesis in horticultural plants in relation to light quality and CO2 concentration. Eur. J. Hortic. Sci. 2016, 81, 237–242. [Google Scholar] [CrossRef]
- Ptushenkova, V.V.; Avercheva, O.V.; Bassarskaya, E.M.; Berkovich, Y.A.; Erokhin, A.N.; Smolyanina, S.O.; Zhigalova, T.V. Possible reasons of a decline in growth of Chinese cabbage under a combined narrowband red and blue light in comparison with illumination by high-pressure sodium lamp. Sci. Hortic. 2015, 194, 267–277. [Google Scholar] [CrossRef]
- Kaisera, E.B.; Weerheima, K.; Schipperb, R.; Dielemana, J.A. Partial replacement of red and blue by green light increases biomass and yield in tomato. Sci. Hortic. 2019, 249, 271–279. [Google Scholar] [CrossRef]
- Folta, K.M. Green light stimulates early stem elongation, antagonizing light-mediated growth inhibition. Plant Physiol. 2004, 135, 1407–1416. [Google Scholar] [CrossRef] [Green Version]
- Folta, K.M.; Maruhnich, S.A. Green light: A signal to slow down or stop. J. Exp. Bot. 2007, 58, 3099–3111. [Google Scholar] [CrossRef] [PubMed]
- Hogewoning, S.W.; Wientjes, E.; Douwstra, P.; Trouwborst, G.; van Ieperen, W.; Croce, R. Photosynthetic quantum yield dynamics: From photosystems to leaves. Plant Cell 2012, 24, 1921–1935. [Google Scholar] [CrossRef] [Green Version]
- Murakami, K.; Matsuda, R.; Fujiwara, K. A mathematical model of photosynthetic electron transport in response to the light spectrum based on excitation energy distributed to photosystems. Plant Cell Physiol. 2018, 59, 1643–1651. [Google Scholar] [CrossRef]
- Kusuma, P.; Swan, B.; Bugbee, B. Does Green Really Mean Go? Increasing the Fraction of Green Photons Promotes Growth of Tomato but Not Lettuce or Cucumber. Plants 2021, 10, 637. [Google Scholar] [CrossRef] [PubMed]
- Goltsev, V.N.; Kalaji, H.M.; Paunov, M.; Bąba, W.; Horaczek, T.; Mojski, J.; Kociel, H.; Allakhverdiev, S.I. Variable chlorophyll fluorescence and its use for assessing physiological condition of plant photosynthetic apparatus. Russ. J. Plant Physiol. 2016, 63, 869–893. [Google Scholar] [CrossRef]
- Chow, W.S.; Melis, A.; Anderson, J.M. Adjustments of photosystem stoichiometry in chloroplasts improve the quantum efficiency of photosynthesis. Proc. Natl. Acad. Sci. USA 1990, 87, 7502–7506. [Google Scholar] [CrossRef] [PubMed] [Green Version]
- Galka, P.; Santabarbara, S.; Khuong, T.T.H.; Degand, H.; Morsomme, P.; Jennings, R.C.; Boekema, E.J.; Caffarri, S. Functional analyses of the plant photosystem I-light-harvesting complex II supercomplex reveal that light-harvesting complex II loosely bound to photosystem II is a very efficient antenna for photosystem I in state II. Plant Cell 2012, 24, 2963–2978. [Google Scholar] [CrossRef] [Green Version]
- Schöttler, M.A.; Tóth, S.Z. Photosynthetic complex stoichiometry dynamics in higher plants: Environmental acclimation and photosynthetic flux control. Front. Plant Sci. 2014, 5, 188. [Google Scholar]
- Croce, R.; van Amerongen, H. Natural strategies for photosynthetic light harvesting. Nat. Chem. Biol. 2014, 10, 492–501. [Google Scholar] [CrossRef] [PubMed]
- Islam, M.J.; Ryu, B.R.; Azad, M.O.K.; Rahman, M.H.; Cheong, E.J.; Lim, J.-D.; Lim, Y.-S. Cannabinoids accumulation in hemp (Cannabis sativa L.) plants under LED light spectra and their discrete role as a stress marker. Biology 2021, 10, 710. [Google Scholar] [CrossRef] [PubMed]


| Parameters | Light Treatment | |||
|---|---|---|---|---|
| 1 | 2 | 3 | 4 | |
| R660 | 0% | 30% | 70% | 100% |
| FR | 100% | 70% | 30% | 0% |
| Photosynthesis at saturating light intensity, µmol CO2 m−2 s−1 | 9.0 ± 0.07 a | 8.0 ± 0.21 b | 9.28 ± 0.77 abc | 10.2 ± 0.28 c |
| Dark respiration, µmol CO2 m−2 s−1 | 0.40 ± 0.01 a | 0.48 ± 0.01 b | 0.42 ± 0.08 a | 0.49 ± 0.02 |
| Photosynthesis quantum yield, µmol CO2 m−2 s−1 µmol m−2 s−1 | 0.039 ± 0.013 a | 0.069 ± 0.12 b | 0.055 ± 0.018 ab | 0.066 ± 0.011 b |
| Light compensation point, µmol m−2 s−1 | 10.2 ± 1.0 a | 7.0 ± 0.4 b | 7.8 ± 0.5 b | 7.4 ± 0.6 b |
| Light intensity at saturation, µmol m−2 s−1 | 238 ± 21a | 124 ± 12 b | 178 ± 19 ac | 163 ± 13 c |
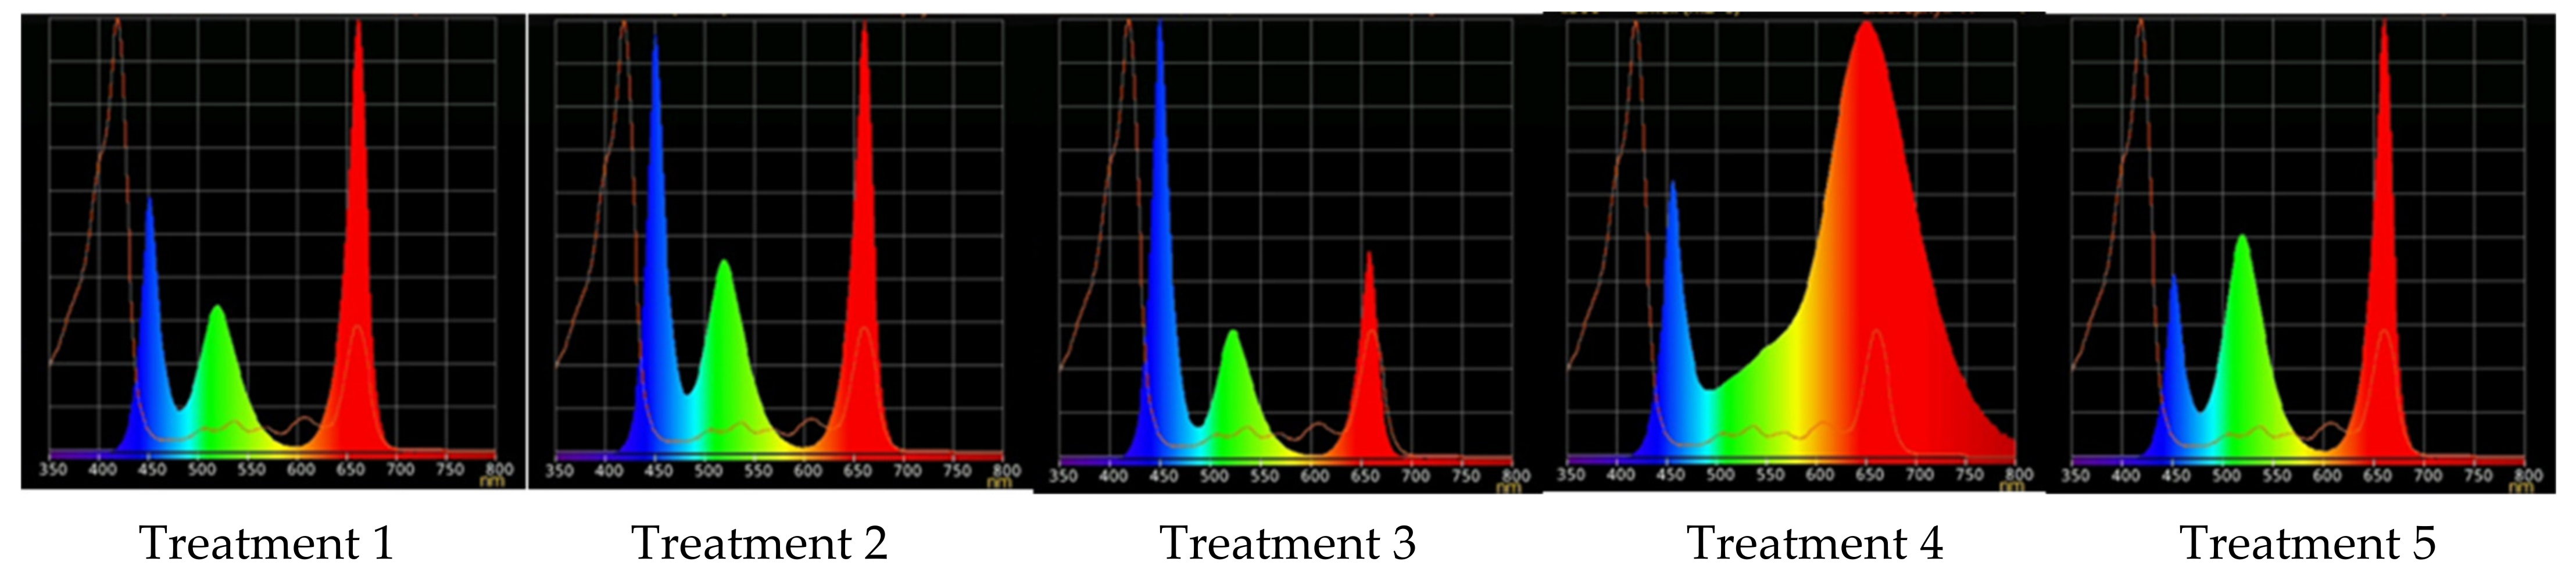
| Treatment | Red (600–700 nm) | Green (500–600 nm) | Blue (400–500 nm) |
|---|---|---|---|
| 1 | 50 | 25 | 25 |
| 2 | 37 | 26 | 37 |
| 3 | 24 | 28 | 48 |
| 4 | 63 | 16 | 21 |
| 5 | 46 | 30 | 23 |
| Parameters | Light Treatment | ||||
|---|---|---|---|---|---|
| 1 | 2 | 3 | 4 | 5 | |
| R | 50% | 37% | 24% | 63% | 46% |
| G | 25% | 26% | 28% | 16% | 30% |
| B | 25% | 37% | 48% | 21% | 23% |
| Photosynthesis at saturating light intensity, µmol CO2 m−2 s−1 | 9.3 ± 0.8 b | 9.4 ± 0.5 b | 10.2 ± 0.3 b | 5.4 ± 0.6 a | 8.4 ± 0.6 b |
| Dark respiration, µmol CO2 m−2 s−1 | 0.54 ± 0.052 a | 0.50 ± 0.055 a | 0.49 ± 0.01 a | 0.47 ± 0.046 a | 0.44 ± 0.045 a |
| Photosynthesis quantum yield, µmol CO2 m−2 s−1/ µmol m−2 s−1 | 0.047 ± 0.015 a | 0.054 ± 0.018 a | 0.066 ± 0.012 b | 0.051 ± 0.015 a | 0.052 ± 0.015 a |
| Light compensation point, µmol m−2 s−1 | 11.6 ± 0.4 c | 9.2 ± 0.5 a | 7.4 ± 0.3 b | 9.3 ± 0.3 a | 8.5 ± 0.3 a |
| Light intensity at saturation, µmol m−2 s−1 | 209 ± 17 b | 184 ± 15 b | 163 ± 15 b | 116 ± 12 a | 170 ± 14 b |
Publisher’s Note: MDPI stays neutral with regard to jurisdictional claims in published maps and institutional affiliations. |
© 2021 by the authors. Licensee MDPI, Basel, Switzerland. This article is an open access article distributed under the terms and conditions of the Creative Commons Attribution (CC BY) license (https://creativecommons.org/licenses/by/4.0/).
Share and Cite
Tarakanov, I.G.; Kosobryukhov, A.A.; Tovstyko, D.A.; Anisimov, A.A.; Shulgina, A.A.; Sleptsov, N.N.; Kalashnikova, E.A.; Vassilev, A.V.; Kirakosyan, R.N. Effects of Light Spectral Quality on the Micropropagated Raspberry Plants during Ex Vitro Adaptation. Plants 2021, 10, 2071. https://doi.org/10.3390/plants10102071
Tarakanov IG, Kosobryukhov AA, Tovstyko DA, Anisimov AA, Shulgina AA, Sleptsov NN, Kalashnikova EA, Vassilev AV, Kirakosyan RN. Effects of Light Spectral Quality on the Micropropagated Raspberry Plants during Ex Vitro Adaptation. Plants. 2021; 10(10):2071. https://doi.org/10.3390/plants10102071
Chicago/Turabian StyleTarakanov, Ivan G., Anatoly A. Kosobryukhov, Daria A. Tovstyko, Alexander A. Anisimov, Alla A. Shulgina, Nikolay N. Sleptsov, Elena A. Kalashnikova, Andon V. Vassilev, and Rima N. Kirakosyan. 2021. "Effects of Light Spectral Quality on the Micropropagated Raspberry Plants during Ex Vitro Adaptation" Plants 10, no. 10: 2071. https://doi.org/10.3390/plants10102071
APA StyleTarakanov, I. G., Kosobryukhov, A. A., Tovstyko, D. A., Anisimov, A. A., Shulgina, A. A., Sleptsov, N. N., Kalashnikova, E. A., Vassilev, A. V., & Kirakosyan, R. N. (2021). Effects of Light Spectral Quality on the Micropropagated Raspberry Plants during Ex Vitro Adaptation. Plants, 10(10), 2071. https://doi.org/10.3390/plants10102071