Visitor Flows at a Large-Scale Cultural Event: GPS Tracking at Dutch Design Week


Abstract
1. Introduction
2. Materials and Methods
2.1. Study Area
2.2. Data Collection Procedure & Sample Description
2.3. Data Processing and Analysis Methods
2.3.1. Spatial and Temporal Behavior of Visitors
2.3.2. Determinants of Intra-Event Destination Choices
3. Results
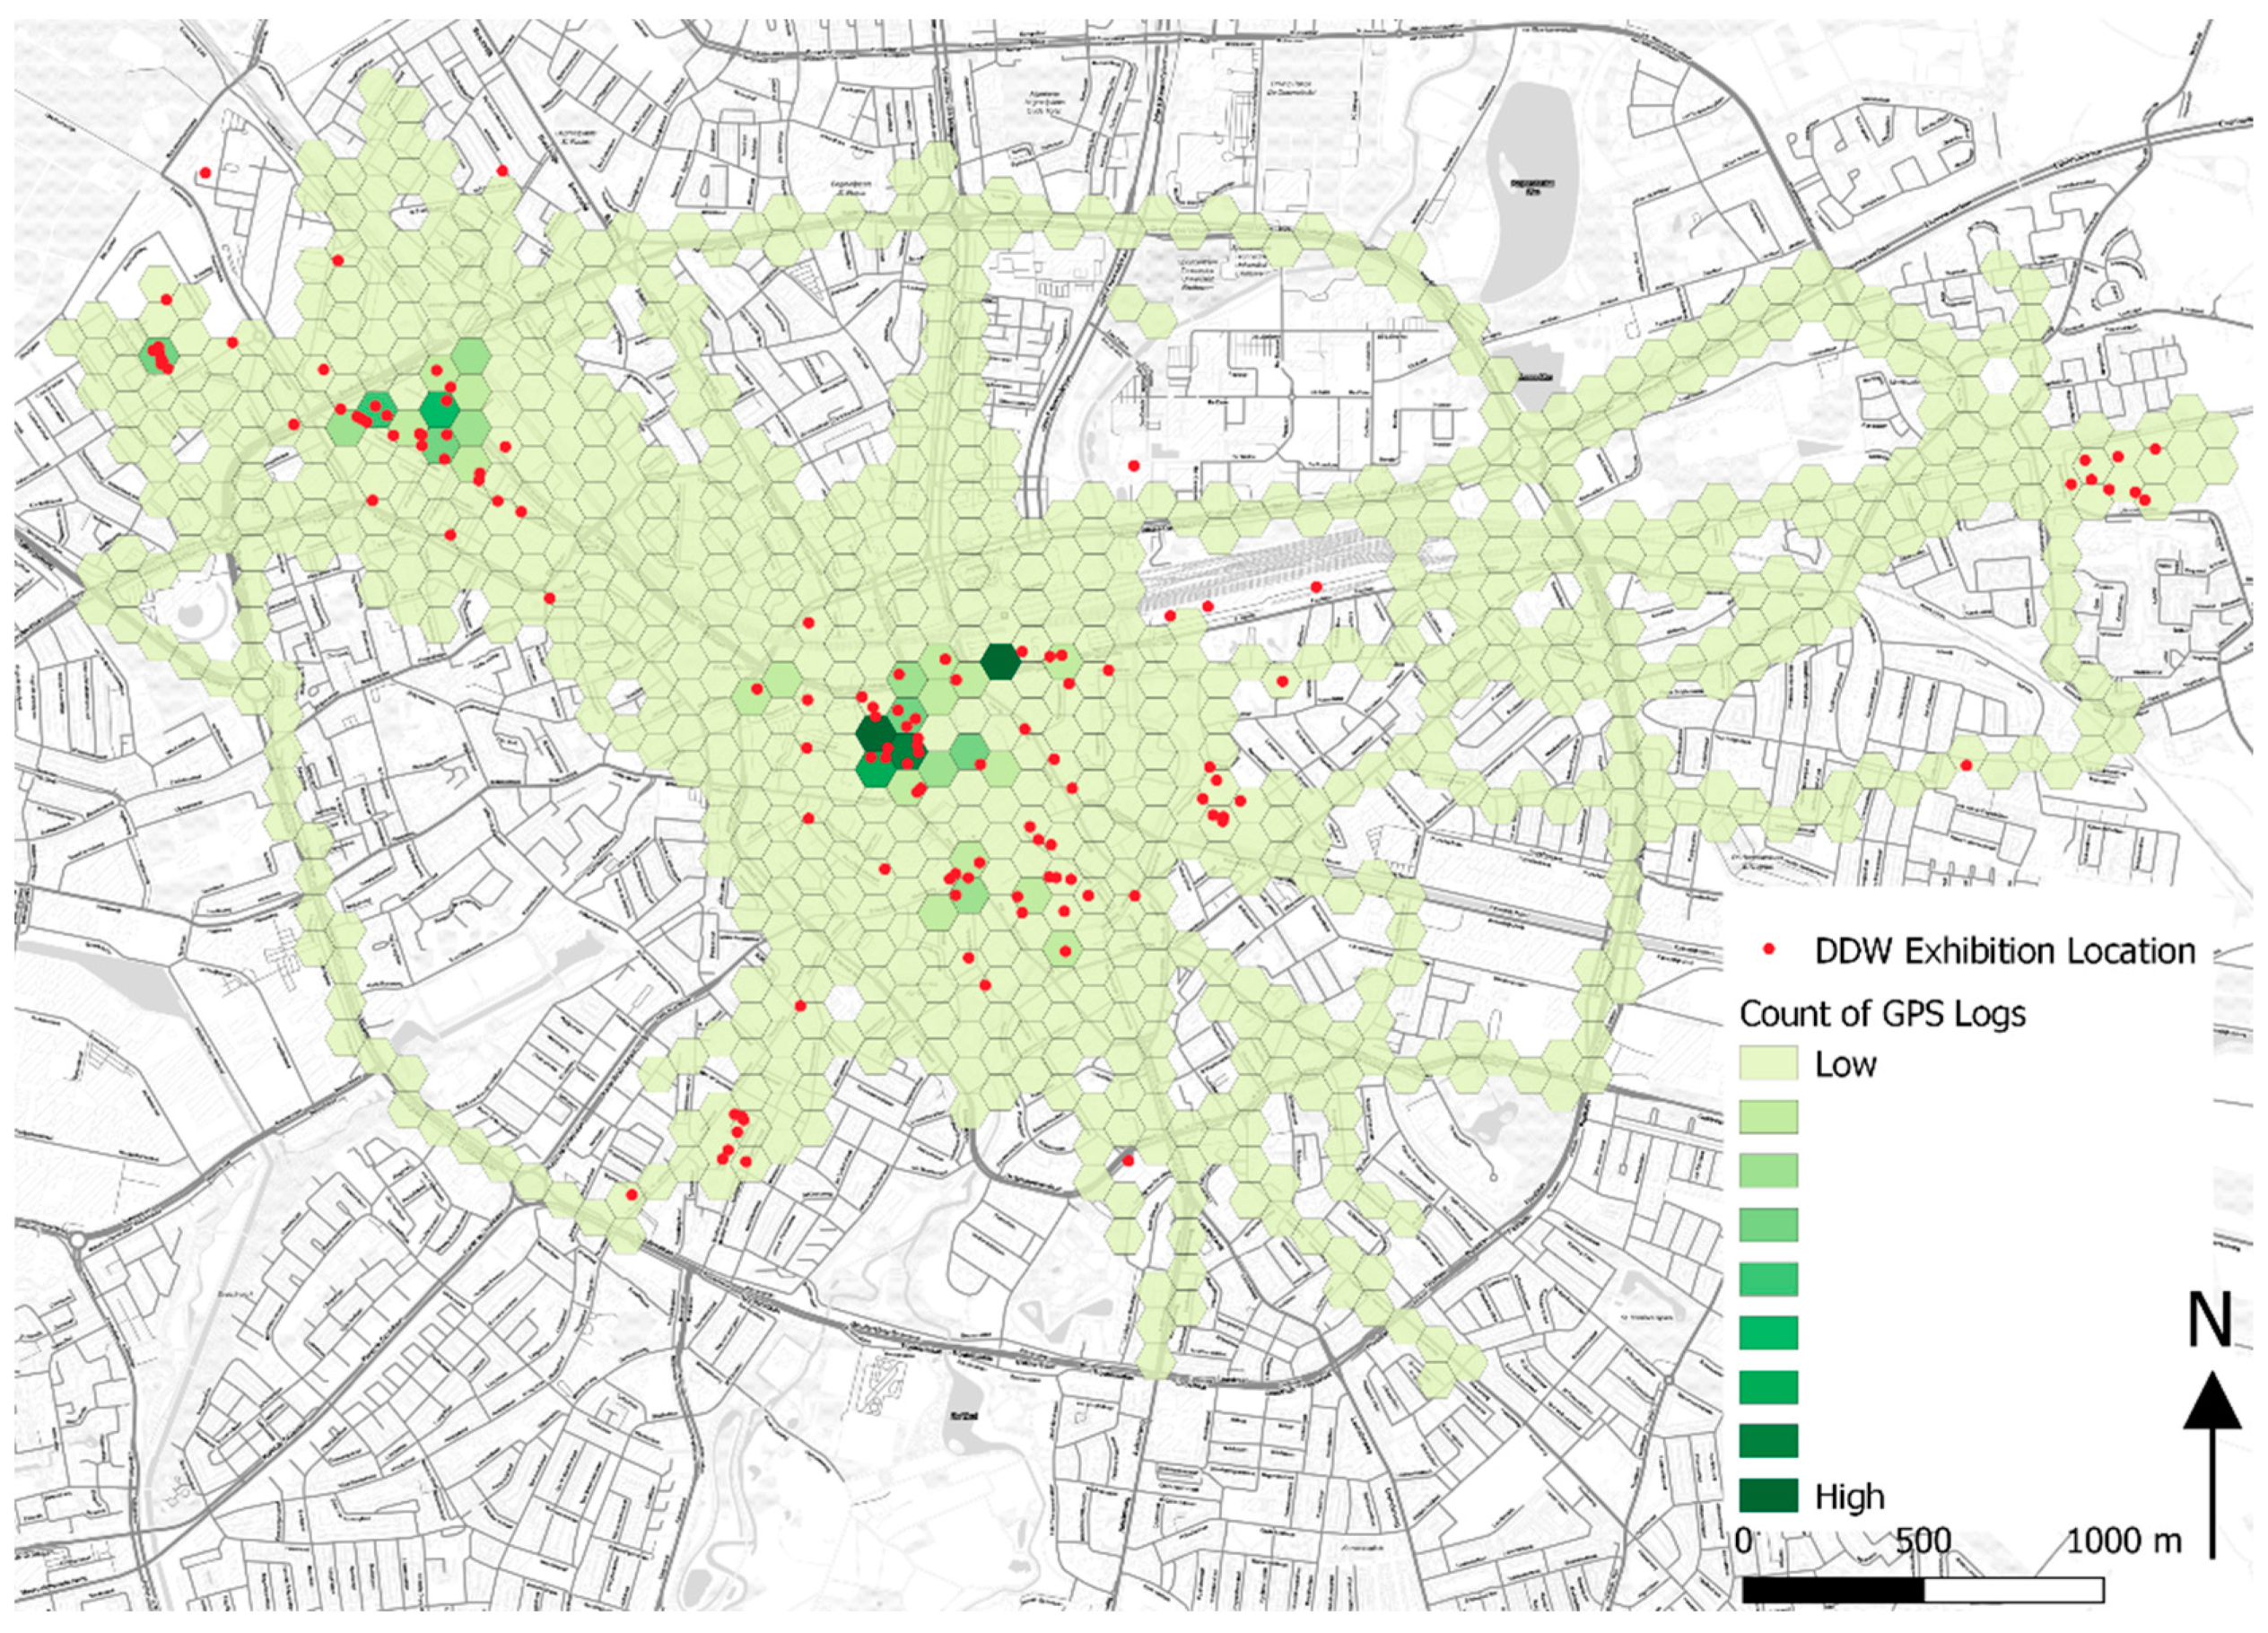
3.1. Results of Spatial and Temporal Behavior of Visitors
Network Analysis: Intra-Event Destinations and Their Relations
3.2. Results for the Determinants of Intra-Event Destination (AOI) Choices
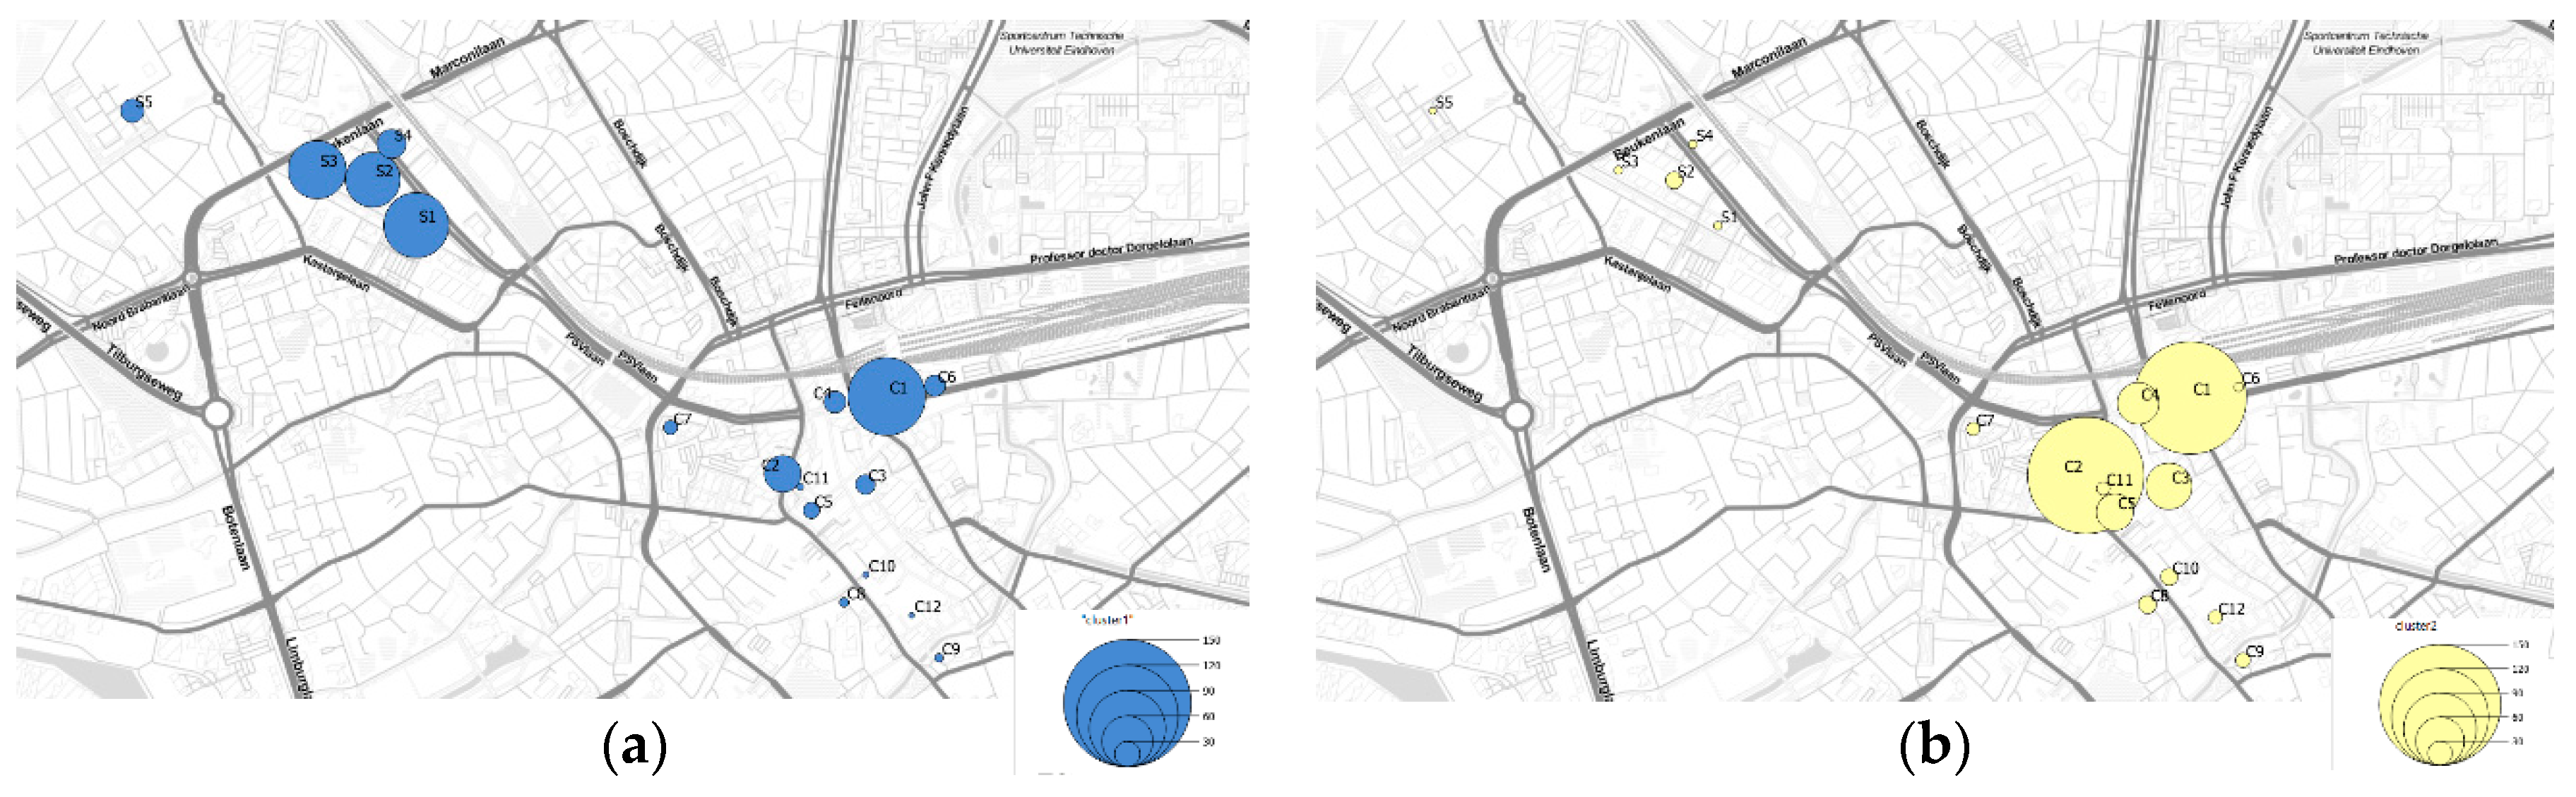
Clustering of Intra-Event Destination (AOI) Choices
4. Discussions and Conclusions
Author Contributions
Funding
Acknowledgments
Conflicts of Interest
Ethical Approval
Appendix A


| Variable | Levels | C2 | C3 | C4 | C5 | C6 | C7 | C8 | C9 | C10 | C11 | C12 | S1 | S2 | S3 | S4 | S5 | Pearson Chi-Square | |||
|---|---|---|---|---|---|---|---|---|---|---|---|---|---|---|---|---|---|---|---|---|---|
| Value | Df | Asymptotic Significance (2-Sided) | |||||||||||||||||||
| Visitor-specific variables | Gender | Female | 151 | 59 | 61 | 51 | 27 | 24 | 22 | 20 | 25 | 13 | 13 | 68 | 65 | 52 | 30 | 21 | 17.009 | 15 | 0.318 |
| Male | 80 | 36 | 27 | 23 | 15 | 12 | 14 | 10 | 7 | 15 | 13 | 45 | 40 | 44 | 19 | 18 | |||||
| Age | ≤30 years old | 168 | 69 | 65 | 52 | 28 | 29 | 22 | 25 | 19 | 18 | 17 | 81 | 73 | 59 | 38 | 19 | 23.350 | 15 | 0.077 | |
| >30 years old | 63 | 26 | 23 | 22 | 14 | 7 | 14 | 5 | 13 | 10 | 9 | 32 | 32 | 37 | 11 | 20 | |||||
| Combining Other Activities | Yes | 111 | 51 | 38 | 32 | 19 | 21 | 18 | 14 | 21 | 13 | 11 | 60 | 46 | 38 | 26 | 16 | 14.699 | 15 | 0.473 | |
| No | 120 | 44 | 50 | 42 | 23 | 15 | 18 | 16 | 11 | 15 | 15 | 53 | 59 | 58 | 23 | 23 | |||||
| Travel Company | Alone | 104 | 42 | 33 | 34 | 17 | 15 | 17 | 12 | 11 | 11 | 9 | 44 | 32 | 48 | 13 | 16 | 17.266 | 15 | 0.303 | |
| With other(s) | 127 | 53 | 55 | 40 | 25 | 21 | 19 | 18 | 21 | 17 | 17 | 69 | 73 | 48 | 36 | 23 | |||||
| Familiarity with Eindhoven | Not at all | 88 | 40 | 32 | 36 | 20 | 12 | 13 | 9 | 12 | 13 | 12 | 41 | 38 | 35 | 20 | 13 | 9.348 | 15 | 0.859 | |
| Familiar | 143 | 55 | 56 | 38 | 22 | 24 | 23 | 21 | 20 | 15 | 14 | 72 | 67 | 61 | 29 | 26 | |||||
| Familiarity with DDW | Never visited | 133 | 67 | 49 | 47 | 29 | 16 | 19 | 12 | 19 | 15 | 17 | 66 | 60 | 53 | 31 | 23 | 18.139 | 15 | 0.255 | |
| One or more times visited | 98 | 28 | 39 | 27 | 13 | 20 | 17 | 18 | 13 | 13 | 9 | 47 | 45 | 43 | 18 | 16 | |||||
| Intended Duration of Visit | ≤5 h | 85 | 29 | 42 | 27 | 21 | 6 | 11 | 8 | 13 | 13 | 6 | 43 | 43 | 36 | 15 | 15 | 22.606 | 15 | 0.093 | |
| >5 h | 146 | 66 | 46 | 47 | 21 | 30 | 25 | 22 | 19 | 15 | 20 | 70 | 62 | 60 | 34 | 24 | |||||
| Day of Visit | Weekday | 96 | 36 | 43 | 33 | 27 | 13 | 13 | 14 | 9 | 13 | 9 | 40 | 41 | 42 | 25 | 17 | 19.962 | 15 | 0.173 | |
| Weekend | 135 | 59 | 45 | 41 | 15 | 23 | 23 | 16 | 23 | 15 | 17 | 73 | 64 | 54 | 24 | 22 | |||||
| Arrival Time to the Event | Before 11:00 | 101 | 51 | 33 | 36 | 15 | 19 | 19 | 15 | 19 | 11 | 14 | 60 | 64 | 57 | 31 | 23 | 35.372 | 30 | 0.229 | |
| 11:00 to 13:00 | 76 | 27 | 36 | 23 | 17 | 13 | 11 | 11 | 6 | 11 | 6 | 31 | 25 | 25 | 12 | 11 | |||||
| After 13:00 | 54 | 17 | 19 | 15 | 10 | 4 | 6 | 4 | 7 | 6 | 6 | 22 | 16 | 14 | 6 | 5 | |||||
| AOI-specific variables | Arrival Time to the AOI | Before 13:00 | 147 | 45 | 47 | 45 | 26 | 16 | 21 | 15 | 14 | 16 | 9 | 51 | 39 | 45 | 19 | 18 | 39.178 | 15 | 0.001 |
| After 13:00 | 84 | 50 | 41 | 29 | 16 | 20 | 15 | 15 | 18 | 12 | 17 | 62 | 66 | 51 | 30 | 21 | |||||
| Duration at AOI | ≤45 min | 84 | 71 | 81 | 62 | 36 | 15 | 25 | 16 | 21 | 25 | 22 | 73 | 54 | 45 | 38 | 12 | 184.092 | 15 | 0.000 | |
| >45 min | 147 | 24 | 7 | 12 | 6 | 21 | 11 | 14 | 11 | 3 | 4 | 40 | 51 | 51 | 11 | 26 | |||||
| Occurrence of Rain | No | 153 | 61 | 45 | 49 | 27 | 23 | 24 | 19 | 27 | 17 | 14 | 77 | 57 | 52 | 28 | 23 | 22.604 | 15 | 0.093 | |
| Yes | 78 | 34 | 43 | 25 | 15 | 13 | 12 | 11 | 5 | 11 | 12 | 36 | 48 | 44 | 21 | 16 | |||||
| Temperature | ≤13.0 C | 81 | 36 | 31 | 21 | 13 | 10 | 10 | 9 | 12 | 7 | 9 | 37 | 38 | 28 | 17 | 7 | 21.750 | 30 | 0.863 | |
| 13.1 to 16.0 C | 91 | 34 | 40 | 26 | 21 | 15 | 14 | 13 | 9 | 13 | 9 | 39 | 38 | 37 | 19 | 19 | |||||
| >16.0 C | 59 | 25 | 17 | 27 | 8 | 11 | 12 | 8 | 11 | 8 | 8 | 37 | 29 | 31 | 13 | 13 | |||||
| AOI | Cluster | F | Significance | |
|---|---|---|---|---|
| Mean Square | df | |||
| C2 | 15.840 | 1 | 100.809 | 0.000 |
| C3 | 1.294 | 1 | 6.270 | 0.013 |
| C4 | 0.390 | 1 | 1.902 | 0.169 |
| C5 | 0.686 | 1 | 3.766 | 0.053 |
| C6 | 1.794 | 1 | 15.741 | 0.000 |
| C7 | 0.199 | 1 | 1.823 | 0.178 |
| C8 | 0.079 | 1 | 0.726 | 0.395 |
| C9 | 0.024 | 1 | 0.250 | 0.617 |
| C10 | 0.269 | 1 | 2.833 | 0.093 |
| C11 | 0.040 | 1 | 0.469 | 0.494 |
| C12 | 0.154 | 1 | 1.896 | 0.170 |
| S1 | 29.188 | 1 | 244.063 | 0.000 |
| S2 | 15.403 | 1 | 92.469 | 0.000 |
| S3 | 22.635 | 1 | 172.289 | 0.000 |
| S4 | 4.434 | 1 | 34.979 | 0.000 |
| S5 | 2.901 | 1 | 26.378 | 0.000 |
References
- Getz, D. Events Studies. In Theory, Research and Policy for Planned Events; Elsevier Butterworth-Heinemann: Amsterdam, The Netherlands, 2007. [Google Scholar]
- Dane, G.; Borgers, A.; Feng, T. Subjective Immediate Experiences during Large-Scale Cultural Events in Cities: A Geotagging Experiment. Sustainability 2019, 11, 5698. [Google Scholar] [CrossRef]
- Versichele, M.; Neutens, T.; Delafontaine, M.; Van de Weghe, N. The Use of Bluetooth for Analyzing Spatiotemporal Dynamics of Human Movement at Mass Events: A Case Study of the Ghent Festivities. Appl. Geogr. 2012, 32, 208–220. [Google Scholar] [CrossRef]
- Lew, A.; McKercher, B. Modeling tourist movements: A local destination analysis. Ann. Tour. Res. 2006, 33, 403–423. [Google Scholar] [CrossRef]
- Shoval, N.; Kwan, M.-P.; Reinau, K.H.; Harder, H. The shoemaker’s son always goes barefoot: Implementations of GPS and other tracking technologies for geographic research. Geoforum 2014, 51, 1–5. [Google Scholar] [CrossRef]
- Shoval, N.; Ahas, R. The use of tracking technologies in tourism research: The first decade. Tour. Geogr. 2016, 18, 587–606. [Google Scholar] [CrossRef]
- Shoval, N.; McKercher, B.; Ng, E.; Birenboim, A. Hotel location and tourist activity in cities. Ann. Tour. Res. 2011, 38, 1594–1612. [Google Scholar] [CrossRef]
- McKercher, B.; Shoval, N.; Ng, E.; Birenboim, A. First and repeat visitor behaviour: GPS tracking and GIS analysis in Hong Kong. Tour. Geogr. 2012, 14, 147–161. [Google Scholar] [CrossRef]
- De Cantis, S.; Ferrante, M.; Kahani, A.; Shoval, N. Cruise passengers’ behavior at the destination: Investigation using GPS technology. Tour. Manag. 2016, 52, 133–150. [Google Scholar] [CrossRef]
- Aranburu, I.; Plaza, B.; Esteban, M. Sustainable cultural tourism in urban destinations: Does space matter? Sustainability 2016, 8, 699. [Google Scholar] [CrossRef]
- Sugimoto, K.; Ota, K.; Suzuki, S. Visitor Mobility and Spatial Structure in a Local Urban Tourism Destination: GPS Tracking and Network analysis. Sustainability 2019, 11, 919. [Google Scholar] [CrossRef]
- Birenboim, A.; Anton-Clavé, S.; Russo, A.P.; Shoval, N. Temporal Activity Patterns of Theme Park Visitors. Tour. Geogr. 2013, 15, 601–619. [Google Scholar] [CrossRef]
- Birenboim, A.; Reinau, K.H.; Shoval, N.; Harder, H. High-Resolution Measurement and Analysis of Visitor Experiences in Time and Space: The Case of Aalborg Zoo in Denmark. Prof. Geogr. 2015, 67, 620–629. [Google Scholar] [CrossRef]
- East, D.; Osborne, P.; Kemp, S.; Woodfine, T. Combining GPS & survey data improves understanding of visitor behaviour. Tour. Manag. 2017, 61, 307–320. [Google Scholar]
- Pettersson, R.; Getz, D. Event Experiences in Time and Space: A Study of Visitors to the 2007 World Alpine Ski Championships in Åre, Sweden. Scand. J. Hosp. Tour. 2009, 9, 308–326. [Google Scholar] [CrossRef]
- Pettersson, R.; Zillinger, M. Time and Space in Event Behavior: Tracking Visitors by GPS. Tour. Geogr. 2011, 13, 1–20. [Google Scholar] [CrossRef]
- Zakrisson, I.; Zillinger, M. Emotions in motion: Tourist experiences in time and space. Curr. Issues Tour. 2012, 15, 505–523. [Google Scholar] [CrossRef]
- Nilbe, K.; Ahas, R.; Silm, S. Evaluating the Travel Distances of Events Visitors and Regular Visitors Using Mobile Positioning Data: The Case of Estonia. J. Urban Technol. 2014, 21, 91–107. [Google Scholar] [CrossRef]
- Gong, V.X.; Daamen, W.; Bozzon, A.; Hoogendoorn, S.P. Crowd characterization for crowd management using social media data in city events. Travel Behav. Soc. 2020, 20, 192–212. [Google Scholar] [CrossRef]
- Teigland, J. Impacts on Tourism from Mega-Events: The Case of the Winter Olympic Games; Western Norway Research Institute: Sogndal, Norway, 1996. [Google Scholar]
- Bohlin, M. Travelling to Events. In Evaluation of Events: Scandinavian Experiences; Mossberg, L.L., Ed.; Cognizant Communication Corporation: New York, NY, USA; Sydney, Australia; Tokyo, Japan, 2000; pp. 13–29. [Google Scholar]
- Lane, N.D.; Eisenman, S.B.; Musolesi, M.; Miluzzo, E.; Campbell, A.T. Urban sensing systems: Opportunistic or participatory? In Proceedings of the 9th Workshop on Mobile Computing Systems and Applications, Napa Valley, CA, USA, 25 February 2008; pp. 11–16. [Google Scholar]
- Dutch Design Week Eindhoven, Dutch Design Week 2017 Stretched the World. Available online: https://www.ddw.nl/en/press/press-archive/146/dutch-design-week-2017-stretched-the-world (accessed on 22 February 2019).
- Feng, T.; Timmermans, H.J.P. Transportation mode recognition using GPS and accelerometer data. Transp. Res. Part C 2013, 37, 118–130. [Google Scholar] [CrossRef]
- Feng, T.; Timmermans, H.J.P. Map matching of GPS data with Bayesian belief networks. J. E. Asia Soc. Transp. Stud. 2013, 10, 100–112. [Google Scholar]
- Feng, T.; Timmermans, H.J.P. Detecting activity type from GPS traces using spatial and temporal information. Eur. J. Transp. Infrast. 2015, 15, 662–674. [Google Scholar]
- Feng, T.; Timmermans, H.J.P. Extracting activity-travel diaries from GPS data: Towards integrated semi-automatic imputation. Procedia Environ. Sci. 2014, 22, 178–185. [Google Scholar] [CrossRef][Green Version]
- Dane, G.; Feng, T.; Luub, F.; Arentze, T. Route Choice Decisions of E-bike Users: Analysis of GPS Tracking Data in the Netherlands. In Geospatial Technologies for Local and Regional Development; Kyriakidis, P., Hadjimitsis, D., Skarlatos, D., Mansourian, A., Eds.; AGILE 2019; Lecture Notes in Geoinformation and Cartography; Springer: Cham, Switzerland, 2020. [Google Scholar] [CrossRef]
- Lohmann, M.; Hübner, A. Tourist behavior and weather: Understanding the role of preferences, expectations and in-situ adaptation. Mondes Tour 2013, 8, 44–59. [Google Scholar] [CrossRef]
- McKercher, B.; Shoval, N.; Park, E.; Kahani, A. The [limited] impact of weather on tourist behavior in an urban destination. J. Travel Res. 2015, 54, 442–455. [Google Scholar] [CrossRef]
- Shih, H.Y. Network characteristics of drive tourism destinations: An application of network analysis in tourism. Tour Manag. 2006, 27, 1029–1039. [Google Scholar] [CrossRef]
- Wasserman, S.; Faust, K. Social Network Analysis: Methods and Application; Cambridge University Press: Cambridge, UK, 1994. [Google Scholar]
- Freeman, L.C. Centrality in social network: I. Conceptual clarification. Soc. Netw. 1979, 1, 215–239. [Google Scholar] [CrossRef]
- Freeman, L.C. The gatekeeper, pair-dependency, and structural centrality. Qual. Quant. 1980, 14, 585–592. [Google Scholar] [CrossRef]
- Scott, J. Social Network Analysis: A Handbook; Sage Publications: London, UK, 2000. [Google Scholar]
- Degenne, A.; Forse, M. Introducing Social Networks; Sage Publications: London, UK, 1999. [Google Scholar]
- Hansen, D.; Shneiderman, B.; Smith, M.A.; Himelboim, I. Analyzing Social Media Networks with NodeXL: Insights from a Connected World, 2nd ed.; Morgan Kaufmann Publications: Boston, MA, USA, 2020. [Google Scholar]
- Ruhnau, B. Eigenvector centrality a node centrality? Soc. Netw. 2000, 22, 357–365. [Google Scholar] [CrossRef]
- Na, S.; Xumin, L.; Yong, G. Research on k-means Clustering Algorithm: An Improved k-means Clustering Algorithm. In Proceedings of the Third International Symposium on Intelligent Information Technology and Security Informatics, Jinggangshan, China, 2 April 2010; pp. 63–67. [Google Scholar] [CrossRef]
- Fränti, P.; Sieranoja, S. How much can k-means be improved by using better initialization and repeats? Pattern Recognit. 2019, 93, 95–112. [Google Scholar] [CrossRef]


| Variable | Levels | Frequency | Percentage |
|---|---|---|---|
| Gender | female | 175 | 62 |
| male | 106 | 38 | |
| Age | ≤30 years old | 201 | 72 |
| >30 years old | 80 | 28 | |
| Combining other activities | yes | 148 | 53 |
| no | 133 | 47 | |
| Travel company | alone | 119 | 42 |
| with other(s) | 162 | 58 | |
| Familiarity with Eindhoven | not at all | 101 | 36 |
| familiar | 180 | 64 | |
| Familiarity with DDW | never visited | 157 | 56 |
| one or more times visited | 124 | 44 | |
| Intended duration of visit | ≤5 h | 112 | 40 |
| >5 h | 169 | 60 | |
| Day of visit | weekday | 124 | 44 |
| weekend | 157 | 56 | |
| Arrival time | before 11:00 | 115 | 41 |
| 11:00 to 13:00 | 91 | 32 | |
| after 13:00 | 75 | 27 |
| AOI Name | Code | Area | % of Visits | Average Duration | Standard Deviation of Duration |
|---|---|---|---|---|---|
| Central Station | C1 | Central | 33% | 20 | 55.17 |
| Design Academy | C2 | Central | 14% | 76 | 58.48 |
| Market Square | C3 | Central | 6% | 34 | 37.70 |
| 18 Septemberplein | C4 | Central | 5% | 18 | 16.96 |
| Rembrandt Bioscoop | C5 | Central | 4% | 26 | 30.99 |
| Café A | C6 | Central | 3% | 29 | 51.59 |
| Temporary Art Centre | C7 | Central | 2% | 59 | 41.92 |
| Het Klein Theater | C8 | Central | 2% | 50 | 48.24 |
| Van Abbe Museum | C9 | Central | 2% | 51 | 30.51 |
| Popocatepetl | C10 | Central | 2% | 40 | 41.53 |
| Philips Museum | C11 | Central | 2% | 25 | 39.70 |
| Stadhuisplein | C12 | Central | 2% | 26 | 19.36 |
| Apparaten Fabriek | S1 | Strijp-S | 7% | 54 | 66.41 |
| Machinekamer | S2 | Strijp-S | 6% | 60 | 56.41 |
| Beukenlaan | S3 | Strijp-S | 6% | 66 | 51.09 |
| Klokgebouw | S4 | Strijp-S | 3% | 36 | 35.91 |
| Piet Hein Eik | S5 | Strijp-S | 2% | 71 | 48.64 |
| AOI Code | Degree | Betweenness | Closeness | Eigenvector |
|---|---|---|---|---|
| C1 | 34 | 10.908 | 1.000 | 1.000 |
| C2 | 33 | 8.865 | 1.000 | 0.935 |
| C3 | 31 | 9.331 | 0.842 | 1.000 |
| C4 | 26 | 4.904 | 0.889 | 0.738 |
| C5 | 29 | 5.753 | 0.889 | 0.838 |
| C6 | 19 | 1.323 | 0.727 | 0.553 |
| C7 | 19 | 1.228 | 0.727 | 0.579 |
| C8 | 21 | 2.421 | 0.727 | 0.683 |
| C9 | 22 | 3.124 | 0.842 | 0.559 |
| C10 | 23 | 2.382 | 0.762 | 0.653 |
| C11 | 20 | 2.678 | 0.800 | 0.535 |
| C12 | 19 | 1.914 | 0.727 | 0.550 |
| S1 | 27 | 3.690 | 0.762 | 0.902 |
| S2 | 28 | 5.236 | 0.800 | 0.882 |
| S3 | 26 | 5.321 | 0.842 | 0.728 |
| S4 | 22 | 1.547 | 0.640 | 0.815 |
| S5 | 19 | 1.376 | 0.667 | 0.672 |
| Variables | Levels | Cluster 1 | Cluster 2 | Pearson Chi-Square | ||
|---|---|---|---|---|---|---|
| Value | df | Asymptotic Significance (2-sided) | ||||
| Gender | Female | 69 (60.0%) | 106 (63.9%) | 0.430 | 1 | 0.512 |
| Male | 46 (40.0%) | 60 (36.1%) | ||||
| Age | ≤30 years old | 79 (68.7%) | 122 (73.5%) | 0.768 | 1 | 0.381 |
| >30 years old | 36 (31.3%) | 44 (26.5%) | ||||
| Combining Other Activities | Yes | 58 (50.4%) | 90 (54.2%) | 0.390 | 1 | 0.532 |
| No | 57 (42.9%) | 76 (45.8%) | ||||
| Travel Company | Alone | 46 (40.0%) | 73(44.0%) | 0.440 | 1 | 0.507 |
| With other(s) | 69 (60.0%) | 93 (56.0%) | ||||
| Familiarity with Eindhoven | Not at all | 41 (35.7%) | 60 (36.1%) | 0.007 | 1 | 0.933 |
| Familiar | 74 (64.3%) | 106 (63.9%) | ||||
| Familiarity with DDW | Never visited | 63 (54.8%) | 94 (56.6%) | 0.094 | 1 | 0.760 |
| One or more times visited | 52 (45.2%) | 72 (43.4%) | ||||
| Intended Duration of Visit | ≤5 h | 45 (38.6%) | 67 (40.4%) | 0.088 | 1 | 0.767 |
| >5 h | 70 (61.4%) | 99 (59.6%) | ||||
| Day of Visit | Weekday | 48 (41.7%) | 76 (45.8%) | 0.451 | 1 | 0.502 |
| Weekend | 67 (42.7%) | 90 (54.2%) | ||||
| Arrival Time | Before 11:00 | 61 (53.0%) | 54 (32.5%) | 12.403 | 1 | 0.002 |
| 11:00 to 13:00 | 32 (27.8%) | 59 (35.5%) | ||||
| After 13:00 | 22 (19.1%) | 53 (31.9%) | ||||
Publisher’s Note: MDPI stays neutral with regard to jurisdictional claims in published maps and institutional affiliations. |
© 2020 by the authors. Licensee MDPI, Basel, Switzerland. This article is an open access article distributed under the terms and conditions of the Creative Commons Attribution (CC BY) license (http://creativecommons.org/licenses/by/4.0/).
Share and Cite
Dane, G.; Borgers, A.; Kaya, D.I.; Feng, T. Visitor Flows at a Large-Scale Cultural Event: GPS Tracking at Dutch Design Week. ISPRS Int. J. Geo-Inf. 2020, 9, 661. https://doi.org/10.3390/ijgi9110661
Dane G, Borgers A, Kaya DI, Feng T. Visitor Flows at a Large-Scale Cultural Event: GPS Tracking at Dutch Design Week. ISPRS International Journal of Geo-Information. 2020; 9(11):661. https://doi.org/10.3390/ijgi9110661
Chicago/Turabian StyleDane, Gamze, Aloys Borgers, Deniz Ikiz Kaya, and Tao Feng. 2020. "Visitor Flows at a Large-Scale Cultural Event: GPS Tracking at Dutch Design Week" ISPRS International Journal of Geo-Information 9, no. 11: 661. https://doi.org/10.3390/ijgi9110661
APA StyleDane, G., Borgers, A., Kaya, D. I., & Feng, T. (2020). Visitor Flows at a Large-Scale Cultural Event: GPS Tracking at Dutch Design Week. ISPRS International Journal of Geo-Information, 9(11), 661. https://doi.org/10.3390/ijgi9110661