Abstract
The impacts of earthquakes and secondary disasters on ecosystems and the environment are attracting increasing global attention. Development of uncertainty reasoning models offers a chance to research these complex correlations. The primary aim of this research was to construct a disaster chain hazard assessment model that combines a Bayesian Network model and the ArcGIS program software for Changbai Mountain, China, an active volcano with a spate of reported earthquakes, collapses, and landslide events. Furthermore, the probability obtained by the Bayesian Networks was used to determine the disaster chain probability and hazard intensity of the earthquake events, while ArcGIS was used to produce the disaster chain hazard map. The performance of the Bayesian Network model was measured by error rate and scoring rules. The confirmation of the outcomes of the disaster chain hazard assessment model shows that the model demonstrated good predictive performance on the basis of the area under the curve, which was 0.7929. From visual inspection of the produced earthquake disaster chain hazard map, highly hazardous zones are located within a 15 km radius from the Tianchi center, while the northern and the western parts of the studied area are characterized mainly by “very low” to “low” hazard values.
1. Introduction
A disaster chain is the phenomenon by which a series of secondary disasters is induced by some kind of primary disaster that forms a complex disaster transmission and amplification process [1,2]. There are currently three disaster chain taxonomies: Disaster chain classification based on disaster type, disaster chain space-time structure, and disaster system element [3]. For example, Shi divided disaster chain into typhoon-rainstorm disaster chain, cold wave disaster chain, dry disaster chain, and earthquake disaster chain based on disaster type [4]. Guo divided disaster chain into causal chains, homologous chains, mutually-exclusive chains, and even row chains based on disaster chain space-time structure [5]. Since the end of the 20th century, there has been frequent disaster chain incidents reported domestically and abroad. In 2003, a heat wave in central Europe was reported as the “hottest since 1500”. The increase in temperature led to an increase in respiratory diseases and mortality rates [6]. In 2004, the Indian Ocean earthquake and tsunami killed more than 223,000 people [7]. In 2005, Hurricane Katrina caused the most hurricane-related damage and deaths recorded in the United States because of secondary disasters that included storm surges and floods [8]. In 2008, Wenchuan earthquakes and secondary collapses, landslides, and debris flow disasters caused a huge number of casualties and large economic losses in China [9]. In 2009, landslide occurred in the eastern mountain of the Tianchi waterfall, resulted in 30,000m3 deposits volume, and then induced the occurrence of debris flow disaster and caused 1.8 million economic losses. Because various disaster events display a continuous chain-structured evolutionary trend, the damage and impact caused by the entire disaster chain were far greater and farther-reaching than the individual disaster events. Frequently, disaster events have shown that for every major disaster that occurs, a series of secondary disasters will always be induced, ultimately combining as a considerable destructive power.
Earthquake disasters play a significant role in the structure and function of many world ecosystems. For example, the effects of the Chile earthquake in 2010 and the Japan earthquake in 2011 have revealed that nuclear power plants exposed to extreme events can lead to a series of disasters such as nuclear radiation leaks, tsunami, and fire, which have had an unprecedented impact on the countries in question [10]. For many years now, the performance of disaster chains induced by earthquake has been a relevant topic [11,12]. Study of earthquake disasters and subsequent secondary disasters has increased the research focus on the spatial distribution and risk of earthquake disaster chains in human and natural ecosystems [13,14]. A multitude of financial losses, building damage, and casualties have resulted from earthquake-induced secondary disasters, such as collapses, landslides, debris flows, barrier lakes, floods, and fires. Liu [15] proposed that the complex interrelationships between earthquake-induced secondary disasters and natural ecosystems should be identified, and then Wang [16] recommended modeling disaster chains in earthquake secondary disaster analysis and inspected the occurrence of secondary disasters. Tian [17] summarized a series of earthquake-induced secondary disasters types and the earthquake disaster chain mechanism, while Fan [18] presented a comprehensive discussion on early warning systems and assessment of secondary disasters. Chen [19] proposed a method named Spatio-temporal evolution process Multi-level description Framework for a Disaster Chain (STMFDC) to evaluate complex disaster chain. Zhang and Zhou [20] put forward a conceptual model of disaster chain risk assessment and Chen [21] assessed the earthquake secondary disaster risk through the information model in Wenchuan, China. Furthermore, Julijana [22] assessed the hazard and risk of the earthquake-landslide disaster chain based on the Newmark model and the geographic information system (GIS).
In contrast to the research methods presented above, earthquake disaster chain probability has hardly attracted any research efforts. There are many existing methods of probability reasoning, fuzzy logic, neural networking, expert systems and so on [23,24,25], but the existing models cannot adequately describe the earthquake disaster chain structures and probability. Bayesian Networks (BNs) can address this shortcoming owing to their capability to combine the probabilistic methodology with clear diagrams that encrypt the causality between variables. BN models can also offer a frame for dealing with uncertainty and complexity in earthquake disaster chain systems [26]. The existing BN models mainly focus on a single event in the field of natural disasters [27,28,29], but Qiu [30] expanded the use of BNs to emergency event chains and applied the method to the analysis of the typhoon–rainstorm–flood disaster chain. Because the principle governing the behavior of strong earthquakes is more complicated than that of typhoons, strong earthquakes induce more extensive secondary disasters. It is therefore very important to apply BN model in earthquake disaster chain hazard assessment.
In this research, we collect field survey data and remote sensing interpretation data of the studied area and, referring to Wenchuan earthquake disaster chain types and the studied area’s topography and geomorphology, select the earthquake-collapse-landslide-debris flow disaster chain as the research subject. According to disaster risk theory, we construct a hazard assessment model based on BNs and ArcGIS software, quantitatively evaluate the hazard of earthquake disaster chains, map the hazard zoning map, and provide reference for early warning and prevention of disaster chain. BNs are used to model the structure and probability of disaster chains, predicting the occurrence probability and scale of disaster events, and ArcGIS was introduced to draw the hazard zoning map. A flow diagram summarizing the methodology followed in this research is given in Figure 1.
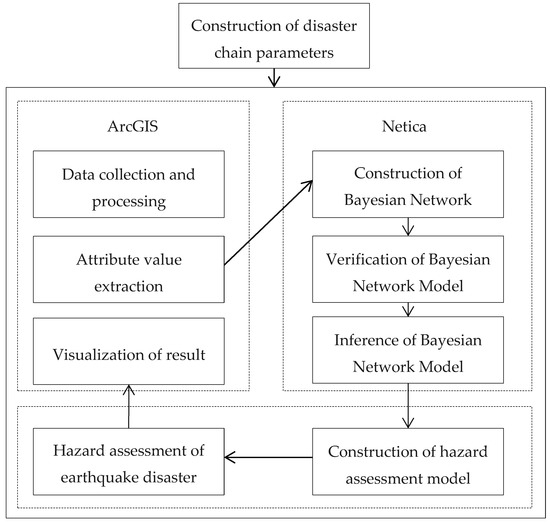
Figure 1.
The flow diagram showing the methodology applied.
2. Areas of Study
Changbai Mountain is situated south-east of Jilin Province in China and has a total area of approximately 3278 km2. The topography and geomorphology of the area is highly complex, and there are numerous large mountains and rivers distributed throughout the region. The elevations range from 2678 m to 725 m, slopes range from 59.31◦ to 0◦, and many regions have slopes greater than 35◦. As a result, some regions exhibit topography and geomorphology that are conducive to the occurrence of geological disasters with high frequency, and strong, sudden destructive characteristics. In recent years, collapses and landslides continue to occur in Changbai Mountain North Slope tourist areas. According to the statistics, there were 119 cases of geological disasters, including collapses, landslides, and debris flow.
The Changbai Mountain volcanic structure is highly developed, and there is intense underground magma activity due to the adjacent eastern deep seismic zone. The monthly frequency of earthquake activity according to volcanic earthquake monitoring data is shown in Figure 2. Before June 2002, the volcanic earthquake frequency was less than 20 per month, with lower reported magnitudes, and weak volcanic activity; after July 2002, the volcanic activity showed a significant increase, reaching a peak in 2003. Since then, the trend has gradually stabilized at this higher level. It is believed that once Changbai Mountain volcano erupts again in the future, volcanic earthquake disasters and their secondary disaster chains will have more serious effect. In 1991, the Mount Pinatubo volcano erupted, and the largest associated earthquake magnitude was 5.6 [31]. Based on this, it is predicted that the largest associated earthquake magnitude will be 6.0 when Changbai Mountain volcano erupts in the future, according to the intensity attenuation formula for eastern China [32,33,34,35]:
where I is earthquake intensity, Ms is the earthquake magnitude, and R is the epicentral distance.
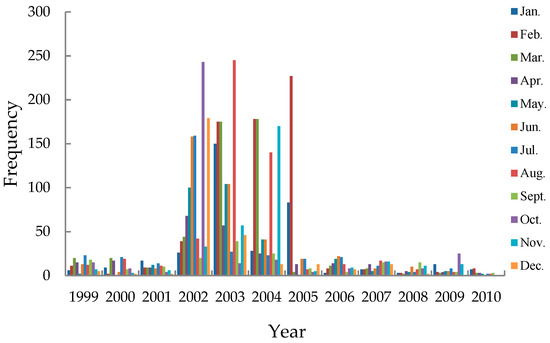
Figure 2.
Frequency of volcanic earthquakes from 1999 to 2010 in the Changbai Mountain region.
The intensity within the radius of R = 40.11 km is 6 degrees, the minimum intensity of geological disaster occurrence considered. Therefore, establishing Tianchi as the center, the Changbai Mountain area with a radius of 40.11 km is selected as the area of study, as shown in Figure 3.
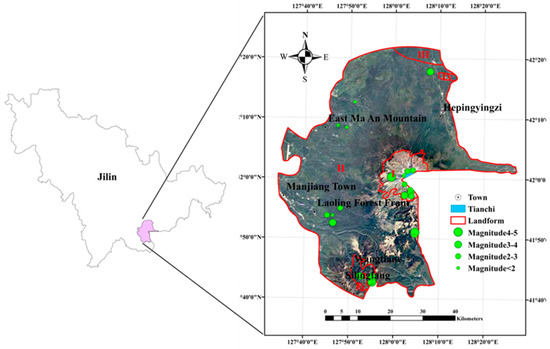
Figure 3.
Topographic features, epicenter, and magnitude distribution of the studied area. (Topographic features: volcanic cone (I), lava platform (II); melted tableland (III); tectonic and denudated low mountains (IV)).
3. Method
3.1. System Components of the Volcanic Earthquake-Collapse-Landslide-Debris Flow Disaster Chain
The disaster itself is defined as the Earth’s surface variation system composed of the disaster environment, the hazard factor and the disaster body; thus, the disaster is the outcome of the elements’ coactions in the system [36]. According to system theory, each disaster event in the earthquake disaster chain is also considered as a system, and various factors related to the event can be divided into the following three types.
Input element: Input elements refer to the extrinsic factors that can lead to a change in an earthquake disaster chain sub-event’s intrinsic states [37]. The input element incorporates anomalous substances, energy, and information from the extrinsic environment, which will influence the disaster chain events status and result in the occurrence of additional sub-events.
State element: These describe the nature and characteristics of an earthquake disaster chain system at a particular time, with the key elements representing the behavioral characteristics, describing the destruction ability of the earthquake disaster chain systems, and influencing the kind and number of the disaster bodies [37]. Each event has a trigger state to indicate whether the event occurred, when the state of some key events exceeds a certain threshold value, the event is categorized in the “occurrence”.
Output element: Some system elements affect the external environments and lead to a change of the internal state of the earthquake disaster system, as well as some environment state.
According to the relation of variables of collapses, landslides, and debris flows [38,39], the input elements, state elements, and output elements of the earthquake-collapse-landslide-debris flow disaster chain are listed in Table 1.

Table 1.
Variables of earthquake-collapse-landslides-debris flow disaster chains.
3.2. Data Collection and Processing
The monitoring of geological disasters in the Jilin Province is done using SPOT5 satellite data (with a resolution of 2.5 meters in the panchromatic range, and a resolution of 15 meters in the multispectral band) and the latest Landsat8 satellite data (with a resolution of 15 meters in the panchromatic range, and a resolution of 30 meters in the multispectral band) combined to create a 2.5-m-resolution color image map. A total of 360 disaster points were selected for Jilin Province, that were obtained from the visual interpretation of remote sensing data; the dataset containing these points was divided into training (n = 300) and verification (n = 60) sets. A digital elevation model (DEM) was extracted from a 1:50,000 topographic map prepared in 2016 by the Jilin Institute of Geological Environment Monitoring (JIGEM), from which the elevation, slope, and slope aspect parameters were obtained. The lithology map was digitized from 1:200,000 geological maps. To establish the distance to the river, drainage lines were digitized from a drainage line distribution dataset with a 1:250,000 scale. The average annual precipitation map was prepared by JIGEM. These maps are shown in Figure 4.
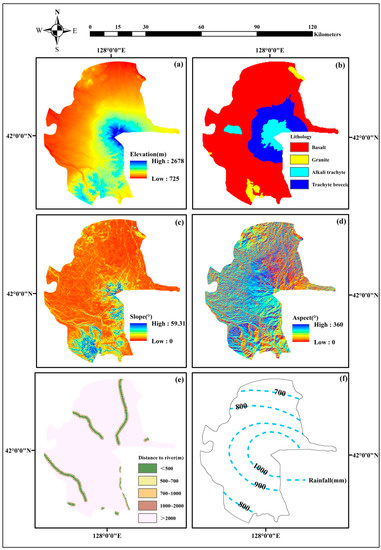
Figure 4.
Topographic and climate condition parameters: Elevation (a), lithology (b), slope (c), aspect (d), distance to river (e), precipitation (f).
3.3. Construction and Validation of BNs Model
The BN model is supported by a graphical network representing cause and effect relationships between different factors considered in a study [40]. The qualitative component of a BN is a directed acyclic graph (DAG), in which nodes and directed links (“edges”) signify system variables and their causal dependencies [41]. In this paper, the occurrence and evolutionary process of the disaster chain is deconstructed as the interactions between every disaster event indicated by the input elements, state elements, and output elements. In individual disaster events, the input element determines the state element that then influences other state elements, which would lead to the particular event results; output element. In the disaster chain, the state element and output element of primary disaster affect the input element, state elements, and output element of secondary disaster. On the basis of a three-layer structural model of earthquake, collapse, landslide, and debris flow disaster events, all input elements, state elements, and output elements were considered as nodes, and the relationships between the three elements were considered edges in the BN model. The resultant BN model of the earthquake-collapse-landslide-debris flow disaster chain is shown in Figure 5. Error rate and scoring rules were used to validate the accuracy of the BN model for use in hazard assessment models. The scoring rules used extensively were the logarithmic loss, quadratic loss, and spherical payoff that could be obtained using the Netica software. For logarithmic loss (0–∞) and quadratic loss (0–2), scores close to zero indicate that the model is sufficiently accurate whilst for spherical payoff (0–1), scores equal to 1 indicate the best model performance [42]. In this study, there were 300 cases used for learning though the Gradient technique in the Netica software and 60 cases were used for verification. The error rate and scoring rule results are shown in Table 2. The error rate of collapse, landslide, and debris flow nodes was 0, the area under the receiver operating characteristic (ROC) curve was 1, and the error rate of the collapse area, landslide area, and debris flow area nodes was 20%, suggesting that the model could correctly predict the majority of disaster event occurrence. The scoring rule consequences of collapse, landslide, and debris flow events show remarkable model performance and the model is able to obtain the occurrence probability of disaster events, while the scoring rule results of collapse area and landslide area nodes prove the model’s excellent predictive capability. In summary, the BN model performance of the earthquake-collapse-landslide-debris flow chain is sufficiently good enough that the model can be applied in the hazard assessment model of earthquake disaster chains.
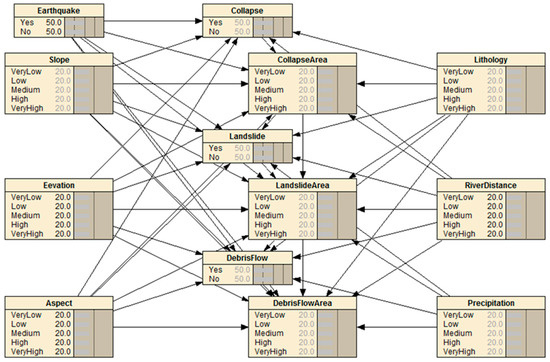
Figure 5.
Bayesian Network (BN) model of the earthquake-collapse-landslide-debris flow disaster chain.
Table 2.
Confusion matrix and performance of the BNs model.
3.4. Hazard Assessment Model of Earthquake Disaster Chain
Wang [43] regards disaster events in the disaster chain as “nodes” in the context of system engineering, and the connections between disaster events are correspondingly identified as “edges”, consistent with the BN model’s formulation. In this study, the probability of the edges and the losses of nodes were considered in the hazard assessment model of the earthquake disaster chain. It is important to consider the chain probability between disaster events and the hazard intensity of an individual disaster event. The probability of the edges (chain probability) is the possibility that secondary disasters will be induced by a primary disaster. The loss of the node (hazard intensity) is the degree of destruction to the disaster environment and the secondary disaster. We consider the hazard evaluation of the earthquake disaster chain in terms of chain probability and hazard intensity. The edge probabilities between the near disasters were determined by the influence on the secondary disaster, depending on the state element and output element of the primary disaster. The losses of the nodes were determined by the state element of disaster events, and obtained, like the edge probability, from BN inference. The hazard of the overall earthquake disaster chain is the sum of every disaster event hazard and the product of occurrence probability and hazard intensity. Therefore, the hazard assessment model of the earthquake disaster chain is constructed as shown in Equation (2):
where R is the hazard of the overall disaster chain, P1 and H1 are the hazard factor probability and hazard intensity of the chain source, respectively; Pi(i+1) is the induced probability that the (i+1)th disaster event is induced by the ith disaster event, and Hi+1 is the hazard intensity of the (i+1)th disaster event, i = 1, 2, 3, …, n.
It is assumed that the magnitude of the earthquake induced by volcanic eruptions is 6.0 and the earthquake intensity of the studied area is also 6.0; therefore, the hazard factor probability and hazard intensity of the chain source is 1. The hazard intensity of an individual disaster event is defined by Equation (3):
where S0 is the disaster event occurrence area and S is the total area of each grid cell.
3.5. Hazard Assessment of Earthquake Disaster Chain
The entire area of study is divided into 1 km × 1 km grid cells; the total number of grid cells is 2847, and all attribute values (elevation, slope, aspect, lithology, distance to river, average annual precipitation) of each cell center-point were extracted by the spatial analyst tools in the ArcGIS software. The total grid cell data were converted into case file format and input to the BN model in the Netica software so the occurrence probability of collapse, landslide, and debris flow disaster events and the scale of the collapse area, landslide area, and debris flow area nodes of each grid cell could be obtained from inference of the BN model.
The BN model’s total grid cell output results were converted into ArcGIS file format, according to the natural space classification method that maintains the consistency of the category. The raster reclassification tool in ArcGIS spatial analysis was used to classify the earthquake disaster chain hazard map into five subzones corresponding to the evaluation factor grade assignment: Very high hazard areas, high hazard areas, medium hazard areas, low hazard areas, and very low hazard areas. The probability and hazard intensity of collapse, landslide and debris flow disasters are shown in Figure 6, and the earthquake disaster chain hazard zoning map of the studied area as obtained by ArcGIS is shown in Figure 7.
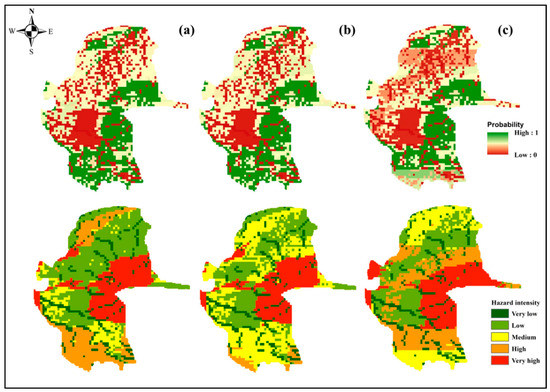
Figure 6.
Probability and hazard intensity zoning map in the Changbai Mountain region. Collapse (a), landslide (b), debris flow (c).
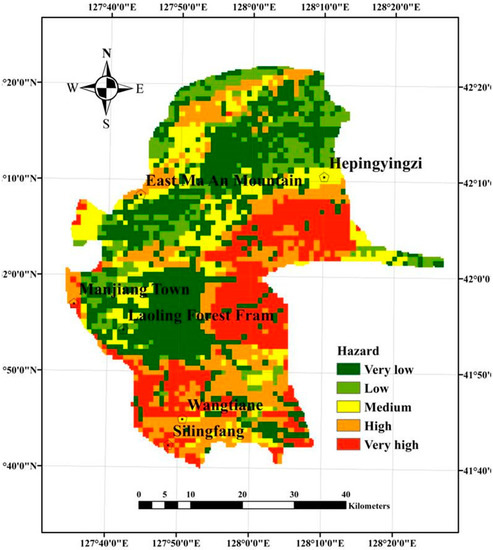
Figure 7.
Earthquake disaster chain hazard zoning map in the Changbai Mountain region.
4. Results and Discussions
Following the hazard assessment model described with the methodology, the hazard zoning map of the Changbai Mountain earthquake disaster chain was obtained on the basis of the BN model and ArcGIS. In disaster risk theory, BNs are used to obtain the chain probability and hazard intensity of disaster chain sub-events, while the ArcGIS program was introduced to produce the hazard zoning map. As a result, the quantitative hazard assessment of the disaster chain was successfully achieved. The specific results and discussions are as follows.
4.1. Comparative Analysis of the Hazard Map
Figure 6 illustrates the probability and hazard intensity of collapses, landslides, and debris flows derived from the BN based on Netica software. From the visualization analysis of the probability map, it can be seen that the occurrence probability of disaster events indicates approximately the same trend. From collapse to debris flow, the probability of disaster decreased in the northern and western region of the studied area, mainly because of the variation in rainfall. From the areas of very high hazard intensity located around the Tianchi, it is obvious that the spatial mode of the hazard intensity follows the distribution of the slope and elevation observed in the Changbai Mountain region. The other hazard intensity classifications differ due to common effects of topographic factors and occurrence probability.
Figure 7 shows the earthquake-collapse-landslide-debris flow disaster chain hazard zoning map that was constructed according to the disaster chain hazard assessment model. From visual analysis of the earthquake disaster chain hazard map, it seems to fit the trend of elevation and slope. Zones of very high hazard are predominantly located within a 15-km radius of Tianchi, with a distribution area accounting for approximately a fifth of the total studied area. The high-hazard zones are situated in the southern region of the studied area. While the northern and the western regions of the studied area mainly contain very low-to-low hazard values, the distribution area in this case accounts for approximately half of the total studied area. According to this analysis of the earthquake disaster chain hazard zone, it is evident that the spatial trend of the earthquake disaster chain hazard zone follows the distribution of elevation and slope. The interrelations between the lithological coverage and the earthquake disaster chain hazard values are also noted. More importantly, regarding the development of the disaster chain, the favorable terrain for collapses to be induced by earthquakes was that with high elevation and slope, with their occurrence directly leading to a change in the surrounding disaster environment and an increase of hazard factors, which led to landslides and even full disaster chains in certain geological environments. The southern region of the studied area with very high elevation and slope is characterized by high hazard values, of which the probable reason is that there is low annual average precipitation in this region compared with the Tianchi center. Minimal rainfall is seen to significantly limit the occurrence of landslides and debris flows, which is consistent with the results of previous research [44,45]. From this analysis, it can also be concluded that the distance of the region to the river was not a critical factor in the hazard assessment of the earthquake disaster chain.
4.2. Test of Hazard Assessment Results
To determine the accuracy of the disaster chain hazard assessment models applied in the study, two validation methods, the relative operating characteristics (ROC) and seed cell area index (SCAI), were used. According to the ROC methodology, the accuracy of the model was validated by correctly estimating the occurrence or non-occurrence of disaster chains based on the training and verification datasets. The area under the ROC curve (AUC) is used to represent the accuracy of the assessment method, with values ranging from 0.5 to 1.0, which indicates an inaccurate method and a perfectly accurate method, respectively [46]. Figure 8 presents the AUC that shows the accuracy of the model’s quantitative evaluation results. The test results show that the ROC curve of the disaster chain hazard evaluation result is evidently convex, indicating that the number of disaster chain in areas of very high hazard and high hazard is greater, and that the accuracy of disaster chain hazard evaluation results is sufficiently high. The AUC value is 79.29%, meaning that the accuracy of quantitatively measuring the disaster chain evaluation results is 79.29%.
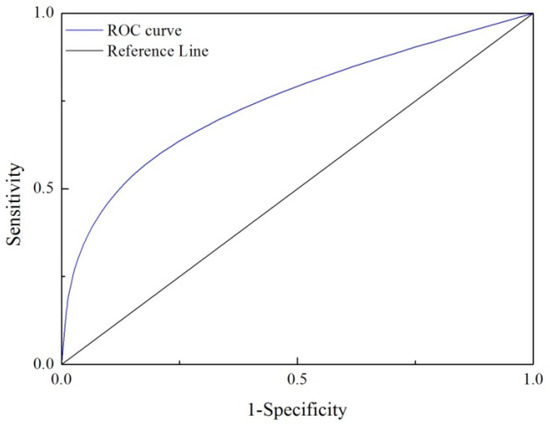
Figure 8.
Receiver operating characteristic (ROC) rate of the hazard results.
The disaster chain hazard assessment results were also verified by applying the SCAI method, which shows the density of disaster chains among the classes put forward by Suzen and Doyuran [47]. The logic behind the SCAI method lies in the correct classification of seed cells within a very conservative areal extent. The high- and very high-susceptibility classes should have a very small SCAI value while low- and very low-susceptibility classes should have higher SCAI values. In the context of this study, the hazard area proportions are divided by the disaster chain seed cell proportions in order to obtain the SCAI density of disaster chains for the different classes (Table 3). The SCAI values reveal that the produced maps are similarly accurate because the higher hazard classes do exhibit lower SCAI values, whereas the lower hazard classes yield higher SCAI values.
Table 3.
The densities of disaster chain among the disaster chain hazard classes for hazard assessment model.
5. Conclusions
Collapses, landslides, and debris flows have always been a primary focus of geological disaster scholars. This study presented a volcanic earthquake disaster chain hazard assessment model in which the BN model was used for determining the chain probability and hazard intensity in the disaster risk assessment elements while ArcGIS was used to produce the earthquake disaster chain hazard zoning maps. Specifically, the BN model was applied in order to determine the occurrence probability for every pair of adjacent disaster events and hazard intensity of individual disaster events. The development of the methodology was carried out in the Changbai Mountain region, China, on the basis of the disaster chain hazard assessment model and analysis of disaster chain sub-events with a three-layer structure. According to the hazard assessment results of this research, the BN model demonstrated satisfactory performance of disaster chain probability prediction, through the evaluation of error rate and scoring rules. From visual inspection of the produced earthquake disaster chain hazard maps, the very high hazard zones are mainly located within the 15-km radius focus on the Tianchi, the high hazard zones are located in the southern region of the studied area, while the northern and western parts of the studied area mainly feature very low-to-low hazard values. The areas of medium hazard values are sporadically distributed over the entire studied area. The AUC value of the volcanic earthquake-collapse- landslide-debris flow disaster chain hazard assessment model is 0.7929, indicating that the model is not yet perfected; the author intends to improve the accuracy through this research in the future.
Author Contributions
All authors contributed significantly to this manuscript. Jiquan Zhang was responsible for the original idea and the theoretical aspects of the paper. Qing Ma and Si Alu were responsible for the data collection and preprocessing, Yichen Zhang and Qiuling Lang were responsible for the methodology design, and Lina Han drafted the manuscript and all authors read and revised the final manuscript.
Funding
This work was supported by: “13 Five-Year” Plan for Science & Technology Support (2018YFC1508804); The Key Scientific and Technology Program of Jilin Province (20170204035SF); The Key Scientific and Technology Research and Development Program of Jilin Province (20180201033SF); The Key Scientific and Technology Research and Development Program of Jilin Province (20180201035SF); and The program of introducing talents of discipline to universities (B16011).
Acknowledgments
The authors are grateful to the anonymous reviewers for their insightful and helpful comments to improve the manuscript.
Conflicts of Interest
The authors declare no conflicts of interest.
References
- Shi, P.J. Theory and practice of disaster study. J. Nanjing Univ. 1991, 37–42. [Google Scholar]
- Shi, P.J. Theory and practice of disaster study. J. Nat. Disasters 1996, 5, 8–19. [Google Scholar]
- Ha, S.; Zhang, J.Q.; Tong, S.Q.; Li, S.J. Progress and prospect of the research on disaster chain. J. Catastrophol. 2016, 31, 131–138. [Google Scholar]
- Shi, P.J. Theory on disaster science and disaster dynamics. J. Nat. Disasters 2002, 11, 1–9. [Google Scholar]
- Guo, Z.J.; Qin, B.Y. Brief discussion on disaster physics. J. Catastrophol. 1987, 2, 25–33. [Google Scholar]
- Katrin, S.; Manuela, S.; Hdoeurf, U. Mortality during heat waves 2003–2015 in Frankfurt-Main–the 2003 heat wave and its implications. Int. J. Hyg. Environ. Health. 2018, 221, 81–86. [Google Scholar] [CrossRef]
- Syamsidik, S.; Suppasri, A. Tsunami recovery processes after the 2004 Indian Ocean tsunami and the 2011 Great East Japan Earthquake and Tsunami: Lessons learned and challenges. Int. J. Disaster Risk Reduct. 2018, 29, 1–2. [Google Scholar] [CrossRef]
- Shi, P.J.; Li, N.; Ye, Q.; Dong, W.J.; Han, G.Y.; Fang, W.H. Research on Integrated Disaster Risk Governance in the Context of Global Environmental Change. Int. J. Disaster Risk Sci. 2010, 1, 17–23. [Google Scholar] [CrossRef]
- Chen, Y.; Hu, J.P.; Peng, F. Seismological challenges in earthquake hazard reductions: Reflections on the 2008 Wenchuan earthquake. Sci. Bull. 2018, 63, 1159–1166. [Google Scholar] [CrossRef]
- George, M.; Filippo, G. Seismic assessment of small modular reactors: NuScale case study for the 8.8 Mw earthquake in Chile. Nucl. Eng. Des. 2019, 342, 176–204. [Google Scholar] [CrossRef]
- Zhang, L.M.; Zhang, S.; Huang, R.Q. Multi-hazard scenarios and consequences in Beichuan, China: The first five years after the 2008 Wenchuan earthquake. Eng. Geol. 2014, 180, 4–20. [Google Scholar] [CrossRef]
- Pei, R.R.; Ni, Z.Q.; Meng, Z.B.; Zhang, B.L.; Geng, Y.Y. Cause Analysis of the Secondary Mountain Disaster Chain in Wenchuan Earthquake. Am. J. Civ. Eng. 2017, 5, 414–417. [Google Scholar] [CrossRef]
- Huang, R.Q.; Xu, Q.; Huo, J.J. Mechanism and geo-mechanics models of landslides triggered by 5.12 Wenchuan Earthquake. J. Mt. Sci. 2011, 8, 200–210. [Google Scholar] [CrossRef]
- Xu, Q.; Zhang, S.; Li, W.L. Spatial distribution of large-scale landslides induced by the 5.12 Wenchuan earthquakes. J. Mt. Sci. 2011, 8, 246–260. [Google Scholar] [CrossRef]
- Liu, W.; He, S.M. Dynamic simulation of a mountain disaster chain: Landslides, barrier lakes, and outburst floods. Nat. Hazards 2018, 90, 757–775. [Google Scholar] [CrossRef]
- Wang, R.D. Huaxian strong earthquake infrequent secondary disaster chain, caused by the earthquake, in the world—Talk from engineering ground condition of the three counties: Ronghe, Puzhou and Chaoyi. Earthq. Res. Shanxi 2006, 2, 6–18. [Google Scholar]
- Tian, B.W.; Wang, L.; Koike, K.; Fan, J.R. Analysis and assessment of earthquake-induced secondary mountain disaster chains based on multi-platform remote sensing. In Proceedings of the IEEE international Geoscience and Remote Sensing Symposium, Honolulu, HI, USA, 25–30 July 2010; pp. 1214–1217. [Google Scholar]
- Fan, X.M.; Xu, Q.; Gianvito, S. Brief communication: Post-seismic landslides, the tough lesson of a catastrophe. Nat. Hazards Earth Syst. Sci. 2018, 18, 397–403. [Google Scholar] [CrossRef]
- Chen, Y.J.; Zhang, J.; Zhou, A.C.; Yin, B. A modeling method for a disaster chain-Taking the coal mining subsidence chain as an example. Hum. Ecol. Risk Assess. 2018, 24, 1388–1408. [Google Scholar] [CrossRef]
- Zhang, W.X.; Zhou, H.J. Conceptual model of disaster chain risk assessment: Taking Wenchuan Earthquake on 12 May 2008 as a case. Prog. Geogr. 2013, 32, 130–138. [Google Scholar]
- Chen, J.; Chen, R.C.; Li, W.C. Risk Assessment of Secondary Geologic Hazard Induced by Earthquake Disaster-Stricken Areas. Chim. OGGII-Chem. Today 2018, 36, 1323–1324. [Google Scholar]
- Julijana, B.; Vlatko, S.; Christophe, B. Hazard and risk assessment of earthquake-induced landslides-case study. Landslides 2018, 15, 161–171. [Google Scholar] [CrossRef]
- Pourghasemi, H.R.; Moradi, H.R.; Aghda, S.M.F.; Gokceoglu, C.; Pradhan, B. GIS-based landslide susceptibility mapping with probabilistic likelihood ratio and spatial multi-criteria evaluation models (North of Tehran, Iran). Arab. J. Geosci. 2014, 7, 1857–1878. [Google Scholar] [CrossRef]
- Chen, Z.G.; Song, J.; Yang, Y.P. Similarity Measurement of Metadata of Geospatial Data: An Artificial Neural Network Approach. ISPRS Int. Geo-Inf. 2018, 7, 90. [Google Scholar] [CrossRef]
- Chalkias, C.; Ferentinou, M.; Polykretis, C. GIS Supported Landslide Susceptibility Modeling at Regional Scale: An Expert-Based Fuzzy Weighting Method. ISPRS Int. Geo-Inf. 2014, 3, 523–539. [Google Scholar] [CrossRef]
- Wang, J.X.; Gu, X.Y.; Huang, T.R. Using Bayesian networks in analyzing powerful earthquake disaster chains. Nat. Hazards 2013, 68, 509–527. [Google Scholar] [CrossRef]
- Greˆt-Regamey, A.; Straub, D. Spatially explicit avalanche risk assessment linking Bayesian networks to a GIS. Nat. Hazards Earth Syst. Sci. 2006, 6, 911–926. [Google Scholar] [CrossRef]
- Blaser, L.; Ohrnberger, M.; Riggelsen, C.; Babeyko, A.; Scherbaum, F. Bayesian networks for tsunami early warning. Geophys. J. Int. 2011, 185, 1431–1443. [Google Scholar] [CrossRef]
- Ozdemir, A. Landslide susceptibility mapping using Bayesian approach in the Sultan Mountains (AkAYehir, Turkey). Nat. Hazards 2011, 59, 1573–1607. [Google Scholar] [CrossRef]
- Qiu, J.N.; Wang, Z.Q.; Ye, X.; Liu, L.L.; Dong, L.L. Modeling method of cascading crisis events based on merging Bayesian Network. Decis. Support Syst. 2014, 62, 94–105. [Google Scholar] [CrossRef]
- Rosanna, S.; Christopher, R.J.K. Forecasting eruptions after long repose intervals from accelerating rates of rock fracture: The June 1991 eruption of Mount Pinatubo, Philippines. J. Volcanol. Geotherm. Res. 2010, 191, 129–136. [Google Scholar] [CrossRef]
- Wang, C. The Research of Seismic Influence Filed and Intensity Attenuation. Master’s Thesis, Southwest JiaoTong University, Chengdu, China, 2014. [Google Scholar]
- Shen, W.H.; Zhong, Q.; Shi, B.P. Synthetic seismic intensity for historic earthquakes in the North China Plain: Implications for the regional seismic hazard. Nat. Hazards 2014, 74, 305–323. [Google Scholar] [CrossRef]
- Cui, X.; Miao, Q.J.; Wang, J.P. Model of the Seismic Intensity Attenuation for North China. North China Earthq. Sci. 2010, 28, 18–21. [Google Scholar]
- Zhang, Y.; Ma, G.; Shi, B.; Zhang, J.; Yang, Y. Development of seismic intensity attenuation model in North China and its application to quantitative estimation of earthquake location and magnitude. Acta Seismol. Sin. 2009, 3, 290–306. [Google Scholar]
- Di Baldassarre, G.; Nohrstedt, D.; Mard, J.; Burchardt, S.; Albin, C. An Integrative Research Framework to Unravel the Interplay of Natural Hazards and Vulnerabilities. Earth Future 2018, 6, 305–310. [Google Scholar] [CrossRef]
- Qiu, J.N.; Liu, L.L.; Dong, L.L. Modeling method and application of emergent event chain based on Bayesian network. J. Syst. Eng. 2012, 27, 739–750. [Google Scholar]
- Tsangaratos, P.; Ilia, I.; Hong, H.Y.; Chen, W.; Xu, C. Applying Information Theory and GIS-based quantitative methods to produce landslide susceptibility maps in Nancheng County, China. Landslides 2017, 13, 1091–1111. [Google Scholar] [CrossRef]
- Akgun, A. A comparison of landslide susceptibility maps produced by logistic regression, multi-criteria decision, and likelihood ratio methods: A case study at Izmir, Turkey. Landslides 2012, 9, 93–106. [Google Scholar] [CrossRef]
- Wang, Z.S.; Yue, Y.; Li, Q.Q.; Nie, K.; Yu, C.B. Analysis of the Spatial Variation of Network-Constrained Phenomena Represented by a Link Attribute Using a Hierarchical Bayesian Model. ISPRS Int. Geo-Inf. 2017, 6. [Google Scholar] [CrossRef]
- Hosack, G.R.; Hayes, K.R.; Dambacher, J.M. Assessing model structure uncertainty through an analysis of system feedback and Bayesian networks. Ecol. Appl. 2008, 18, 1070–1082. [Google Scholar] [CrossRef] [PubMed]
- Wisdom, M.D. A Bayesian belief network analysis of factors influencing wildfire occurrence in Swaziland. Enviorn. Model. Softw. 2010, 25, 199–208. [Google Scholar] [CrossRef]
- Wang, X. Research on Risk Assessment of Regional Disaster Chain. Master’s Thesis, Dalian University of Technology, Dalian, China, 2011. [Google Scholar]
- Peruccacci, S.; Brunetti, M.T.; Gariano, S.L.; Melillo, M.; Rossi, M.; Guzzetti, F. Rainfall thresholds for the possible occurrence of landslides in Italy. Nat. Hazards Earth Syst. Sci. 2010, 10, 447–458. [Google Scholar] [CrossRef]
- Floris, M.; Bozzano, F. Evaluation of landslide reactivation: A modified rainfall threshold model based on historical records of rainfall and landslides. Geomorphology 2008, 94, 40–57. [Google Scholar] [CrossRef]
- Fawcett, T. An introduction to ROC analysis. Pattern Recogn. Lett. 2006, 27, 861–874. [Google Scholar] [CrossRef]
- Mehmet, L.S.; Vedat, D. A comparison of the GIS based landslide susceptibility assessment methods: Multivariate versus bivariate. Environ. Geol. 2004, 45, 665–679. [Google Scholar] [CrossRef]


© 2019 by the authors. Licensee MDPI, Basel, Switzerland. This article is an open access article distributed under the terms and conditions of the Creative Commons Attribution (CC BY) license (http://creativecommons.org/licenses/by/4.0/).