Abstract
Most traditional object detection approaches have a deficiency of features, slow detection speed, and high false-alarm rate. To solve these problems, we propose a multi-perspective convolutional neural network (Multi-PerNet) to extract remote sensing imagery features. Regions with CNN features (R-CNN) is a milestone in applying CNN method to object detection. With the help of the great feature extraction and classification performance of CNN, the transformation of object detection problem is realized by the Region Proposal method. Multi-PerNet trains a vehicle object detection model in remote sensing imagery based on Faster R-CNN. During model training, sample images and the labels are inputs, and the output is a detection model. First, Multi-PerNet extracts the feature map. Meanwhile, the area distribution and object-area aspect ratio in the sample images are obtained by k-means clustering. Then, the Faster R-CNN region proposal network generates the candidate windows based on the k-means clustering results. Features of candidate windows can be obtained by mapping candidate windows to the feature map. Finally, the candidate window and its features are inputted to the classifier to be trained to obtain the detection model. Experiment results show that the Multi-PerNet model detection accuracy is improved by 10.1% compared with the model obtained by ZF-net and 1.6% compared with the model obtained by PVANet. Moreover, the model size is reduced by 21.3%.
1. Introduction
Remote sensing object detection has been a widely pursued research topic in the field of remote sensing. It is very important for disaster monitoring, military target identification, and resource investigation and exploration [1]. As a remote-sensing-image object, the use of a vehicle is crucial for vehicle monitoring, traffic flow analysis, and vehicle tracking. With the rapid development of high-resolution satellites, research on high-resolution remote sensing images has advanced. By extracting the effective features of vehicle targets from remote sensing images with complex backgrounds, false-positives are decreased and the detection accuracy and recall rate are improved.
In optical remote-sensing image object detection, the common methods are basically divided into four categories. The first is based on boosting, which combines several weak classifiers to form a strong classifier for target detection. The second is based on the template method, which calculates the similarity of the image to be detected and the given template to achieve target detection. The third is based on statistical theory. To achieve target detection, it employs machine learning, the support vector machine (SVM), and other methods, such as random forest (RF) [2] and the backpropagation (BP) neural network [3]. Firstly, this method is mainly to extract the feature of the target by RF, backpropagation artificial neural network (BPANN), et al. Then, using the feature, the classification model can be trained by SVM. The fourth is based on segmentation technology [4]. It mainly identifies the background and target object by setting different thresholds for different objects, such as application of the multi-threshold and Otsu threshold [5] in vehicle recognition. For the first two methods, the design of elementary features requires manual work. To this end, HARRIS [6], Scale-Invariant Feature Transform (SIFT) [7] and Histogram of Oriented Gradient (HOG) [8] are commonly used. However, it is difficult to find the features that can effectively represent the target object because features of the design can be too dependent on professional knowledge and the data themselves. Moreover, the threshold segmentation method is easily affected by the background color, which makes it difficult to obtain a set of standard thresholds. In this study, the statistical theory approach is used for target detection.
With the development of deep learning, research on object detection using a deep neural network has made advancements. By modifying Alexnet, Huang [9] designed a feature extraction network to extract ship features and train the detection model, thereby improving the ship detection accuracy. Yao [10] designed a convolution neural network with different convolution kernels to perform feature extraction; they also combined the method with the characteristics of each network for classification testing. Although this kind of method solves the problem of feature design, it does not improve the detection efficiency. It extracts the candidate window using a sliding window, and it uses SVM to classify the candidate window. Since the use of a sliding window results in a large number of redundant candidate windows, each candidate window must be identified during the detection process. It is thus time-intensive and prone to false alarms. Therefore, although such methods can improve the detection accuracy, the detection speed is too slow, the test results in a high recall rate, and the false-alarm rate is high. The key to solving this problem is to reduce the number of candidate windows.
In the field of computer vision, object detection technology has become increasingly more sophisticated. The generation of candidate windows has developed from the selective search [11] in R-CNN [12] and Fast R-CNN [13] to the region proposal network (RPN) in Faster R-CNN [14]. RPN greatly reduces the number of candidate windows and the detection process, thereby reducing the detection time. Classifiers have also evolved from SVM to softmax classifiers. In the feature extraction of candidate windows, many feature extraction networks have emerged, such as ZF-net [15] and VGG [16]. Object detection based on the Faster-RCNN framework usually maintains high accuracy, high recall, and a short detection time.
To further improve the object detection accuracy, many scholars have focused on improvement of the feature extraction network and feature extraction method. For instance, in selection of the activation function in the feature extraction network, Rectified Linear Unit (ReLU) [17] and Concatenated Rectified Linear Unit (CReLU) [18] successfully solve the problem of gradient dispersion and elimination of parameter redundancy. To solve the problem of the disappearance of gradients in deep networks, He et al. [19] proposed a deep residual network for feature extraction. Kong et al. [20] strived to obtain more abundant image features by proposing the use of so-called hyper features to improve the detection accuracy. Kim et al. [21] combined the residual network, and PVANet using CReLU and hyper features. This approach achieved the best results on an ImageNet target detection mission. In the feature extraction method, Dou et al. used back-propagation neural network (BPNN) [22] and Genetic Algorithm(GA) [23,24] to detect the disasters, and achieved greatly result.
The above feature extraction networks are all single perspectives; that is, the fixed initial perspective extracts the features of an image, and abundant features are obtained when using an adequate number of samples. However, in the field of remote sensing imagery, it is difficult to acquire a large number of training samples; thus an adequate number of features cannot be obtained. By fulfilling the need for access to features, the detection accuracy can be notably improved.
In the human visual system, objects are observed in different perspectives to distinguish the characteristics of the objects. Accordingly, learning the same object in different perspectives can solve the problem of insufficient access to features. With this consideration, and based on previous studies, a multi-view convolutional network is herein proposed to extract image features and to thereby solve the problem of feature acquisition. Meanwhile, the Faster R-CNN framework is introduced to replace the traditional sliding window with RPN to extract the candidate windows. The lower number of candidate windows solves the problem of a high false-alarm rate and slow detection speed.
2. Object Detection Based on Faster R-CNN
Faster R-CNN is a framework that uses features to perform target detection. Its basic processes include feature extraction, candidate window generation, and candidate window recognition. Firstly, the convolutional neural network is used to extract the input image features. Then, a candidate window is generated by using the region-generated network according to the extracted features and the input image. Finally, the candidate window and the feature corresponding to the candidate window are used to train the detector. The whole process is shown in Figure 1.
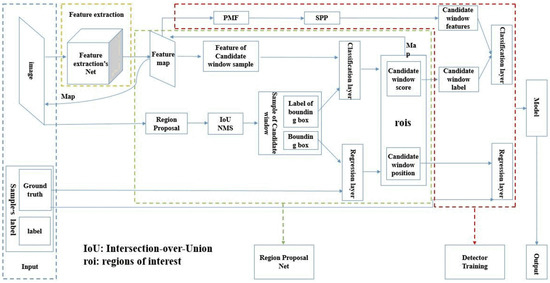
Figure 1.
Detection flow chart of Faster-RCNN (Regions with CNN features, RCNN). The inputs are images and labels. The output is a detection model containing a large number of neuron parameters. The middle section will be explained later in the article.
2.1. Region Proposal Networks
The Region Proposal Networks (RPN) is the main point of the Faster R-CNN framework. The main function of RPN is generating a candidate window according to the feature map and input image. The whole process is divided into two steps. First, each feature point on the feature map is mapped to the corresponding position of the input image. A rectangular area, called the region proposal, is drawn with the position in the input image as the center. We can then obtain a sample of the candidate window by calculating the Intersection-over-Union (IoU) between the region proposal and ground truth. Then, the sample of the candidate window and the feature points are used for supervised training. The regression layer is used to determine the location and size of the candidate window. The classification layer is employed to determine the foreground and background scores of the candidate window. The specific process is shown in Figure 2 and Figure 3.
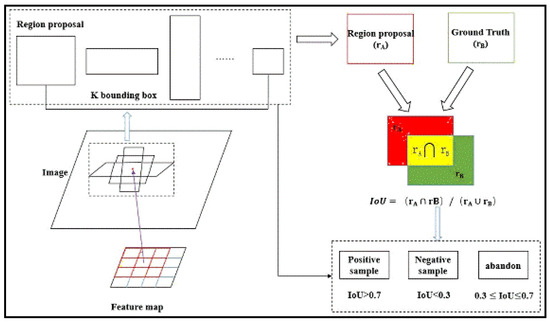
Figure 2.
Generation process of rois (region of interest, roi). The input is image. The output is regional proposals. If IoU(Intersection-over-Union) > 0.7, the region proposals will be regarded as positive samples, and if IoU < 0.3, the region proposals will be regarded as negative samples. When 0.3 < IoU ≤ 0.7, the region proposals will be abandon.
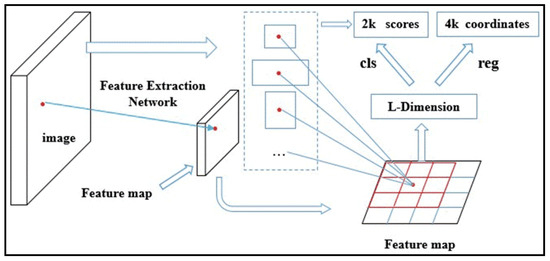
Figure 3.
Process of supervised training. The input are images and labels, the output are scores and coordinates of regional proposals. The regression layer is used to fine-tune the positions of regional proposals. The regional proposal has an object score can be obtained by the classification layer. We can obtain objects and the location of objects by regression layer and classification layer. We can get candidate window by scores and coordinates of regional proposals.
2.2. Training of the Detector
The candidate window is obtained by using the method in Section 2.1. Meanwhile, the candidate window feature can be obtained by using the correspondence between the candidate window and the feature map. However, different candidate windows have different sizes, which may result in inconsistent candidate window features. To solve this problem, spatial pyramid pooling (SPP) is used to achieve the mapping between the candidate window and the feature map (Figure 4). According to the mapping results, the corresponding features of the candidate window are obtained, and the detector model is then trained, as shown in Figure 5.
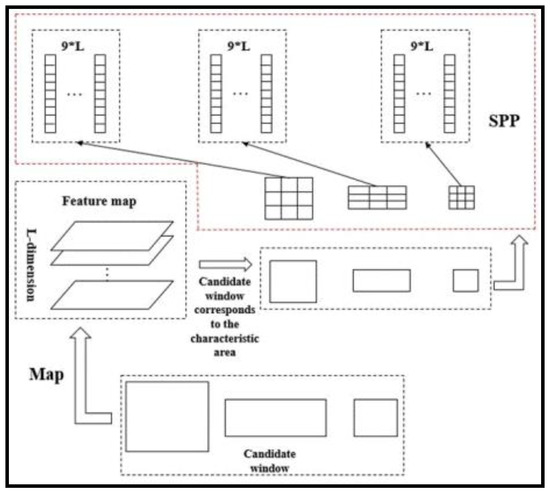
Figure 4.
Diagram of SPP. The input is a candidate window. The output is a fixed dimension feature map of candidate window.
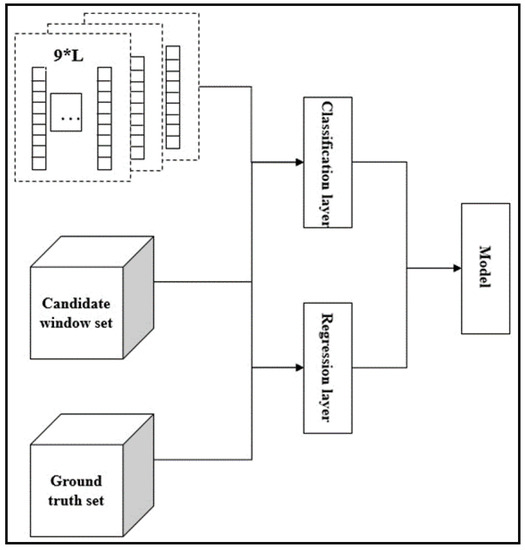
Figure 5.
Detection model process. The inputs are label, candidate window set and fixed dimension map of candidate window. The output is the detection model. The classification layer and regression layer have the same role as RPN.
3. Multi-Perspective Convolutional Neural Network
Feature extraction is an important part of the target detection process using features. Feature extraction from deep neural networks has been widely used. However, there are two key problems in extracting features of high-resolution remote sensing images using deep neural networks. One is that the targets in high-resolution remote sensing images are small and the target scale significantly changes, making positioning difficult. The second is remote sensing image training sample production, which is expensive and less training is available for it. For the first problem, we can combine the features of different convolutional layers for multi-scale parts. For the localization problem, we use k-means to cluster the target area in the sample for determining the value of K in the RPN network, and we use the specific recommended area size to enhance the accuracy of the test location. For the second problem, when considering the same object, the characteristics learned in different perspectives are different. Under the smaller data sets, the characteristics of multiple perspectives are combined to improve the obtained feature, and it will improve the accuracy of detection. So we consider the image features extracted from convolutional networks with different initial receptive fields, and we reduce the influence of the number of samples on the detection accuracy by increasing the extracted image features. Based on the above concepts, we propose a multi-perspective convolution neural network (Multi-PerNet). For a remote sensing images (that are often orthorectified), each convolutional neural network represents a perspective because of its initial convolution kernel. For example, when we scan a 28 × 28 picture with a 3 × 3 convolutional kernel, we can get a 26 × 26 feature map, but when we use 5 × 5 convolution kernel, we can get a 24 × 24 feature map. We can get different feature map from 3 × 3 convolution kernel and 5 × 5 convolution kernel. The Multi-PerNet framework is shown in Figure 6.
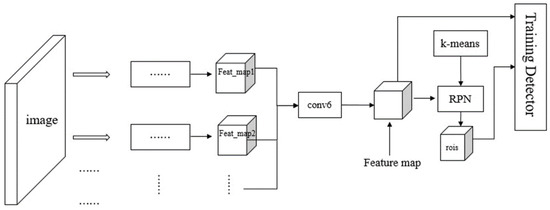
Figure 6.
Framework of Multi-PerNet.
The whole feature extraction network is divided into several branches. The sum of the branch features is convoluted to obtain the final feature map as follows:
where f(x) denotes a convolution operation on x, and Feat_mapi denotes the feature of each branch.
As distinguished from MS-CNN [25], Multi-PerNet is trained once for the classification layer and regression layer. Thus, the loss function is defined as:
Here, p(x) is the predicted probability of the candidate window being an object, y is the ground-truth label, b is a vector representing the four parameterized coordinates of the predicted candidate window, and is a vector of the ground-truth box. The function of smoothL1 is defined in [13].
3.1. Feature Extraction Network
The basic structure for each feature extraction network is shown in Figure 7. On each network, the second convolutional layer is downsampled and the results of the sampling are combined with the features extracted by the last convolutional layer to obtain Feat_map, as follows:
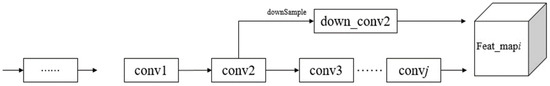
Figure 7.
The basic structure of the feature extraction network.
Here, i is branch i, and j is convolutional layer j.
Since down_conv2 is to be concatenated with convj, the sample size is constrained while downsampling conv2. The constraint is:
Here, the width is the width of the input image after the convolution operation, and the height is that of the output image.
For Multi—PerNeti, i represents the number of the basic structure of the feature extraction network.
3.2. Obtain Region Proposals
As mentioned in Section 2.1, the region network generates K region recommendations that are set to nine based on human experience in the Faster R-CNN framework for K values. We set the recommended area and aspect ratio for each region. However, the adaptability of these parameters to remote sensing images is not very strong. Therefore, we introduce k-means to process the dataset to obtain the distribution rule of the target in the dataset. In addition, we set the K value and the corresponding area and aspect ratio.
First, the scale size of each object, which includes area and aspect ratio of object, is extracted and normalized from the original data. Then, we use k-means to cluster the normalized scale. Finally, the values of centroids are selected to represent the region recommendations. In the process of k-means clustering, k = 6, k = 7, k = 8 and k = 9 are selected for the k value, respectively. The choice of K determines the size, and the size of K will determine the number of candidate windows. If K is too large, it will affect the detection efficiency. From the clustering result, when k = 8 and k = 9, the clustering effect is better, which shows that when k > 7, it has minimal effect on the clustering effect. It continues to increase the value of k, which is of minimal significance. Since k = 9 when the division is slightly smaller, the result when k = 9 is selected as the K value. The clustering result is shown in Figure 8.
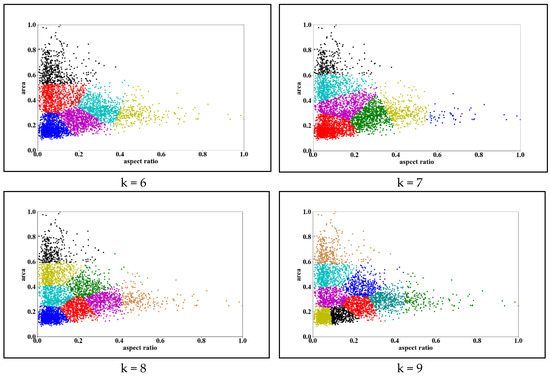
Figure 8.
Clustering results.
For the clustering result, the clustered centroid is restored according to the normalized value, and the restored value is used as the size of the candidate window scale. The centroid coordinates are shown in Table 1. In the table, the normalized area represents that of the real frame area, and the normalized aspect ratio is that of the real frame aspect ratio. The area represents the actual area of the rectangular box represented by the centroid of clustering. The area size and aspect ratio represent the actual aspect ratio of the rectangular box represented by the centroid of clustering. Based on these two values, the unique rectangular box can be determined.

Table 1.
Centroid table after area aspect ratio clustering.
First, we use the bounding boxes obtained by k-means to get the regional proposals. Then, candidate window can be obtained by using the IoU between the regional proposals and ground truth. Since the size of the cars on each image is different, we acquired 9 fixed-size bounding boxes, which can be used to obtained regional proposals, by k-means. Finally, in order to obtain detection results, we can fine-tune the candidate window, mainly including translation and scaling of the bounding box, by regression layer. The specific method is described in [11]. The process is shown in Figure 9.
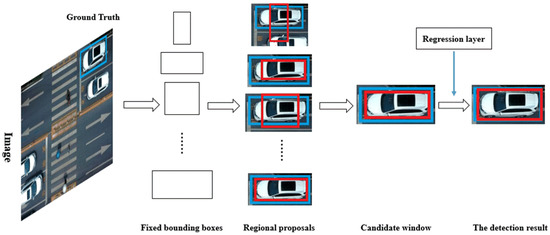
Figure 9.
Acquisition of test results.
3.3. Performance Analysis of Multi-Perspective Convolutional Network
The multi-perspective convolution network mentioned in the previous section does not specify the feature extraction from several perspectives. In this section, we determine the number of viewpoints through experiments. Firstly, we design three kinds of network structures and input the result obtained by k-means clustering into the area to generate the network. Then, we conduct three experiments: Multi-PerNet1, Multi-PerNet2, and Multi-PerNet3. Multi-PerNet1 contains only one convolutional neural network. Multi-PerNet2 contains two convolutional neural networks with different initial convolution kernels. And Multi-PerNet3 contains three convolutional neural networks with different initial convolution kernels. And Convolutional Neural Network Parameters will be shown in Section 4.2. The experimental results are shown in Figure 10.
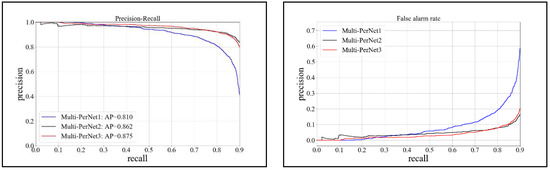
Figure 10.
Comparison of three networks.
As shown in Figure 9, Multi-PerNet3 provides considerable performance improvement over Multi-PerNet1; however, it shows only a small performance improvement over Multi-PerNet2, indicating a significant decrease in the revenue from adding the viewing angle to the viewing angle. In this study, we selected Multi-PerNet3 as the basic detection network in the test.
4. Experiment and Verification
4.1. Experimental Dataset
The experimental data selected for this study were obtained from Google Earth remote sensing data. They covered scenarios relating to vehicle forms. The image-specific information is shown in Table 2. Figure 10 (left) shows part of the training sample. The sample image is formed into the voc2007 dataset format. Part of the image information is saved in XML file format. These files mainly contain the coordinate information and the label of the vehicle location in the image, as shown in Figure 11 (right).
Table 2.
Introduction of experimental data.
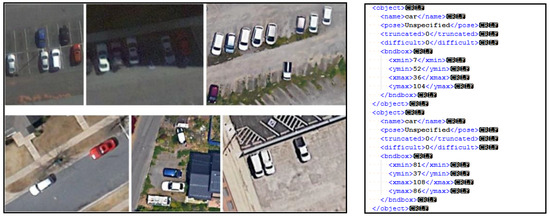
Figure 11.
Partial samples and labels.
4.2. Evaluation of Test Results
We used Multi-PerNet3 to train the dataset to obtain the vehicle detection model. The basic network parameters of Multi-PerNet3 are shown in Table 3.
Table 3.
Basic parameters of Multi-PerNet3.
For the whole training process, judging whether the model training was successful depended on whether the loss value converged. The relationship between the loss function and the number of training iterations is shown in Figure 12 and Figure 13. As shown in the figures, we choose the precision-recall curve to describe the accuracy of the model. The area enclosed by the curve is called the ap value. The larger is the value, the higher is the precision that can be guaranteed with high recall. We additionally examined the relationship between the false-alarm rate and recall rate. The concrete results are shown in Figure 14 and Figure 15, and the comparison between the models is shown in Table 4.
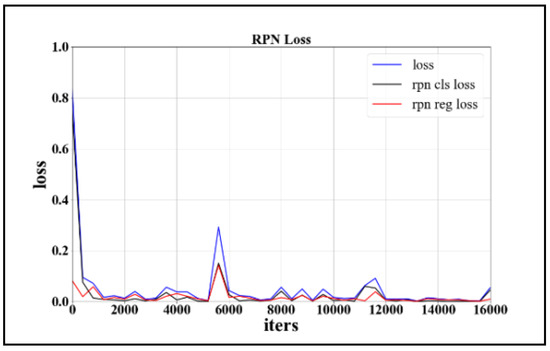
Figure 12.
Loss function curve of RPN process.
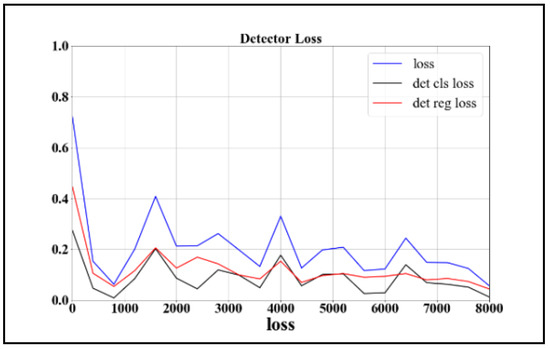
Figure 13.
Loss curve of detector training process.
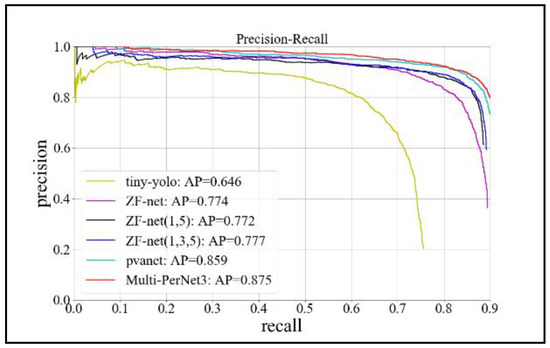
Figure 14.
P-R curve.
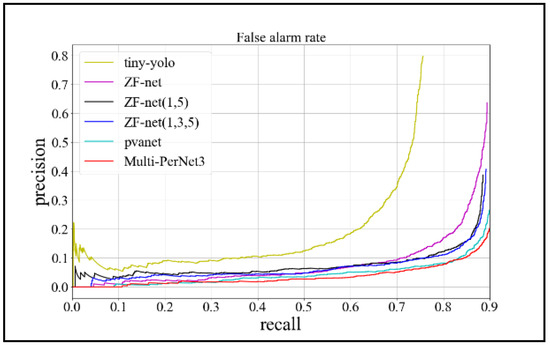
Figure 15.
False-alarm rate curve.
Table 4.
Comparison of model results.
As shown in Figure 11 and Figure 12, the loss function tends to converge during the RPN process. Moreover, the loss value converges to approximately 0.15 in the model training process, which proves the feasibility of the method. From Figure 13 and Figure 14, we can observe that the detection model based on Multi-PerNet3 provides notably superior detection performance. From the results in the table, it is evident that the model trained in this study, while ensuring a high detection rate, greatly reduced the false-alarm rate. Compared to the ZF-net model, it not only improved the detection rate, but it reduced the false-alarm rate by 37%. Compared with the model obtained by PVANet, the false-alarm rate was reduced by 6% when the detection rate is 0.9, and the model size was greatly reduced. The test results are shown in Figure 16.
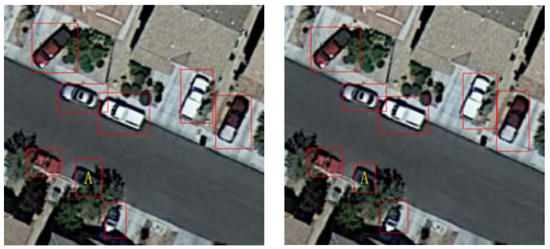
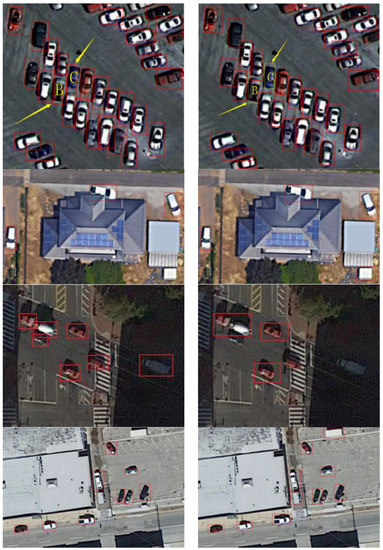
Figure 16.
Comparison of Multi-PerNet 3 (left) and ZF-net (right) test results.
From the test comparison, both networks detect the specific objects in the occluded case (part A in the figure), while Multi-PerNet3 showed better detection results in complex scenarios, that is, Parts B and C. Meanwhile, ZF-net had obviously missed detection in complex scenes. In the comparison between the third group, the fourth group and the fifth group, the detection results based on ZF-net have an obvious misdetection, but the detection results of the proposed method were better.
In order to prove the method mentioned in this paper has a great performance, we show the detection results of partial pictures based on Multi-PerNet3 in Figure 17. In addition, in the high-resolution google earth, the weather has a much smaller impact on the target than the background. Therefore, the impact on the test results is not significant, we show some detection results in a same area at different times (19 June 2010, 25 August 2013, 28 September 2014, 7 June 2015, 11 May 2016, 15 April 2017) in Figure 18.
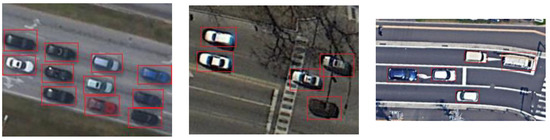
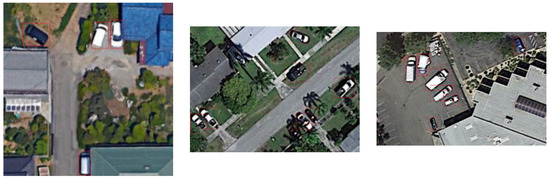
Figure 17.
The detection results of partial pictures based on Multi-PerNet3.
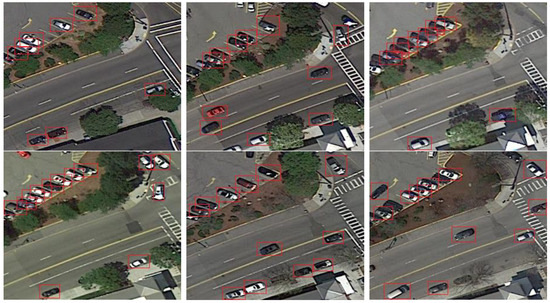
Figure 18.
The detection results in same area at different times.
5. Conclusions
In this paper, the Faster-R-CNN framework was introduced to solve the problem of candidate window redundancy in remote sensing image detection. The framework addresses the issue of the slow detection speed and high false-alarm rate caused by the large number of redundant candidate windows in the sliding window. The multi-view convolution network (Multi-PerNet) was proposed based on the research to solve the problem of low detection accuracy due to lack of feature acquisition. The experimental results proved the feasibility of the proposed method. In this approach, although the scale parameters were determined by k-means, there remained some subjectivity for the choice of k values. In multi-perspective convolutional networks, owing to the combination of various feature layers, there must be parameter redundancy.
The next step in this research is to resolve the above two shortcomings. Specifically, for the determining the candidate window size, we will consider avoiding some subjectivity by clustering the selected scale size and the actual proportion of the target box in the label. For the network structure design, we will consider introducing a residual network and the CReLU activation function to reduce the parameter redundancy and redefine a selection of the receptive field (SoRF), which can automatically select the initial receptive field. Accordingly, only the first convolutional layer has a multi-level network, while the parameters are simultaneously reduced and the test results are improved.
Author Contributions
C.Y. and Z.L. conceived and designed the experiments; C.Y. performed the experiments; Z.L. and W.L. analyzed data; W.L. contributed data and analysis tools; C.Y. wrote the paper.
Funding
National Science Foundation of China under Grant No. 41271449
Acknowledgments
This work was supported by the National Science Foundation of China under Grant No. 41271449 and Industrial Safety Engineering Technology Research Center of Hubei Province.
Conflicts of Interest
The authors declare no conflicts of interest.
References
- Zhang, Z.A. Study on Harbor Target Recognition in High Resolution Optical Remote Sensing Image; University of Science and Technology of China: Hefei, China, 2005. [Google Scholar]
- Zhen, L.; Tao, F.; Hong, H.; Li, D. Rotation invariant object detection of remotely sensed images based on Texton Forest and Hough Voting. IEEE Trans. Geosci. Remote Sens. 2012, 50, 1206–1217. [Google Scholar]
- Wang, H. Improvement of the recognition probability about camouflage target based on BP neural network. Spectrosc. Spectr. Anal. 2010, 30, 3316–3319. [Google Scholar]
- Duan, S.; Li, J.-H.; Xu, W.-P.; Liu, X.; Shang, Z.-E. Moving object detection algorithm based on match time. Compet. Eng. 2013, 39, 192–195. [Google Scholar]
- Alba-Flores, R. Evaluation of the Use of High—Resolution Satellite Imagery in Transportation Applications; Department of Electrical and Computer Engineering, University of Minnesota: Duluth, MN, USA, 2005. [Google Scholar]
- Li, Y.; Peng, J. Feature Extraction of the Harbor Target and Its Recognition. J. Huazhong Univ. Sci. Technol. 2001, 29, 10–12. [Google Scholar]
- Zeng, J.; Fu, J.; Fu, X. Aircraft target recognition in remote sensing images based on distribution of the feature points and invariant moments. J. Image Gr. 2014, 19, 593–603. [Google Scholar]
- Qi, S.; Ma, J.; Lin, J.; Li, Y.; Tian, J. Unsupervised ship detection based on saliency and s-hog descriptor from optical satellite images. Geosci. Remote Sens. Lett. 2015, 12, 1451–1455. [Google Scholar]
- Huang, J.; Jiang, Z.; Zhang, H.; Yao, Y. Ship detection in remote sensing images using convolutional neural networks. J. Beijing Univ. Aeronaut. Astronaut. 2017, 43, 1–7. [Google Scholar]
- Yao, X.; Wan, L.; Huo, H. Airplane object detection in high resolution remote sensing imagery based on multi-structure convolutional neural network. Comput. Eng. 2017, 43, 259–267. [Google Scholar]
- Uijlings, J.R.; Sande, K.E.; Gevers, T.; Smeulders, A.W. Selective search for object recognition. Int. J. Comput. Vis. 2013, 104, 154–171. [Google Scholar] [CrossRef]
- Girshick, R.; Donahue, J.; Darrell, T.; Malik, J. Rich feature hierarchies for accurate object detection and semantic segmentation. IEEE Conf. Comput. Vis. Pattern Recognit. 2014, 580–587. [Google Scholar] [CrossRef]
- Girshick, R. Fast R-CNN. IEEE Int. Conf. Comput. Vis. 2015, 1440–1448. Available online: http://openaccess.thecvf.com/content_iccv_2015/papers/Girshick_Fast_R-CNN_ICCV_2015_paper.pdf (accessed on 19 June 2018).
- Ren, S.; He, K.; Girshick, R.; Sun, J. Faster R-CNN: Towards real-time object detection with region proposal networks. IEEE Trans. Pattern Anal. Mach. Intell. 2017, 39, 1137–1149. [Google Scholar] [CrossRef] [PubMed]
- Zeiler, M.D.; Fergus, R. Visualizing and understanding convolutional networks. IEEE Conf. Comput. Vis. Pattern Recognit. 2014, 8689, 818–833. [Google Scholar]
- Simonyan, K.; Zisserman, A. Very Deep Convolutional Networks for Large-Scale Image Recognition. 2015. Available online: https://arxiv.org/pdf/1409.1556.pdf (accessed on 19 June 2018).
- Glorot, X.; Bordes, A.; Bengio, Y. Deep sparse rectifier neural networks. In Proceedings of the International Joint Conference on Artificial Intelligence (IJCAI), Barcelona, Spain, 16–22 July 2011. [Google Scholar]
- Shang, W.; Almeida, D.; Almeida, D.; Lee, H. Understanding and improving convolutional neural networks via concatenated rectified linear units. Int. Conf. Int. Mach. Learn. 2016, 48, 2217–2225. [Google Scholar]
- He, K.; Zhang, X.; Ren, S.; Sun, J. Deep residual learning for image recognition. IEEE Conf. Comput. Vis. Pattern Recognit. 2016, 770–778. [Google Scholar] [CrossRef]
- Kong, T.; Yao, A.; Chen, Y.; Sun, F. HyperNet: Towards accurate region proposal generation and joint object detection. IEEE Conf. Comput. Vis. Pattern Recognit. 2016, 845–853. [Google Scholar] [CrossRef]
- Kim, K.H.; Hong, S.; Roh, B.; Cheon, Y.; Park, M. PVANET: Deep but Lightweight Neural Networks for Real-time Object Detection. 2016. Available online: https://arxiv.org/abs/1608.08021 (accessed on 19 June 2018).
- Jie, D.; Hiromitsu, Y.; Hamid Reza, P.; Yunus, A.; Song, X.; Xu, Y.; Zhu, Z. An integrated artificial neural network model for the landslide susceptibility assessment of Osado Island, Japan. J. Nat. Hazards 2015, 78, 1749–1776. [Google Scholar]
- Jie, D.; Kuan-Tsung, C.; Shuisen, C.; Yunus, A.P.; Liu, J.-K.; Xia, H.; Zhu, Z. Automatic Case-Based Reasoning Approach for Landslide Detection: Integration of Object-Oriented Image Analysis and a Genetic Algorithm. J. Remote Sens. 2015, 7, 4318–4342. [Google Scholar]
- Jie, D.; Xia, L.; Yunus, A.P.; Paudel, U.; Chang, K.-T.; Zhu, Z.; Pourghasemi, H.R. Automatic detection of sinkhole collapses at finer resolutions using a multi-component remote sensing approach. J. Nat. Hazards 2015, 78, 1021–1044. [Google Scholar]
- Cai, Z.; Fan, Q.; Feris, R.S.; Vasconcelos, N. Unified multi-scale deep convolutional neural network for fast object detection. Eur. Conf. Comput. 2016, 354–370. [Google Scholar] [CrossRef]
- Redmon, J.; Divvala, S.; Girshick, R.; Farhadi, A. You only look once: Unified, real-time object detection. In Proceedings of the 2016 IEEE Conference on Computer Vision and Pattern Recognition (CVPR), Las Vegas, NV, USA, 27–30 June 2016. [Google Scholar]
- Redmon, J.; Farhadi, A. YOLO9000: Better, Faster, Stronger. 2016. Available online: http://openaccess.thecvf.com/content_cvpr_2017/papers/Redmon_YOLO9000_Better_Faster_CVPR_2017_paper.pdf (accessed on 19 June 2018).


© 2018 by the authors. Licensee MDPI, Basel, Switzerland. This article is an open access article distributed under the terms and conditions of the Creative Commons Attribution (CC BY) license (http://creativecommons.org/licenses/by/4.0/).