Spatial Characterization and Mapping of Gated Communities


Abstract
:1. Introduction
2. Gated Communities: A Review of the Literature
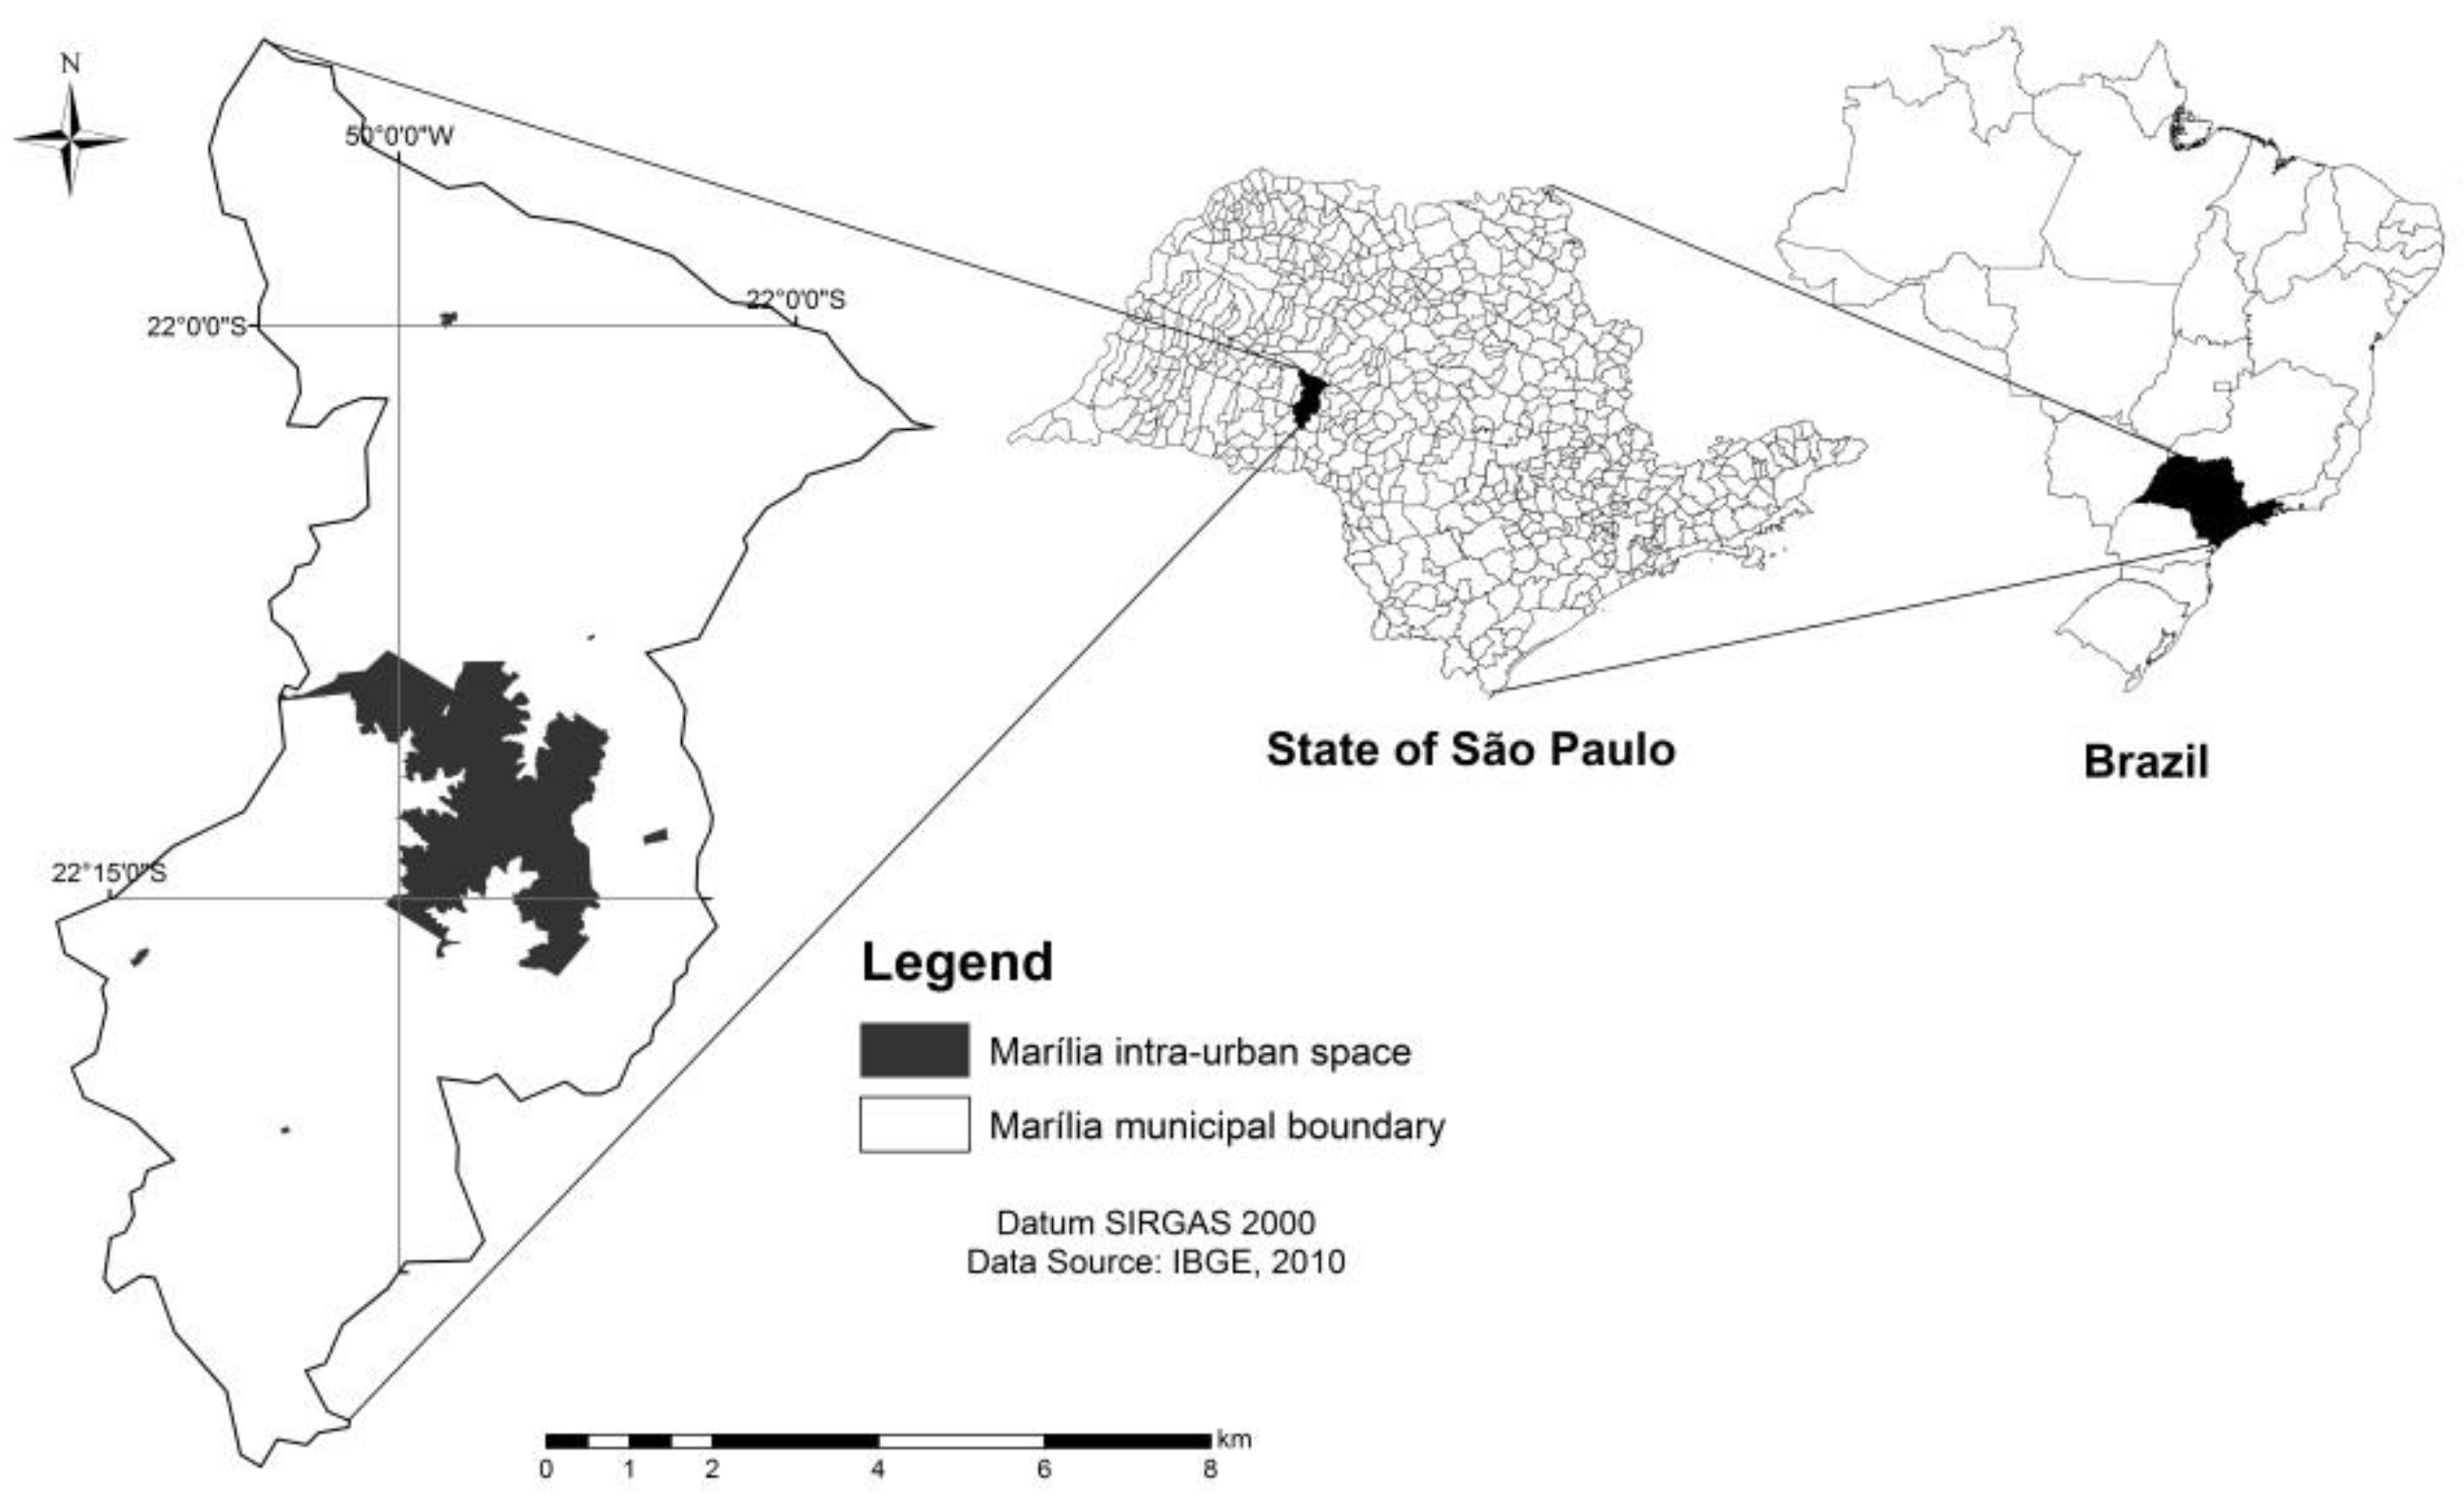
3. Study Area
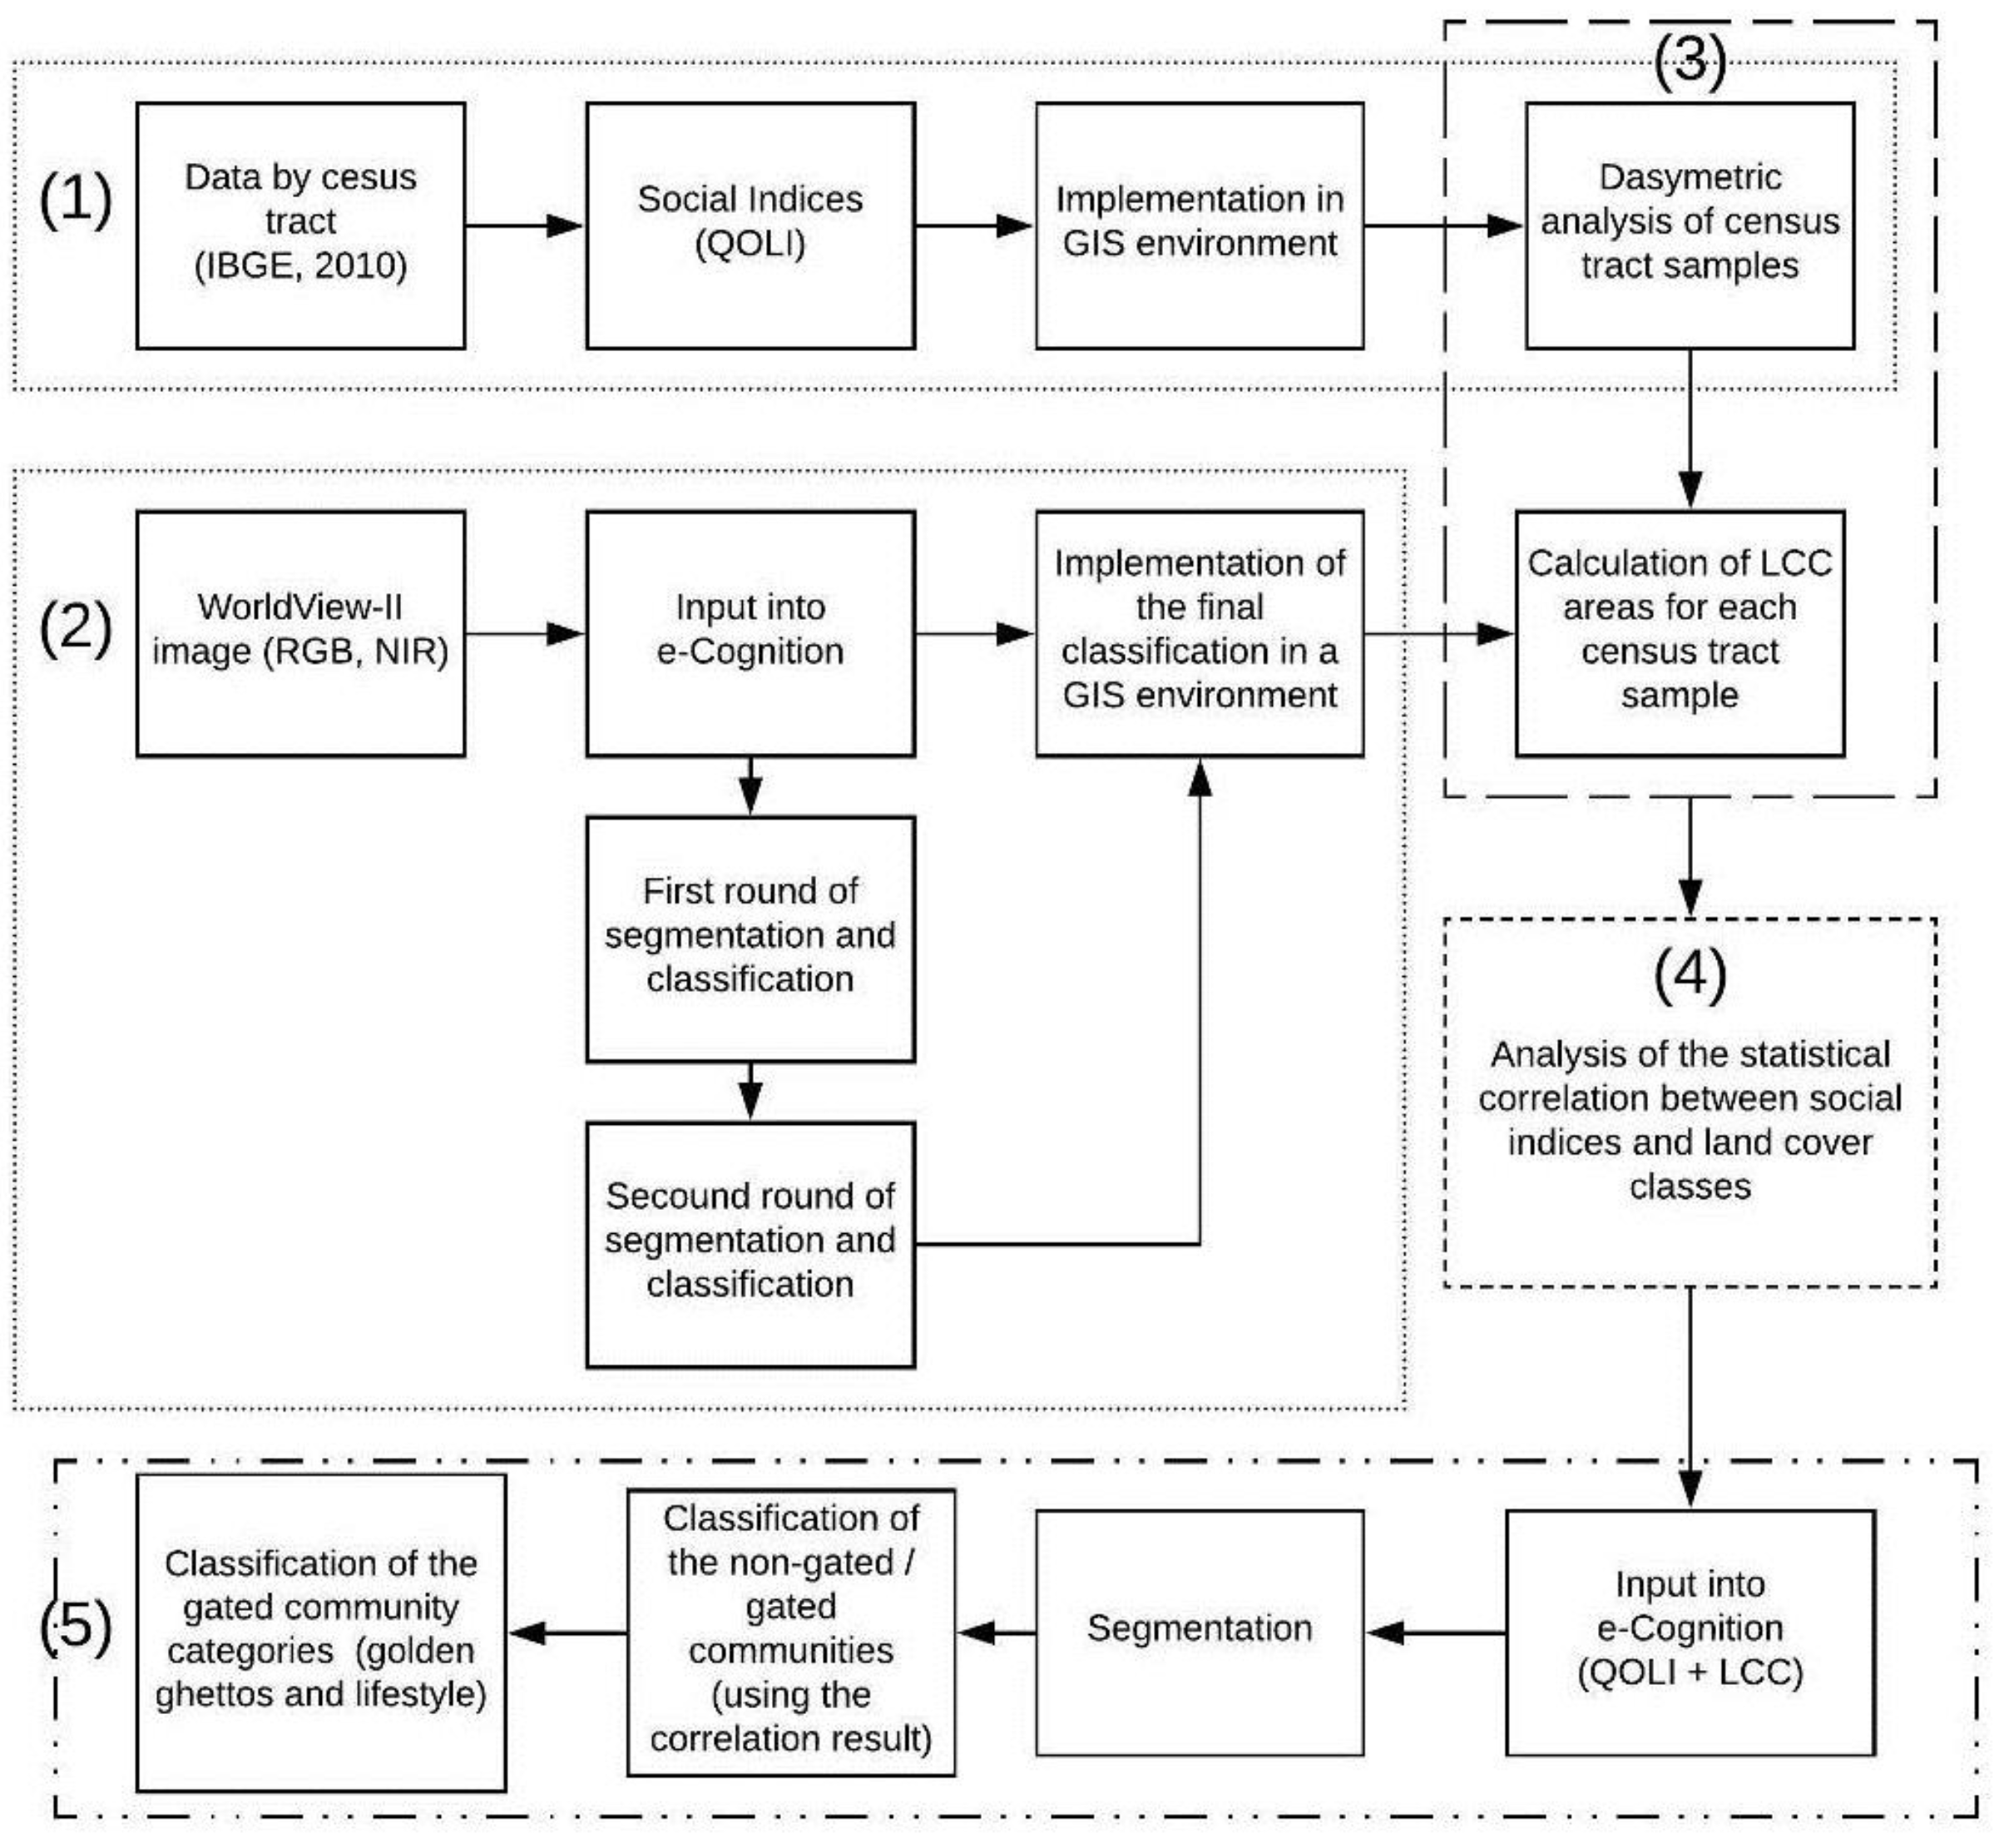
4. Methodology
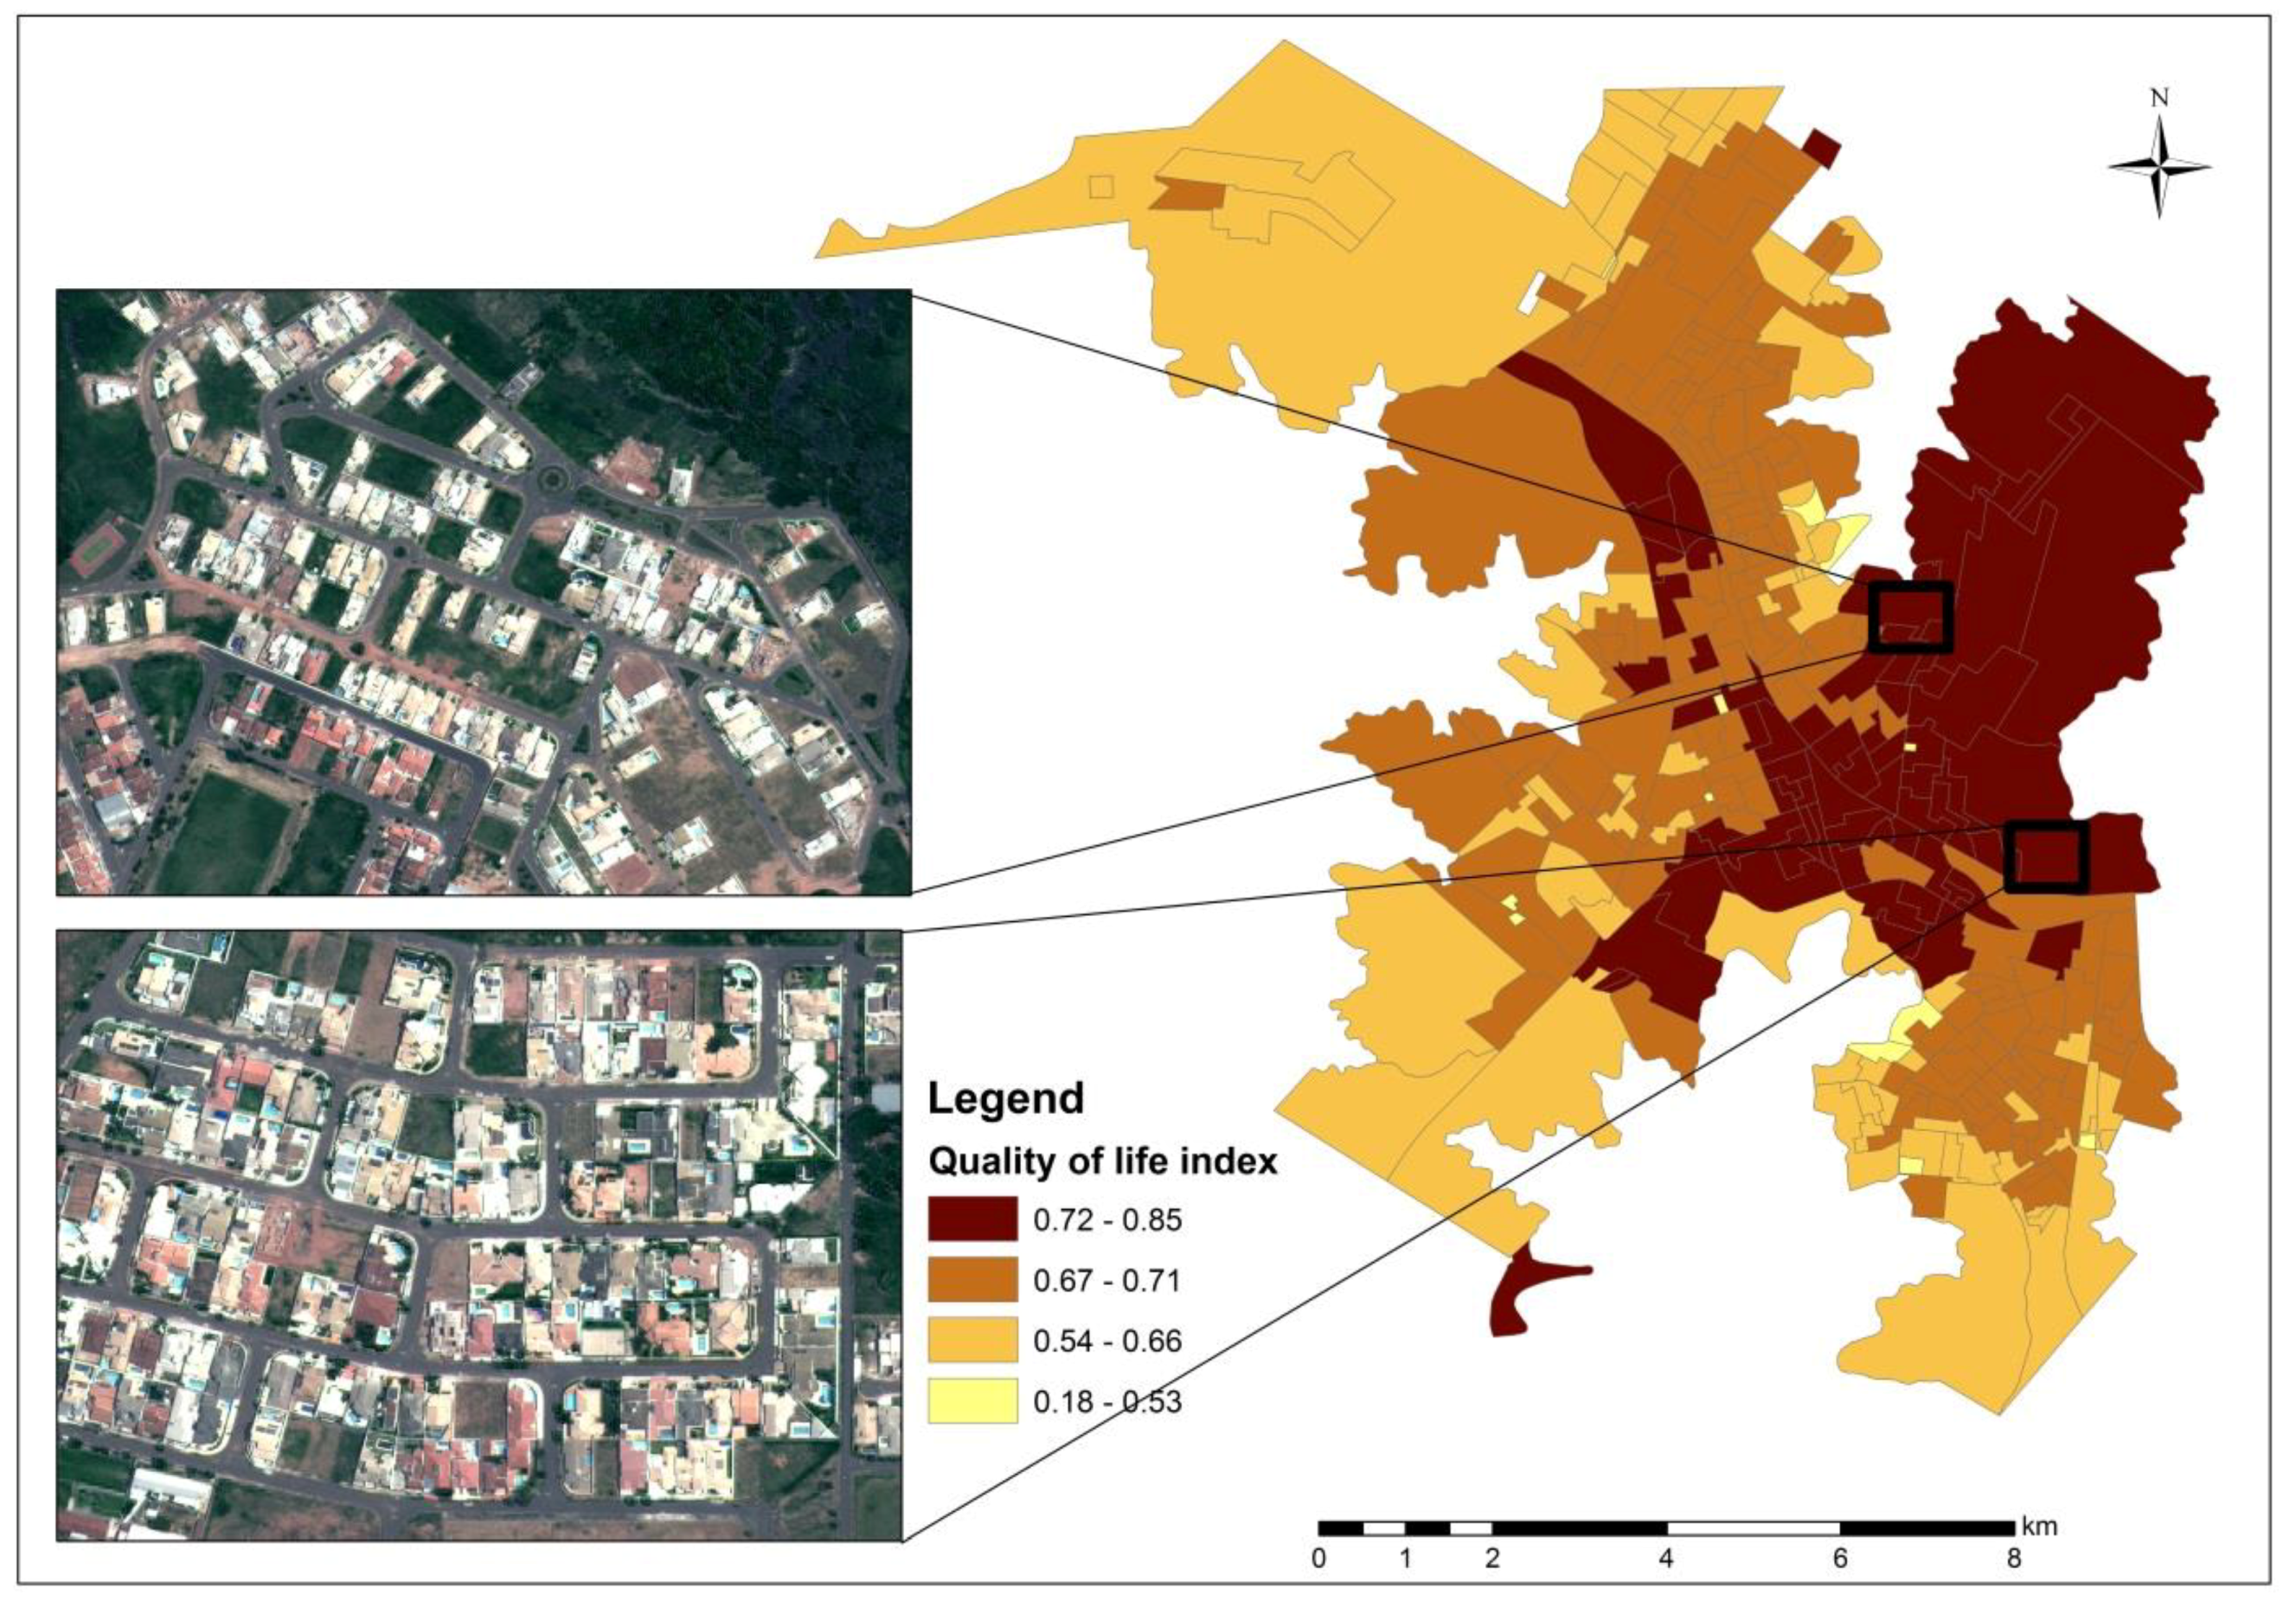
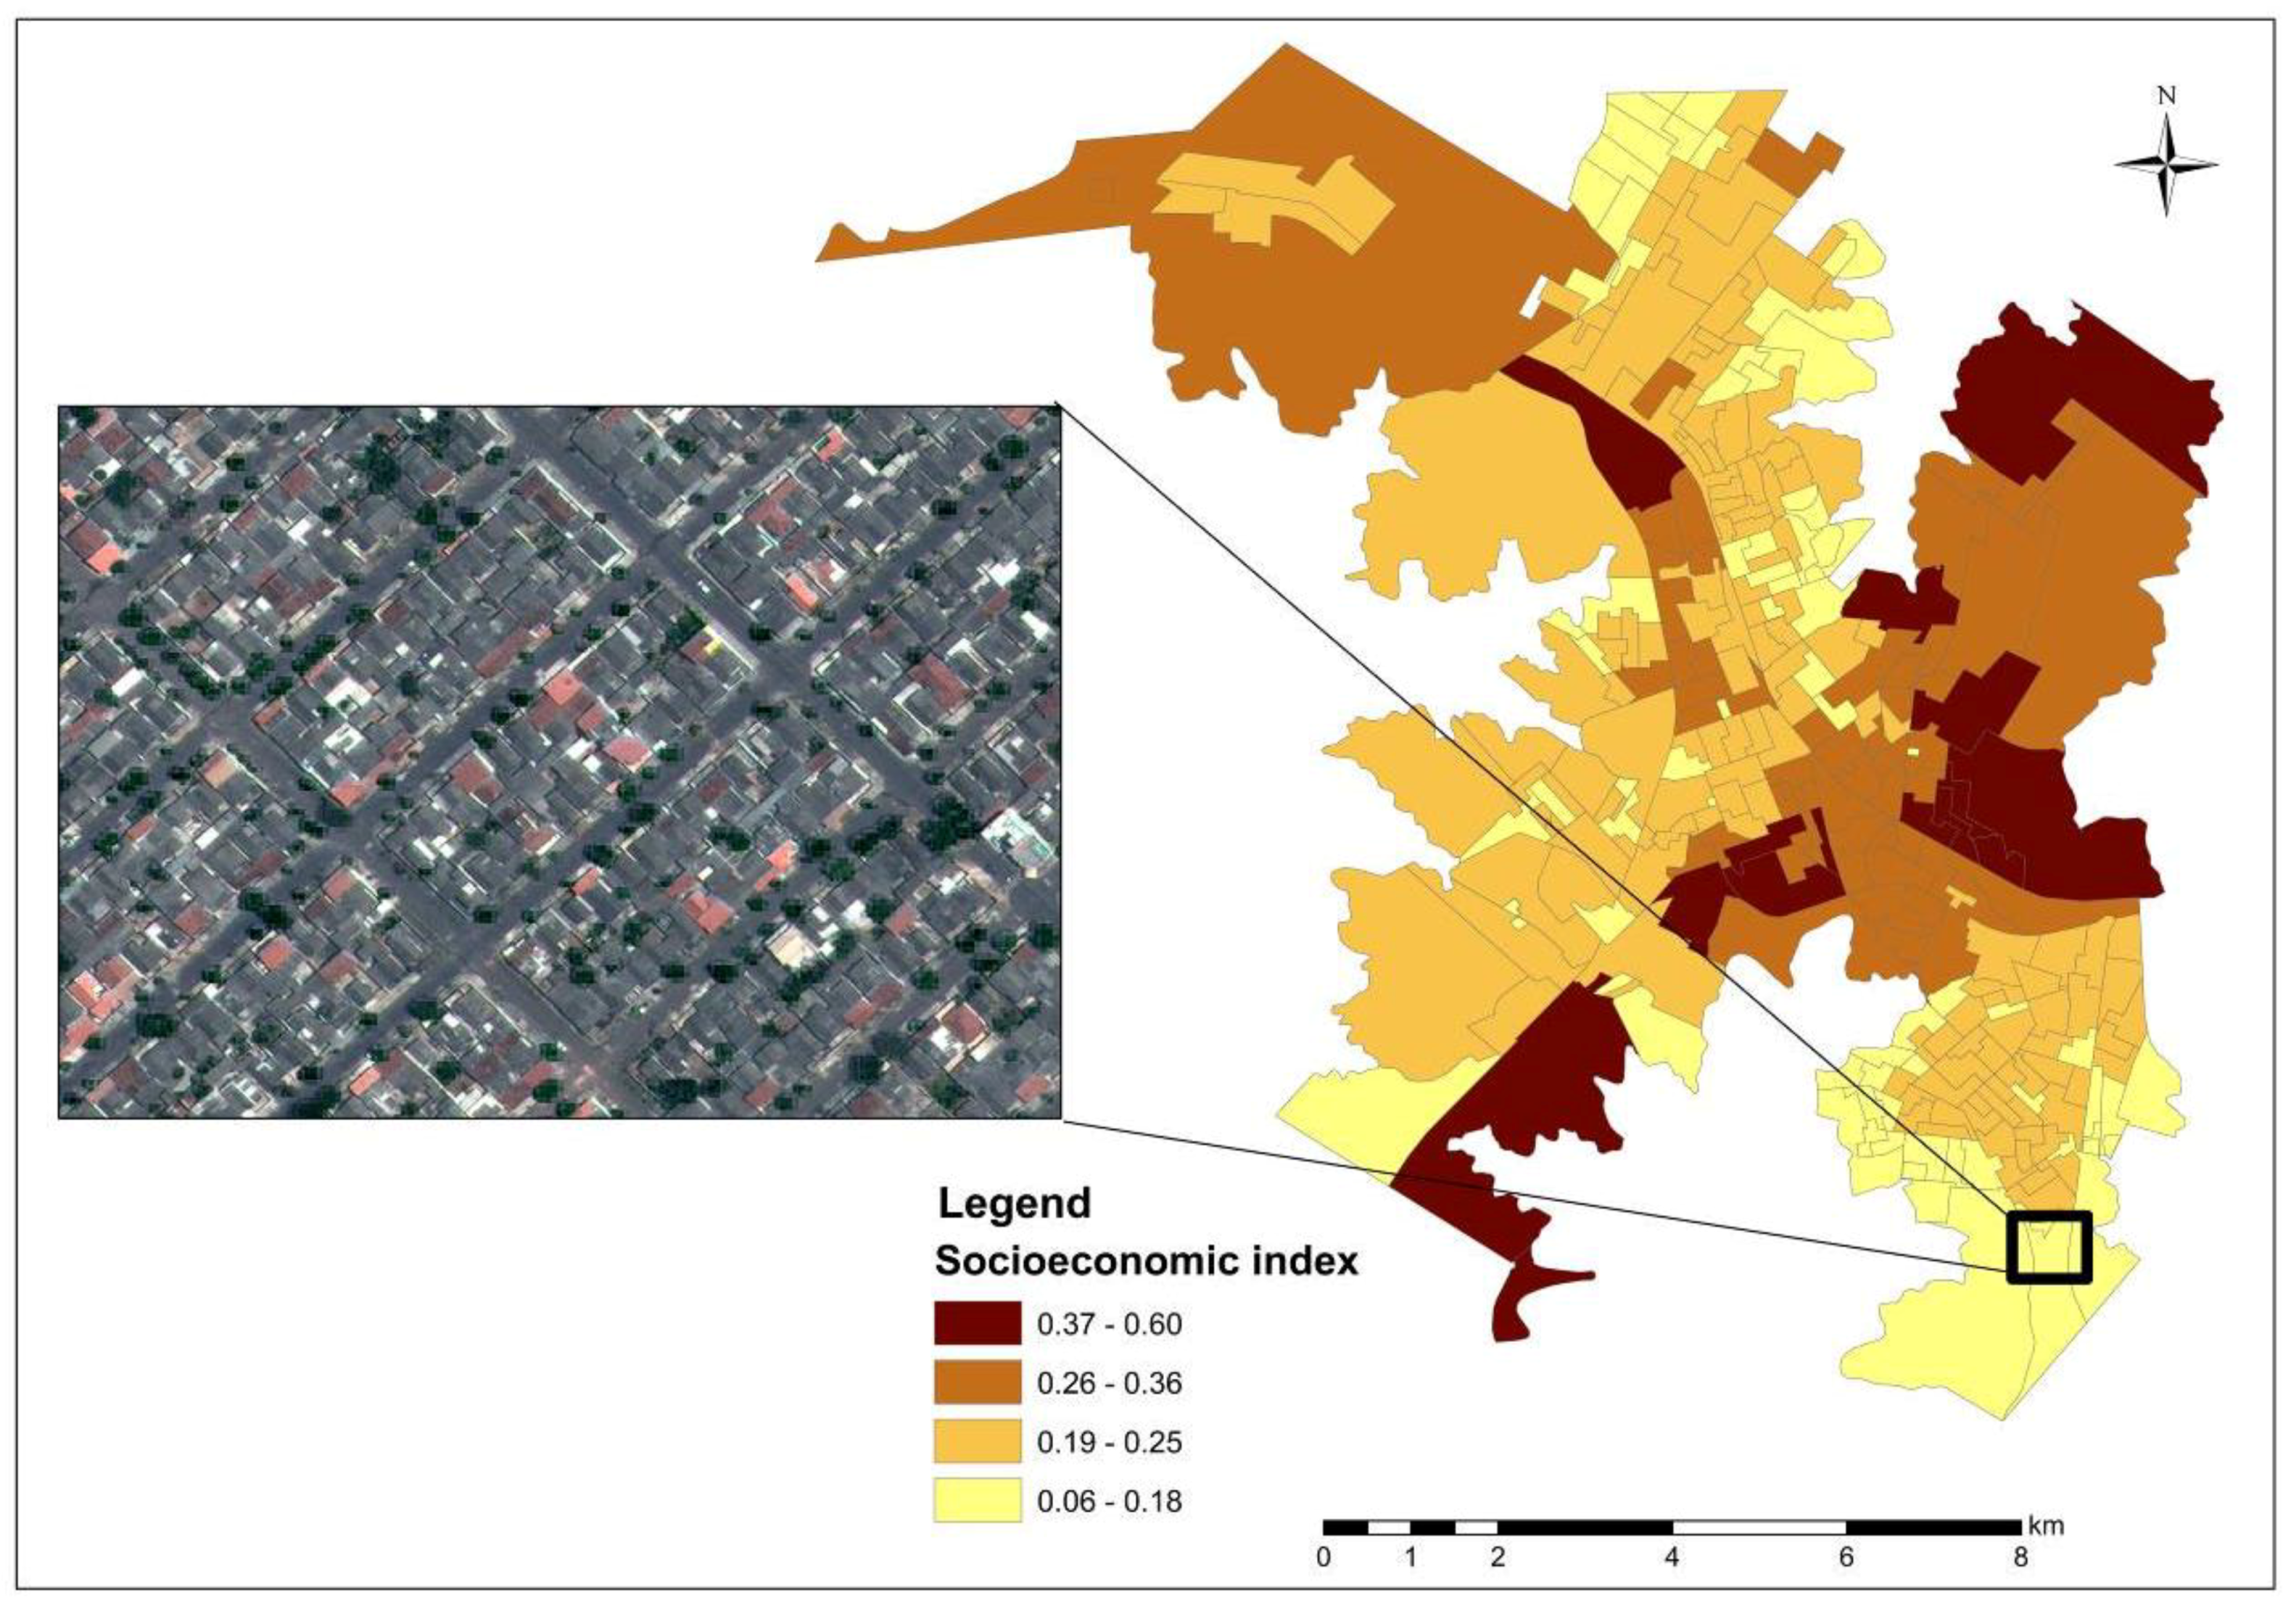
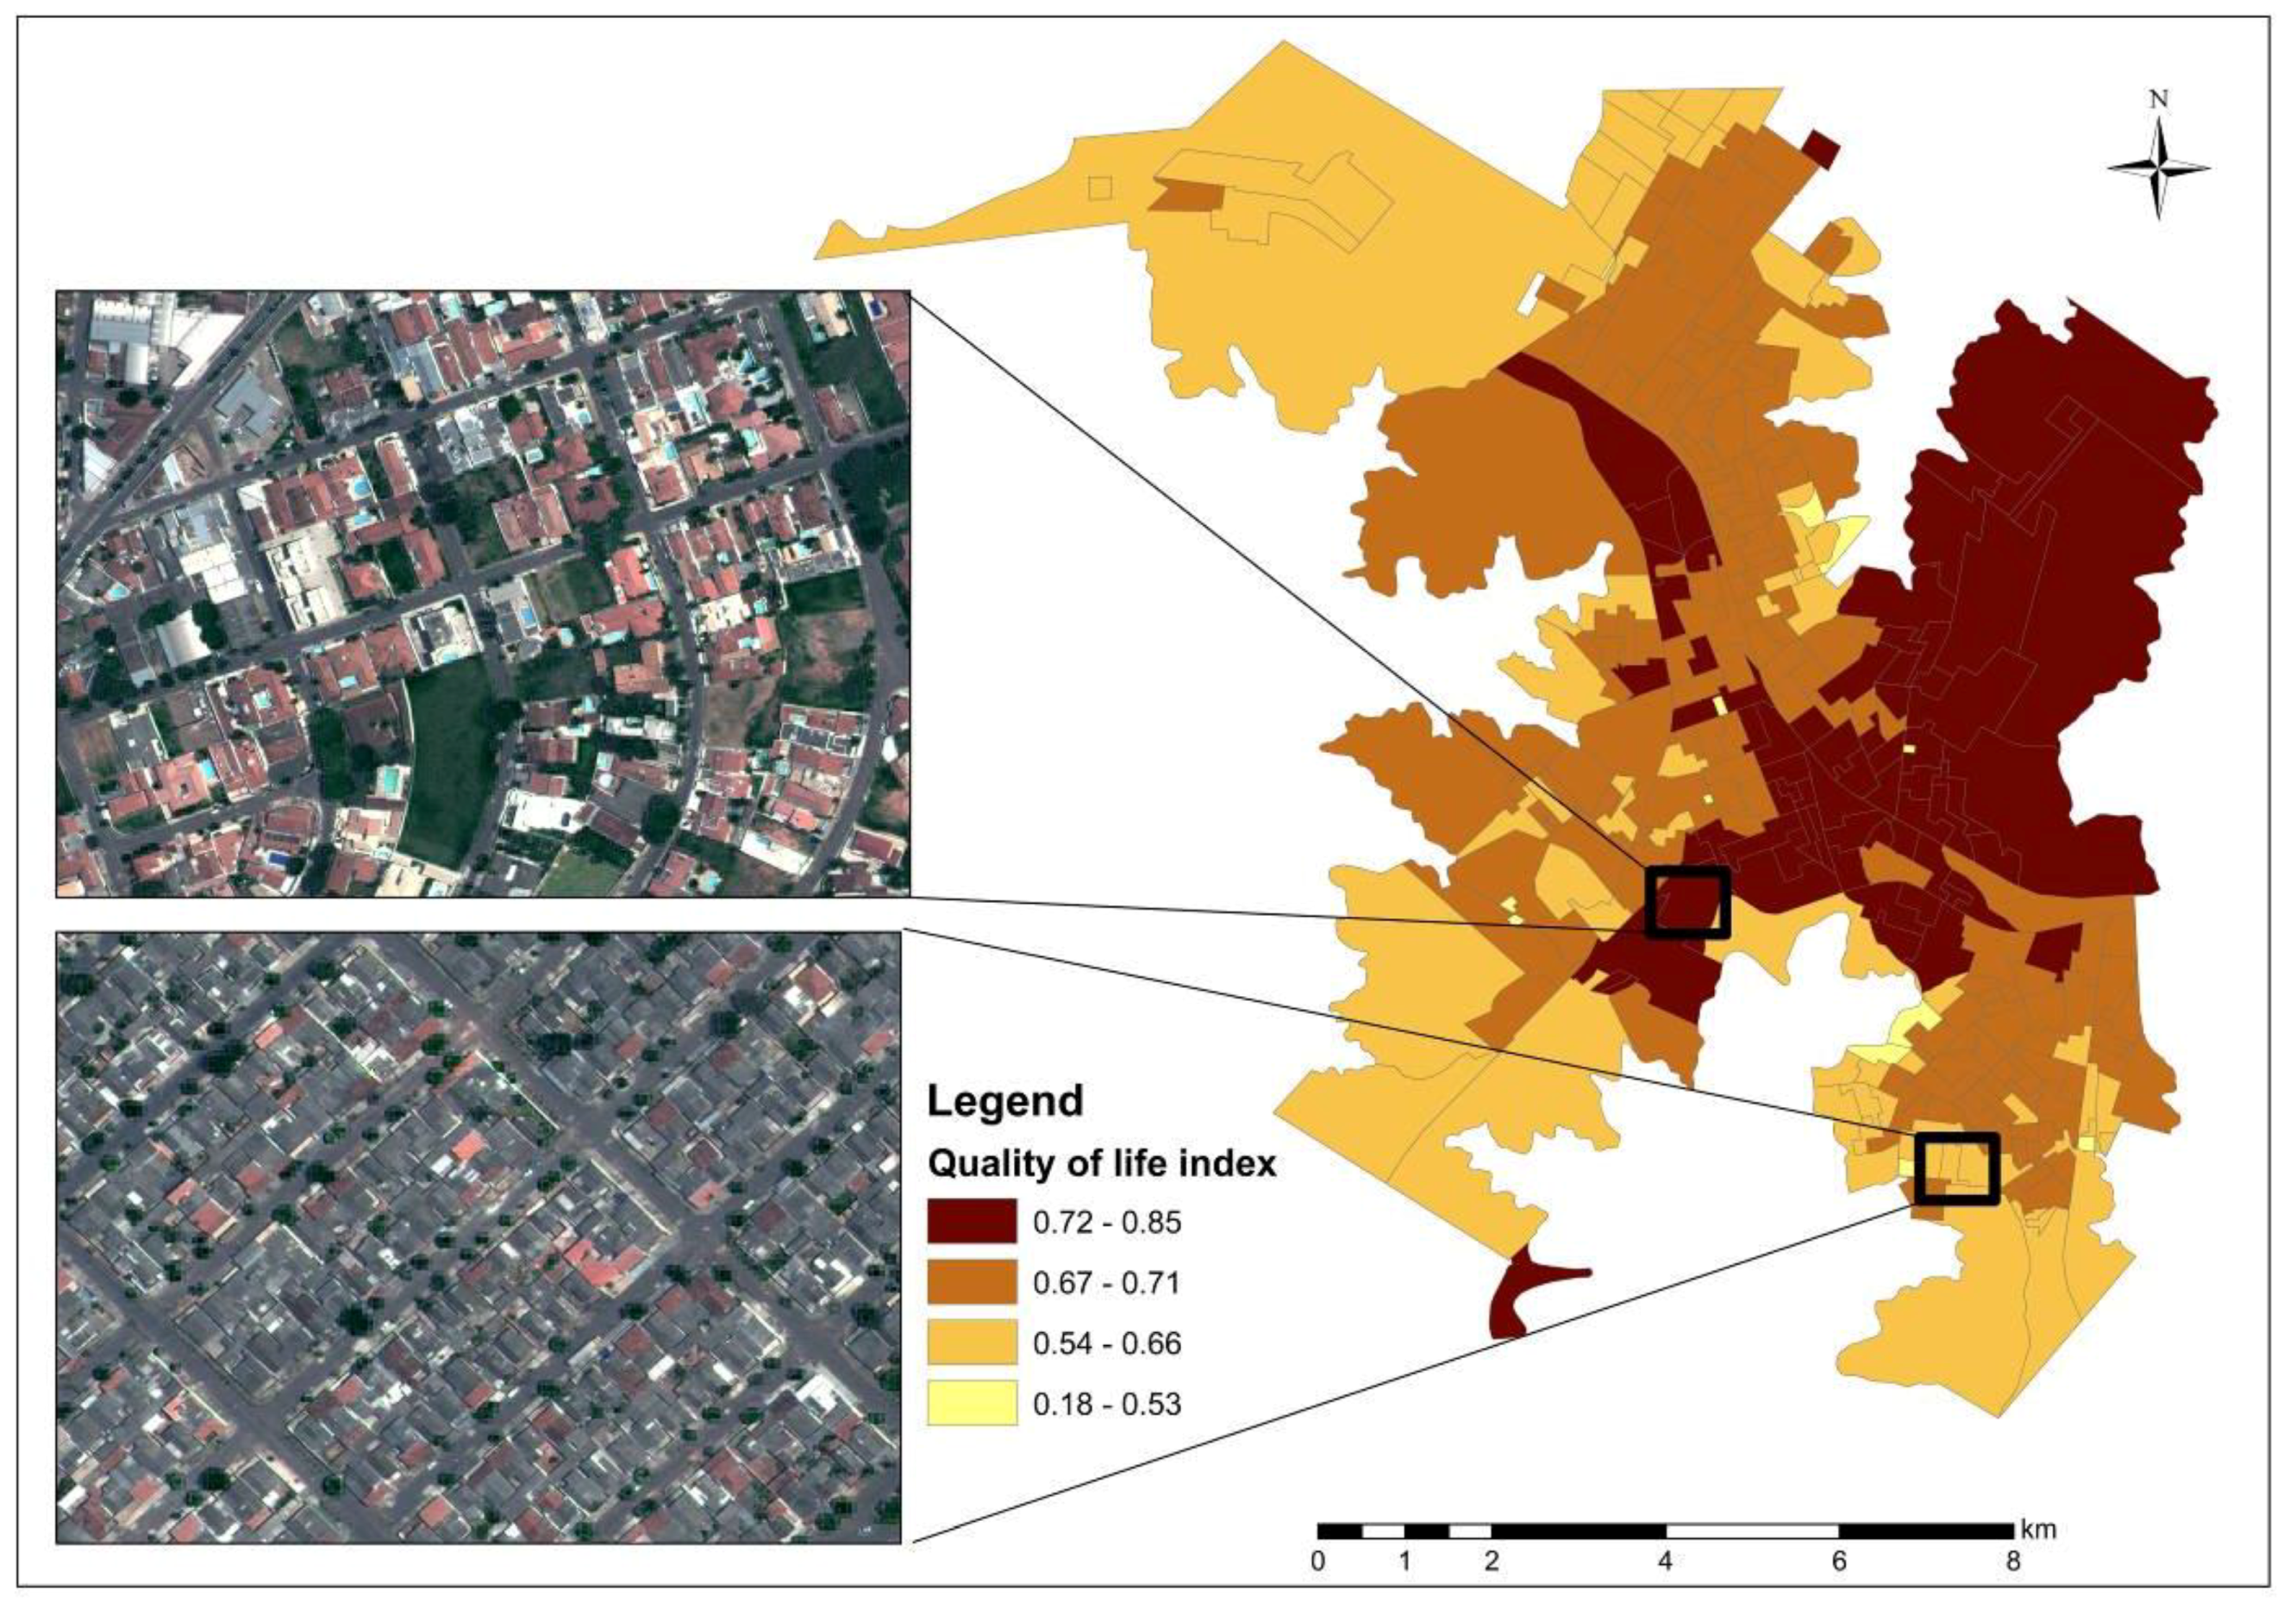
4.1. The Quality of Life Index (QOLI)
- Household environmental quality indicator (HEQI): burned garbage, buried garbage, collected garbage, network sewer system, rudimentary cesspit or ditch, and network water supply (normalized arithmetic mean of the variables);
- Educational indicator (EDUI): illiterate at 10 years of age or older and person responsible for household illiterate; and
- Economic indicator (ECOI): number of residents per bathroom and income of the head of household.
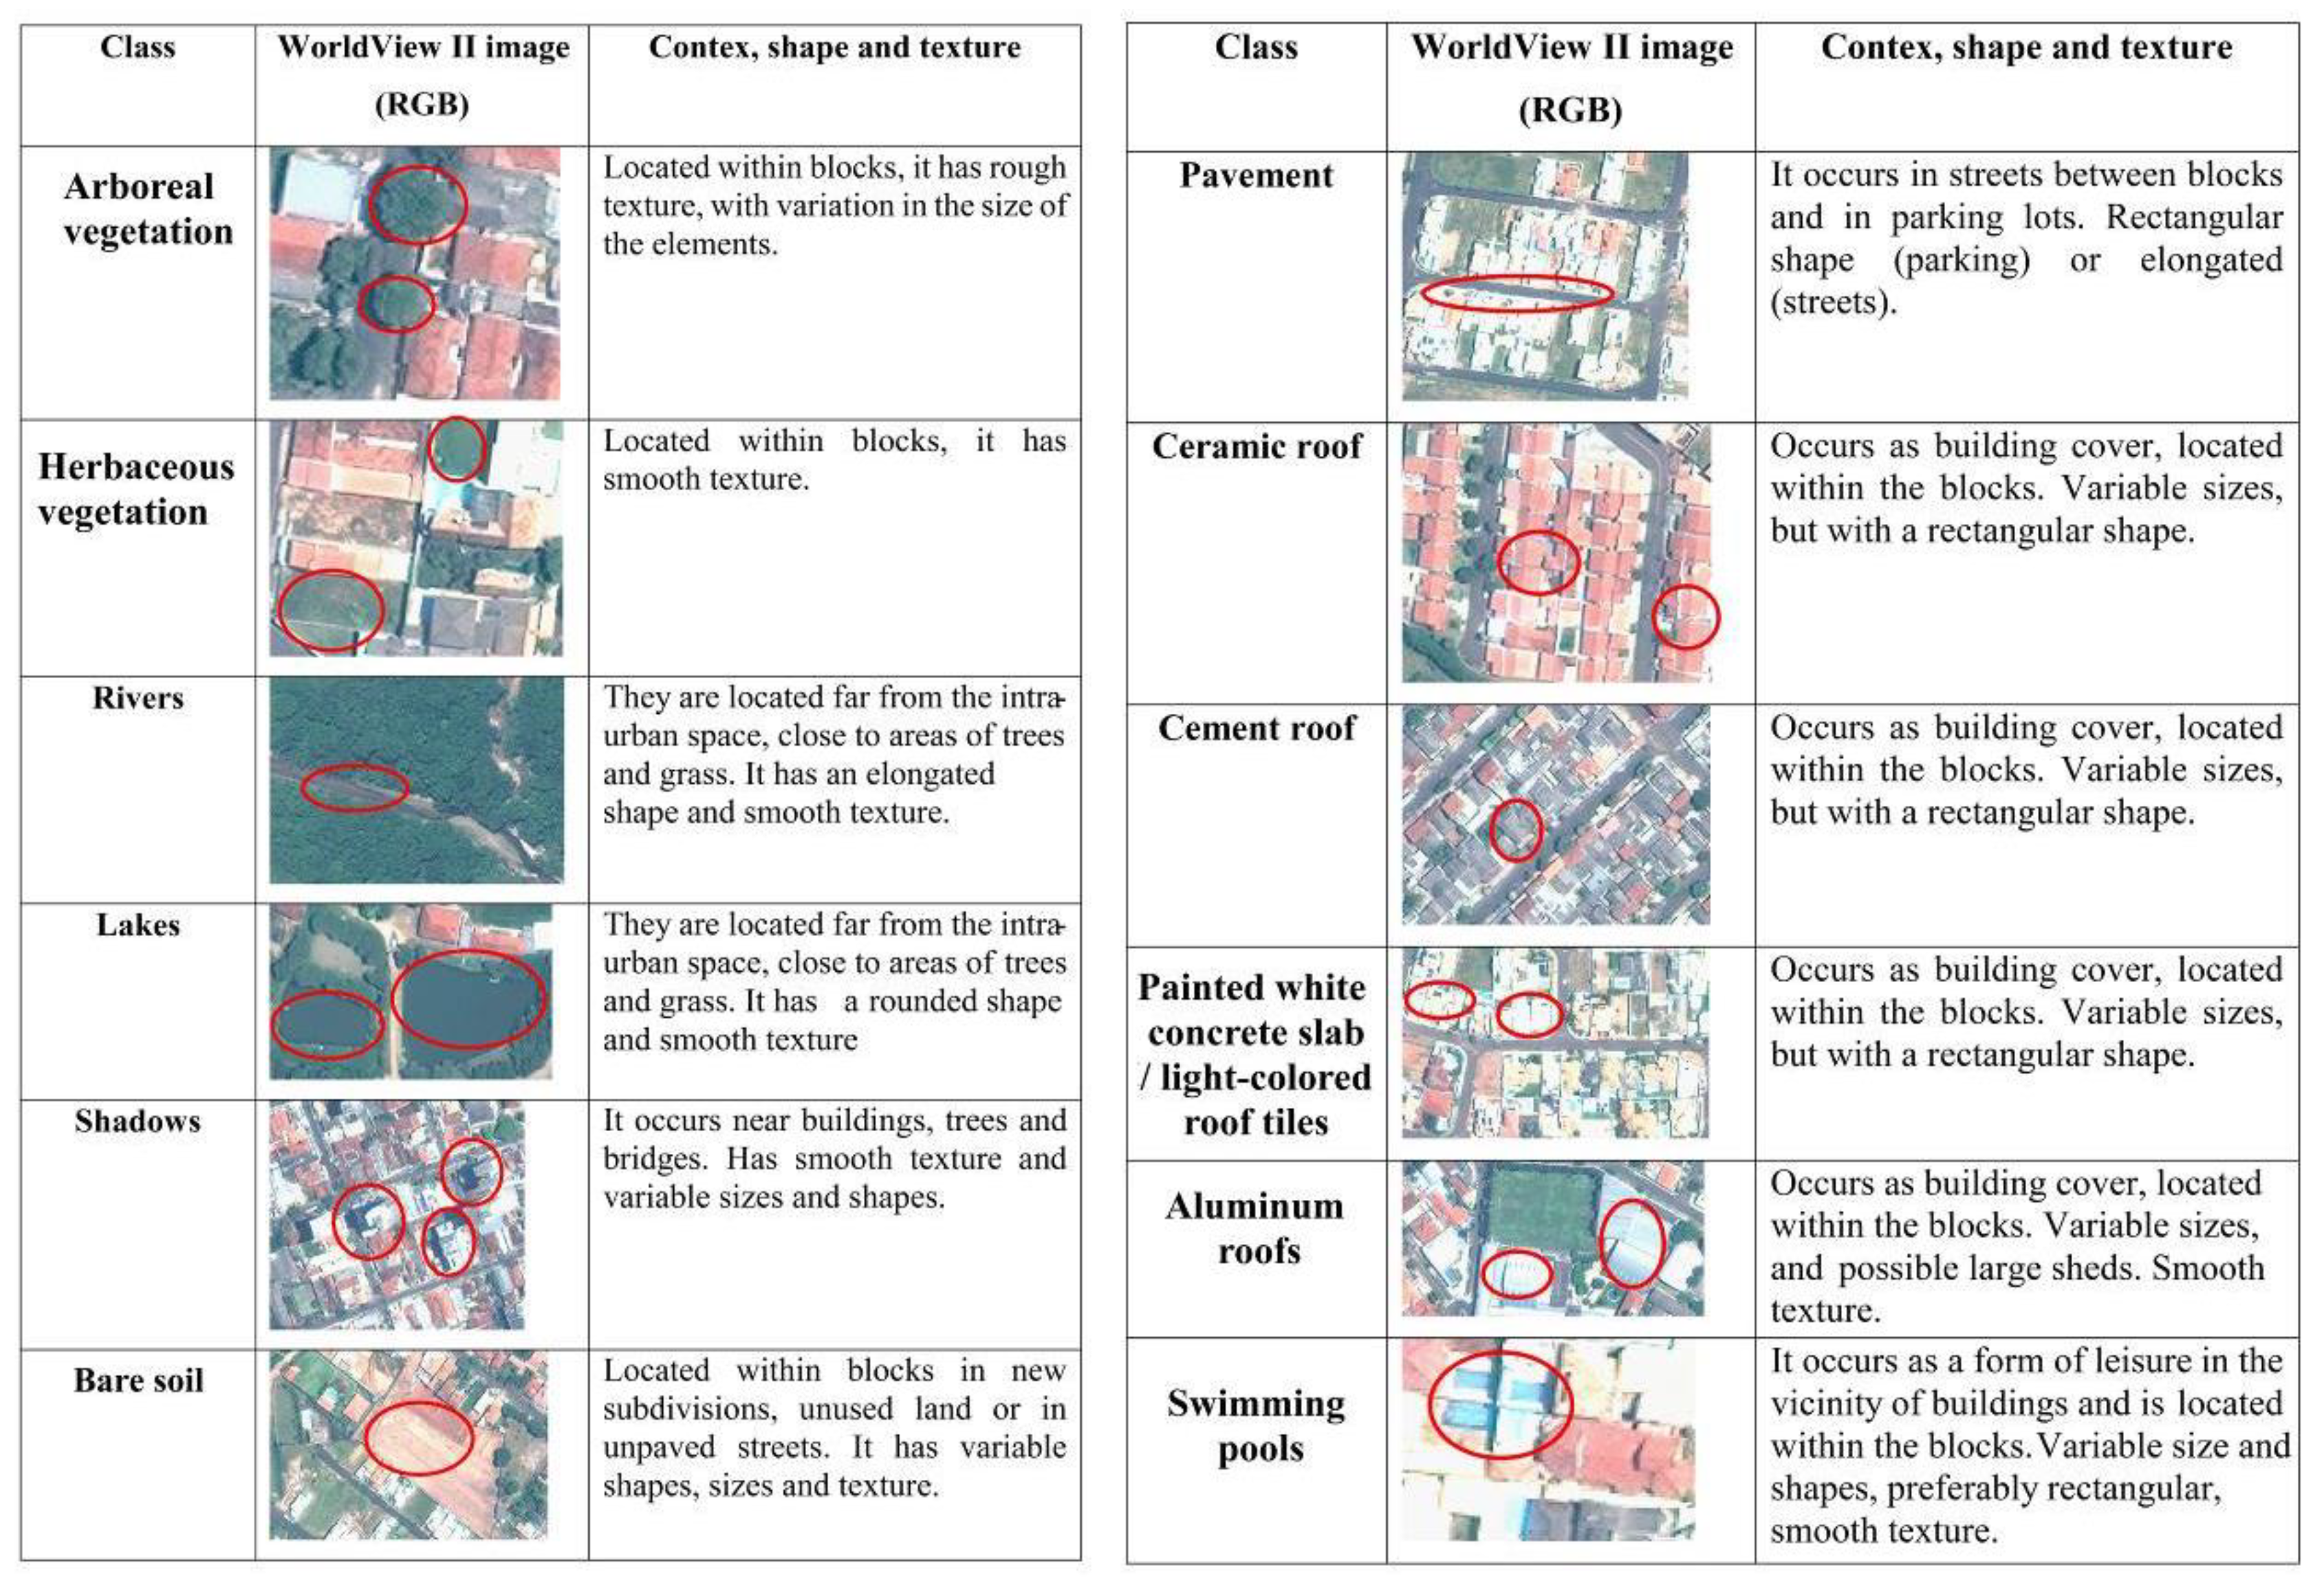
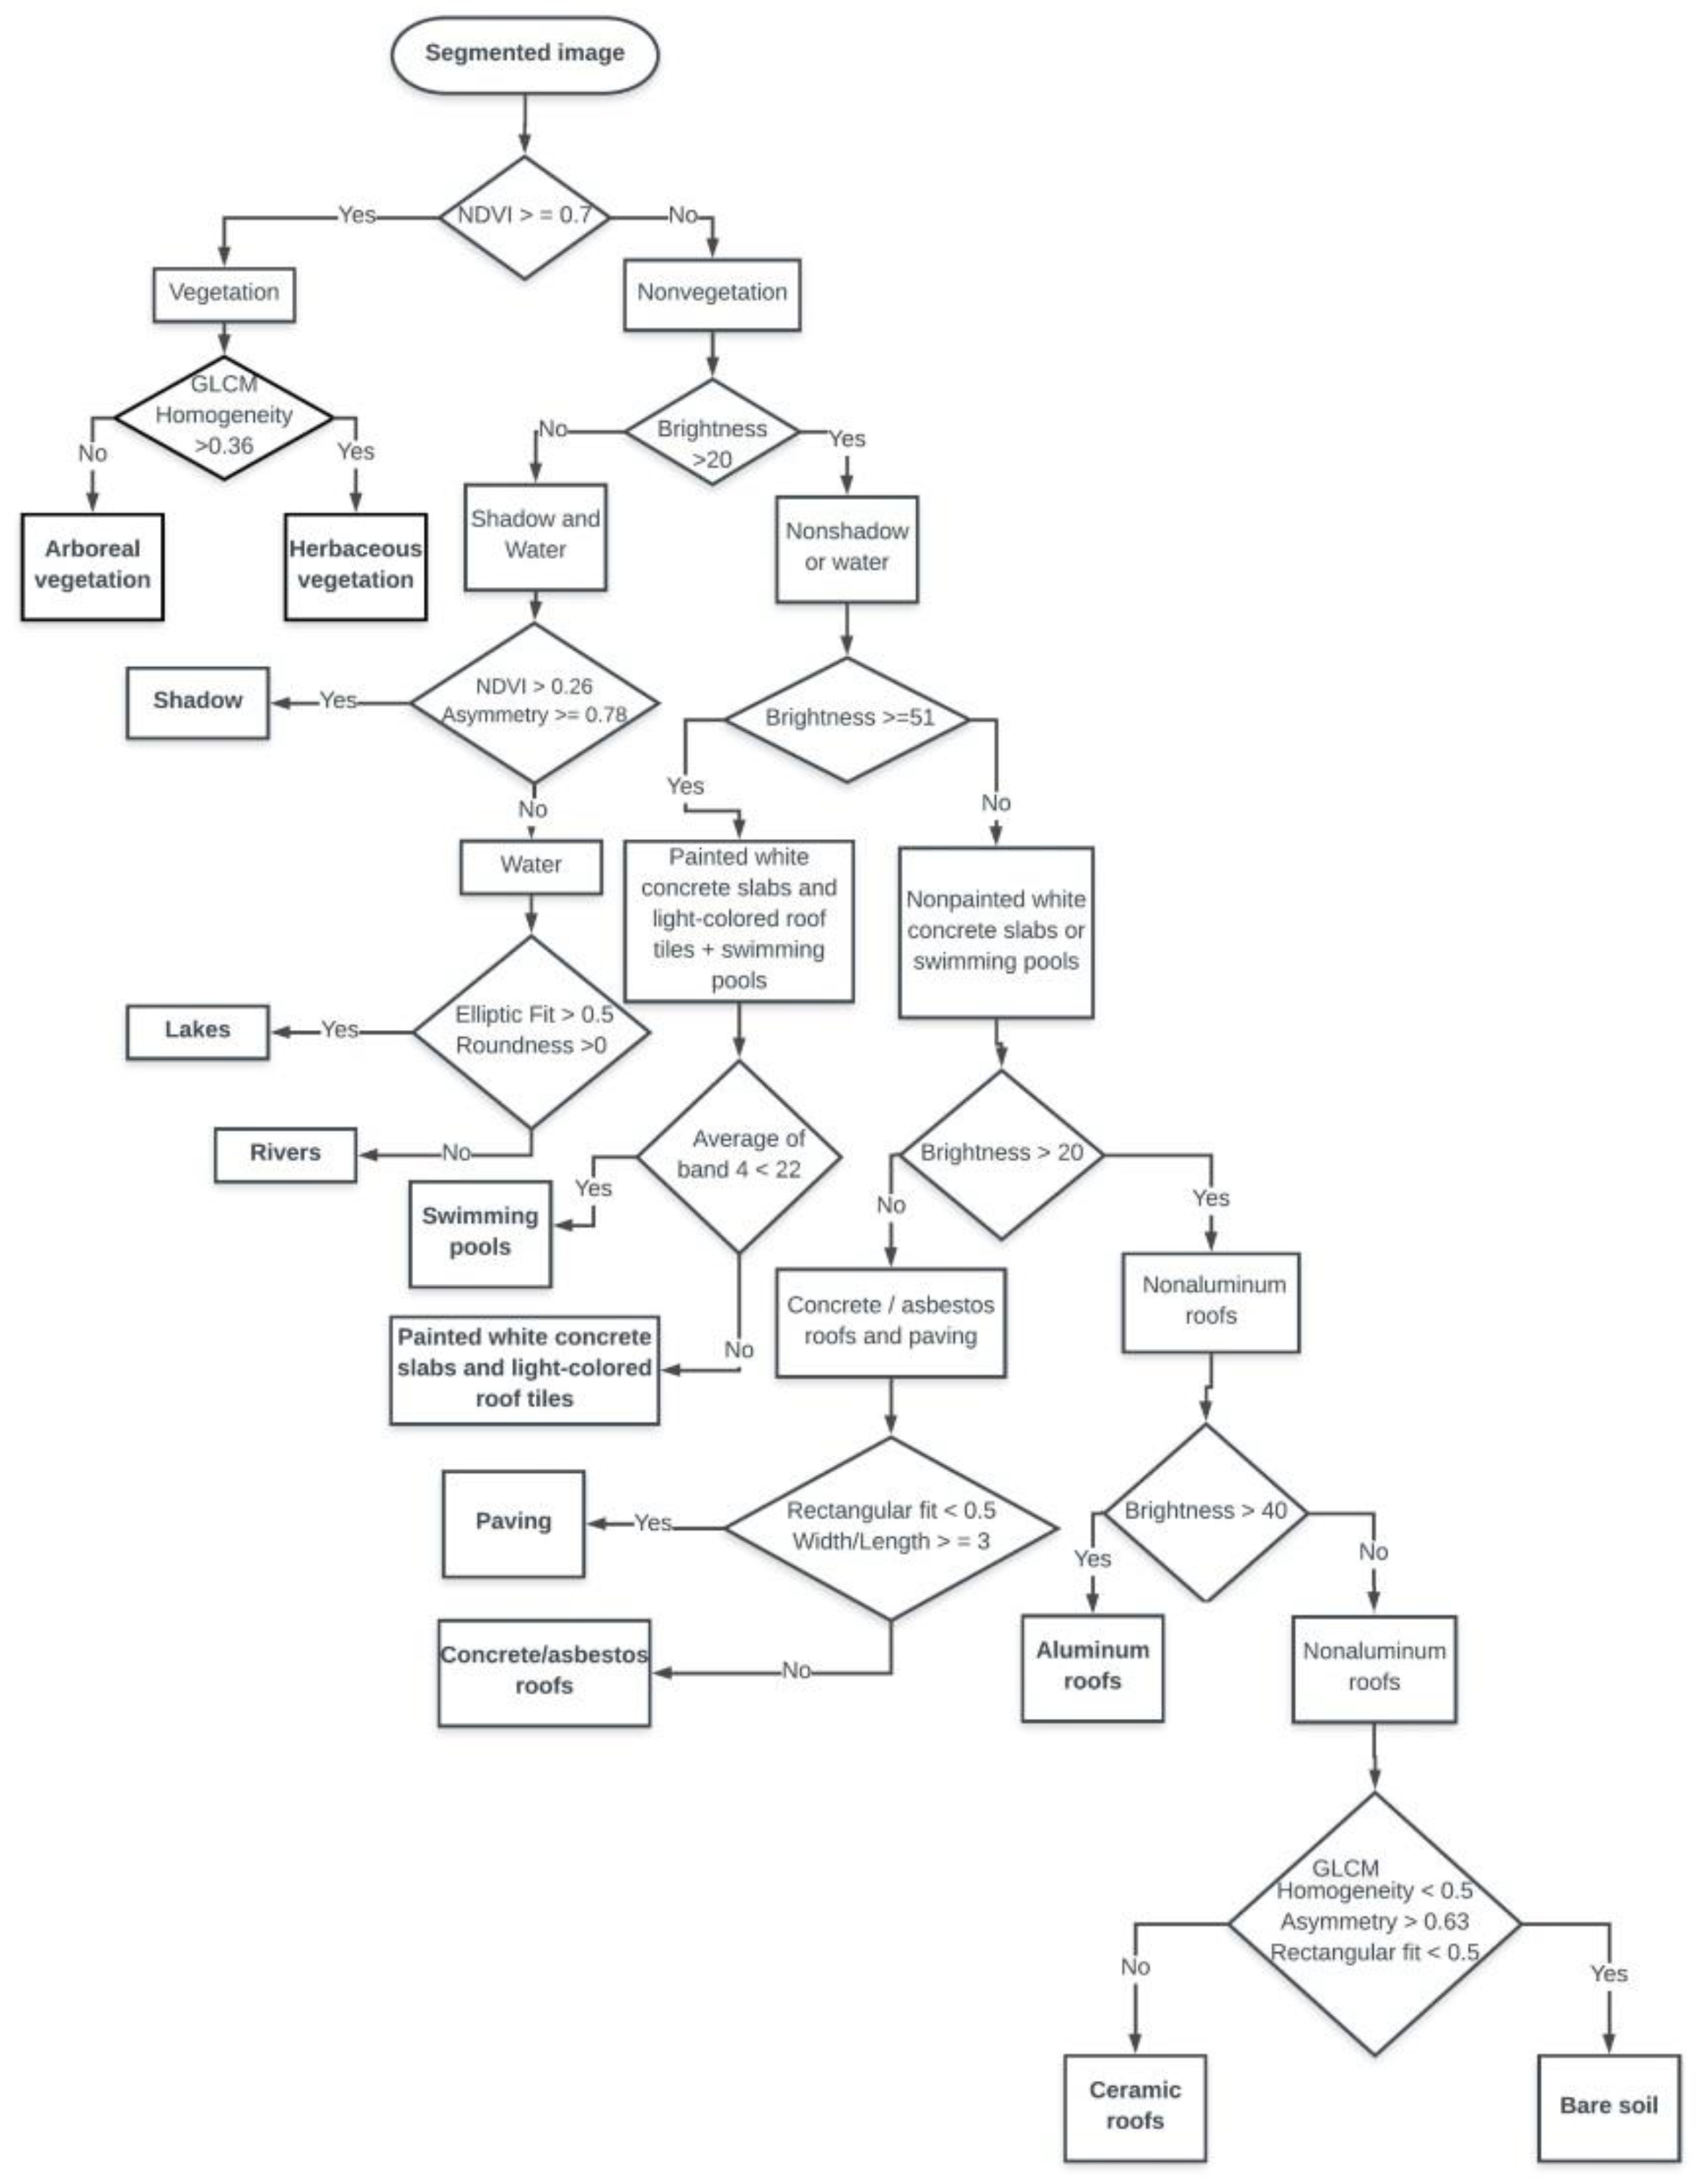
4.2. Land Cover Classes (LCC)
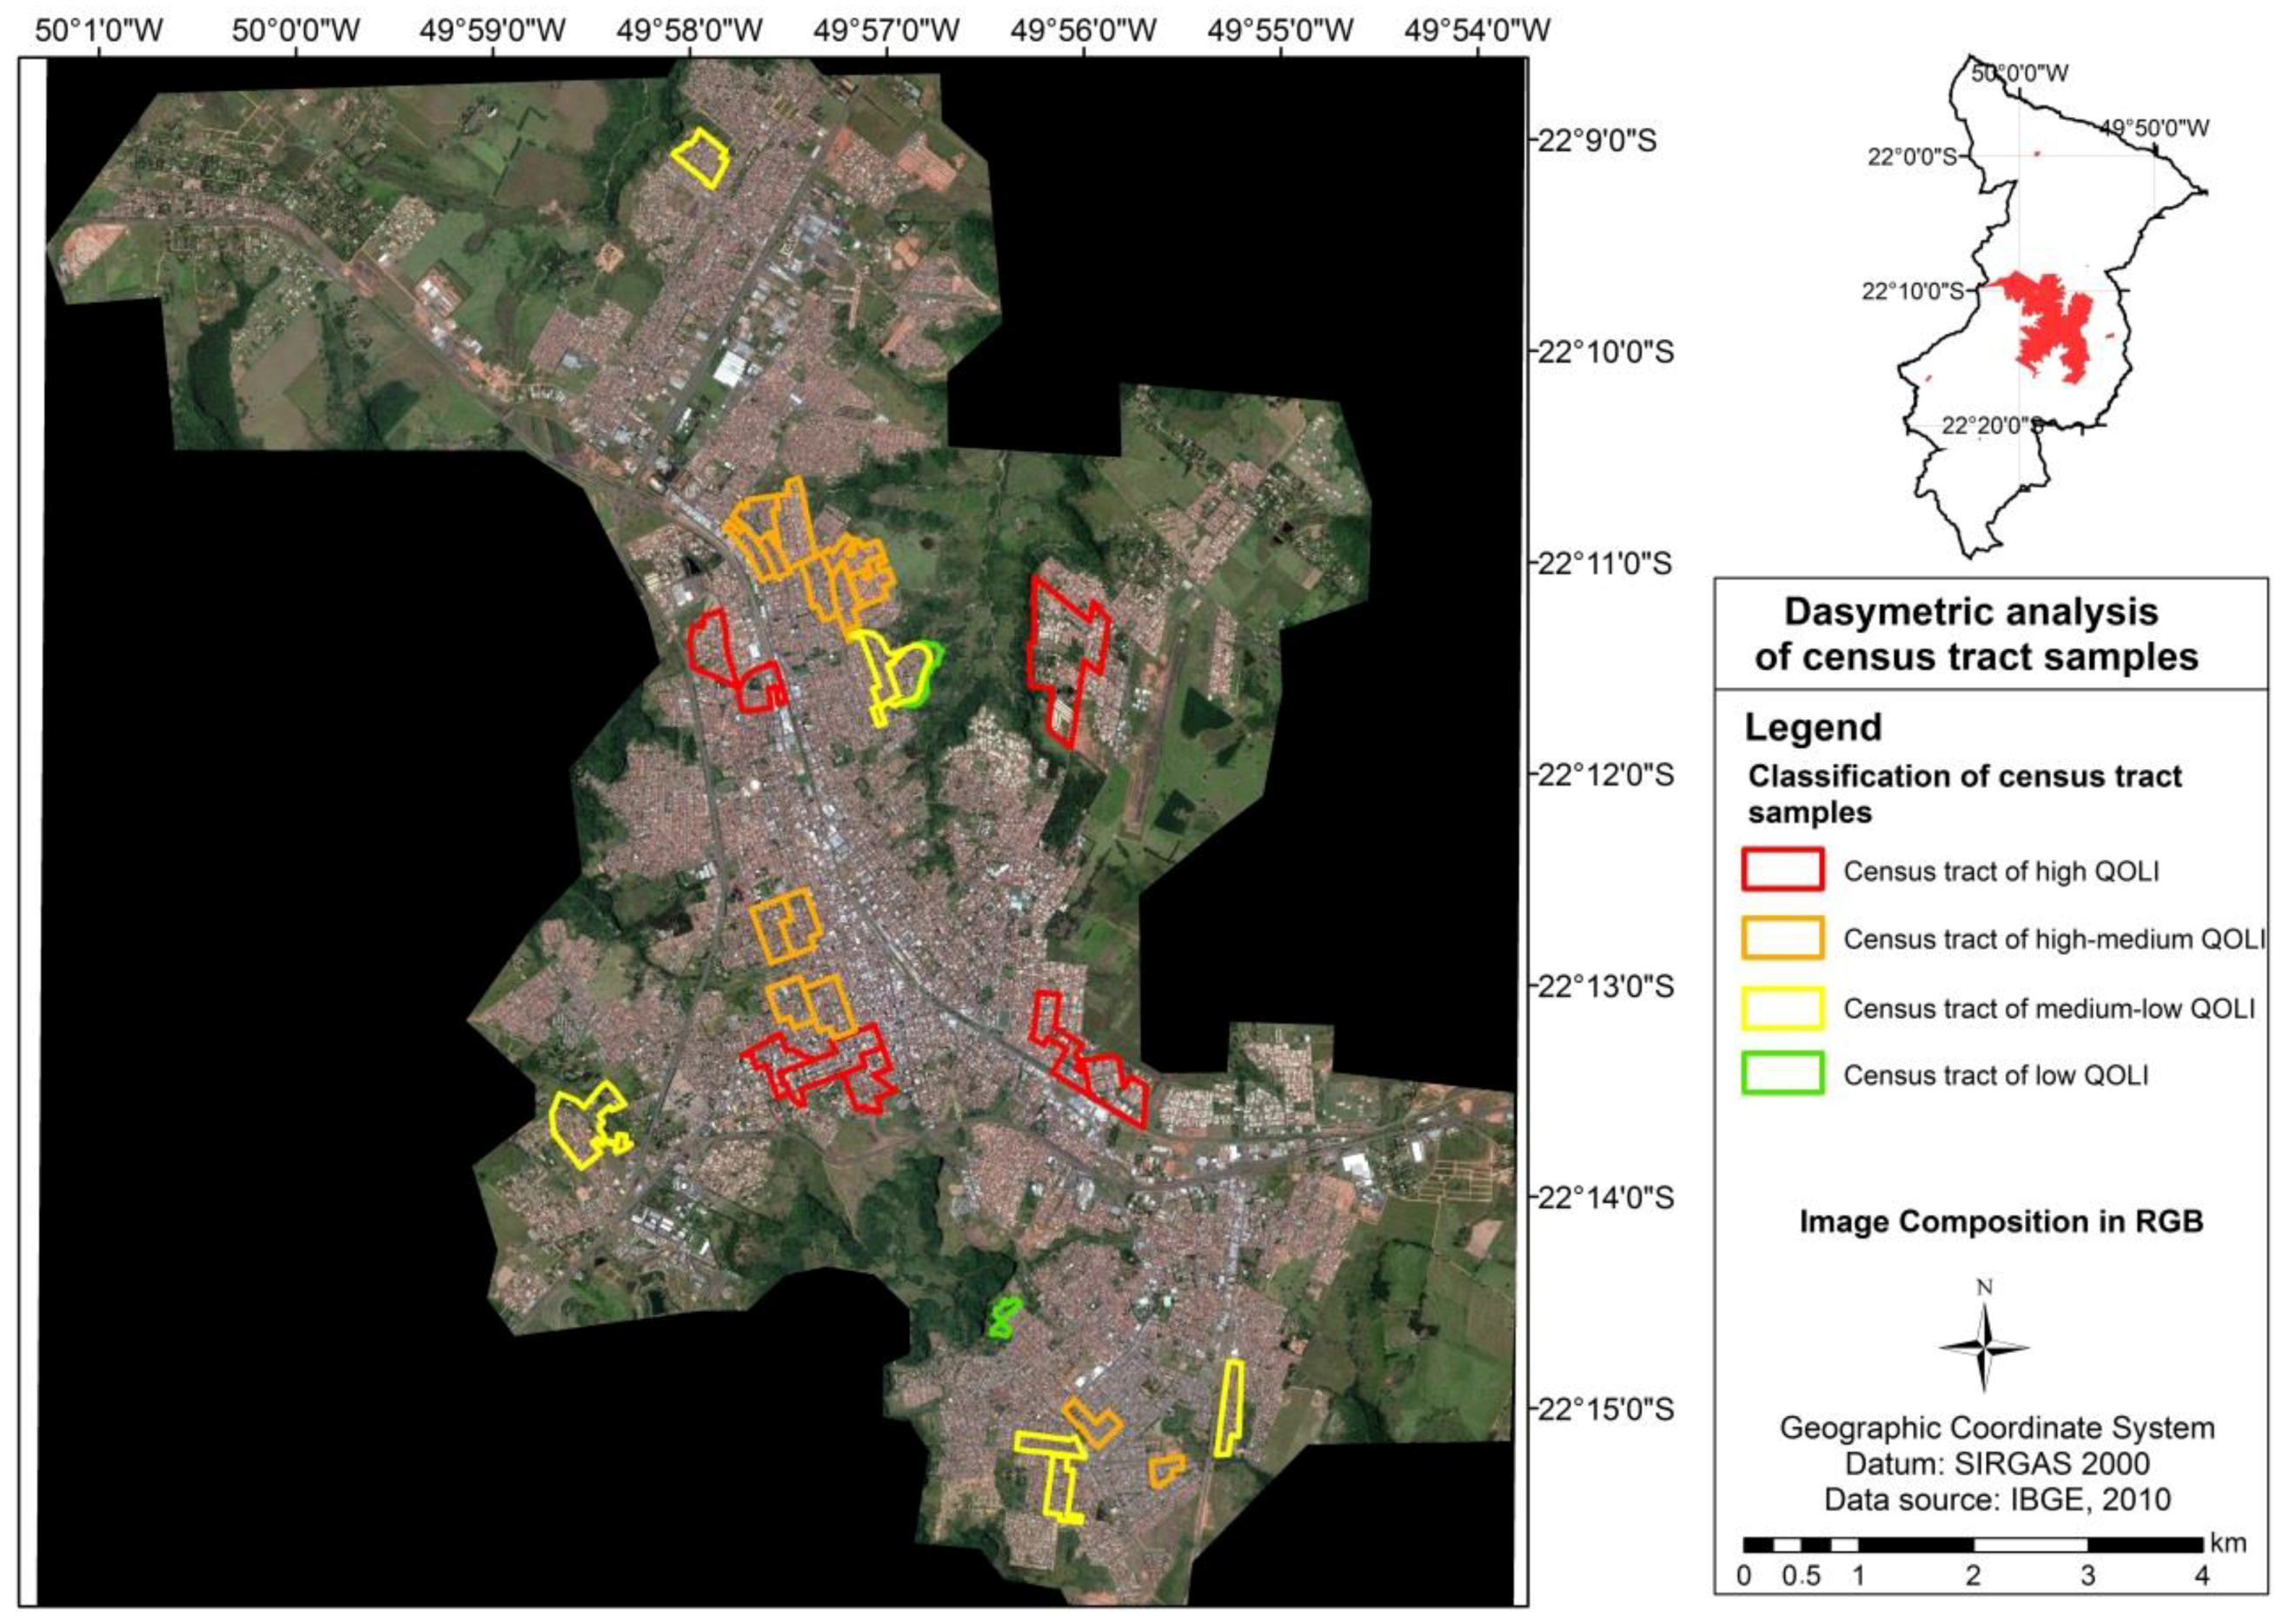
4.3. Census Tract Dasymetry
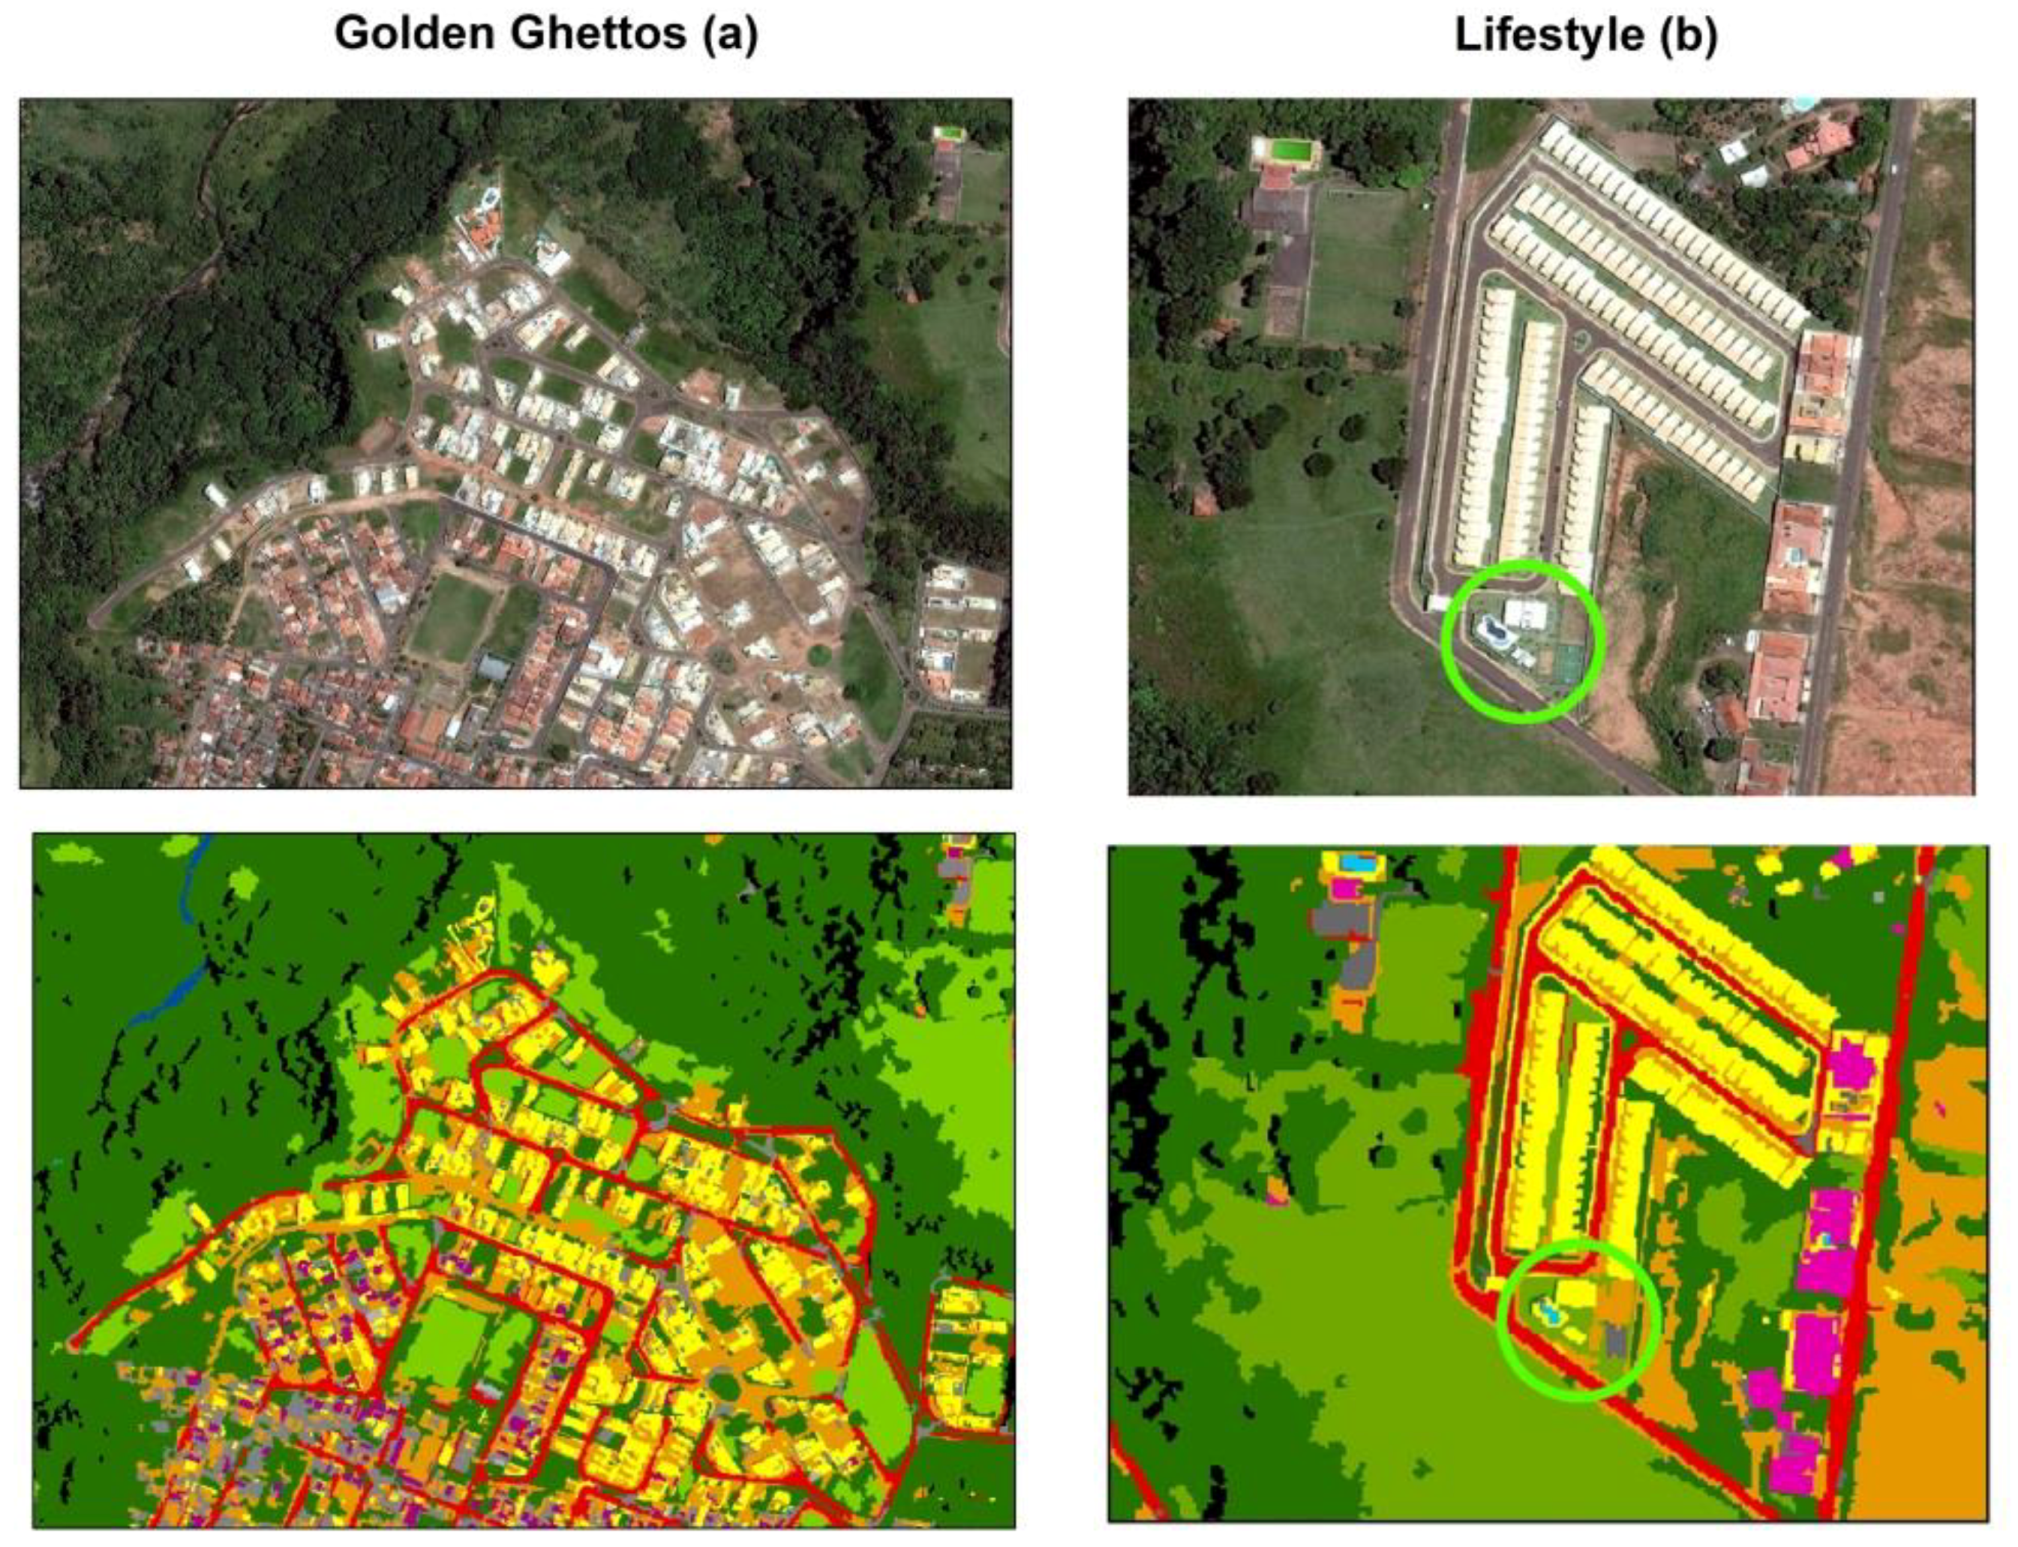
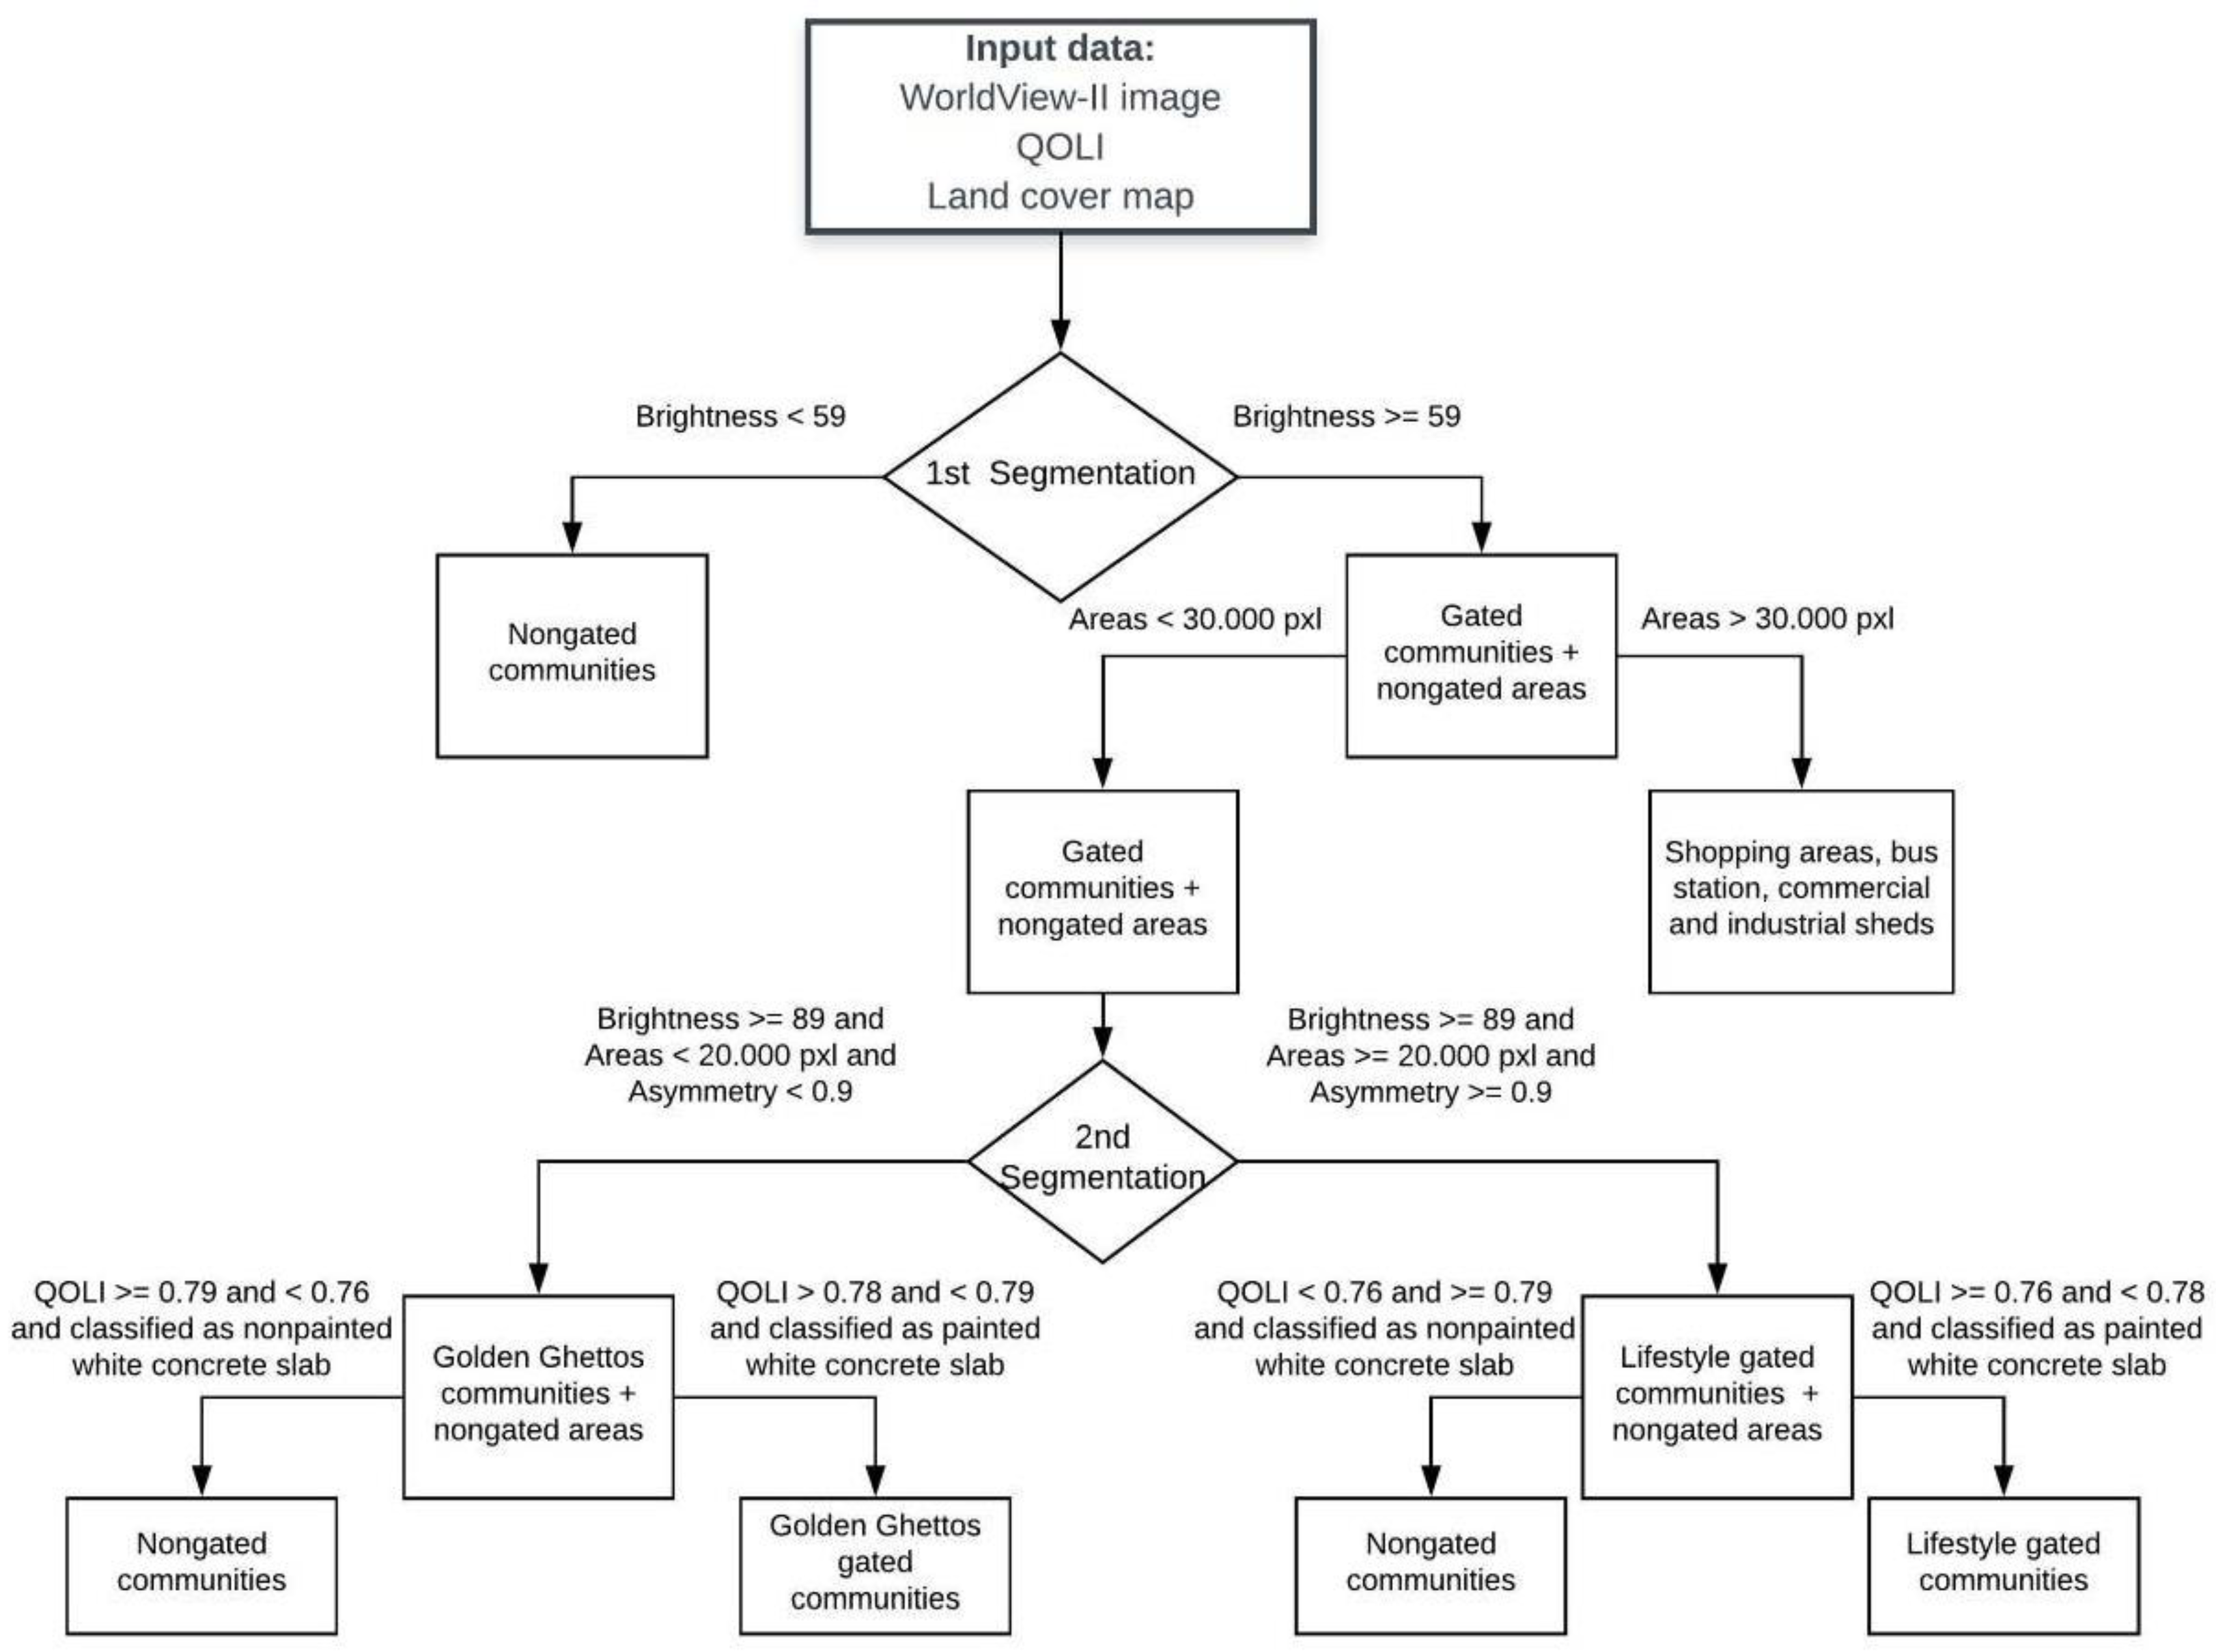
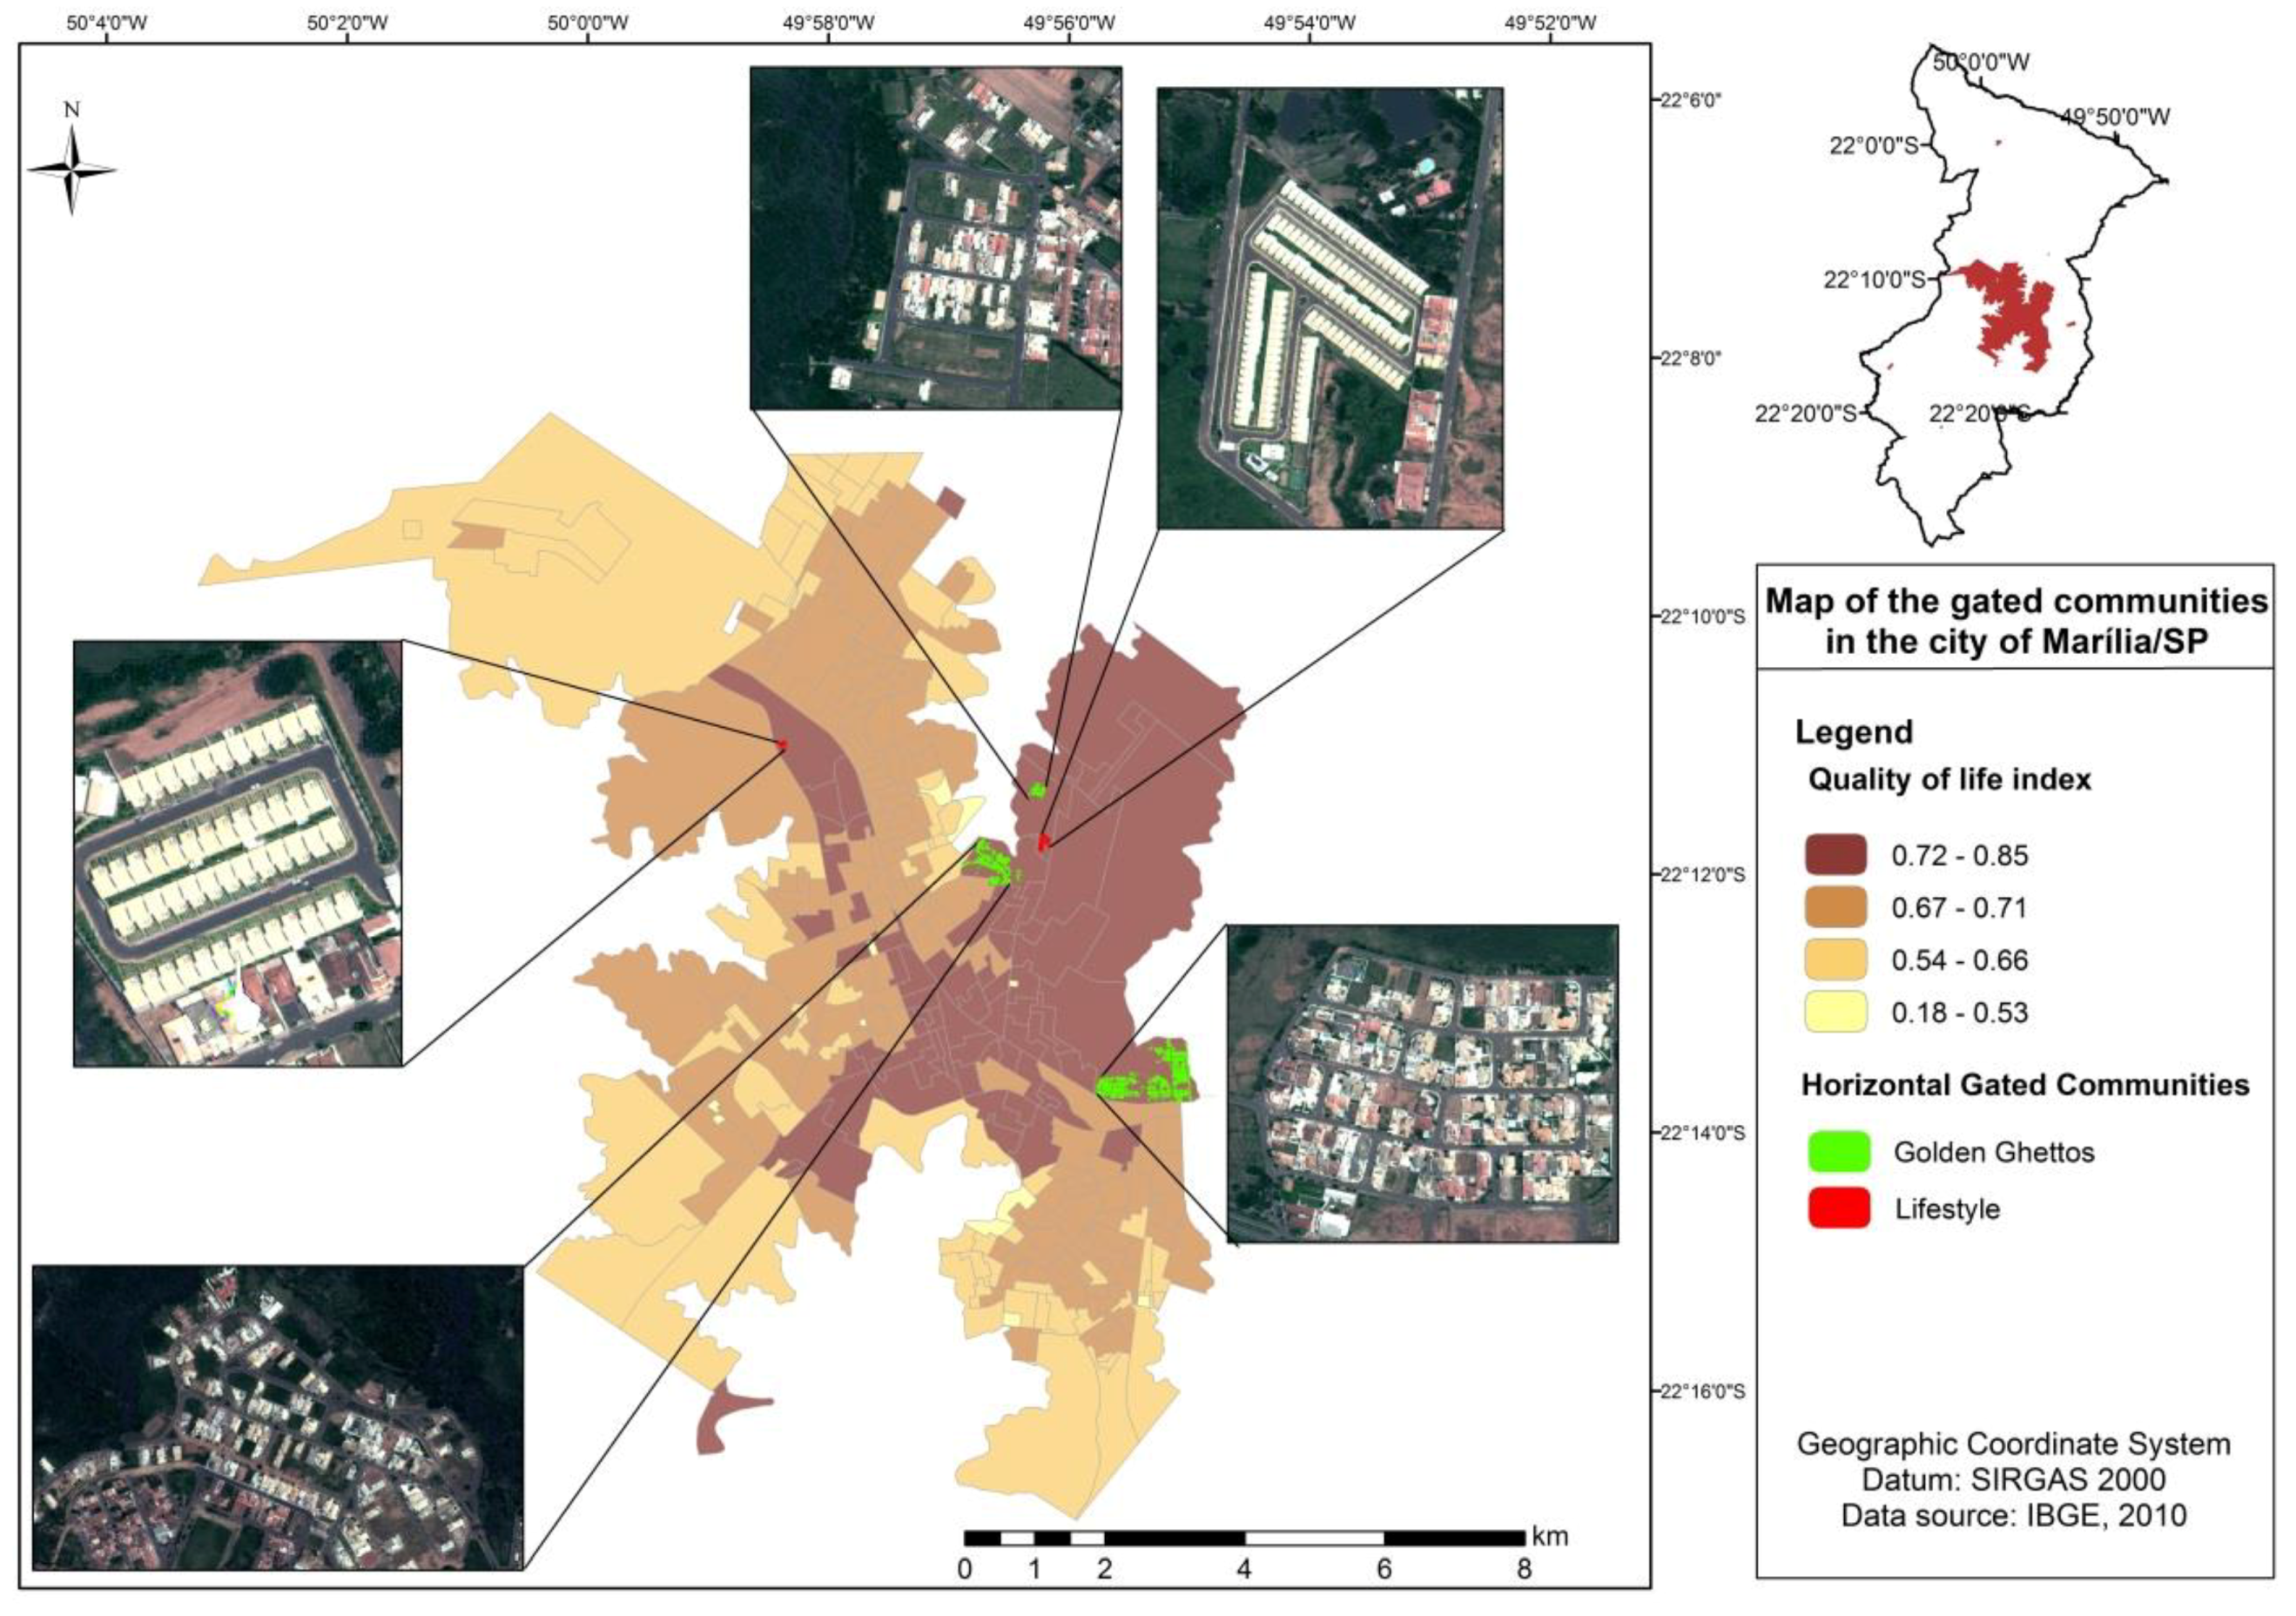
4.4. Mapping the Gated Communities
5. Results
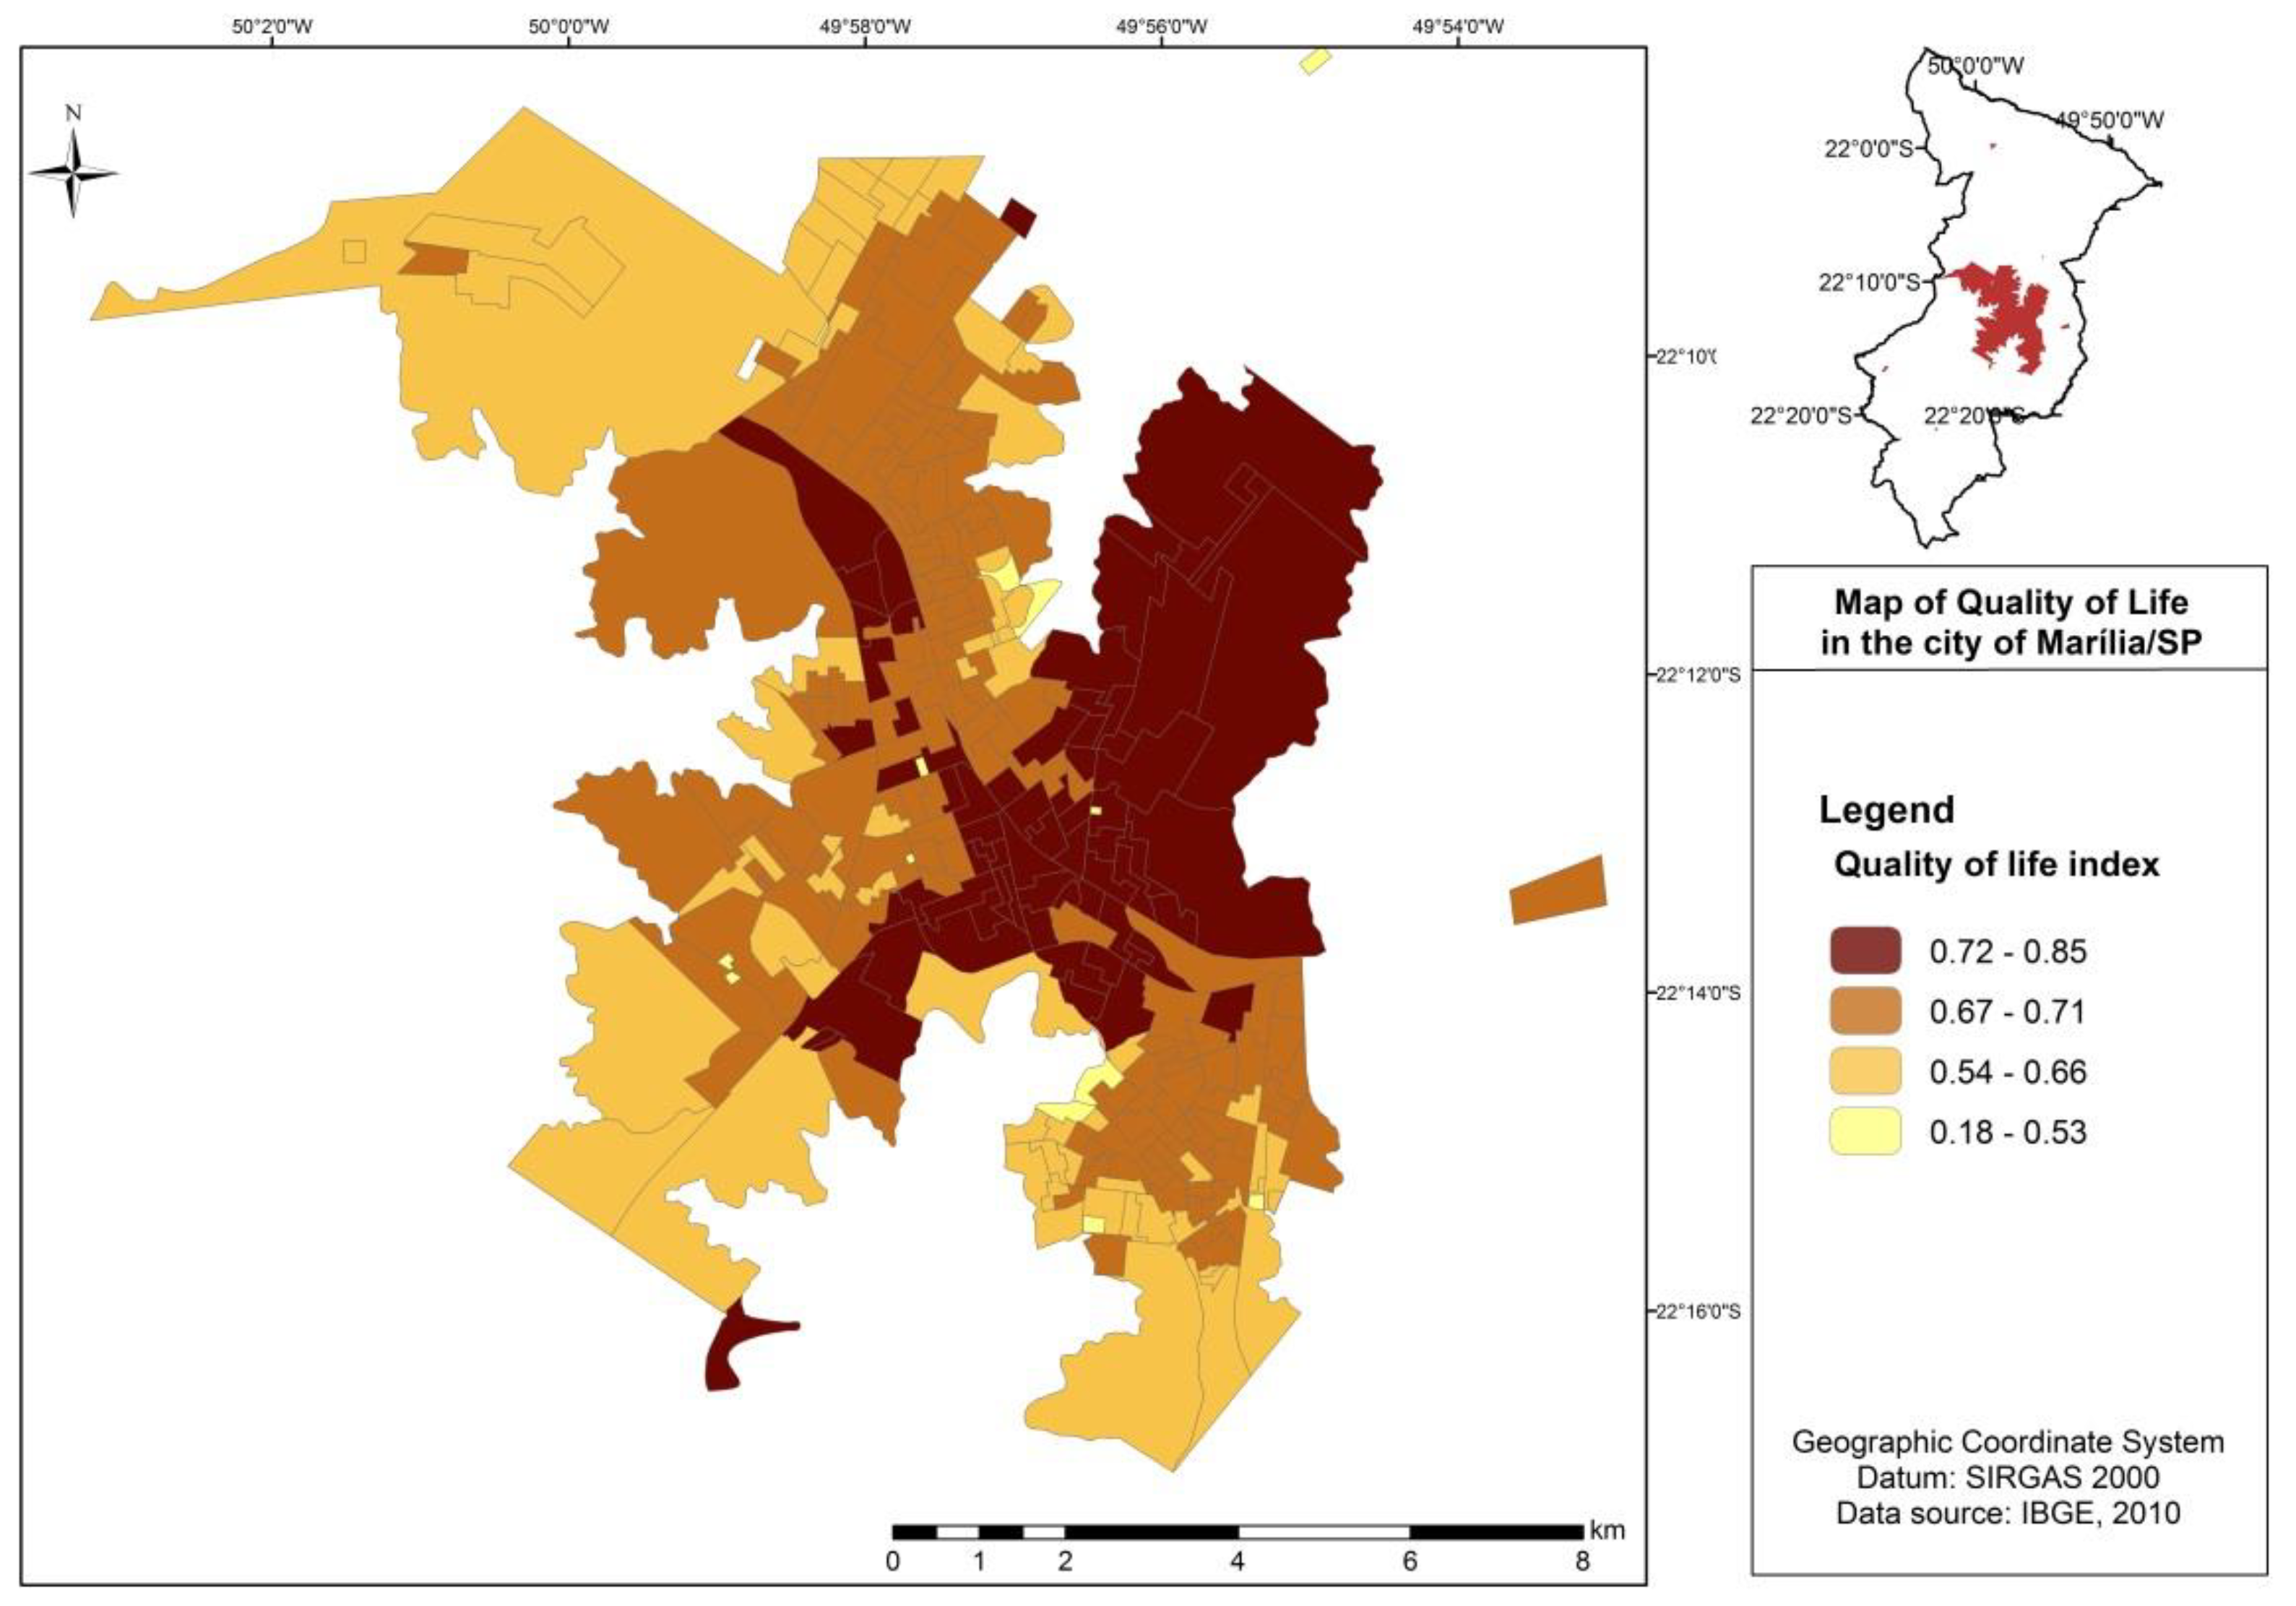
5.1. Positive Correlation between Indices and Cover Classes
5.2. Intra-Urban Land Cover Class Correlations
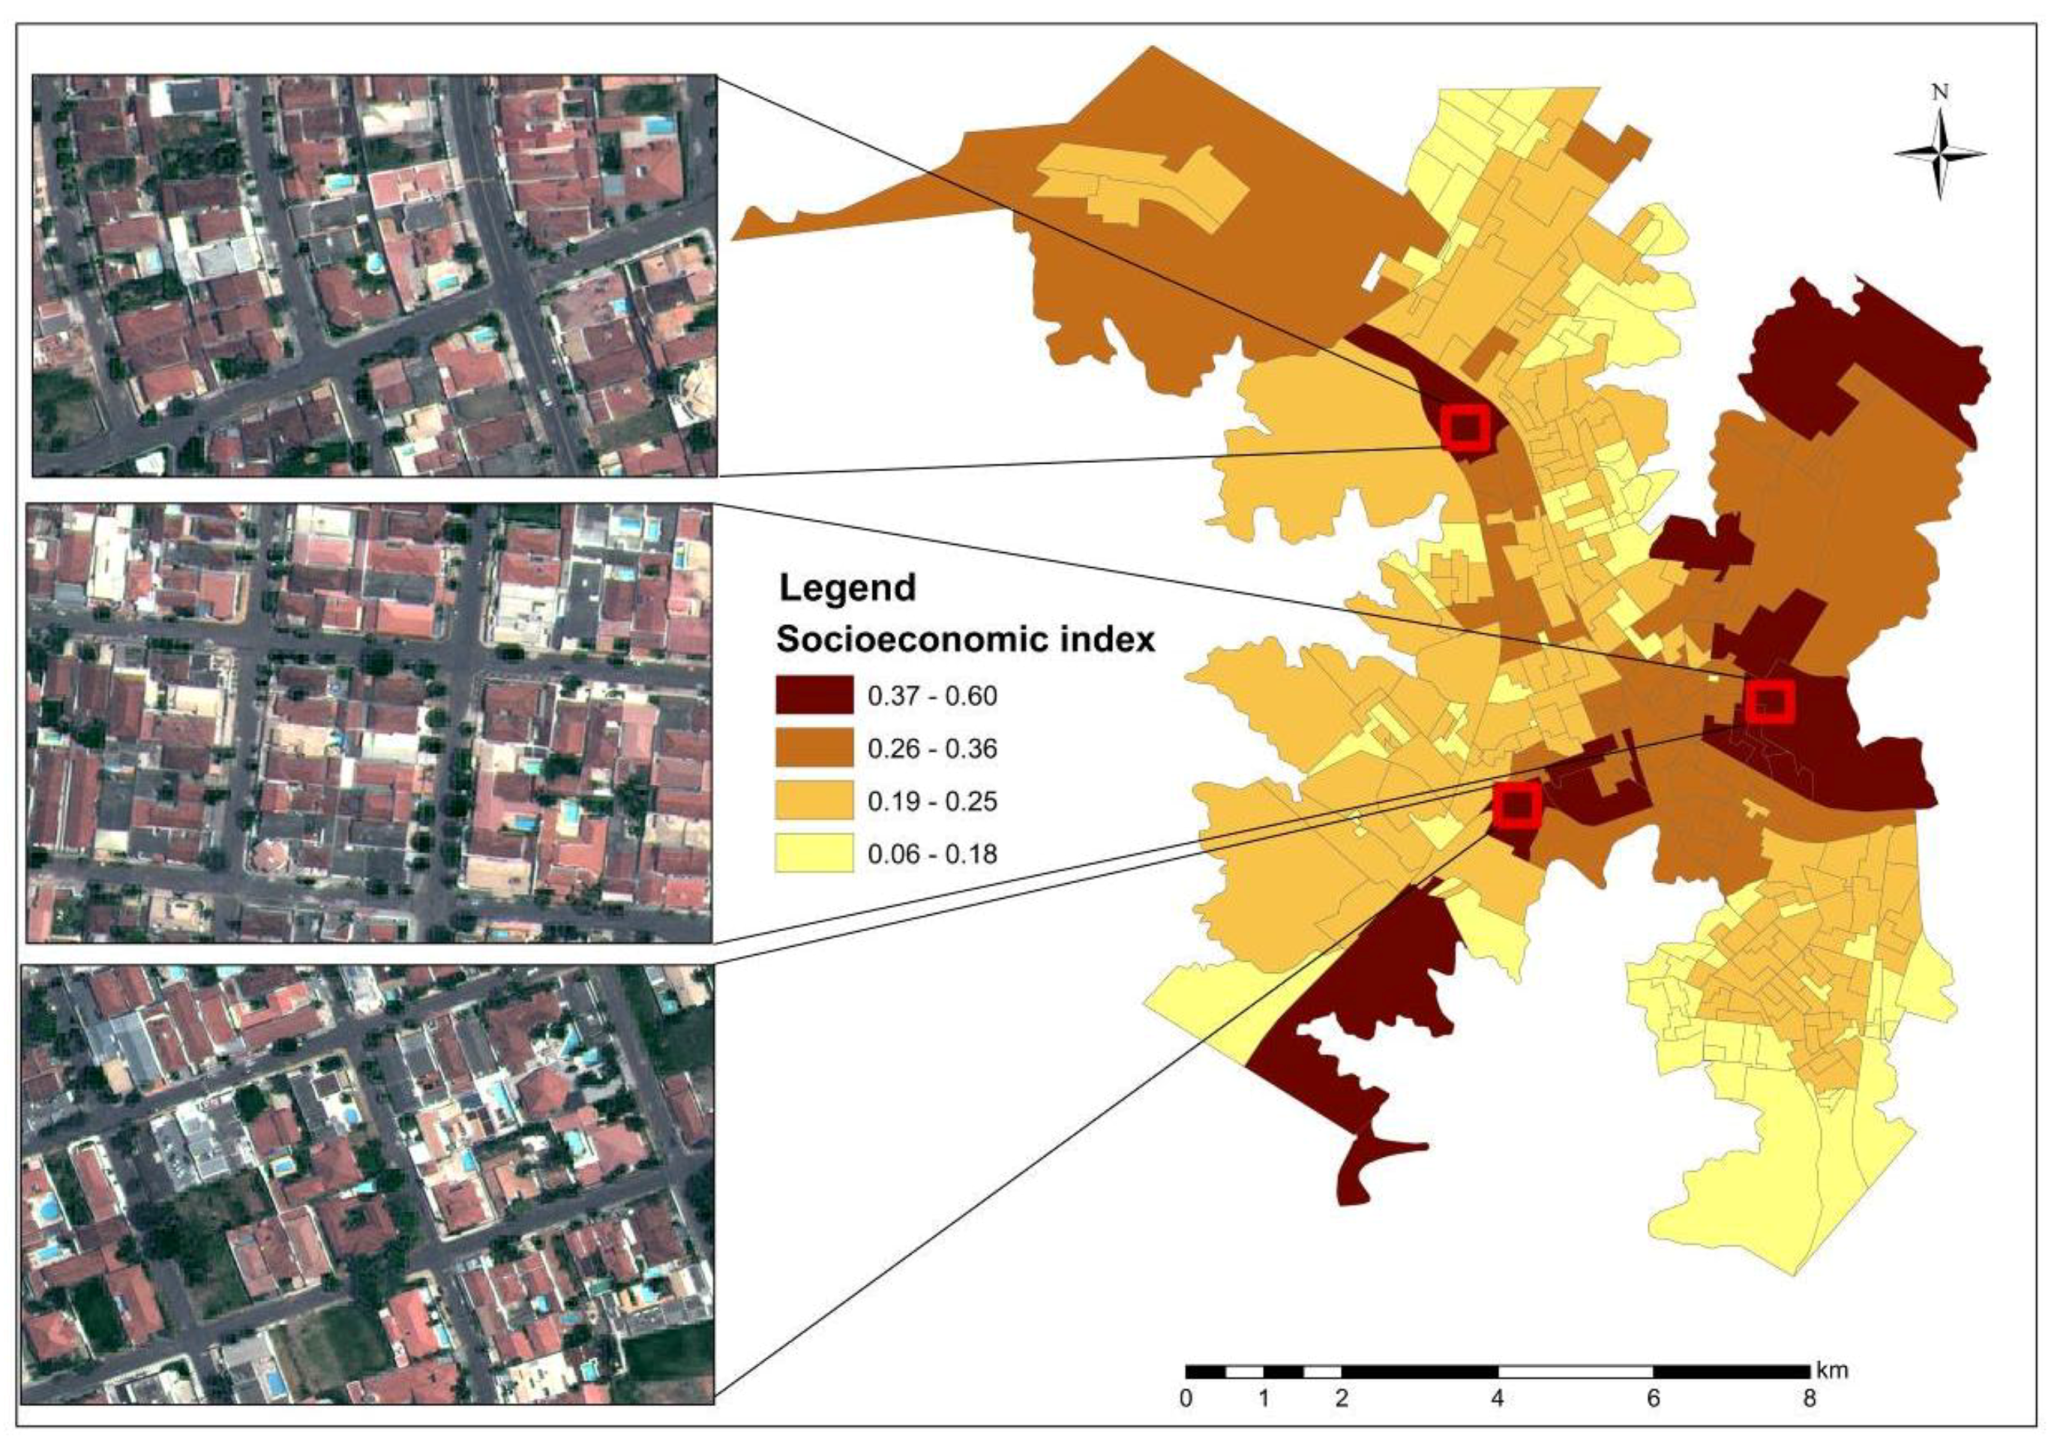
5.3. Positive Correlation between the QOLI and the Presence of GC
6. Discussion
7. Final Considerations
Author Contributions
Funding
Conflicts of Interest
References
- Schuermans, N. Enclave urbanism as telescopic urbanism? Encounters of middle class whites in Cape Town. Cities 2016, 59, 183–192. [Google Scholar] [CrossRef]
- Roitman, S. Who Segregates Whom? The Analysis of a Gated Community in Mendoza, Argentina. Hous. Stud. 2005, 20, 303–321. [Google Scholar] [CrossRef]
- Power, M. Angola 2025: The Future of the “World’s Richest Poor Country” as Seen through a Chinese Rear-View Mirror. Antipode 2012, 44, 993–1014. [Google Scholar] [CrossRef]
- Coy, M.; Pöhler, M. Gated communities in Latin American megacities: Case studies in Brazil and Argentina. Environ. Plan. B Plan. Des. 2002, 29, 355–370. [Google Scholar] [CrossRef]
- Thuillier, G. Gated Communities in the Metropolitan Area of Buenos Aires, Argentina: A challenge for Town Planning. Hous. Stud. 2005, 20, 255–271. [Google Scholar] [CrossRef]
- Hillier, J.; Mcmanus, P. Pull up the drawbridge: Fortress mentality in the suburbs. In Metropolis Now: Planning and the Urban in Contemporary Australia; Gibson, K., Watson, S., Eds.; Pluto Press: Sydney, Australia, 1994; pp. 91–107. ISBN 1864030143. [Google Scholar]
- Gonzalez, D. Bahamians resent the loss of beaches to luxury. New York Times, 29 February 2000; Volume 29, A4. [Google Scholar]
- Caldeira, T.P. City of Walls: Crime, Segregation, and Citizenship in São Paulo; University of California Press: London, UK, 2000; 487p, ISBN 0-520-22142-7. [Google Scholar]
- Carvalho, M.; George, R.V.; Anthony, K.H. Residential satisfaction in condominios exclusivos (gate-guarded neighborhoods) in Brazil. Environ. Behav. 1997, 29, 734–768. [Google Scholar] [CrossRef]
- Grant, J. Planning responses to gated communities in Canada. Hous. Stud. 2005, 20, 273–285. [Google Scholar] [CrossRef]
- Borsdorf, A.; Hidalgo, R.; Sanchez, R. A new model of urban development in Latin America: The gated communities and fenced cities in the metropolitan areas of Santiago de Chile and Valparaíso. Cities 2007, 24, 365–378. [Google Scholar] [CrossRef]
- Pow, C.P. Gated Communities in China: Class, Privilege and the Moral Politics of the Good Life; Routledge: New York, NY, USA, 2009; ISBN 0-415-47810-3. [Google Scholar]
- Zhao, P. Reprint of “An ‘unceasing war’ on land development on the urban fringe of Beijing: A case study of gated informal housing communities”. Cities 2017, 60 Pt B, 139–146. [Google Scholar] [CrossRef]
- Zhao, W.; Zou, Y. Un-gating the gated community: The spatial restructuring of a resettlement neighborhood in Nanjing. Cities 2017, 60, 78–87. [Google Scholar] [CrossRef]
- Wu, F.; Webber, K. The rise of “foreign gated communities” in Beijing: Between economic globalization and local institutions. Cities 2004, 21, 203–213. [Google Scholar] [CrossRef]
- Blandy, S. Gated communities in England: Historical perspectives and current developments. GeoJournal 2006, 66, 15–26. [Google Scholar] [CrossRef]
- Carrasquillo, C.A.S. Gated communities and city marketing: Recent trends in Guaynabo, Puerto Rico. Cities 2011, 28, 444–451. [Google Scholar] [CrossRef]
- Raposo, R. Gated communities, commodification and aestheticization: The case of the Lisbon metropolitan area. GeoJournal 2006, 66, 43–56. [Google Scholar] [CrossRef]
- Blinnikov, M.; Shanin, A.; Soboley, N.; Volkova, L. Gated communities of the Moscow green belt: Newly segregated landscapes and the suburban Russian environment. GeoJournal 2006, 66, 65–81. [Google Scholar] [CrossRef]
- Glasze, G.; Alkhayyal, A. Gated housing estates in the Arab world: Case studies in Lebanon and Riyadh, Saudi Arabia. Environ. Plan. B Plan. Des. 2002, 29, 321–336. [Google Scholar] [CrossRef]
- Jürgens, U.; Landmann, K. Gated communities in South Africa. In Private Cities: Global and Local Perspectives; Glasze, G., Webster, C.J., Frantz, K., Eds.; Routledge, Taylor and Francis: London, UK, 2006; pp. 109–126. ISBN 0-415-34170-1. [Google Scholar]
- Elhadary, Y.; Ali, S. A New Trend in Urban Housing: Gated Communities in Khartoum, Sudan. Am. J. Sociol. Res. 2017, 7, 45–55. [Google Scholar] [CrossRef]
- Atkinson, R.; Blandy, S. Introduction: International perspectives on the new enclavism and the rise of gated communities. Hous. Stud. 2005, 20, 177–186. [Google Scholar] [CrossRef]
- Blakely, E.J.; Snyder, M.G. Fortress America: Gated Communities in the United States; Brookings Institution Press & Lincoln Institute of Land Policy: Washington, DC, USA; Cambridge, MA, USA, 1997; 208p, ISBN 0815791070. [Google Scholar]
- Lang, R.E.; Danielsen, K.A. Gated communities in America: Walling out the world? Hous. Policy Debate 1997, 8, 867–899. [Google Scholar] [CrossRef]
- Paulin, D. Rising crime rate has city dwellers seeking safety in apartments and gated communities. Globe Mail 1997, 23, A12. [Google Scholar]
- Lemanski, C. A new apartheid? The spatial implications of fear of crime in Cape Town, South Africa. Environ. Urban. 2004, 16, 101–112. [Google Scholar] [CrossRef] [Green Version]
- Irazábal, C. Localizing Urban Design Traditions: Gated and Edge Cities in Curitiba. J. Urban Des. 2006, 11, 73–96. [Google Scholar] [CrossRef]
- Coy, M. Gated communities and urban fragmentation in Latin America: The Brazilian experience. GeoJournal 2006, 66, 121–132. [Google Scholar] [CrossRef]
- Olajide, S.E.; Lizam, M. Gated Communities and Property Fencing: A Response to Residential Neighbourhood Crime. Br. J. Educ. Soc. Behav. Sci. 2016, 13, 1–9. [Google Scholar] [CrossRef]
- Azocar, G.; Romero, H.; Sanhueza, R.; Vega, C.; Aguayo, M.; Munoz, M.D. Urbanization patterns and their impacts on social restructuring of urban space in Chilean mid-cities: The case of Los Angeles, Central Chile. Land Use Policy 2007, 24, 199–211. [Google Scholar] [CrossRef]
- Estoque, R.C.; Murayama, Y. Intensity and spatial pattern of urban land changes in the megacities of Southeast Asia. Land Use Policy 2015, 48, 213–222. [Google Scholar] [CrossRef]
- Filion, P.; Hammond, K. Neighborhood land use and performance: The evolution of neighborhood morphology over the 20th century. Environ. Plan. B 2003, 30, 271–296. [Google Scholar] [CrossRef]
- Puertas, O.L.; Henríquez, C.; Meza, F.J. Assessing spatial dynamics of urban growths using land use model. Application in Santiago metropolitan area, 2010-2045. Land Use Policy 2014, 38, 415–425. [Google Scholar] [CrossRef]
- Taubënbock, H.; Roth, A.; Dech, S. Linking structural urban characteristics derived from high resolution satellite data to population distribution. In Urban and Regional Data Management, UDMS Annual 2007; Taylor & Francis: London, UK, 2008; pp. 35–45. ISBN 978-0-415-44059-2. [Google Scholar]
- Hay, G.J.; Castilla, G. Geographic Object-Based Image Analysis (GEOBIA): A new name for a new discipline. In Object-Based Image Analysis; Springer: Berlin/Heidelberg, Germany, 2008; pp. 75–89. [Google Scholar]
- Hofmann, P.; Strobl, J.; Blaschke, T.; Kux, H.J. Detecting informal settlements from QuickBird data in Rio de Janeiro using an object-based approach. In Object Based Image Analysis; Blaschke, T., Lang, S., Hay, G.J., Eds.; Springer: Berlin/Heidelberg, Germany, 2008; pp. 531–554. [Google Scholar]
- Walker, J.S.; Blaschke, T. Object-based land-cover classification for the Phoenix metropolitan area: Optimization vs. transportability. Int. J. Remote Sens. 2008, 29, 2021–2040. [Google Scholar] [CrossRef]
- Brum-Bastos, V.S.; Ribeiro, B.M.G.; Pinho, C.M.D.; Korting, T.S.; Fonseca, L.M.G. Improvement evaluation on ceramic roof extraction using WorldView-2 imagery and geographical data mining approach. Int. Arch. Photogram. Remote Sens. Spat. Inf. Sci. 2016, XLI-B7, 883–889. [Google Scholar] [CrossRef]
- Benz, U.C.; Hofmann, P.; Willhauck, G.; Lingenfelder, I.; Heynen, M. Multi-resolution, object-oriented fuzzy analysis of remote sensing data for GIS-ready information. ISPRS J. Photogram. Remote Sens. 2004, 58, 239–258. [Google Scholar] [CrossRef] [Green Version]
- Low, S.M. The edge and the center: Gated communities and the discourse of urban fear. Am. Anthropol. 2001, 103, 45–58. [Google Scholar] [CrossRef]
- Wilson-Doenges, G. An exploration of sense of community and fear of crime in gated communities. Environ. Behav. 2000, 32, 597–611. [Google Scholar] [CrossRef]
- Grant, J.; Mittelsteadt, L. Types of Gated Communities. Environ. Plan. B Urban Anal. City Sci. 2004, 31, 913–930. [Google Scholar] [CrossRef] [Green Version]
- Woo, Y.; Webster, C. Co-evolution of gated communities and local public goods. Urban Stud. 2014, 51, 2539–2554. [Google Scholar] [CrossRef]
- Sabatini, F.; Salcedo, R. Gated communities and the poor in Santiago, Chile: Functional and symbolic integration in a context of aggressive capitalist colonization of lower-class areas. Hous. Policy Debate 2007, 18, 577–606. [Google Scholar] [CrossRef]
- Le Goix, R. Gated Communities: Sprawl and Social Segregation in Southern California. Hous. Stud. 2005, 20, 323–343. [Google Scholar] [CrossRef] [Green Version]
- Webster, C.; Lai, L. Property Rights, Planning and Markets: Managing Spontaneous Cities; Edgar Elgar Publishing Limited: Massachussets, MA, USA, 2003; 310p, ISBN 1-84064-904-6. [Google Scholar]
- Instituto Brasileiro De Geografia E Estatística—IBGE. Cidades. Available online: http://cidades.ibge.gov.br/brasil/sp/marilia/panorama (accessed on 20 June 2018).
- Instituto Brasileiro De Geografia e Estatística—IBGE. Censo Demográfico de 2010; Centro de Documentação e Disseminação de Informações: Rio de Janeiro, Brazil, 2011.
- Kottek, M.; Grieser, J.; Beck, C.; Rudolf, B.; Rubel, F. World map of the Köppen-Geiger climate classification updated. Meteorol. Z. 2006, 15, 259–263. [Google Scholar] [CrossRef]
- CPTEC/INPE. Análise Climática de Marília/SP. Available online: https://pt.climate-data.org (accessed on 22 September 2017).
- Secretaria De Segurança Pública Do Estado De São Paulo—SSP 160/01 Relatório de Estatísticas de Ocorrências Criminais por Região. Available online: http://www.ssp.sp.gov.br/Estatistica (accessed on 22 September 2017).
- Jannuzzi, P.M. Indicadores Sociais no Brasil—Conceitos, Fontes de Dados e Aplicações Para: Formulações e Avaliações de Políticas Públicas e Elaboração de Estudos Socioeconômicos; Editora Alínea: Campinas, Brazil, 2009; 141p, ISBN 8586491950. [Google Scholar]
- Eicher, C.L.; Brewer, C.A. Dasymetric Mapping and Areal Interpolation: Implementation and Evaluation. Cartogr. Geogr. Inf. Sci. 2001, 28, 125–138. [Google Scholar] [CrossRef]
- Petrov, A. One Hundred Years of Dasymetric Mapping: Back to the Origin. Cartogr. J. 2012, 49, 256–264. [Google Scholar] [CrossRef]
- Abrahamson, M. Urban Enclaves: Identity and Place in America; Series Contemporary Social Issues; St. Martin’s Press: New York, NY, USA, 1996; 152p, ISBN 0312114990. [Google Scholar]
- Mukaka, M.M. A guide to appropriate use of Correlation coefficient in medical research. Malawi Med. J. 2012, 23, 69–71. [Google Scholar]
- Santamouris, M.; Synnefa, A.; Karlessi, T. Using advanced cool materials in the urban built environment to mitigate heat islands and improve thermal comfort conditions. Sol. Energy 2011, 85, 3085–3102. [Google Scholar] [CrossRef]
- Le Goix, R.; Webster, C.J. Gated communities. Geogr. Compass 2008, 2, 1189–1214. [Google Scholar] [CrossRef] [Green Version]


| Type of Attribute | Quantifiable Attribute | Mathematical Formulation | Description |
|---|---|---|---|
| Spectral | Normalized Difference Vegetation Index (NDVI) | NDVI = mean () | The NDVI is the value between −1.0 and +1.0 |
| Brightness | B = | B is the mean brightness of an object and is the sum of all the mean brightness values in the visible bands divided by the corresponding number of visible bands | |
| Average of band 4 (NIR) | Band 4 = mean (NIR) | The average of band 4 is the mean value of an object in band 4 (NIR) | |
| Measures how symmetrical the objects are: | |||
| Geometric | Asymmetry | 1 − | = is the minimum eigenvalue = is the maximum eigenvalue |
| Roundness | , for 0 ≤ x − C ≥ 1 − C | Describes how well (x) an image object fits into a circle (C); values are between 1 (perfect fit) and 0 (no fit) | |
| Elliptic Fit | , for 0 ≤ x − E ≥ 1 − E | Describes how well (x) an image object fits into an ellipse (E); values are between 1 (perfect fit) and 0 (no fit) | |
| Rectangular Fit | , for 0 ≤ x – T ≥ 1 − T | Describes how well (x) an image object fits into a rectangle (T); values are between 1 (perfect fit) and 0 (no fit) | |
| Shape Length/Width | Length of the image object Width of the image object | ||
| Area | A = n° pixels | Area is a measure of the number of pixels inside each object | |
| Textural | GLCM Homogeneity | H = | The measure of sensitivity to the presence of near diagonal elements in a GLCM (gray level co-occurrence matrix) is the number of gray levels and is the entry i,j in the GLCM |
| # | Herbaceous Vegetation | Ceramic Roofs | Arboreal Vegetation | Shadows | Bare Soil | Pavement | Aluminum Roofs | Painted White Concrete Slab/Light-Colored Roof Tiles | Cement Roofs | Pools | Lakes | Classes | |
|---|---|---|---|---|---|---|---|---|---|---|---|---|---|
| Herbaceous vegetation | 26 | 0 | 7 | 0 | 0 | 0 | 0 | 0 | 0 | 0 | 0 | 33 (7.5%) | |
| Ceramic roofs | 0 | 47 | 1 | 0 | 15 | 0 | 0 | 3 | 4 | 0 | 0 | 70 (15.9%) | |
| Arboreal vegetation | 0 | 0 | 35 | 0 | 0 | 0 | 0 | 0 | 1 | 0 | 0 | 36 (8.2%) | |
| Shadows | 0 | 0 | 1 | 1 | 0 | 0 | 0 | 0 | 0 | 0 | 0 | 2 (0.5%) | |
| Bare soil | 0 | 0 | 0 | 0 | 56 | 0 | 0 | 1 | 0 | 0 | 0 | 57 (13.0%) | |
| Pavement | 0 | 0 | 0 | 0 | 0 | 51 | 0 | 0 | 6 | 0 | 0 | 57 (13.0%) | |
| Aluminum roofs | 0 | 0 | 0 | 0 | 4 | 1 | 33 | 1 | 1 | 0 | 0 | 40 (9.1%) | |
| Painted white concrete slab/light-colored roof tiles | 0 | 0 | 0 | 1 | 1 | 0 | 0 | 73 | 0 | 0 | 0 | 75 (17.0%) | |
| Cement roofs | 0 | 0 | 0 | 0 | 1 | 5 | 0 | 0 | 48 | 0 | 0 | 54 (12.3%) | |
| Pools | 0 | 0 | 0 | 0 | 0 | 0 | 0 | 1 | 0 | 10 | 0 | 11 (2.5%) | |
| Lakes | 0 | 0 | 0 | 0 | 0 | 0 | 0 | 0 | 0 | 0 | 5 | 5 (1.1%) | |
| Field truth | 26 (5.9%) | 47 (10.7%) | 44 (10.0%) | 2 (0.5%) | 77 (17.5%) | 57 (13.0%) | 33 (7.5%) | 79 (18.0%) | 60 (13.6%) | 10 (2.3%) | 5 (1.1%) | 440 | |
| Observed Agreement: 87.5% | |||||||||||||
| Chance Agreement: 12.39% | |||||||||||||
| Kappa Coefficient: 85.73% | |||||||||||||
| Areas of the Land Cover Classes | Quality of Life Index (QOLI) | Household Environmental Quality Indicator (HEQI) | Educational indicator (EDUI) | Economic indicator (ECOI) |
|---|---|---|---|---|
| Arboreal Vegetation Area (HERBVA) | 0.281 | 0.042 | 0.140 | 0.437 |
| Arboreal Vegetation Area (ARBVA) Bare Soil Area | 0.492 | 0.753 | 0.537 | −0.104 |
| (BARSA) | −0.045 | 0.036 | −0.094 | −0.036 |
| Shade Area (SHADEA) | 0.229 | 0.092 | 0.196 | 0.276 |
| Ceramic Roof Area (CERARA) Painted Concrete Slab Area | 0.193 | 0.370 | 0.266 | −0.055 |
| (PCSA) | 0.715 | 0.299 | 0.657 | 0.775 |
| Cement Roof Area (CRA) | −0.170 | 0.270 | 0.103 | −0.299 |
| Aluminum Roof Area (ARA) Pavement Area | 0.291 | 0.243 | 0.348 | 0.186 |
| (PAVA) | 0.485 | 0.727 | 0.460 | 0.163 |
| Pool Area (POOLA) | 0.677 | 0.094 | 0.508 | 0.934 |
| Lake Area (LAKEA) | 0.099 | −0.059 | 0.077 | 0.186 |
| Areas of the Land Cover Classes | HERBVA | ARBVA | BARSA | SHADEA | CERARA | PCSA | CRA | ARA | PAVA | POOLA | LAKEA |
|---|---|---|---|---|---|---|---|---|---|---|---|
| HERBVA | 1.000 | 0.474 | −0.177 | 0.247 | −0.333 | 0.254 | −0.469 | −0.380 | −0.305 | 0.555 | 0.723 |
| ARBVA | 0.474 | 1.000 | −0.190 | 0.153 | −0.592 | −0.177 | −0.494 | −0.281 | −0.740 | 0.181 | 0.500 |
| BARSA | −0.177 | −0.190 | 1.000 | −0.030 | −0.170 | −0.170 | −0.472 | −0.158 | −0.253 | −0.139 | −0.163 |
| SHADEA | 0.247 | 0.153 | −0.030 | 1.000 | −0.306 | 0.231 | −0.162 | 0.146 | −0.118 | 0.258 | 0.407 |
| CERARA | −0.333 | −0.592 | −0.170 | −0.306 | 1.000 | 0.122 | 0.106 | −0.056 | −0.118 | 0.258 | 0.407 |
| PCSA | 0.254 | −0.177 | −0.117 | 0.231 | 0.122 | 1.000 | −0.372 | 0.140 | 0.200 | 0.671 | 0.212 |
| CRA | −0.469 | −0.494 | −0.472 | −0.162 | 0.106 | −0.372 | 1.000 | 0.319 | 0.519 | −0.412 | −0.471 |
| ARA | −0.038 | −0.281 | −0.158 | 0.146 | −0.059 | 0.140 | 0.319 | 1.000 | 0.123 | 0.048 | −0.130 |
| PAVA | −0.305 | −0.740 | −0.253 | −0.118 | 0.409 | 0.200 | 0.519 | 0.123 | 1.000 | 0.004 | −0.381 |
| POOLA | 0.555 | 0.181 | −0.139 | 0.258 | −0.171 | 0.671 | −0.412 | 0.048 | 0.004 | 1.000 | 0.273 |
| LAKEA | 0.723 | 0.500 | −0.163 | 0.407 | 0.226 | 0.212 | −0.471 | −0.130 | −0.381 | 0.273 | 1.000 |
© 2018 by the authors. Licensee MDPI, Basel, Switzerland. This article is an open access article distributed under the terms and conditions of the Creative Commons Attribution (CC BY) license (http://creativecommons.org/licenses/by/4.0/).
Share and Cite
Silva de Araujo, A.; Pereira de Queiroz, A. Spatial Characterization and Mapping of Gated Communities. ISPRS Int. J. Geo-Inf. 2018, 7, 248. https://doi.org/10.3390/ijgi7070248
Silva de Araujo A, Pereira de Queiroz A. Spatial Characterization and Mapping of Gated Communities. ISPRS International Journal of Geo-Information. 2018; 7(7):248. https://doi.org/10.3390/ijgi7070248
Chicago/Turabian StyleSilva de Araujo, Agnes, and Alfredo Pereira de Queiroz. 2018. "Spatial Characterization and Mapping of Gated Communities" ISPRS International Journal of Geo-Information 7, no. 7: 248. https://doi.org/10.3390/ijgi7070248
APA StyleSilva de Araujo, A., & Pereira de Queiroz, A. (2018). Spatial Characterization and Mapping of Gated Communities. ISPRS International Journal of Geo-Information, 7(7), 248. https://doi.org/10.3390/ijgi7070248