Abstract
Permafrost degradation under climate warming has profound implications for ecological processes, hydrology, and human activities. Northeast China, characterized by sporadic and isolated patch permafrost near the southern limit of latitudinal permafrost (SLLP), represents one of the most sensitive and complex permafrost regions. This study aims to improve the reliability of permafrost mapping by incorporating parameter uncertainty into simulations. We developed a Monte Carlo–Temperature at the Top of Permafrost (TTOP) (MC–TTOP) framework that integrates an equilibrium model with Monte Carlo sampling to quantify parameter sensitivity and model uncertainty. Using all-sky daily air temperature data and land use and land cover information, we generated probabilistic estimates of mean annual ground temperature (MAGT), permafrost occurrence probability (PZI), and associated uncertainties. Model validation against borehole observations demonstrated improved accuracy compared with global-scale simulations, with a reduced bias and RMSE. Results reveal that permafrost in Northeast China was relatively stable during 2003–2010 but experienced pronounced degradation after 2011, with the total area decreasing to ~2.79 × 10⁵ km2 by 2022. Spatial uncertainty was greatest in transitional zones near the southern boundary, where PZI-based delineations tended to overestimate permafrost extent. Regional comparisons further showed that permafrost in Northeast China is more fragmented and uncertain than that on the Tibetan Plateau, owing to complex snow–vegetation–topography interactions and intensive human disturbances. Overall, the MC-TTOP simulations indicate an accelerated permafrost degradation after 2011, with the highest uncertainty concentrated in southern transitional zones near the SLLP, demonstrating that the MC-TTOP framework provides a robust tool for probabilistic permafrost mapping, offering improved reliability for regional-scale assessments and important insights for future risk evaluation under climate change.
1. Introduction
Against the backdrop of global warming, the cryosphere is facing severe challenges. As an essential component of the cryosphere, permafrost acts as a thermal and physical boundary that regulates energy and water exchanges between the atmosphere, hydrosphere, and biosphere. Its thawing weakens this regulatory function, triggering a cascade of impacts: altered ground thermal and hydrological regimes influence vegetation dynamics and ecosystem stability; changes in runoff generation and subsurface drainage reshape watershed processes; and ground instability poses risks to infrastructure and human activities in cold regions [1,2,3,4]. To comprehensively understand the dynamic mechanisms of permafrost change, model simulations have become a crucial tool for studying the interactions between permafrost and other Earth system components [5].
Traditional permafrost models can be broadly categorized into three types: process-based physical models, equilibrium equation models, and statistical learning models [6]. Physical process models are based on land surface numerical simulations, focusing on describing heat transfer mechanisms and revealing thermodynamic processes by solving differential equations [7]. Equilibrium equation models, on the other hand, are built upon the principle of energy balance; they simplify physical heat transfer models into concise formulations with parameters that are relatively easy to obtain, and thus have been widely applied in the geospatial simulation of permafrost [8]. Statistical learning models establish predictive relationships between permafrost characteristics and climatic, environmental, geospatial, and hydrogeological factors, using regression or classification approaches to construct forecasting models [9].
In the early stages of permafrost modeling research, empirical models were widely used for large-scale estimations and demonstrated a certain degree of representativeness in such studies [10]. As research has advanced, the demand for higher spatial and temporal resolution has increased, and the limited transferability of traditional empirical models across regions has gradually revealed their shortcomings. Consequently, greater attention has been directed toward equilibrium equation models and process-based physical models. While physical models can achieve very high simulation accuracy when parameters and boundary conditions are well constrained [5], parameter estimation remains both a major challenge and a central focus of current research. In recent years, with the rapid development of big geospatial data, the application of machine learning and deep learning models in permafrost simulation has steadily expanded. These models primarily emphasize the selection and estimation of characteristic parameters, as well as the availability of high-quality observational data for support [11,12]. It is thus evident that improvements in the accuracy of permafrost models largely depend on advances in parameter estimation capabilities.
However, at specific geographic scales, model parameters are often difficult to obtain accurately due to limitations in observational techniques and high costs. Consequently, parameter sensitivity and uncertainty analyses are of great importance for evaluating the reliability of simulation results. Taking the Xing’an permafrost (XAP) in Northeast China as an example, the region is characterized by complex hydrothermal conditions and lies near the southern limit of latitudinal permafrost (SLLP), where local factors such as intricate topography and heterogeneous land-surface conditions play a dominant role in shaping spatial variability [13,14,15]. From the perspective of observation techniques, dense boreal forest cover in the Da and Xiao Xing’anling Mountains causes optical remote sensing to primarily capture canopy signals, making it difficult to accurately detect conditions at the forest floor [16]. Radar remote sensing is further hindered by vegetation and surface water, often resulting in severe signal decorrelation. These factors collectively pose major challenges for accurately retrieving land surface hydrothermal states [17].
To further enhance model reliability, this study employs a Monte Carlo (MC)–based uncertainty assessment to quantify parameter sensitivity and ensemble uncertainty in permafrost mapping. The MC approach, by repeatedly sampling from prescribed distributions of key parameters (e.g., soil thermal conductivity, water content, and snow insulation), allows the estimation of spatial confidence intervals and the characterization of parameter-driven uncertainty in model outputs. In addition, the TTOP (Temperature at the Top of Permafrost) model was introduced as the core driver for permafrost geospatial simulation. Owing to its clear physical basis, relatively modest parameter requirements, and high computational efficiency, the TTOP model has been widely applied in regional permafrost mapping studies [18,19,20], especially across large, spatially heterogeneous regions. Applying this framework to Northeast China not only improves our understanding of the dominant controls on regional permafrost differentiation but also provides methodological insights for developing robust and interpretable permafrost models under complex environmental conditions.
In recent years, MC simulations have been increasingly used in permafrost modeling to propagate uncertainties and evaluate model robustness under complex environmental conditions. For example, Wang et al. [21] employed MC sampling to evaluate the sensitivity of the Kudryavtsev model across Alaska, revealing that soil water content and snow depth dominate active-layer uncertainty. Gubler et al. [22] conducted a comprehensive MC-based analysis in mountainous terrain and highlighted the spatial variability of model sensitivities. Incorporating observation-constrained sampling, Harp et al. [23] showed that null-space MC calibration can markedly narrow predictive ranges by aligning model ensembles with borehole temperature records. Langer et al. [24] emphasized the necessity of realistic snow-thermal parameterization for reliable ground-temperature estimation, while Groenke et al. [25] introduced Bayesian uncertainty quantification as a complementary probabilistic framework to refine posterior parameter distributions.
Building on these advances, the novelty of this study lies in the development of an integrated MC-TTOP probabilistic mapping framework that quantifies parameter-driven uncertainty and provides spatially explicit confidence estimates of MAGT and permafrost occurrence across Northeast China. By integrating MC sampling with the TTOP model, this framework enables global sensitivity assessment that reveals both individual and interactive parameter effects, thereby improving the interpretability and credibility of permafrost simulations. Moreover, the probabilistic mapping strategy offers a robust characterization of ground thermal conditions in data-scarce and environmentally heterogeneous regions such as the XAP.
Beyond methodological innovation, the broader contribution of this work lies in providing a practical decision-support tool for climate-sensitive planning in cold-region environments. The probabilistic permafrost maps and confidence estimates generated here can be directly used to identify zones of elevated ground-temperature instability, which is critical for safeguarding transportation corridors, energy-infrastructure development, and regional geo-ecological conservation strategies in Northeast China. Moreover, the proposed MC–TTOP framework is transferable to other marginal permafrost regions worldwide, especially where observational constraints hinder the implementation of fully process-based models. By strengthening the traceability and credibility of permafrost predictions under climate warming, this study offers a foundation for risk-informed management of hydrological hazards and infrastructure resilience in rapidly changing cold environments. In this study, we develop an integrated MC-TTOP modeling framework to simulate MAGT across Northeast China and to characterize the spatiotemporal changes in permafrost under recent climate warming. We further quantify the spatial pattern of modeling uncertainty and assess regional differences in permafrost thermal state, with particular focus on the distinctive characteristics of the XAP. The structure of this paper is as follows: Section 2 describes the study area and MC-TTOP framework; Section 3 presents the probabilistic mapping results and uncertainty features; Section 4 provides further discussion; and Section 5 concludes the study.
2. Materials and Methods
2.1. Study Area
Northeast China constitutes the second largest permafrost region in China, primarily characterized by sporadic and isolated patch permafrost, with a total area of approximately 3.8 × 10⁵ km2 [26] (Figure 1). Permafrost is mainly distributed in the Da and Xiao Xing’anling Mountains and in several mountains to the south, such as the Changbai Mountains and the Huanggangliang Mountains. The elevations of the Da and Xiao Xing’anling Mountains are generally modest, ranging from 600 to 1200 m a. s. l. The region is dominated by a temperate continental monsoon climate, featuring long and cold winters and warm and humid summers. Mean annual air temperature varies from approximately −1~+1 °C near the SLLP to −5~−3 °C in the northern regions; Mean annual precipitation generally ranges between 400 and 700 mm, with most rainfall concentrated in summer [26]. Overall, the distribution of permafrost is jointly controlled by elevation and latitude, while at the local scale it is further influenced by microtopography, microclimate, land surface hydrothermal conditions, snow cover, vegetation, and wildfires [27,28,29].
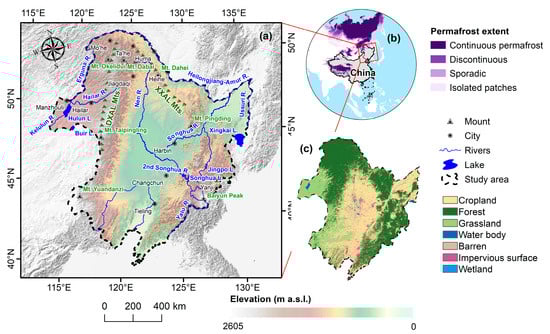
Figure 1.
Geographic information, permafrost extent, and land cover characteristics of Northeast China. (a) Elevation map of study area; (b) Location of Northeast China in the Northern Hemisphere permafrost extent; and (c) Land use and land cover (LULC) type of the study area.
2.2. Data and Method
2.2.1. Data Source
This study primarily employed the All-sky daily mean ambient air temperature at 1 km resolution in China for 2003–2022 [30]. The dataset has been validated with an RMSE of approximately 1.18 °C for daily mean air temperature and is publicly available from Zenodo (https://zenodo.org/records/14028788, accessed on 24 May 2025). In the daily temperature raster data, some grid cells contained missing values due to data gaps or sensor anomalies. To ensure the continuity of the annual temperature series, we adopted a two-step missing-data reconstruction strategy at the pixel scale. First, for short gaps of no more than seven consecutive days, a linear interpolation technique was applied using adjacent valid observations to preserve local temporal variability as much as possible. Second, for longer gaps exceeding seven days, or for missing segments at the beginning or end of a series where interpolation was not feasible, we used a seasonal harmonic fitting approach. Specifically, a first-order harmonic function with an annual cycle was fitted to the available valid daily observations to capture the dominant seasonal variability of air temperature, which was then used to reconstruct the entire missing interval. In addition to air temperature data, land use and land cover was derived from the China Land Cover Dataset (CLCD) [31], originally at a spatial resolution of 30 m, which was resampled to 1 km to match the other datasets.
2.2.2. TTOP Model
The TTOP model is an equilibrium model proposed by Smith and Riseborough [8] designed to estimate the MAGT at the top of permafrost based on climatic and surface conditions. It has been widely validated and applied in regional to hemispheric permafrost mapping studies [18,19,20]. This model establishes the transfer relationship between air temperature and ground surface temperature and incorporates parameters such as the freezing degree days (FDDs), thawing degree days (TDDs), the n-factors for the freezing and thawing seasons, and the thermal conductivity ratio, to simulate the thermal state of permafrost. Its governing equation is given as:
where nf and nt denote the thawing- and freezing-season n-factors, respectively; rk is the thermal conductivity ratio between thawed and frozen soils; and τ refers to the length of the year (commonly taken as 365 days). FDDa and TDDa represent the annual air freezing and thawing degree days, respectively. By processing daily air temperature data and incorporating surface characteristics such as land use and land cover (LULC), the TTOP model can effectively estimate the spatial distribution and thermal state of regional permafrost. The values of nf, nt, and rk are primarily dependent on LULC. In this study, we assigned these parameters mainly following Zhang et al. [32] and Zhan et al. [33], as summarized in Table 1.

Table 1.
n-factors and rk values.
2.2.3. Monte Carlo Simulation
Given the uncertainty in TTOP model parameters, we employed the MC simulation method to quantify the sensitivity and uncertainty of the model results. Specifically, for each grid cell and each year, the n-factors and rk were randomly sampled within ±20% of their assigned values, and the simulations were repeated 200 times. Through this large number of iterations, the probability distribution of the MAGT was obtained. Based on these distributions, we extracted the mean and standard deviation of MAGT, and further calculated the probability of MAGT ≤ 0 °C, defined as the Permafrost Zonation Index (PZI). The MC-TTOP model effectively captures the variability in simulation outcomes introduced by parameter uncertainty, thereby providing a robust scientific basis for probabilistic permafrost mapping and risk assessment.
3. Results
3.1. Model Validation
To evaluate the reliability and accuracy of the model, the simulations were performed using the conventional parameter values listed in Table 1. We collected borehole ground temperature measurements data from Northeast China reported in the literature, with measurement periods ranging from 2007 to 2020 [34], for model validation. Figure 2 presents the comparison between simulated and observed values, showing a mean bias of 0.46 °C, an RMSE of 2.65 °C, and an R2 of 0.44, indicating a reasonably good correlation between the simulations and observations. Compared with global-scale studies, such as Obu et al. [18], where simulations in Northeast China tended to exhibit overestimations with RMSE values up to 3 °C, the accuracy of the present study has been improved.
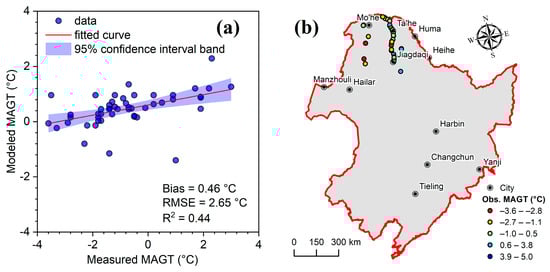
Figure 2.
Validation of modeled mean annual ground temperature (MAGT) using borehole observations across the permafrost region in Northeast China. (a) Comparison between modeled and observed MAGT and associated validation statistics. (b) Spatial distribution of boreholes and corresponding observed MAGT.
Figure 3 presents a comparative analysis of the spatial distribution of the PZI derived from different studies. Panel (a) shows the results of this study for 2003–2022, panel (b) displays the estimates from Obu et al. [18] for 2000–2016, and panel (c) represents the outcomes from Huang et al. [12] for 2000–2020. All three maps consistently indicate that the Da Xing’an and Xiao Xing’an Mountains are the primary permafrost occurrence zones in Northeast China, with high PZI values concentrated in these mountainous regions. This pattern reflects their cold climatic conditions and relatively stable thermal regime, which favor the persistence of permafrost.
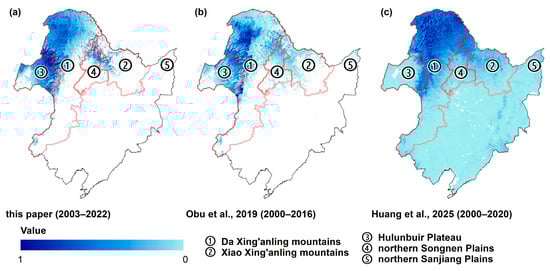
Figure 3.
Comparison of Permafrost Zonation Index (PZI) distributions from different studies in Northeast China: (a) this study (2003–2022), (b) Obu et al. [18] (2000–2016), and (c) Huang et al. [12] (2000–2020). Note: White areas indicate PZI = 0 (no permafrost occurrence potential).
Nevertheless, regional discrepancies among the datasets are evident, arising from differences in modeling approaches and input data. The most noticeable difference between panels (a) and (b) occurs in the Xiao Xing’an Mountains, where Obu et al. [18] show a slightly broader permafrost extent, likely due to their use of global-scale parameterization and coarser climate forcing. In contrast, the discrepancies between panels (a,b) and (c) are mainly found in the Hulunbuir Plateau. Huang et al. [12] suggest that permafrost is nearly absent there, whereas both this study and Obu et al. [18] indicate a certain degree of permafrost occurrence potential. These differences reflect the influence of different model structures and input configurations on permafrost mapping. Obu et al. [18] relied on globally calibrated empirical relationships with coarse-resolution climate forcing, which may lead to overestimations in complex terrain. In contrast, Huang et al. [12] used a machine-learning framework driven largely by land-surface predictors, making the results more sensitive to surface disturbance and data sparsity in marginal zones. Our MC-based TTOP simulation incorporates region-specific environmental information and probabilistic parameter sampling, providing a more adaptive representation of spatial variability. These distinctions underscore the importance of considering methodological assumptions and data sources when comparing regional permafrost maps.3.2. Spatial and temporal changes in MAGT in Northeast China during 2003–2022
3.2. Spatial and Temporal Changes in MAGT in Northeast China During 2003–2022
Figure 4 illustrates the MAGT simulated by the MC-TTOP framework. During 2003–2010, permafrost remained relatively stable, with a slight cooling trend: in 2003, the regional mean MAGT in Northeast China was 2.9 °C, with a minimum of −3.6 °C and a maximum of 9.3 °C; by 2010, the mean had decreased to 2.2 °C, with a minimum of −3.7 °C and a maximum of 8.1 °C. In contrast, during 2011–2022, MAGT experienced a pronounced warming trend, with a mean of 2.9 °C, a minimum of −3.1 °C, and a maximum of 8.8 °C. The spatial pattern of MAGT was primarily controlled by elevation and latitude, with lower values observed in the Da and Xiao Xing’anling Mountains, while higher values persisted in the Songnen and Sanjiang Plains. This indicates that elevation is the dominant factor shaping the spatial pattern of MAGT.
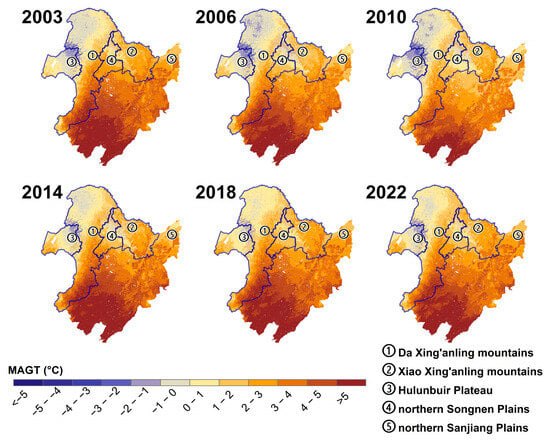
Figure 4.
MC-TTOP-model-simulated mean annual ground temperature (MAGT) in Northeast China during 2003–2022.
Figure 5 shows the PZI simulated by the MC-TTOP framework, calculated as the probability of MAGT < 0 °C based on 200 Monte Carlo simulations with randomized n-factors and rk values. Areas with PZI > 0 indicate potential permafrost occurrence, and higher PZI values correspond to a greater likelihood of permafrost presence. As shown in Figure 4, permafrost is mainly distributed in the Da and Xiao Xing’anling Mountains, the Hulunbuir Plateau, and the northern parts of the Sanjiang and Songnen Plains. Permafrost degradation occurred predominantly during 2011–2022, with the most affected regions being the Hulunbuir Plateau, the Sanjiang Plain, the Songnen Plain, and the Xiao Xing’anling Mountains, while permafrost in the Da Xing’anling Mountains remained relatively stable. Using PZI > 0 as the threshold for delineation, the estimated permafrost area was 3.09 × 10⁵ km2 in 2003, 3.86 × 10⁵ km2 in 2010, and 2.79 × 10⁵ km2 in 2022. Overall, the permafrost area in Northeast China declined from 2003 to 2022, with the most pronounced degradation occurring after 2011.
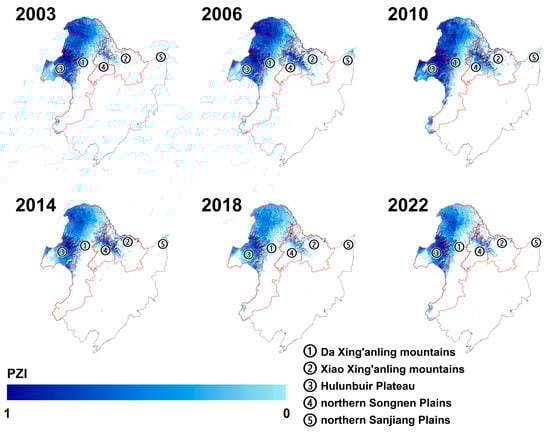
Figure 5.
Permafrost Zonation Index (PZI) calculated with Monte Carlo (MC)-TTOP model in Northeast China during 2003–2022.
Moreover, multiple recent studies have reported that permafrost degradation in Northeast China has intensified significantly after 2010 [35,36]. For instance, thaw subsidence and thermokarst development were widely observed along the G111 Highway region in the northern Da Xing’anling Mountains, where the number and total area of thermokarst lakes expanded by over 240% during 1989–2020, with the most rapid growth occurring after 2011 [36]. These findings provide independent geomorphic evidence consistent with the accelerated MAGT warming and permafrost area decline simulated in this study, further confirming that the period after 2011 marks a stage of intensified permafrost thaw and surface instability across the XAP regions.
3.3. Reliability Analysis of MC-TTOP Simulation Results
Figure 6 presents the spatial distribution of standard deviations (SDs) calculated from a total of 3800 Monte Carlo simulations per grid cell (200 simulations for each year over 2003–2022) using the MC-TTOP framework. In permafrost regions, SD values are generally higher, mostly within the range of 0.6–0.8 °C. This is largely because land surface cover in permafrost areas is more complex than in non-permafrost regions, resulting in greater uncertainty in the simulations. The uncertainty of the MC-TTOP framework is thus primarily governed by land surface conditions (i.e., the n-factors and rk). In the southern part of Northeast China, where non-permafrost regions are dominated by plains with relatively simple land cover structures, simulation uncertainty is lower, as indicated by smaller SD values. By contrast, in the northern permafrost regions of Northeast China, surface cover is typically more heterogeneous and interlaced; during Monte Carlo simulations, different parameter combinations lead to larger variations in the results, thereby producing higher SD values.
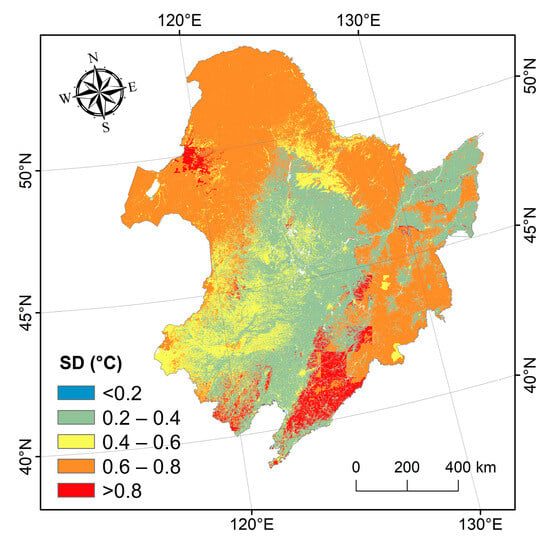
Figure 6.
Spatial distribution of standard deviation (SD) of Monte Carlo (MC)-TTOP simulation results in Northeast China.
4. Discussion
4.1. Local Controls and Transitional Uncertainty
In Northeast China, the spatial distribution of permafrost is strongly influenced by local factors such as snow cover, vegetation, soil thermal properties, topographic shading and cold-air pooling, as well as near-surface hydrological conditions [13,14,28,37]. These microtopographic-scale processes are particularly prominent at the margins of isolated-patch permafrost: canopy snow interception or wind redistribution alters the thickness of the winter surface insulation layer; organic matter and soil moisture regulate the effective thermal conductivity; slope angle/aspect and microtopography control incoming shortwave radiation and near-surface air temperature; and engineering disturbances and LULC changes further disrupt the uniformity of ground thermal conditions [14,38]. As a result, under a similar large-scale climatic background, ground temperatures can display steep gradients and strong patchiness within a kilometer scale, with adjacent grid cells simultaneously exhibiting both frozen and thawed states. This combined effect of local factors makes Northeast China permafrost resemble a mosaic of microenvironments, characterized by weak spatial continuity and stability, and heightened sensitivity to external disturbances.
The logistic relationship between MAGT and PZI, shown in Figure 7, highlights a steep transition zone near the 0 °C threshold. Notably, the curve also indicates that when the mean MAGT is slightly above 0 °C, the PZI remains distinctly greater than zero, forming a transitional band rather than dropping immediately to zero. This feature reflects clear physical and statistical implications under the Monte Carlo framework. Specifically, although a mean MAGT > 0 °C suggests that a grid cell is on average warmer, certain parameter combinations (snow, vegetation, soil, and topography) still yield MAGT ≤ 0 °C, contributing a finite probability of permafrost occurrence. Moreover, sub-grid heterogeneity within 1 km cells—such as shaded north-facing slopes, wind-exposed ridges with thin snow, organic-rich wet patches, or talik boundaries—can preserve permafrost micro-domains even where the cell mean exceeds 0 °C. In addition, small variations in snow depth, canopy structure, or soil thermal conductivity may trigger abrupt state transitions near the freezing point, which explains the steep slope of the logistic curve in the vicinity of 0 °C. Together, these results indicate that while MAGT describes the average thermal regime, PZI quantifies the probability of permafrost persistence under local variability, and the use of PZI > 0 as a criterion for delineating permafrost tends to introduce an overestimation bias, particularly within transitional zones.
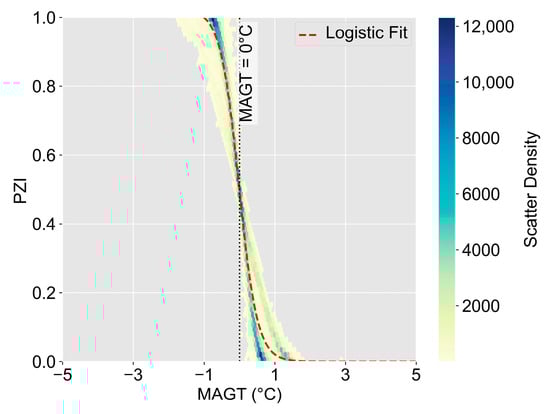
Figure 7.
Logistic relationship between mean annual ground temperature (MAGT) and the Permafrost Zonation Index (PZI) derived from Monte-Carlo-TTOP (MC-TTOP) ensemble over Northeast China (2003–2022). (The red dashed line indicates the fitted logistic curve, while the grey dotted vertical line denotes the MAGT = 0 °C threshold).
Against the backdrop of threshold behavior and strong local controls, regional contrasts are further amplified by different snow–vegetation–topography configurations. To place Northeast China in a broader context, we extended the simulations to cover all of China and compared permafrost conditions across regions. As shown in Figure 8, permafrost in Northeast China is overall more vulnerable than that on the Tibetan Plateau. The probability density of MAGT in Northeast China is concentrated near the higher-value range around 0 °C, while the distribution of PZI is skewed toward lower probabilities, reflecting fragmented and marginal characteristics. At the same time, the SD of MAGT in Northeast China is mainly concentrated within 0.6–0.8 °C, whereas on the Tibetan Plateau it is more commonly distributed within 0.2–0.4 °C, indicating that Northeast China is more sensitive to perturbations from local factors. Mechanistically, the Tibetan Plateau’s high-elevation cold–dry environment, generally thin snow cover, and strong radiative cooling allow large regions to maintain low MAGT and high continuity. In contrast, Northeast China’s lower elevation, wetter snowpack, and mosaic of forests and croplands, together with human disturbances such as road construction, logging, and peri-urban expansion, create highly variable snow and vegetation structures. These conditions amplify uncertainties near the freezing threshold, leaving many grid cells at a critical margin. This regional contrast is consistent with the MAGT–PZI results presented here and highlights that, particularly near the SLLP in Northeast China, complex local factors can preserve the possibility of permafrost persistence under marginal conditions, while also increasing the tendency of PZI-based delineations to overestimate permafrost extent.
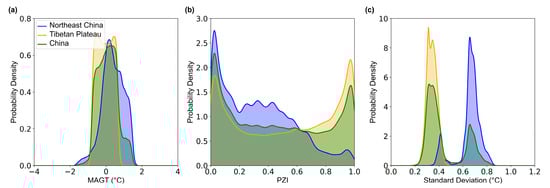
Figure 8.
Probability density distributions of (a) mean annual ground temperature (MAGT), (b) Permafrost Zonation Index (PZI), and (c) Monte-Carlo-TTOP-simulated standard deviation of MAGT for Northeast China (NEC), the Tibetan Plateau (TP), and China as a whole (2003–2022). (The colored curves and corresponding shaded areas denote the probability density distributions for each region).
4.2. Limitations and Future Improvement Pathways
Despite the progress achieved with the MC–TTOP framework, the current parameterization scheme still has notable limitations, particularly in the spatially heterogeneous landscapes of Northeast China. In this study, the parameters nf, nt and rk were primarily assigned according to LULC. While this approach provides operational simplicity, it overlooks the complex influences of vegetation, snow, soil organic layers, and local hydrothermal interactions that strongly modulate ground temperature. Given the diverse surface types, pronounced topographic variation, uneven snow distribution, and intensive human disturbance, a fixed LULC-based scheme is insufficient to accurately represent fine-scale differences in thermal exchange processes.
In the TTOP framework, nf and nt represent the ratios between surface and subsurface freezing and thawing degree days, respectively, while rk expresses the relative efficiency of heat conduction during the freeze–thaw cycle [8]. These parameters integrate multiple physical processes and are sensitive to a range of environmental factors. Previous studies have demonstrated that snow depth and snow thermal conductivity exert a strong control on winter insulation and therefore directly affect nf [39,40]. Vegetation canopy and structure influence nt by modifying radiation balance, aerodynamic resistance, and snow redistribution [41]. The organic layer, through its low thermal conductivity and high heat capacity, acts as an effective buffer against temperature fluctuations, reducing subsurface heat transfer [42,43]. In addition, soil moisture and texture modulate the thermal regime by altering latent heat exchange and conductivity [23]. Consequently, the actual spatial variability of nf, nt and rk is continuous rather than categorical, and fixed land-cover-based assignments fail to capture these gradual gradients—especially across mixed forest–cropland mosaics and mountainous areas with complex snow–vegetation interactions.
Future model improvements should therefore emphasize more process-consistent and spatially explicit parameterization. A promising direction is to shift from fixed categorical assignments to multi-factor parameterization schemes that link nf, nt and rk to continuous environmental covariates such as vegetation index, organic layer thickness, snow depth, soil moisture, and surface roughness. Semi-empirical or machine learning approaches could be applied to derive these relationships, allowing parameter values to vary smoothly with environmental gradients. Another important step is to represent within-class heterogeneity by sampling parameters from probability distributions or percentile ranges rather than assigning single fixed values. This approach, compatible with the Monte Carlo structure, can more realistically represent the inherent uncertainty of ground thermal properties in discontinuous permafrost regions.
Moreover, incorporating dynamic processes offers great potential for refinement. Dynamic representations of snow and organic layer evolution, as demonstrated by Jafarov and Schaefer [43], can adjust thermal parameters over time in response to changing surface conditions, improving the adaptability of the model to climate-driven variability. Field observations—such as borehole temperature records, snow thickness measurements, and organic layer data—should also be used to constrain parameter ranges through inverse modeling or Bayesian estimation [25]. In addition, high-resolution remote sensing datasets, including LAI, snow products, and LiDAR-derived terrain metrics, can provide valuable auxiliary information for spatial refinement of parameter distributions.
In summary, future development of the MC–TTOP framework should integrate physically based and data-driven parameterization approaches to better represent spatial variability and process feedbacks. By coupling environmental data, dynamic modeling, and probabilistic calibration, the framework can achieve a more realistic and interpretable depiction of permafrost conditions—particularly in complex and heterogeneous regions such as the Xing’an permafrost zone.
5. Conclusions
This study developed and applied an MC-TTOP framework to systematically simulate and assess the uncertainty of permafrost thermal states and spatial patterns in Northeast China during 2003–2022. The main conclusions are as follows:
- (1)
- Temporal change: Permafrost was relatively stable during 2003–2010 but degradation accelerated after 2011, with total permafrost area decreasing to ~2.79 × 10⁵ km2 by 2022.
- (2)
- Spatial hotspots: The strongest degradation occurred in the Hulunbuir Plateau, Sanjiang Plain, Songnen Plain, and the Xiao Xing’anling Mountains.
- (3)
- Uncertainty pattern: Uncertainty in permafrost occurrence is highest in transitional zones near the SLLP, where PZI-based delineations tend to overestimate permafrost extent; therefore, mapped boundaries should be interpreted cautiously in near-threshold areas.
- (4)
- Regional contrast: Compared with the Tibetan Plateau, Northeast China exhibits a more fragmented permafrost thermal regime and higher uncertainty, reflecting stronger influences of local factors.
Based on these findings, future improvements should prioritize: (i) observation-informed constraints on key parameters, especially those derived from land-cover classifications; (ii) refined parameterization linked to vegetation, soil, and snow regimes; and (iii) enhanced process representation and higher-resolution forcing to better capture local variability.
Author Contributions
Yao Xiao contributed to methodology, data curation, analysis, visualization, and writing—original draft. Lei Zhao and Shuqi Wang assisted in software development, validation, and editing. Xuyang Wu contributed to validation and manuscript review. Kai Gao assisted in data analysis and investigation. Yunhu Shang was responsible for conceptualization, supervision, project administration, and funding acquisition. All authors have read and agreed to the published version of the manuscript.
Funding
This research was funded by the Science and Technology Project of Heilongjiang Power Grid Company, grant number 522448250003, “Non-Destructive Investigation and Soil & Water Conservation Technologies for Islanded Permafrost in Cold-Region Power Transmission Projects with Demonstration”.
Data Availability Statement
All datasets used in this study are publicly available. The all-sky daily air temperature dataset (1 km resolution, 2003–2022) used for this research can be accessed via the Zenodo repository (https://zenodo.org/records/10947354, accessed on 24 May 2025). The China Land Cover Dataset (CLCD) (30 m resolution, resampled to 1 km) is publicly available at Zenodo: https://zenodo.org/records/12779975 (accessed on 25 May 2025).
Acknowledgments
The authors would like to express their sincere gratitude to the anonymous reviewers for their constructive comments and valuable suggestions, which greatly improved the quality and clarity of this manuscript.
Conflicts of Interest
The authors declare no conflicts of interest. The funders had no role in the design of the study; in the collection, analyses, or interpretation of data; in the writing of the manuscript; or in the decision to publish the results.
Abbreviations
The following abbreviations are used in this manuscript:
| MC | Monte Carlo |
| TTOP | Temperature at the Top of Permafrost |
| MAGT | Mean Annual Ground Temperature |
| PZI | Permafrost Zonation Index |
| LULC | Land Use and Land Cover |
| SLLP | Southern Limit of Latitudinal Permafrost |
| XAP | Xing’an Permafrost |
| SD | Standard Deviation |
References
- Biskaborn, B.K.; Smith, S.L.; Noetzli, J.; Matthes, H.; Vieira, G.; Streletskiy, D.A.; Schoeneich, P.; Romanovsky, V.E.; Lewkowicz, A.G.; Abramov, A.; et al. Permafrost is warming at a global scale. Nat. Commun. 2019, 10, 264. [Google Scholar] [CrossRef] [PubMed]
- Plaza, C.; Pegoraro, E.; Bracho, R.; Celis, G.; Crummer, K.G.; Hutchings, J.A.; Hicks Pries, C.E.; Mauritz, M.; Natali, S.M.; Salmon, V.G.; et al. Direct observation of permafrost degradation and rapid soil carbon loss in tundra. Nat. Geosci. 2019, 12, 627–631. [Google Scholar] [CrossRef]
- Hjort, J.; Streletskiy, D.; Doré, G.; Wu, Q.; Bjella, K.; Luoto, M. Impacts of permafrost degradation on infrastructure. Nat. Rev. Earth Environ. 2022, 3, 24–38. [Google Scholar] [CrossRef]
- Smith, S.L.; O’Neill, H.B.; Isaksen, K.; Noetzli, J.; Romanovsky, V.E. The changing thermal state of permafrost. Nat. Rev. Earth Environ. 2022, 3, 10–23. [Google Scholar] [CrossRef]
- Riseborough, D.; Shiklomanov, N.; Etzelmüller, B.; Gruber, S.; Marchenko, S. Recent advances in permafrost modelling. Permafr. Periglac. Process. 2008, 19, 137–156. [Google Scholar] [CrossRef]
- Ran, Y.; Li, X. Progress, challenges challenges and opportunities of permafrost mapping in China. Adv. Earth Sci. 2019, 34, 1015–1027. [Google Scholar] [CrossRef]
- Qin, Y.; Wu, T.; Zhao, L.; Wu, X.; Li, R.; Xie, C.; Pang, Q.; Hu, G.; Qiao, Y.; Zhao, G.; et al. Numerical modeling of the active layer thickness and permafrost thermal state across Qinghai-Tibetan Plateau. J. Geophys. Res. Atmos. 2017, 122, 11604–11620. [Google Scholar] [CrossRef]
- Smith, M.W.; Riseborough, D.W. Climate and the limits of permafrost: A zonal analysis. Permafr. Periglac. Process. 2002, 13, 1–15. [Google Scholar] [CrossRef]
- Luo, D.; Ran, Y.; Wang, K.; Chen, F.; Liu, J. Permafrost-climate relationship and permafrost modeling and mapping. In Reference Module in Earth Systems and Environmental Sciences; Elsevier: Amsterdam, The Netherlands, 2024. [Google Scholar] [CrossRef]
- Cheng, G. Problem on zonation of high-altitude permafrost. Acta Geogr. Sin. 1984, 32, 185–193. [Google Scholar]
- Mahanta, K.K.; Pradhan, I.P.; Gupta, S.K.; Shukla, D.P. Assessing machine learning and statistical methods for rock glacier-based permafrost distribution in northern Kargil region. Permafr. Periglac. Process. 2024, 35, 262–277. [Google Scholar] [CrossRef]
- Huang, S.; Jin, H.; Wang, Y.; Liang, J.; Jin, X.; Yang, L.; Li, X.; He, R.; Lv, L.; Li, A.; et al. Machine Learning Model Mapped Permafrost Distribution in Northeast China During 2000–2020. IEEE Trans. Geosci. Remote Sens. 2025, 63, 1–18. [Google Scholar] [CrossRef]
- Jin, H.; Sun, G.; Yu, S.; Jin, R.; He, R. Symbiosis of marshes and permafrost in Da and Xiao Hinggan Mountains in northeastern China. Chin. Geogra. Sci. 2008, 18, 62–69. [Google Scholar] [CrossRef]
- Jin, H.; Huang, S.; Jin, X.; Liang, J.; Li, X.; Li, A.; Lü, L.; Şerban, R.-D.; Gagarin, L.S.; Wang, Y. Changing Southern/Lower Limits of Latitudinal/Mountain Permafrost (SLLP/LLMP) in Northeast China: An Overview. Permafr. Periglac. Process. 2025, 36, 563–579. [Google Scholar] [CrossRef]
- Zhang, Z.; Li, M.; Wu, Q.; Wang, X.; Jin, H.; Chen, H.; Ma, D.; Zhang, Z. Degradation and local growth of “Xing’an-Baikal” permafrost responding to climate warming and the consequences. Earth-Sci. Rev. 2024, 255, 104865. [Google Scholar] [CrossRef]
- Luo, D.; Jin, H.; Marchenko, S.S.; Romanovsky, V.E. Difference between near-surface air, land surface and ground surface temperatures and their influences on the frozen ground on the Qinghai-Tibet Plateau. Geoderma 2018, 312, 74–85. [Google Scholar] [CrossRef]
- Wang, W.; Jin, X.; Jin, H.; Li, X.; Wang, X.; He, R.; Li, Y.; Li, X.; Wang, L.; Wang, W.; et al. Evaluation of ground surface deformation in discontinuous permafrost regions along the China-Russia Crude Oil Pipelines in Northeast China using InSAR and ground surveys. Eng. Geol. 2023, 323, 107227. [Google Scholar] [CrossRef]
- Obu, J.; Westermann, S.; Bartsch, A.; Berdnikov, N.; Christiansen, H.H.; Dashtseren, A.; Delaloye, R.; Elberling, B.; Etzelmüller, B.; Kholodov, A.; et al. Northern Hemisphere permafrost map based on TTOP modelling for 2000–2016 at 1 km2 scale. Earth-Sci. Rev. 2019, 193, 299–316. [Google Scholar] [CrossRef]
- Li, X.; Jin, H.; Sun, L.; Wang, H.; Huang, Y.; He, R.; Chang, X.; Yu, S.; Zang, S. TTOP-model-based maps of permafrost distribution in Northeast China for 1961–2020. Permafr. Periglac. Process. 2022, 33, 425–435. [Google Scholar] [CrossRef]
- Kim, K.Y.; Haagenson, R.; Kansara, P.; Rajaram, H.; Lakshmi, V. Augmenting daily MODIS LST with AIRS surface temperature retrievals to estimate ground temperature and permafrost extent in High Mountain Asia. Remote Sens. Environ. 2024, 305, 114075. [Google Scholar] [CrossRef]
- Wang, K.; Jafarov, E.; Overeem, I. Sensitivity evaluation of the Kudryavtsev permafrost model. Sci. Total Environ. 2020, 720, 137538. [Google Scholar] [CrossRef]
- Gubler, S.; Endrizzi, S.; Gruber, S.; Purves, R.S. Sensitivities and uncertainties of modeled ground temperatures in mountain environments. Geosci. Model Dev. 2013, 6, 1319–1336. [Google Scholar] [CrossRef]
- Harp, D.R.; Atchley, A.L.; Painter, S.L.; Coon, E.T.; Wilson, C.J.; Romanovsky, V.E.; Rowland, J.C. Effect of soil property uncertainties on permafrost thaw projections: A calibration-constrained analysis. Cryosphere 2016, 10, 341–358. [Google Scholar] [CrossRef]
- Langer, M.; Westermann, S.; Heikenfeld, M.; Dorn, W.; Boike, J. Satellite-based modeling of permafrost temperatures in a tundra lowland landscape. Remote Sens. Environ. 2013, 135, 12–24. [Google Scholar] [CrossRef]
- Groenke, B.; Langer, M.; Nitzbon, J.; Westermann, S.; Gallego, G.; Boike, J. Investigating the thermal state of permafrost with Bayesian inverse modeling of heat transfer. Cryosphere 2023, 17, 3505–3533. [Google Scholar] [CrossRef]
- Jin, H.; Yu, Q.; Lü, L.; Guo, D.; He, R.; Yu, S.; Sun, G.; Li, Y. Degradation of permafrost in the Xing’anling Mountains, northeastern China. Permafr. Periglac. Process. 2007, 18, 245–258. [Google Scholar] [CrossRef]
- Gao, K.; Li, G.; Cao, Y.; Li, C.; Chen, D.; Wu, G.; Du, Q.; Wang, F.; Alexander, F.; Che, F.; et al. Permafrost thawing caused by the China-Russia Crude oil pipeline based on multi-type data and its impacts on geomorphological reshaping and water erosion. Catena 2024, 242, 108134. [Google Scholar] [CrossRef]
- Jin, X.; Huang, S.; Wang, H.; Wang, W.; Li, X.; He, R.; Yang, S.; Yang, X.; Li, S.; Zhang, S.; et al. Quantifying the influencing factors of the thermal state of permafrost in Northeast China. Geoderma 2024, 449, 117003. [Google Scholar] [CrossRef]
- Li, X.; Sun, L.; Han, Y. Effects of wildfires on soil organic carbon in boreal permafrost regions: A review. Permafr. Periglac. Process. 2024, 35, 493–503. [Google Scholar] [CrossRef]
- Wang, M.; Wei, J.; Wang, X.; Luan, Q.; Xu, X. Reconstruction of all-sky daily air temperature datasets with high accuracy in China from 2003 to 2022. Sci. Data 2024, 11, 1133. [Google Scholar] [CrossRef]
- Yang, J.; Huang, X. The 30 m annual land cover dataset and its dynamics in China from 1990 to 2019. Earth Syst. Sci. Data 2021, 13, 3907–3925. [Google Scholar] [CrossRef]
- Zhang, Y.; Zang, S.; Li, M.; Shen, X.; Lin, Y. Spatial distribution of permafrost in the Xng’an mountains of Northeast China from 2001 to 2018. Land 2021, 10, 1127. [Google Scholar] [CrossRef]
- Zhan, D.; Man, H.; Zang, S.; Li, M. Simulation of frozen ground distribution in northeast China based on a surface frost number model. J. Geogr. Sci. 2022, 32, 1581–1600. [Google Scholar] [CrossRef]
- Huang, S.; Ding, Q.; Chen, K.; Hu, Z.; Liu, Y.; Zhang, X.; Gao, K.; Qiu, K.; Yang, Y.; Ding, L. Changes in near-surface permafrost temperature and active layer thickness in Northeast China in 1961–2020 based on GIPL model. Cold Reg. Sci. Technol. 2023, 206, 103709. [Google Scholar] [CrossRef]
- Liang, J.; Huang, S.; Jin, X.; Li, X.; Li, A.; Yang, L.; Wang, W.; Tang, J.; Zhang, Z.; Wang, Y.; et al. Rapid development of thermokarst lakes and driving factors along a highway in Northeast China (2000–2020). Res. Cold Arid. Reg. 2025; in press. [Google Scholar] [CrossRef]
- Liang, J.; Huang, S.; Jin, X.; Yang, L.; Wang, W.; Tang, J.; Zhang, Z.; Li, S.; Li, X.; Zhai, J.; et al. Expansion of thermokarst lakes along the Mo’he county section of National Highway G111 in Northeast China during 1989–2020. Adv. Clim. Change Res. 2025, 16, 1044–1057. [Google Scholar] [CrossRef]
- Chang, X.; Jin, H.; Zhang, Y.; He, R.; Luo, D.; Wang, Y.; Lü, L.; Zhang, Q. Thermal impacts of boreal forest vegetation on active layer and permafrost soils in northern da Xing’Anling (Hinggan) Mountains, Northeast China. Arct. Antarct. Alp. Res. 2015, 47, 267–279. [Google Scholar] [CrossRef]
- Gao, K.; Li, G.; Wang, F.; Cao, Y.; Chen, D.; Du, Q.; Chai, M.; Fedorov, A.; Lin, J.; Shang, Y.; et al. Evolution of secondary periglacial environment induced by thawing permafrost near China–Russia Crude Oil Pipeline based on airborne LiDAR, geophysics, and field observation. Drones 2024, 8, 360. [Google Scholar] [CrossRef]
- Gouttevin, I.; Menegoz, M.; Dominé, F.; Krinner, G.; Koven, C.; Ciais, P.; Tarnocai, C.; Boike, J. How the insulating properties of snow affect soil carbon distribution in the continental pan-Arctic area. J. Geophys. Res. Biogeosci. 2012, 117, G02020. [Google Scholar] [CrossRef]
- Gisnås, K.; Westermann, S.; Schuler, T.V.; Litherland, T.; Isaksen, K.; Boike, J.; Etzelmüller, B. A statistical approach to represent small-scale variability of permafrost temperatures due to snow cover. Cryosphere 2014, 8, 2063–2074. [Google Scholar] [CrossRef]
- Grünberg, I.; Wilcox, E.J.; Zwieback, S.; Marsh, P.; Boike, J. Linking tundra vegetation, snow, soil temperature, and permafrost. Biogeosciences 2020, 17, 4261–4279. [Google Scholar] [CrossRef]
- Wang, G.; Mao, T.; Chang, J.; Du, J. Impacts of surface soil organic content on the soil thermal dynamics of alpine meadows in permafrost regions: Data from field observations. Geoderma 2014, 232–234, 414–425. [Google Scholar] [CrossRef]
- Jafarov, E.; Schaefer, K. The importance of a surface organic layer in simulating permafrost thermal and carbon dynamics. Cryosphere 2016, 10, 465–475. [Google Scholar] [CrossRef]
Disclaimer/Publisher’s Note: The statements, opinions and data contained in all publications are solely those of the individual author(s) and contributor(s) and not of MDPI and/or the editor(s). MDPI and/or the editor(s) disclaim responsibility for any injury to people or property resulting from any ideas, methods, instructions or products referred to in the content. |
© 2025 by the authors. Published by MDPI on behalf of the International Society for Photogrammetry and Remote Sensing. Licensee MDPI, Basel, Switzerland. This article is an open access article distributed under the terms and conditions of the Creative Commons Attribution (CC BY) license.