Abstract
Urban green space, a vital part of urban ecosystems, offers inhabitants essential ecosystem services, and ensuring its fair distribution is essential to preserving their ecological well-being. This study uses Kaifeng City in Henan Province as the research object and aims to address the unique conflict between the preservation of well-known historical and cultural cities and the development of greening. It does this by integrating streetscape big data (2925 sampling points) and point of interest (POI) density data (57,266 records) and using the DeepLab-ResNeSt269 semantic segmentation model in conjunction with spatial statistical techniques (Moran’s Index, Locational Entropy and Theil Index Decomposition) to quantitatively analyze the spatial equity of the green view index (GVI) in Kaifeng City. The results of the study show that (1) The Theil Index reveals that the primary contradiction in Kaifeng City’s distribution pattern—low GVI in the center and high in the periphery—is the micro-street scale difference, suggesting that the spatial imbalance of the GVI is primarily reflected at the micro level rather than the macro urban area difference. (2) The distribution of the GVI in Kaifeng City exhibits a significant spatial polarization phenomenon, with the proportion of low-value area (35.40%) being significantly higher than that of high-value area (25.10%) and the spatial clustering being evident (Moran’s Index 0.3824). Additionally, the ancient city area and the new city area exhibit distinct spatial organization patterns. (3) POI density and GVI had a substantial negative correlation (r = −0.085), suggesting a complicated process of interaction between green space and urban functions. The study reveals that the fairness of green visibility in historical and cultural cities presents the characteristics of differentiated distribution in different spatial scales, which provides a scientific basis for the optimization of greening spatial layouts in historical and cultural cities while preserving the traditional landscape.
1. Introduction
As urban carriers of rich cultural legacy, historic and cultural cities have the challenge of preserving traditional elements while simultaneously enhancing the quality of life. In the context of greening construction, this contradiction is especially evident: on the one hand, green space, as a vital component of the urban ecosystem, serves important ecological purposes like producing oxygen and sequestering carbon [1], purifying air pollutants [2], reducing noise pollution [3], and mitigating the urban heat island effect [4], and its equitable distribution is essential to protecting the ecological well-being of inhabitants [5]. Traditional large-scale green space construction is severely limited in historical and cultural city districts by building density, spatial layout, and cultural relics protection laws. In these circumstances, the ancient city’s greening initiative should investigate a new development strategy core, namely moving from “add green” to “show green,” by improving the visual appeal of green space to boost the perception of greening.
Relevant studies have progressively changed from the early emphasis on quantitative dimensions of parity [6] to geographical balance [7], spatial equity [8], and finally social justice [9], as the depth of research on urban green space equality has increased. However, the current theory of spatial fairness lacks a theoretical explanation of the green resource allocation mechanism under the twin constraints of “protection-development” of historical and cultural cities, as it is mostly based on the modern urban planning paradigm [10]. It is challenging to accurately depict the green landscape that people actually perceive in historic districts, but traditional horizontal projection area measurement indicators, such as the green space ratio and the green coverage ratio based on the top-down perspective [11], can reflect the macro greening level under the restricted construction conditions. Specifically, the true effects of micro-green spaces (like building gap interventions and historic courtyard greening) and small-scale green spaces (like rooftop gardens, vertical greening, and corner pocket parks) that contribute to the overall green infrastructure are difficult for standard indicators to measure.
The Green View Index (GVI), an assessment metric that is more in line with human visual perception, has arisen in response to this specific discrepancy [12]. In addition to accurately capturing the visual contribution of micro-scale greening elements like vertical greening and three-dimensional greening from the perspective of pedestrians [13], the GVI can be used to overcome the evaluation of blind spots of traditional area indicators, increase urban green space through low-invasive methods, and achieve the unity of ecological optimization and historical landscape protection [14]. The GVI employs street imagery to directly quantify 3D greening features from a pedestrian’s point of view [12,13], while the overhead coverage measurement uses a vertical projection algorithm [15], which is unable to capture vertical greening elements like green walls and facade vegetation. This is the technical difference between the two. In historic cities, where vertical greening is a significant but invisible green infrastructure, this complementing interaction is especially beneficial. At the same time, the GVI can be used in conjunction with the standard overlooking coverage indicators (such as green space rate and greening coverage) to provide a more comprehensive picture of the urban greening state. These indicators still have macro-level reference values. With the refinement of GVI evaluation criteria, its calculation technology has experienced a development process from manual measurement to automatic extraction. In recent years, researchers have introduced deep learning into the field of GVI calculation, and Seiferling et al. first applied convolutional neural networks to the green identification of street scene images, which significantly improved the classification accuracy [16]. In order to accomplish precise greening detection at the pixel level, Zhang and Dong also suggested a semantic segmentation technique based on SegNet [17]. The groundwork for a large-scale, very accurate evaluation of urban greening perceptions is laid by this technological breakthrough. The emergence of the GVI provides a new technical path for the application of spatial justice theory in historical and cultural cities. The traditional spatial justice theory emphasizes the geographic fairness and accessibility fairness of resource distribution [18], while the environmental justice theory focuses on the equal opportunity for different groups to obtain quality environmental resources [19]. Area allocation equity serves as the foundation for the traditional assessment of spatial equity [20]; however, the heritage protection policy in historic and cultural cities limits the development of extensive green space, and the traditional area indicator makes it challenging to capture the true greening perception effect. Consequently, a theoretical foundation for the shift from “allocation equity” to “perceived equity” must be developed. Lefebvre’s “living space” notion [21] and Harvey’s “urban rights” theory [22] are the foundations of this change, which highlights the move from resource distribution to the emphasis on assessing the caliber of spatial experience. Drawing from the environmental justice idea [19], it prioritizes equitable distribution of natural resources and views visual green accessibility as a fundamental environmental right that all inhabitants ought to have. For this transition, the GVI offers crucial technical assistance.
There is a special complexity and urgency to the problem of greening spatial justice in historic and cultural cities. During the process of urban growth, historical and cultural cities often form a spatial structure of new and old urban areas, enabling residents in different locations to access different green resources. Therefore, there is a significant gap in green spaces between old urban areas and modern urban areas. Nevertheless, the present research still has certain shortcomings: (1) There is currently no clear theoretical framework for GVI fairness in historical and cultural cities, particularly with regard to the integration mechanism between GVI theory and spatial justice theory [18] within the limitations of cultural protection; (2) there is a lack of systematic comparative analysis of greening equity between ancient and new urban areas, which cannot reveal the intrinsic conflict mechanism between historical and cultural protection and greening resource allocation; (3) there is a lack of in-depth fusion analysis of multi-source geographic big data, which is still insufficient in revealing the intrinsic correlation mechanism between urban functional layout and green space allocation in particular. Equity is concerned with the rationality and accessibility of greening resource allocation [19], and the choice of spatial analysis methods directly affects the accuracy of equity evaluation [23]. The Fixed Area Tract (FAT) framework is mostly used in traditional research [24], but the regular grid-based approach is better suited to the design of contemporary cities. There are key distinctions between historical and cultural cities, such as the intricate spatial texture of the former, the narrow streets and lanes of the former, the modern city’s roads, the mixed functional layout, the distribution of protection zones for cultural relics entwined with commercial and residential districts, and the stringent conservation regulations that prevent the extensive development of green space. The FAT approach is challenging to use due to spatial discrepancies. As a result, this study uses a streetscape sampling point-based spatial analysis approach, which is based on a 100 m2 analysis unit that can precisely quantify the spatial fairness of greening perceptions from a human-centered perspective and measure the distribution characteristics and visual contributions of small- and medium-scale greening elements in historic districts. In order to improve the precision of the spatial equity assessment, this study uses a diversified sampling technique, with systematic sampling at 250 m intervals in the modern city and intensive sampling at 100 m intervals in the ancient city.
Our research advances the discipline in three ways, according to the analysis above: (1) Building a system for evaluating GVI fairness that can be used in historic and cultural cities. The GVI can supplement the measurement of the visual contribution of small-scale green features in the complicated spatial contexts of historical and cultural cities, while traditional top-down measurement methods are useful for macro greening assessment; (2) the application strategy of the DeepLab-ResNeSt269 model is optimized for the complex spatial environment of the ancient city, the differential sampling method is proposed, and the applicability of the model is verified in the historical and cultural city; (3) the characteristics of the difference in GVI fairness between the ancient city and the new city are systematically compared, and the path of greening optimization under the constraints of cultural protection is explored.
2. Study Scope and Data Sources
2.1. Overview of the Study Area
The study’s research object is the city of Kaifeng in the province of Henan. As the ancient capital of seven dynasties, Kaifeng City was one of the first Chinese cities to be designated as a national historical and cultural city. It was particularly successful during the Northern Song Dynasty, when Tokyo was at its height, and it left behind a rich historical and cultural legacy as well as a distinctive urban texture. With a total area of roughly 297.24 km2, the study area consists of four major municipal districts: Longting District, Shunhe Hui District, Gulou District, and Yuwangtai District. This study uses the central city of Kaifeng (114.202° E–114.403° E, 34.744° N–34.846° N) as the study area (Figure 1) in order to fully capture the differences in the GVI distribution between the ancient city area and the new city area. The total area of 204.05 km2 is made up of the ancient city area (75.47 km2) and the new city area (128.58 km2). The study area is 204.05 square kilometers in total (Figure 1), of which the new city’s size is 128.58 square kilometers and the ancient city’s area is 75.47 square kilometers. The ancient city is in a square pattern, preserving a large number of historic districts and cultural relics and monuments. The new city extends around the ancient city, which is mainly extended to the west under the influence of the policy of “Zhengbian integration.” In recent years, the Kaifeng Municipal Government has continued to promote the “Green City” project, adopting the strategy of improving the quality of greening in the ancient city and ecological construction in the new city. The built-up area of Kaifeng City is expected to have 41.02% green covering by 2023, 40.74% green space, and 15.09 square meters of park green space per person.
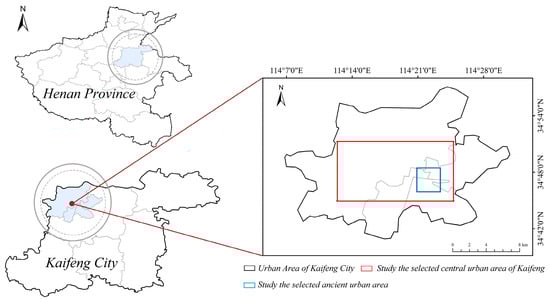
Figure 1.
Research area and scope.
In Kaifeng City, trees, bushes, and herbaceous vegetation are the most common types of vegetation used in landscaping. Styphnolobium japonicum, Fraxinus chinensis, Ginkgo biloba, Magnolia grandiflora, and Ulmus sp. are among the trees present. Shrubs are mostly Rosa chinensis Jacq, Jasminum nudiflorum Lindl, and Lagerstroemia indica L. In addition to preserving the Song Dynasty gardens’ cultural legacy, the lush green foliage serves ecological purposes like air purification, cooling, and shading.
2.2. Data Sources and Processing
The study area used a differentiated evaluation strategy instead of the traditional FAT method, dividing the 204.05 km2 study area into the ancient city (75.47 km2) and the new city (128.58 km2) for the evaluation of equity (equality), focusing on regional differentiated allocation rather than equal distribution (equality parity). The study used the Baidu Map Street View Service API to gather street view picture data and the OpenStreetMap open data platform to gain road network and administrative division data for Kaifeng City.
Streetscape observation point extraction adheres to the geographic sampling premise that “sampling density should match spatial complexity” [25], and uses a differentiated stratified sampling technique based on the idea of spatial heterogeneity. Due to its complex spatial texture and narrow streets and alleys, the ancient city adopts 100-m spacing. The new town adopts 250-m spacing due to its well-organized road network. This differentiated design reflects the essential differences in the spatial characteristics of the two areas, and finally 2508 sampling points (19.5 points/km2) were deployed in the new city and 417 sampling points (5.5 points/km2) were deployed in the old city. After spatial optimization and screening (excluding invalid points such as intersections and construction areas, and excluding sampling points with poor image quality), 2925 effective observation points were finally identified. GVI measures visual greening elements (including vertical greening) based on the sampling points of the streetscape, which is complementary to the horizontal measurement of traditional satellite imagery of vegetation coverage, and is more suitable for the accurate identification of three-dimensional greening in the ancient city.
The study obtained 121,278 records of POI data inside the Kaifeng City study region using the Baidu Map Open Platform API. After filtering the POI data points based on the study area’s latitude and longitude coordinates, 57,266 records remained. With distinct search radii (1500–2000 m) established for the eight main categories of dining, shopping, transportation, entertainment, education, healthcare, lodging, and finance, the data collection encompasses four major downtown areas: Longting District, Gulou District, Shunhe Hui District, and Yuwangtai District. Multidimensional attribute variables, including area, category, name, and address latitude and longitude coordinates, are present in the obtained raw POI data. In order to examine the connection between various functional areas and GVI rates, the POI data are categorized based on functional attributes using the Urban Land Use Classification and Planning and Construction Land Use Standards (GB50137-2011) [26] as well as Kaifeng City’s historical and cultural features. In order to filter out inaccurate points outside the research border, duplicate records were found and combined using the spatial clustering technique during the data cleaning phase. The density of each type of POI (POI/km2) was determined by constructing a density distribution raster using the kernel density estimation (KDE) approach based on the cleaned POI data.
2.3. GVI Calculation Methodology
2.3.1. DeepLab-ResNeSt269 Modeling
The DeepLab-ResNeSt269 semantic segmentation model, which is built on the MXNet framework and comprises 23 categories of common urban components, such as roads, buildings, and vegetation, is used in this study. It is appropriate for analyzing urban streetscapes. The ResNeSt269 backbone network serves as the foundation for the DeepLab-ResNeSt269 semantic segmentation model, which also incorporates the Split-Attention mechanism, which improves visual feature capture at various scales and works well with vegetation elements of various sizes and shapes in intricate streetscape photos [27]. The ADE20K dataset is used to pre-train the model [27]. Normalized street view images are used as model inputs, and the outputs are the predicted probability distributions of the categories for each pixel. The argmax operation is used to obtain the final pixel-level classification results. To determine the overall visible fraction of green materials, the study aggregated three categories from the ADE20K dataset with category IDs of 4 (trees), 9 (grass), and 12 (plants) into the Vegetation category, as illustrated in Figure 2.
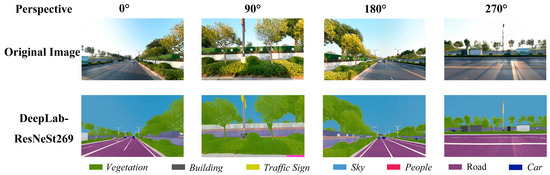
Figure 2.
Scene coverage effect of semantic segmentation.
In order to standardize the image size (tuned to 800 × 600 pixels), brightness contrast adjustment, and anomalous image screening, the study applied a uniform preprocessing procedure to all street view photographs. The following formula was used to determine the GVI:
where is the total number of pixels in the image, and is the number of pixels identified as belonging to the vegetation category. A greater degree of greenness in the visual range is indicated by higher values in the green visibility value domain, which runs from 0 to 100%.
The study gathered street view images at each observation point in four horizontal directions (0°, 90°, 180°, and 270°) to lessen the possibility of single-direction observation. The GVI in each direction was then determined independently, and the composite GVI was computed using the weighted average method. Urban spatial morphology and pedestrians’ visual perception traits are used to determine the weights. The study’s weight coefficients are set at 0.4 for the forward direction (0°), 0.25 for the right side (90°) and left side (270°), and 0.1 for the backward direction (180°). This is based on a thorough analysis of pedestrians’ visual perception characteristics and urban spatial morphology [12]. Pedestrians typically use the forward view (0°) as their primary observation direction, and Kaifeng city roads are primarily oriented in east–west and north–south directions. This weighting approach can more precisely reflect the degree of greening that pedestrians perceive in urban areas and is more consistent with the actual visual perception habits of walking. The equal weighting calculation approach is utilized to prevent directional bias in special places, such as small alley spaces in historical and cultural neighborhoods, because of their unique spatial scales and observation techniques. The formula is
where the weighting factors for the four directions are , , , and .
2.3.2. Verification of Model Accuracy
The validation dataset was created by screening 186 high-quality streetscape photos from the study location to guarantee the DeepLab-ResNeSt269 model’s recognition accuracy in the Kaifeng city streetscape environment. Four firing directions—east, south, west, and north—are included in the validation samples, which have strong spatial representativeness and cover a variety of locations, including the old and new cities. The image pixels are categorized into four groups—background, vegetation, building, and road—using the CVAT platform for manual annotation, with an emphasis on the accuracy of plant recognition.
Strict quality control was applied to the validation photos, and poor-quality photos with blurring and overexposure were eliminated. With a focus on accurately labeling the vegetation area, the image pixels were categorized into four groups: background, vegetation, building, and road. All validation photos were accurately labeled by hand using the CVAT platform. Overall accuracy, vegetation precision, vegetation recall, vegetation F1 score, and vegetation Intersection over Union (IoU) were all included in the evaluation index system. The model’s overall performance was assessed by the F1 score, which is the reconciling average of precision and recall; the pixel-level segmentation precision was measured by the intersection ratio of prediction and real labeling, or IoU. The model’s overall performance was assessed by the F1 score, which is the reconciling average of precision and recall; the pixel-level segmentation accuracy was measured by the intersection ratio of predicted and true annotations, or IoU. The model’s capacity to identify vegetation in the streetscape environment of Kaifeng City was thoroughly assessed by contrasting the model prediction results with the manually labeled values.
3. Research Methodology
Given the unique conflict between the preservation of historic and cultural cities and the growth of the GVI, this study’s technical approach specifically aimed to do the following: Under the restrictions of cultural preservation, GVI assessment overcomes the limitations of the traditional area indicator and can measure the impact of “apparent greening” rather than “adding greening”; the competitive relationship between green space and functional layout is revealed by POI analysis, which aids in understanding the spatial mechanism of the contradiction. The fairness evaluation system can detect disparities in GVI distribution between new and old urban areas and offers a quantitative foundation for achieving GVI fairness while adhering to protection constraints. In order to make the study’s findings more applicable and realistic, this multi-dimensional and multi-scale analysis framework offers methodical technical assistance for resolving the unique problems of greening development in historic and cultural cities while taking into account conservation constraints like historical and cultural preservation and spatial pattern limitations. Figure 3 depicts the study’s technical route.
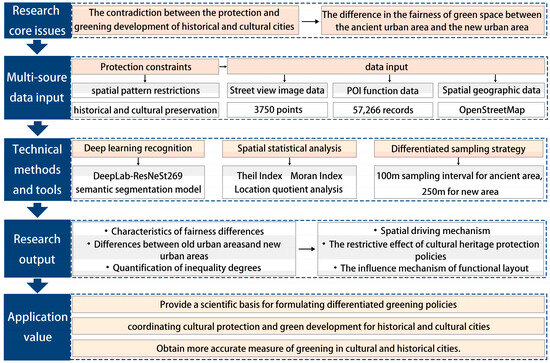
Figure 3.
Framework for the research technology pathway.
3.1. Methods of Statistical Analysis
The fundamental distribution features of the GVI in Kaifeng City were examined using descriptive statistical analysis. The GVI’s centralized trend, discrete degree, and distribution range are all fully reflected by computing the statistical quantities, including mean, median, standard deviation, maximum, and lowest values. In the meantime, the greening rate is separated into several grade intervals using frequency distribution analysis, and the sample proportion of each grade is tallied to show the GVI distribution pattern.
The degree of the linear relationship between POI density and green visibility was measured using the Pearson correlation test, which was computed as follows:
where is the sample size, and are the corresponding means, is the POI density, and is the green visibility. The strength of the linear link between the two variables increases with the correlation coefficient’s absolute value.
By comparing the variations in the GVI distribution across various spatial units and functional areas, classification statistical analysis can identify the characteristics of spatial heterogeneity. Its primary components are the statistical analysis of GVI in regions with various functional kinds of POI data, the comparison of GVI between the old and new cities, and the statistics of the geographical distribution features of various GVI classes.
3.2. Method for Evaluating Fairness
In order to assess the geographical fairness of the greenness rate in Kaifeng City and create a multi-dimensional fairness evaluation system, the study uses a range of spatial statistical techniques, including Theil’s Index [28], locational entropy [29], Moran’s Index [30], etc.
One decomposable spatial imbalance metric that can be used to assess the GVI distribution’s fairness and examine its makeup is the Theil Index. The Theil Index, which is calculated using the following formula, was used in the study to quantitatively evaluate the GVI distribution characteristics in Kaifeng City:
The GVI value of area is represented by , the city’s overall GVI by , the number of sampling points in area is represented by , and the total number of sampling points in the city by .
The two halves of the Theil Index are intraregional inequality and interregional inequality:
There are many ways to express intra-regional disparities:
where is region ’s Theil Index, and is the total of region ’s GVI. This decomposition technique can show the multi-scale features of the GVI distribution and detect spatially unbalanced contributions at various sizes.
An indicator for assessing the relative concentration of items in an area, location entropy (LQ) can show spatial variations and beneficial distributions of the GVI. In order to examine the spatial distribution features of the GVI and its equity in Kaifeng City, the study used the location entropy method:
The zonal entropy of the GVI for region is represented by . A value of > 1 implies above the citywide average, while a value of < 1 implies below The spatial allocation imbalance of urban greening resources is made evident by the zone entropy analysis, which clearly shows the spatial distribution of the beneficial and disadvantaged zones of the GVI.
In order to assess the degree of spatial aggregation or dispersion of attribute values in the studied area, Moran’s I is a crucial statistic for analyzing the spatial autocorrelation of regional features. Positive values indicate positive correlation (agglomeration), negative values indicate negative correlation (dispersion), and values near 0 indicate random distribution. The index’s value falls between −1 and 1. In order to examine the spatial autocorrelation features of the GVI and its fairness in Kaifeng City, the study combines the global and local Moran’s Indices. The following formula is used for calculation:
where is the number of sampling points, represents elements of the spatial weight matrix indicating the spatial relationship between points and , and are the GVI values at points and , respectively, is the average GVI value across all sampling points, and is the sum of all spatial weights. While local Moran’s I can pinpoint high–high clustering locations, low–low clustering areas, and spatial anomalies, the global Moran’s I represents overall spatial correlation and accurately reveals the spatial equitable features of the GVI distribution.
3.3. Development of the GVI Fairness Evaluation System
It is challenging to apply the conventional fairness evaluation approach based on green area to the complicated spatial context of ancient cities because of the unique limitations of historical and cultural cities with regard to cultural preservation and greening development. To assess the distribution of perceived fairness of greening from a humanistic standpoint, a multi-dimensional GVI fairness evaluation system was developed in this research. Figure 4 illustrates the evaluation method.
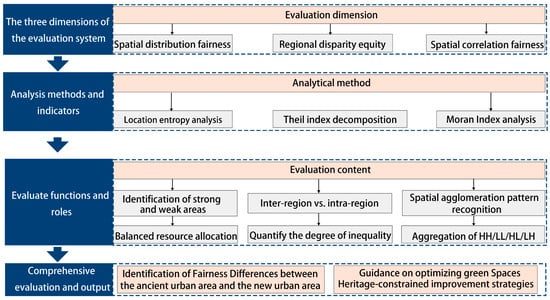
Figure 4.
GVI fairness evaluation system construction framework.
The locational entropy method is used by the fairness of spatial distribution to assess relative concentration of the GVI in various places. When the location entropy is close to 1, it means that the distribution is relatively balanced; when it is greater than 1, it means that the region’s GVI is higher than the city’s average level; and when it is less than 1, it means that it is lower than the average level. The distribution of greening resources’ favorable and unfavorable areas can be visually identified using this indicator, which also serves as a foundation for measuring the GVI balance.
Equity in Regional Differences measures the extent of GVI inequality within each region as well as between new and old urban regions using the Theil Index’s decomposition method. The Theil Index can be broken down into two parts: intra-regional inequality and inter-regional inequality. It also determines whether macro-urban or micro-street disparities are the primary cause of inequality in the GVI distribution and offers scientific recommendations for the development of focused improvement plans.
Spatial correlation equity analyzes the spatial autocorrelation characteristics of the GVI through Moran’s Index to identify different spatial agglomeration patterns, such as high–high agglomeration and low–low agglomeration. Positive spatial autocorrelation indicates that similar GVI values are spatially clustered and distributed, which may lead to the phenomenon of the “green divide.” Localized spatial autocorrelation analysis can pinpoint the problem areas and provide a targeting basis for spatial management.
4. Results
4.1. Results of the Accuracy Validation of the DeepLab-ResNeSt269 Model
The streetscape validation dataset from Kaifeng City shows good performance with the DeepLab-ResNeSt269 model. An overall accuracy of 88.5 ± 17.5%, vegetation precision of 77.7 ± 27.5%, vegetation recall of 72.3 ± 27.0%, vegetation F1 score of 71.7 ± 27.5%, and vegetation IoU of 61.5 ± 26.8% are the results of the verified photos.
The DeepLab-ResNeSt269 model’s performance comparison with the benchmarks for the typical urban environment and the outstanding model is shown in Figure 5. With overall accuracy and plant recognition accuracy surpassing the good threshold (70%) and approaching the level of the excellent model benchmark, the results demonstrate that the model outperforms the typical urban scene benchmark in Kaifeng City. Trendline analysis demonstrates the model’s validity and dependability in the intricate context of historic and cultural cities by demonstrating that it maintains a comparatively constant performance across all metrics.
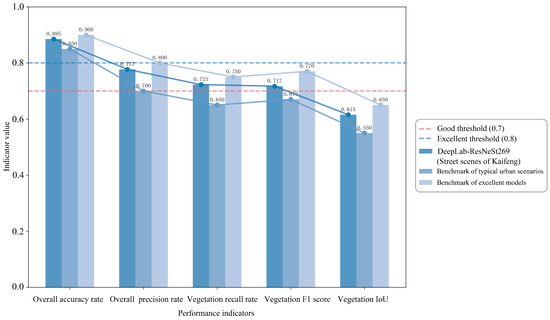
Figure 5.
DeepLab-ResNeSt269 model performance validation and benchmark comparison using streetscape data from Kaifeng City.
The validation results demonstrate that the DeepLab-ResNeSt269 model is technically capable of performing precise GVI calculations in Kaifeng City. The vegetation IoU of 61.5% and overall accuracy of 88.5% offer a solid technical foundation for further assessments of GVI fairness.
4.2. General Distribution Features of Kaifeng City’s Green Vision Rate
The overall GVI rate in Kaifeng is 12.41% on average, 9.73% on the median, 10.11% on the standard deviation, and 61.36% on the maximum value, which are based on the semantic segmentation model recognition and computation of 2925 street scene sample points (Table 1). According to this finding, Kaifeng City’s overall GVI rate is between low and medium, and the spatial variation is more noticeable.

Table 1.
Kaifeng City’s descriptive statistical findings for GVI.
With very few areas with high GVI and the majority of regions concentrated in low to medium levels, the GVI frequency distribution exhibits a left-skewed pattern. Based on the level of GVI [31], Kaifeng city area was divided into three classes, as shown in Table 2. The statistical results show that the GVI in Kaifeng City was mainly concentrated in the <15% interval, accounting for 66.48% of the total number of observation points.
Table 2.
Kaifeng City’s GVI rating’s spatial distribution statistics.
According to Figure 6, the western new city depends on the systematic ecological layout to create its GVI quality, while the northern portion along the Yellow River ecological belt forms a belt-shaped high value area. Kaifeng City’s overall GVI decreases from the periphery to the city center. The city is dominated by places with medium and low GVI, which are primarily found in the high-density commercial districts and the center of the old city. These areas, together with a few others with medium GVI, make up Kaifeng City’s basic base hue of GVI distribution.
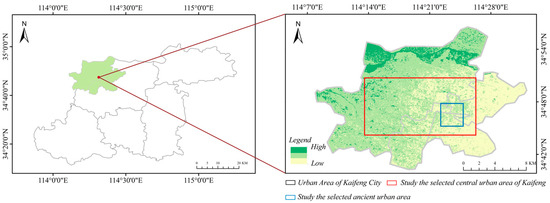
Figure 6.
Kaifeng urban area’s GVI distribution.
4.3. Characteristics of the Difference in the Fairness of GVI Between Old and New Urban Areas
4.3.1. Difference in GVI Between Old and New Urban Areas
There were notable distributional changes in the GVI between the old city and the new Kaifeng. Their geographical distribution patterns differ significantly, as illustrated in Figure 7a, despite the fact that their average GVIs are comparable (12.98% in the historic city area and 12.60% in the modern city region). Low GVI dominates both the old and new urban regions in terms of distribution pattern, as seen in Figure 7b; however, they exhibit distinct concentration characteristics: In the new urban regions, this percentage is even higher at 52.3%, but in the old urban areas, 48.5% of the sampling locations have GVIs of less than 10%. With a proportion of 9.2%, roughly twice as large as the New Town region’s (5.0%), the Old Town area clearly has an edge in the distribution of areas with high GVI (30–40%), suggesting that it has more high-quality greening nodes. The study classified regions with GVI values greater than 30% as high green visual perception nodes according to the GVI classification criteria [31]. The following factors form the basis of this threshold: (1) International studies have demonstrated that areas with a GVI greater than 30% can provide pedestrians with adequate green visual perception and effectively improve mental health and environmental comfort [32]. (2) Parks, traditional gardens, and large greening landscapes in the city are examples of areas of greening concentration that typically correspond to high-value nodes. These areas are important spatial carriers for residents to obtain a high-quality visual experience of greening. The box and line plots in Figure 7c illustrate how the new city’s uneven greening development is reflected in the old city’s slightly higher median GVI rate and higher data concentration, while the new city’s GVI rate distribution is more discrete and has a wider range of extremes.
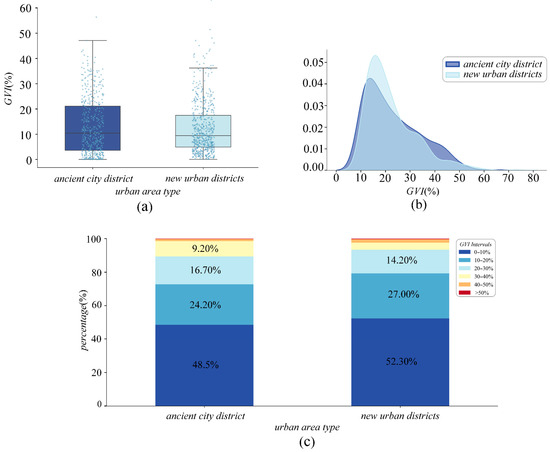
Figure 7.
(a) Comparison of the mean value of GVI rate between ancient and new urban areas. (b) Comparison of the density characteristics of GVI distribution. (c) Comparison of the distribution characteristics of GVI rate class.
4.3.2. Relationship Between POI Distribution and GVI
The POI distribution in Kaifeng City exhibits a typical geographic pattern of central concentration and outward decrease. The downtown POI density creates a notable high-density core area, which mostly reflects the historic commercial hub and the heart of Kaifeng’s ancient city. POI density exhibits clear gradient decay characteristics from the center to the periphery, and this centered distribution pattern is very compatible with the spatial structural features of traditional historical and cultural cities.
In Kaifeng City, POI density and GVI exhibit clear distributional differential characteristics. With a coefficient of variation of 2.45 and a skewness of 5.34, POI density is highly right skewed, as illustrated in Figure 8. This reflects the opposing features of low-density distribution in the majority of areas and high-density agglomeration in a few core areas. The GVI distribution, on the other hand, has a coefficient of variation of 0.81 and a skewness of just 1.01. In contrast to the progressive rise in the GVI rate from 0% to 61.36%, which indicates the spatial differentiation feature of high concentration of urban functions and reasonably balanced distribution of green space, there is a vast span in POI density from 3.94/km2 to 4087.71/km2.
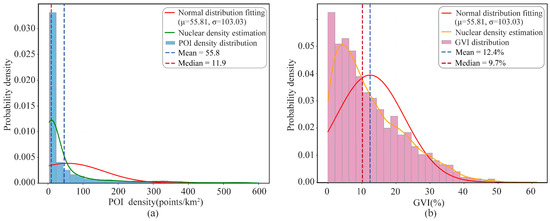
Figure 8.
(a) POI density distribution statistics. (b) GVI distribution statistics.
In the Kaifeng urban region, a Pearson correlation test between POI records and GVI data showed a strong negative association overall (r = −0.0847, p < 0.001) between POI density and GVI. Instead of a straightforward competing relationship, this weak association illustrates the intricate interaction mechanism between the historical and cultural city’s greening space and practical layout.
Subsequent examination of the features of the GVI distribution across various POI density intervals revealed that the GVI distribution was comparatively discrete in the low-density region (density less than or equal to 33% of the quartiles), with a mean value of 13.07% and a coefficient of variation of 0.80; the GVI dropped marginally to 12.56% in the medium-density region (density between 33% and 66% quartiles); it dropped even more to 12.09% in the high-density region (density greater than 66% quartiles), with a coefficient of variation of 0.88, suggesting that the GVI was more volatile in the high-density region.
According to the functional type analysis, there are distinct features in the link between the four main POIs and GVI, as indicated in Table 3. It demonstrates that Kaifeng City’s urban functional distribution and green space have some adaptive coordination, and that various functional zones have preserved a certain amount of green space.
Table 3.
Relationship between different types of POI density and GVI.
4.4. Spatial Equity Evaluation and Spatial Mechanism Analysis of GVI in Kaifeng City
4.4.1. Evaluation and Decomposition Analysis of GVI Based on the Theil Index
There is some disparity in the Kaifeng metropolitan region, as indicated by the general Theil Index of GVI of 0.3350. The Theil Index’s decomposition shows that intra-regional inequality accounts for 99.9969% of the total, while inter-regional inequality accounts for 0.0031 percent, or 0.00001, which is a very minor contribution. As can be shown in Table 4, the new urban area’s Theil Index (0.3412) is marginally higher than the old urban area’s (0.3287), suggesting that the GVI distribution within the new urban area is somewhat out of balance. The significant aspect of spatial inequality of the GVI in Kaifeng is revealed by the Theil Index analysis. The very small contribution of regional inequality (0.0031%) suggests that there is no significant difference between the two regions in terms of overall greening level and that the average GVI levels of the ancient city and the new city are very similar (the difference is only 0.38%). The unequal allocation of greening resources within the areas appears to be the primary cause of the actual disparity, as indicated by the 99.9969% absolute domination of intra-regional inequality.
Table 4.
Decomposition of Theil Index for GVI in Kaifeng.
4.4.2. Equity Analysis of GVI Based on the Spatial Distribution Characteristics of Locational Entropy
Based on the statistical results of the streetscape sampling points, Table 5 shows a polarized tendency, with the most common points having zone entropy <0.5 and those with zone entropy ≥1.5. The high-value zones exhibit a mixed pattern, primarily found in parks, beautiful places, and important thoroughfares; the low-value zone mainly covers high-density built-up areas such as residential and commercial areas, as shown in Figure 9. Of the points within the ancient city area, 31.5% have a zone entropy >1, mainly concentrated around the traditional gardens. The new city area is 28.7%, forming a belt-shaped high-value zone along the main road.
Table 5.
Distribution statistics of GVI location quotient in Kaifeng.
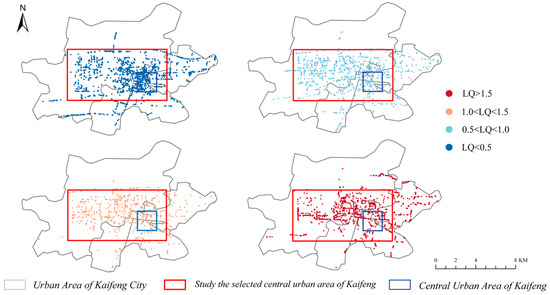
Figure 9.
Spatial distribution of entropy of GVI zones in Kaifeng City.
4.4.3. Equity Analysis of Green Ratings Based on Moran’s Index
The global Moran’s Index of the GVI in Kaifeng is 0.3824 (p < 0.001), based on the calculation of street scene sampling points (Table 6). This suggests that there is a significant positive correlation between GVI and space, meaning that areas with high values tend to be clustered, and areas with low values tend to be clustered as well, exhibiting patchy distribution characteristics.
Table 6.
Analysis of spatial agglomeration in the city.
As illustrated in Figure 10, the local Moran’s Index analysis separates the sample points into four spatial association patterns: the low–low agglomeration area is widely distributed inside the residential area and the urban fringe area; the high–low anomalous area and the low–high anomalous area accounted for only 6.26%, which are primarily located in the junction where the difference in the level of greenness is obvious; the non-significant area accounted for 42.61%. The high–high agglomeration area is primarily distributed around the park scenic spots and along the main roads. From a fairness standpoint, Kaifeng City’s GVI distribution exhibits a notable spatial imbalance, with low–low agglomeration standing out as a particularly noticeable phenomenon. The significant spatial agglomeration characteristics reflect the imbalance in the distribution of green space resources, and it is recommended to prioritize the investment of greening resources in the low–low agglomeration area and build a fair supply mechanism for the GVI.
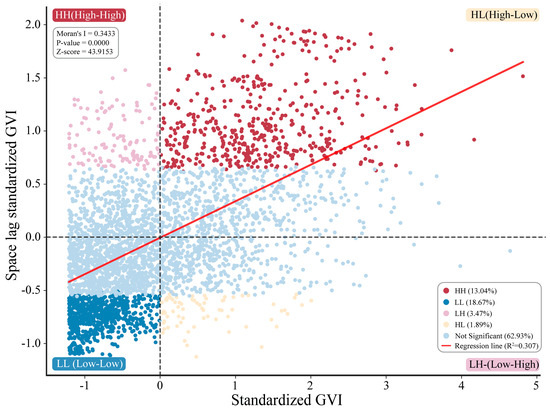
Figure 10.
Moran’s I scatter plot of GVI in Kaifeng city.
5. Discussion
5.1. Characteristics of the Spatial Differentiation of GVI
Through multi-dimensional index analysis, this study confirms the research hypothesis: there is, in fact, a significant difference in GVI equity between Kaifeng City’s new and ancient urban areas, and this difference is primarily caused by the combined effects of functional layout patterns, spatial texture characteristics, and cultural protection policies. The results of the study confirmed that the equity of green space in historical and cultural cities was characterized by differential distribution at different spatial scales, and the decomposition of the Theil Index showed that the micro-street scale difference was the main contradiction (99.9969% of the total), while the negative correlation between the POI density and the GVI rate (r = −0.085) revealed the mechanism of the competition between urban function and green space. These results offer a scientific foundation for optimizing the layout of green spaces while adhering to protection restrictions, in addition to confirming the efficacy of the GVI evaluation approach in historic and cultural cities. From the standpoint of spatial analysis, Kaifeng City’s GVI exhibits clear spatial heterogeneity. The traditional two-dimensional green space indicators struggle to adequately capture this micro-spatial differentiation phenomenon, but high-resolution streetscape data combined with spatial statistical methods can more precisely quantify this spatial pattern.
A considerable spatial clustering phenomena (Moran’s Index 0.3824, p < 0.001) resulting in a geographical pattern of low–low agglomeration area (19.55%) and high–high agglomeration area (13.47%) was the manifestation of the GVI imbalance in Kaifeng City. The distinctive pattern of historical and cultural cities in greening spatial organization is reflected in this spatial autocorrelation characteristic. This pattern is closely linked to the city’s development trajectory and historical lineage, which have a higher spatial complexity than that of contemporary planned cities.
The Theil Index study reveals that Kaifeng City’s spatial inequality of GVI is primarily manifested at the micro-street level as opposed to the macro-urban level. This conclusion is noteworthy because it implies that, even within the same functional region, residents’ access to green resources varies significantly. Similar to this, Kabisch et al.’s study on the fair distribution of green space highlighted how micro-scale variations in natural resources have a more direct effect on locals’ day-to-day experiences, which are frequently disregarded by conventional macro-evaluation techniques [33]. This micro imbalance was further supported by the location entropy analysis and Moran’s Index, which showed that low-value areas of the GVI exhibit significant spatial agglomeration characteristics. The proportion of low-value areas (location entropy < 0.5) was as high as 35.40%, while the proportion of “low–low agglomeration areas” was as high as 19.55%. Similar to how the unequal distribution of blue-green infrastructure results in disparities in the benefits of microclimate regulation, as discovered in the study by Lin [34], this spatial clustering phenomenon may cause an “ecological services divide” or a notable lack of ecosystem services in some places that affects the spatial balance of ecological functions like climate regulation and air purification in cities.
5.2. Distinctive Features of the New and Old Urban Areas
The GVI distribution has been significantly impacted by the historical and cultural city’s distinct spatial texture and growth trajectory. The ancient city’s juxtaposition of widely dispersed low-value parts and isolated high-value sites illustrates the double effects of historical and cultural preservation laws on green space: the ancient city’s core has a generally low GVI due to the preservation of traditional neighborhoods, which limits the development of expansive green spaces. On the other hand, the historical parks that have been preserved create notable high GVI points, like Longting Park, Tieta Park, and the Garden of the Riverside at Qingming, which have grown to be valuable green resources in the ancient city. The new city’s GVI, on the other hand, reflects the fact that modern urban planning places greater emphasis on the organized design of the road greening network by forming a band of high-value regions along the main roads. This variation in the GVI distribution pattern between old and new urban regions is consistent with Lu et al.’s findings in other cities, which show how urban planning ideas have changed over time [35].
Another significant aspect influencing the GVI distribution is land use and urban function. There is a competitive link between urban functional agglomeration and green space, as evidenced by the established negative correlation between POI density and GVI rate. GVI rates are often low in traditional neighborhoods and high-density commercial areas, which is in line with Gong et al.’s findings in high-density urban environments [36]. However, Kaifeng’s correlation coefficient (r = −0.085) is comparatively low, and there could be several explanations for this: (1) As a historical and cultural city at the prefecture level, Kaifeng City has a low overall functional density and little direct conflict between urban functions and green space; (2) in the long-term growth process, historic and cultural cities have established a comparatively stable function-greening space configuration pattern, and various functional regions have, to some degree, preserved the fundamental level of greening; (3) the relationship between functional density and greening space is more complicated due to the mixed-function nature of traditional neighborhoods, and it can be challenging for straightforward linear correlation analysis to adequately reflect this complexity. Nonetheless, Kaifeng’s correlation coefficient (r = −0.085) is comparatively low, which could be attributed to both the city’s adaptive coordination of greenery across various functional regions and its status as a prefecture-level city with a generally low functional density. The differentiated relationship between different types of POIs and green visibility further confirms this point. For example, shopping consumption POIs have the strongest negative correlation while transportation facility POIs have a weaker negative correlation, reflecting differences in the capacity of different functional spaces to accommodate greenery.
5.3. Recommendations for Optimizing Green Spaces
As a three-dimensional spatial perception indicator, the GVI has a unique value, according to this study, and its evaluation results differ greatly from those of conventional two-dimensional green space indicators. Even though Kaifeng’s built-up area has high levels of green space (40.74%) and green coverage (41.02%), the streetscape GVI assessment revealed that 66.48% of the area had a GVI rate below 15%. The need for a multifaceted evaluation method in urban green space research is confirmed by this “green space-green vision” distinction, which draws attention to the essential distinction between assessing urban greening from an overhead perspective and from a pedestrian’s perspective.
The “low–low clustering area” ought to be the area with the highest priority for greening interventions, according to the findings of the spatial equity analysis. According to the study, 17.95% of the sample points were in low–low concentration areas, which are primarily found in inner residential areas and urban fringe areas. These areas not only have low GVI levels but also form spatially contiguous areas with insufficient greening, which has a detrimental effect on residents’ green well-being. At the same time, green space investment in low–low agglomeration areas has higher marginal benefits because (1) The proximity effect may cause individual low-value points to respond to a wider range; (2) the clustering effect magnifies the negative effects of inadequate greening. These areas also tend to be inhabited by relatively disadvantaged groups of residents.
The following tactics are suggested for Kaifeng City’s GVI optimization: (1) The main focus should be on improving the greening level of the “low–low clustering areas“ through small-scale greening initiatives such as pocket parks, vertical greening walls, and street micro-greens. These interventions are particularly suitable for low–low areas where limited space restricts large-scale greening, while also effectively improving the GVI. Moreover, such techniques are minimally intrusive to historic districts and can enhance green visibility without compromising cultural heritage. (2) It is recommended that a spatial governance path be adopted that combines balanced regional development with the strengthening of core advantages. Based on the ecological efficacy of high-value agglomerations, a network of ecological corridors should be constructed to promote the organic penetration and synergy of greening resources in the spatial dimension.
More significantly, this study’s examination of Kaifeng City creates a set of GVI evaluation methodological frameworks that may be applied to other historical and cultural cities, in addition to revealing the features of the GVI spatial distribution in this specific city. The study suggests deep learning-driven streetscape GVI evaluation, spatial fairness analysis with multi-indicator fusion, and functional correlation exploration with POI data integration, which can serve as significant methodological references for other well-known historical and cultural cities. Typically, these cities struggle with the conflict between traditional spatial texture and contemporary greening requirements.
5.4. Limitations
Although the study constructs a multidimensional evaluation system to analyze the spatial fairness of the GVI in Kaifeng City, there are still some limitations, such as the following: (1) The validation results of the DeepLab-ResNeSt269 model show that it has good applicability in Kaifeng City, but there is still room for improvement of the model’s identification accuracy in the complex ancient architectural environments and the areas with sparse vegetation. (2) The comparatively constant distribution of urban functions is reflected in the POI data. Variations in the real demand for green spaces from certain functional sectors (such temporary or seasonal activity locations) may be overlooked by this static approach. (3) Baidu Street View data has a long update cycle, which prevents access to real-time greening conditions, and some data may lag by 1–3 years. (4) The season of photography was not consistently controlled for in this investigation. Seasonal variations in vegetation conditions, such as wintertime decreased visibility of deciduous plants, might have affected the GVI computation. The following elements can be used to further future research: (1) Increase the coverage of validation samples, optimize the model algorithm, and integrate multi-source data, including satellite images and UAV aerial photography, to improve recognition accuracy and compensate for the blind region of street view coverage. (2) Create a system for collecting data over several seasons and conducting comparison analysis to limit the influence of seasonal factors on GVI evaluations. (3) Integrate socioeconomic indicators and real-time updated multi-source data, investigating the deeper mechanisms of equity in the GVI distribution, setting up a long-term monitoring system to examine the patterns of temporal evolution, and carrying out a comparative study across multiple cities.
6. Conclusions and Prospects
This study employed spatial statistical techniques to methodically assess the distribution characteristics of the GVI rate and its fairness in Kaifeng City, utilizing deep learning technology and street view big data. The study’s primary findings are as follows:
- (1)
- With an average value of 12.07%, primarily concentrated in the <15% interval (66.48%), Kaifeng City’s GVI shows a spatial pattern of decreasing from the periphery to the city center, with the north and west forming a relatively high value area and the core area of the ancient city and the high-density built-up area as the main low-value area. The new city region has linear distribution features along the city’s main roadways, while the old city area is a point-like agglomeration.
- (2)
- There is a moderate imbalance in the GVI distribution (Theil index 0.3350), with the low-value area (35.40%) higher than the high-value area (25.10%), and obvious spatial clustering (Moran’s Index 0.3824). Micro-street scale differences (99.9969%) are the main contradiction, leading to unequal access to green resources for residents.
- (3)
- POI density is negatively correlated with the GVI (r = −0.085), but the correlation is relatively weak, indicating that there is a certain adaptive coordination between urban functions and green space in Kaifeng. The relationship between different types of POI and GVI data shows differentiated characteristics, with the strongest negative correlation of POI data for shopping and consumption (r = −0.088) and a weaker negative correlation of POI data for transportation facilities (r = −0.056), which reflects the relatively low functional density of the historical and cultural city and the differences in the capacity of different functional spaces to accommodate greening.
The GVI evaluation framework and spatial equity evaluation and analysis method of multi-source data fusion constructed in the study provide a systematic green space evaluation paradigm for historical and cultural cities facing the dual constraints of traditional protection and modern development. For comparable historic and cultural cities looking to maximize green area layouts while maintaining traditional landscapes, it also offers crucial methodological insights. It should be mentioned that adaptive modifications should be made depending on particular local settings, such as spatial characteristics, cultural preservation legislation, and climatic conditions, when adapting the methodological framework created in this study to other historic and cultural cities. Furthermore, to improve the accuracy and dependability of evaluation results, future research should further deepen the integrated analysis of multi-temporal data, taking into account the possible influence of seasonal elements and data timeliness. The multi-scale evaluation system from micro streets to macro urban areas established in the study has an important methodological reference value for similar historical and cultural cities to optimize their green space layouts under the premise of protecting their traditional landscapes.
Author Contributions
Conceptualization, Xuemin Shi, Bichao Hou and Huijun Yang; methodology, Huiqi Sun and Xuemin Shi; formal analysis, Huiqi Sun; data curation, Huiqi Sun; writing—original draft preparation, Huiqi Sun; writing—review and editing, Xuemin Shi; visualization, Bichao Hou and Huijun Yang; supervision, Xuemin Shi All authors have read and agreed to the published version of the manuscript.
Funding
This research received no external funding.
Data Availability Statement
Data will be made available on request.
Conflicts of Interest
The authors declare no conflicts of interest.
References
- Nowak, D.J.; Hoehn, R.; Crane, D.E. Oxygen production by urban trees in the United States. Arboric. Urban For. 2007, 33, 220–226. [Google Scholar] [CrossRef]
- Jim, C.Y.; Chen, W. Assessing the ecosystem service of air pollutant removal by urban trees in Guangzhou (China). J. Environ. Manag. 2008, 88, 665–676. [Google Scholar] [CrossRef] [PubMed]
- Chen, X.L.; Zhao, H.M.; Li, P.X.; Yin, Z.Y. Remote sensing image-based analysis of the relationship between urban heat island and land use/cover changes. Remote Sens. Environ. 2006, 104, 133–146. [Google Scholar] [CrossRef]
- Lafortezza, R.; Carrus, G.; Sanesi, G.; Davies, C. Benefits and well-being perceived by people visiting green spaces in periods of heat stress. Urban For. Urban Green. 2009, 8, 97–108. [Google Scholar] [CrossRef]
- Huang, B.X.; Li, W.Y.; Ma, W.J.; Xiao, H. Space accessibility and equity of urban green space. Land 2023, 12, 766. [Google Scholar] [CrossRef]
- Lin, G.S. Study on urban green space statistics. City Plan. Rev. 2013, 37, 80–84. [Google Scholar]
- Dai, D. Racial/ethnic and socioeconomic disparities in urban green space accessibility: Where to intervene? Landsc. Urban Plan. 2011, 102, 234–244. [Google Scholar] [CrossRef]
- Rigolon, A. A complex landscape of inequity in access to urban parks: A literature review. Landsc. Urban Plan. 2016, 153, 160–169. [Google Scholar] [CrossRef]
- Nesbitt, L.; Meitner, M.J.; Girling, C.; Sheppard, S.R.; Lu, Y. Who has access to urban vegetation? A spatial analysis of distributional green equity in 10 US cities. Landsc. Urban Plan. 2019, 181, 51–79. [Google Scholar] [CrossRef]
- Zhang, W.; Zeng, H. Spatial differentiation characteristics and influencing factors of the green view index in urban areas based on street view images: A case study of Futian District, Shenzhen, China. Urban For. Urban Green. 2024, 93, 128219. [Google Scholar] [CrossRef]
- Jim, C.Y.; Chen, S.S. Comprehensive greenspace planning based on landscape ecology principles in compact Nanjing city, China. Landsc. Urban Plan. 2003, 65, 95–116. [Google Scholar] [CrossRef]
- Yang, J.; Zhao, L.; McBride, J.; Gong, P. Can you see green? Assessing the visibility of urban forests in cities. Landsc. Urban Plan. 2009, 91, 97–104. [Google Scholar] [CrossRef]
- Li, X.; Zhang, C.; Li, W.; Ricard, R.; Meng, Q.; Zhang, W. Assessing street-level urban greenery using Google Street View and a modified green view index. Urban For. Urban Green. 2015, 14, 675–685. [Google Scholar] [CrossRef]
- Tang, F.; Zeng, P.; Wang, L.; Zhang, L.; Xu, W. Urban perception evaluation and street refinement governance supported by street view visual elements analysis. Remote Sens. 2024, 16, 3661. [Google Scholar] [CrossRef]
- Li, L.; Mu, X.; Jiang, H.; Chianucci, F.; Hu, R.; Song, W.; Qi, J.; Liu, S.; Zhou, J.; Chen, L.; et al. Review of ground and aerial methods for vegetation cover fraction (fCover) and related quantities estimation: Definitions, advances, challenges, and future perspectives. ISPRS J. Photogramm. Remote Sens. 2023, 199, 133–156. [Google Scholar] [CrossRef]
- Seiferling, I.; Naik, N.; Ratti, C.; Proulx, R. Green streets—Quantifying and mapping urban trees with street-level imagery and computer vision. Landsc. Urban Plan. 2017, 165, 93–101. [Google Scholar] [CrossRef]
- Zhang, Y.; Dong, R. Impacts of street-visible greenery on housing prices: Evidence from a hedonic price model and a massive street view image dataset in Beijing. ISPRS Int. J. Geo-Inf. 2018, 7, 104. [Google Scholar] [CrossRef]
- Soja, E.W. Seeking Spatial Justice; University of Minnesota Press: Minneapolis, MN, USA, 2013; Volume 16. [Google Scholar]
- Mohai, P.; Pellow, D.; Roberts, J.T. Environmental justice. Annu. Rev. Environ. Resour. 2009, 34, 405–430. [Google Scholar] [CrossRef]
- Ma, F. Spatial equity analysis of urban green space based on spatial design network analysis (sDNA): A case study of central Jinan, China. Sustain. Cities Soc. 2020, 60, 102256. [Google Scholar] [CrossRef]
- Harvey, D. Rebel Cities: From the Right to the City to the Urban Revolution; Verso Books: London, UK, 2012. [Google Scholar]
- Lefebvre, H. From the production of space. In Theatre and Performance Design; Routledge: Oxfordshire, UK, 2012; pp. 81–84. [Google Scholar]
- Zhou, Y.; Xie, H.; Liu, X.; Wang, X.; Wang, Z. From service capacity to spatial equity: Accurately and comprehensively evaluating urban park green space distribution under multi-trips mode. PLoS ONE 2024, 19, e0296629. [Google Scholar] [CrossRef]
- Openshaw, S. The modifiable areal unit problem. In Concepts and Techniques in Modern Geography; Geo Books: Norwich, UK, 1984. [Google Scholar]
- Fotheringham, A.S.; Wong, D.W. The modifiable areal unit problem in multivariate statistical analysis. Environ. Plan. A 1991, 23, 1025–1044. [Google Scholar] [CrossRef]
- GB 50137-2011; Code for Classification of Urban Land Use and Planning Standards of Development Land. Ministry of Housing and Urban-Rural Development of the People’s Republic of China: Beijing, China, 2011.
- Zhang, H.; Wu, C.; Zhang, Z.; Zhu, Y.; Lin, H.; Zhang, Z.; Sun, Y.; He, T.; Mueller, J.; Manmatha, R.; et al. Resnest: Split-attention networks. In Proceedings of the IEEE/CVF Conference on Computer Vision and Pattern Recognition, New Orleans, LA, USA, 18–24 June 2022; pp. 2736–2746. [Google Scholar] [CrossRef]
- Theil, H. Henri Theil’s Contributions to Economics and Econometrics: Econometric Theory and Methodology; Springer Science & Business Media: Dordrecht, The Netherlands, 1992; Volume I. [Google Scholar]
- Isserman, A.M. The location quotient approach to estimating regional economic impacts. J. Am. Inst. Plan. 1977, 43, 33–41. [Google Scholar] [CrossRef]
- Anselin, L. Local indicators of spatial association—LISA. Geogr. Anal. 1995, 27, 93–115. [Google Scholar] [CrossRef]
- Aoki, Y. Evaluation methods for landscapes with greenery. Landsc. Res. 1991, 16, 3–6. [Google Scholar] [CrossRef]
- Wang, R.; Yuan, Q.; Chen, T. Utilizing the green view index to improve the urban street greenery index system: A statistical study using road patterns and vegetation structures as entry points. Landsc. Urban Plan. 2023, 232, 104693. [Google Scholar] [CrossRef]
- Kabisch, N.; Haase, D. Green justice or just green? Provision of urban green spaces in Berlin, Germany. Landsc. Urban Plan. 2014, 122, 129–139. [Google Scholar] [CrossRef]
- Lin, Y.; Wang, Z.; Jim, C.Y.; Li, J.; Deng, J.; Liu, J. Water as an urban heat sink: Blue infrastructure alleviates urban heat island effect in mega-city agglomeration. J. Clean. Prod. 2020, 262, 121411. [Google Scholar] [CrossRef]
- Lu, Y.; Yang, Y.; Sun, G.; Gou, Z. Associations between overhead-view and eye-level urban greenness and cycling behaviors. Cities 2019, 88, 10–18. [Google Scholar] [CrossRef]
- Gong, F.Y.; Zeng, Z.C.; Zhang, F.; Li, X.; Ng, E.; Norford, L.K. Mapping sky, tree, and building view factors of street canyons in a high-density urban environment. Build. Environ. 2018, 134, 155–167. [Google Scholar] [CrossRef]
Disclaimer/Publisher’s Note: The statements, opinions and data contained in all publications are solely those of the individual author(s) and contributor(s) and not of MDPI and/or the editor(s). MDPI and/or the editor(s) disclaim responsibility for any injury to people or property resulting from any ideas, methods, instructions or products referred to in the content. |
© 2025 by the authors. Published by MDPI on behalf of the International Society for Photogrammetry and Remote Sensing. Licensee MDPI, Basel, Switzerland. This article is an open access article distributed under the terms and conditions of the Creative Commons Attribution (CC BY) license (https://creativecommons.org/licenses/by/4.0/).