

Optimization of a Layout for Public Toilets Based on Evaluation of Accessibility Through the Gaussian Two-Step Floating Catchment Area Approach

Abstract
1. Introduction
2. Materials and Methods
2.1. Study Area and Data Sources
2.2. Data and Processing
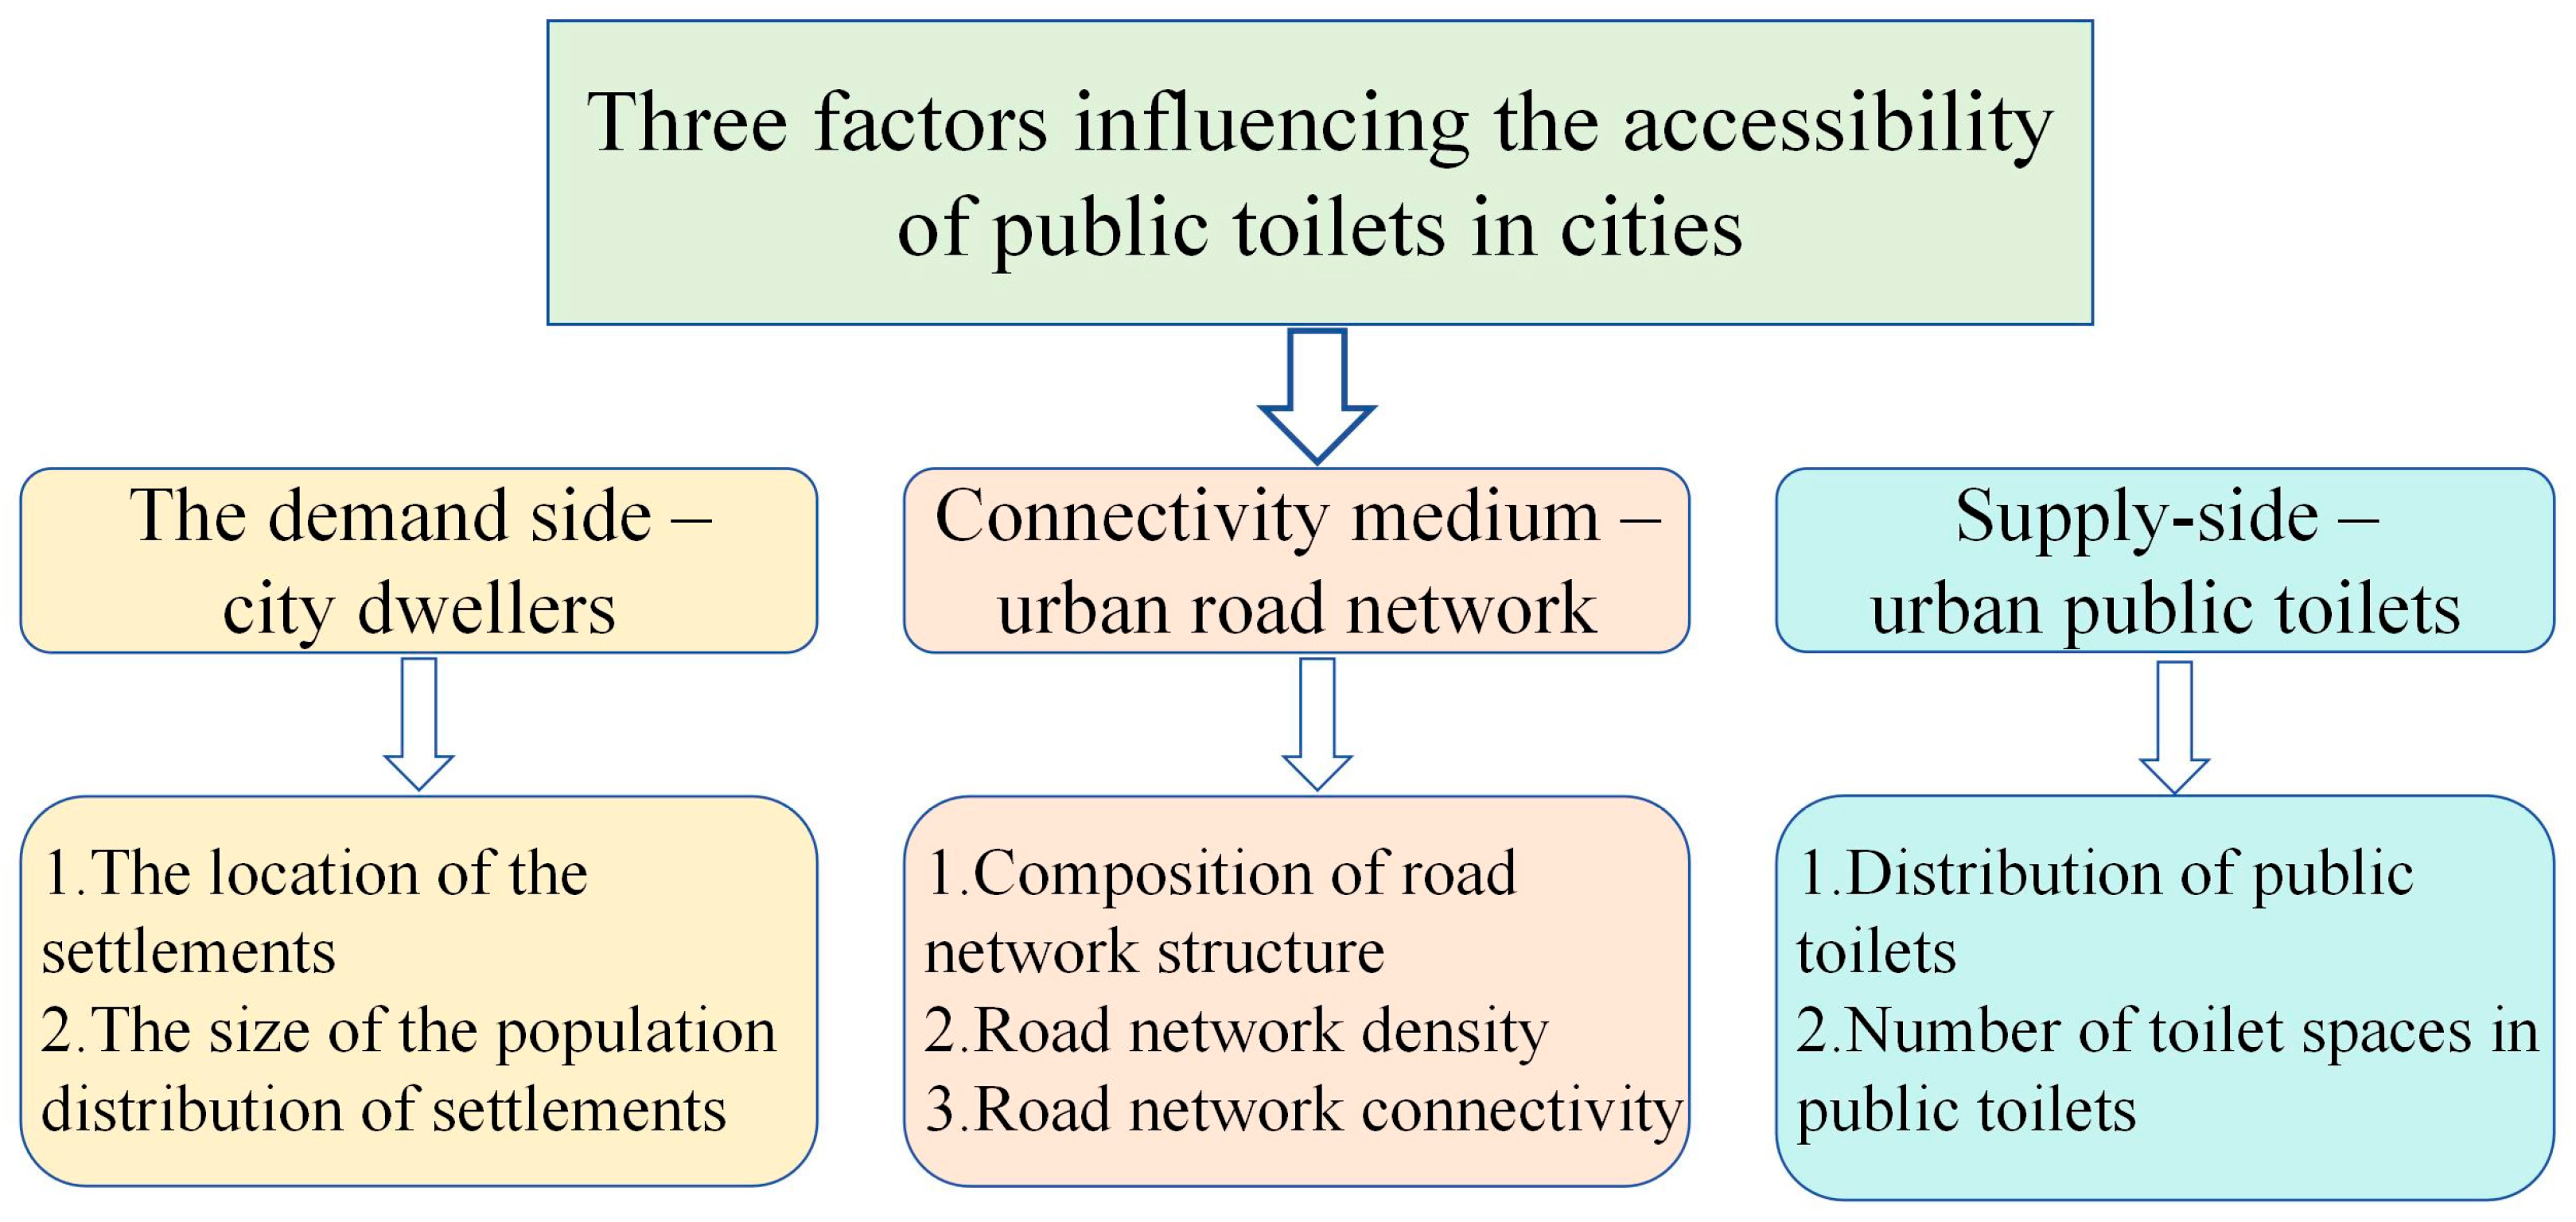
- Supply side factors: Even when public toilets have the same scale and spatial location, variations in the population distribution in the surrounding area may lead to significant differences in user evaluations of the service. Therefore, the supply side must consider the match between the population density of public toilets and the target service population;
- Demand-side factors: The spatial distribution pattern and total population size are critical determinants of the intensity of the demand for public toilet services and have a direct impact on accessibility levels;
- Connectivity factors: As an essential channel for residents traveling from origins to destinations such as public toilets, the urban transportation system, including its network structure, road density, and connectivity, greatly influences the accessibility assessment results. Typically, ring- or grid-like road structures are conducive to enhancing the spatial accessibility of public toilets.
2.3. Methods
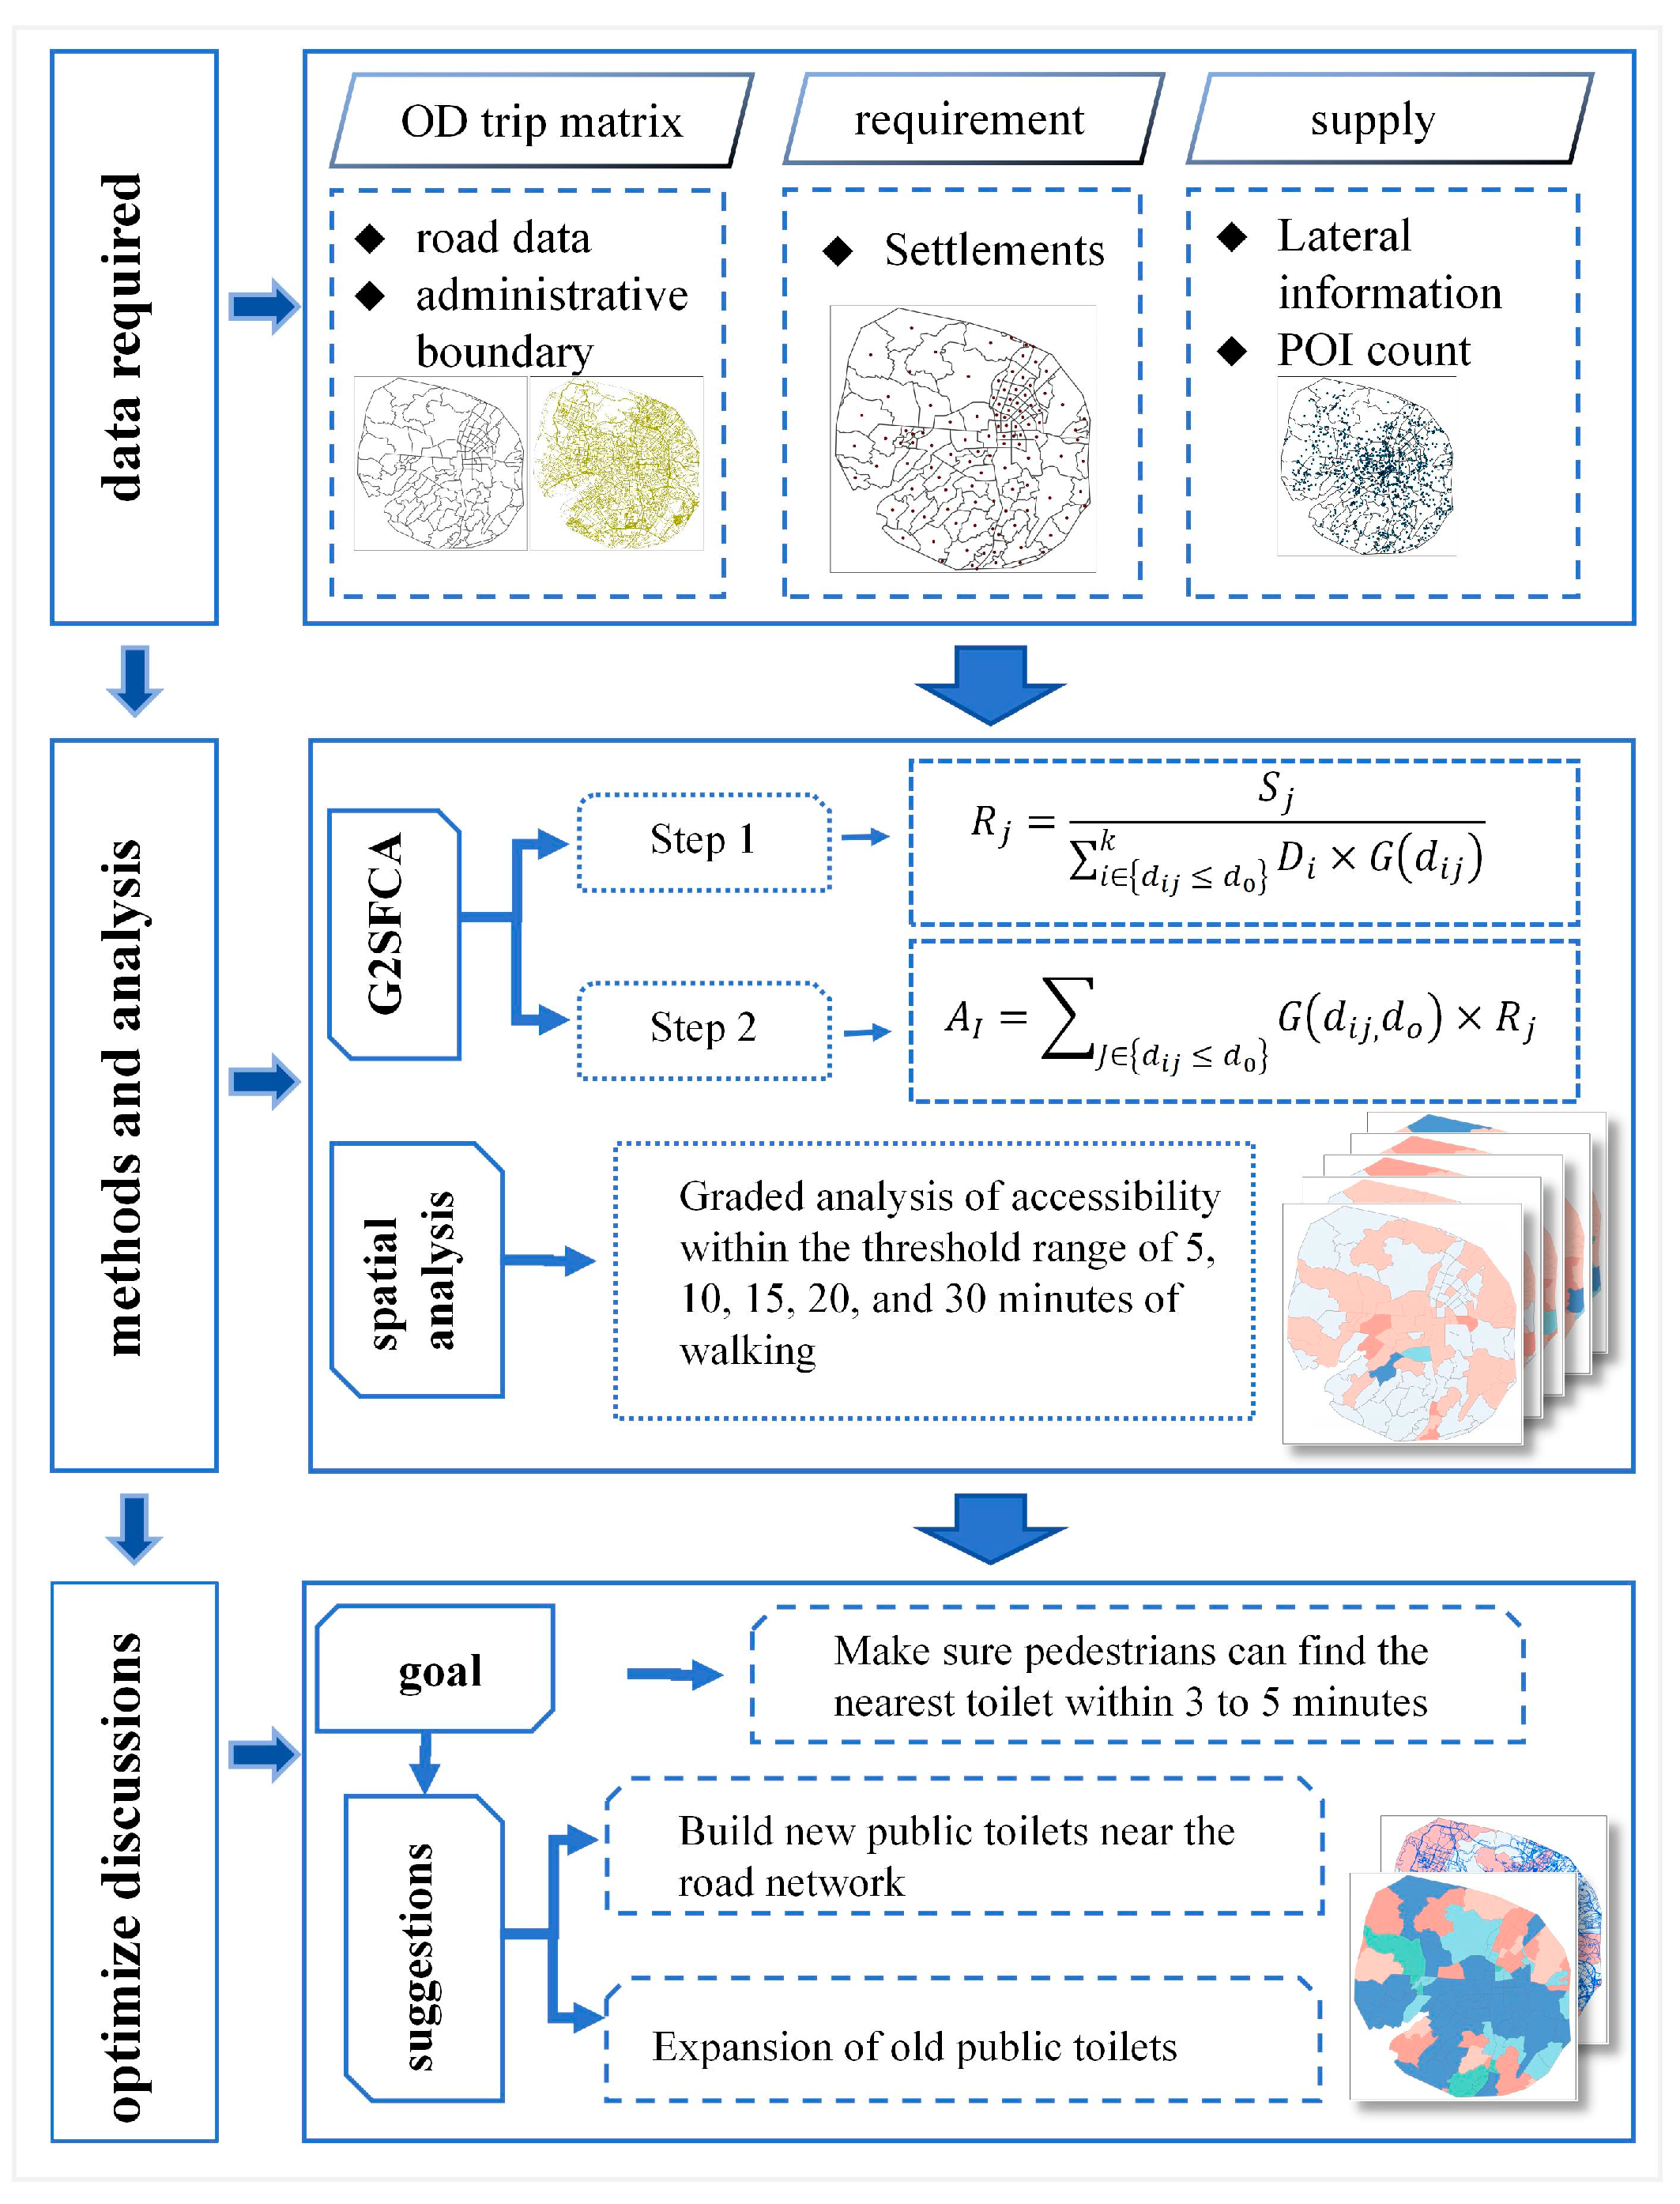
2.3.1. Research Framework
- Data collection and processing. This section, detailed in the “Data Sources and Processing” chapter, covers the acquisition, screening, and standardization of the spatial and attribute data required for the study;
- Measurement of public toilet accessibility in Kunming. This section focuses on quantifying the spatial accessibility of public toilets in Kunming using the G2SFCA method and analyzing the spatiotemporal variation in service coverage under different restroom travel-time demand scenarios.
- Evaluation of service efficiency and layout optimization recommendations. Based on the accessibility results, this section identifies areas with low service efficiency and service gaps within the study area and proposes feasible optimization strategies for public toilet facility layouts to enhance the overall service equity and rationality of spatial allocation.
2.3.2. The Gaussian Two-Step Floating Catchment Area
3. Results
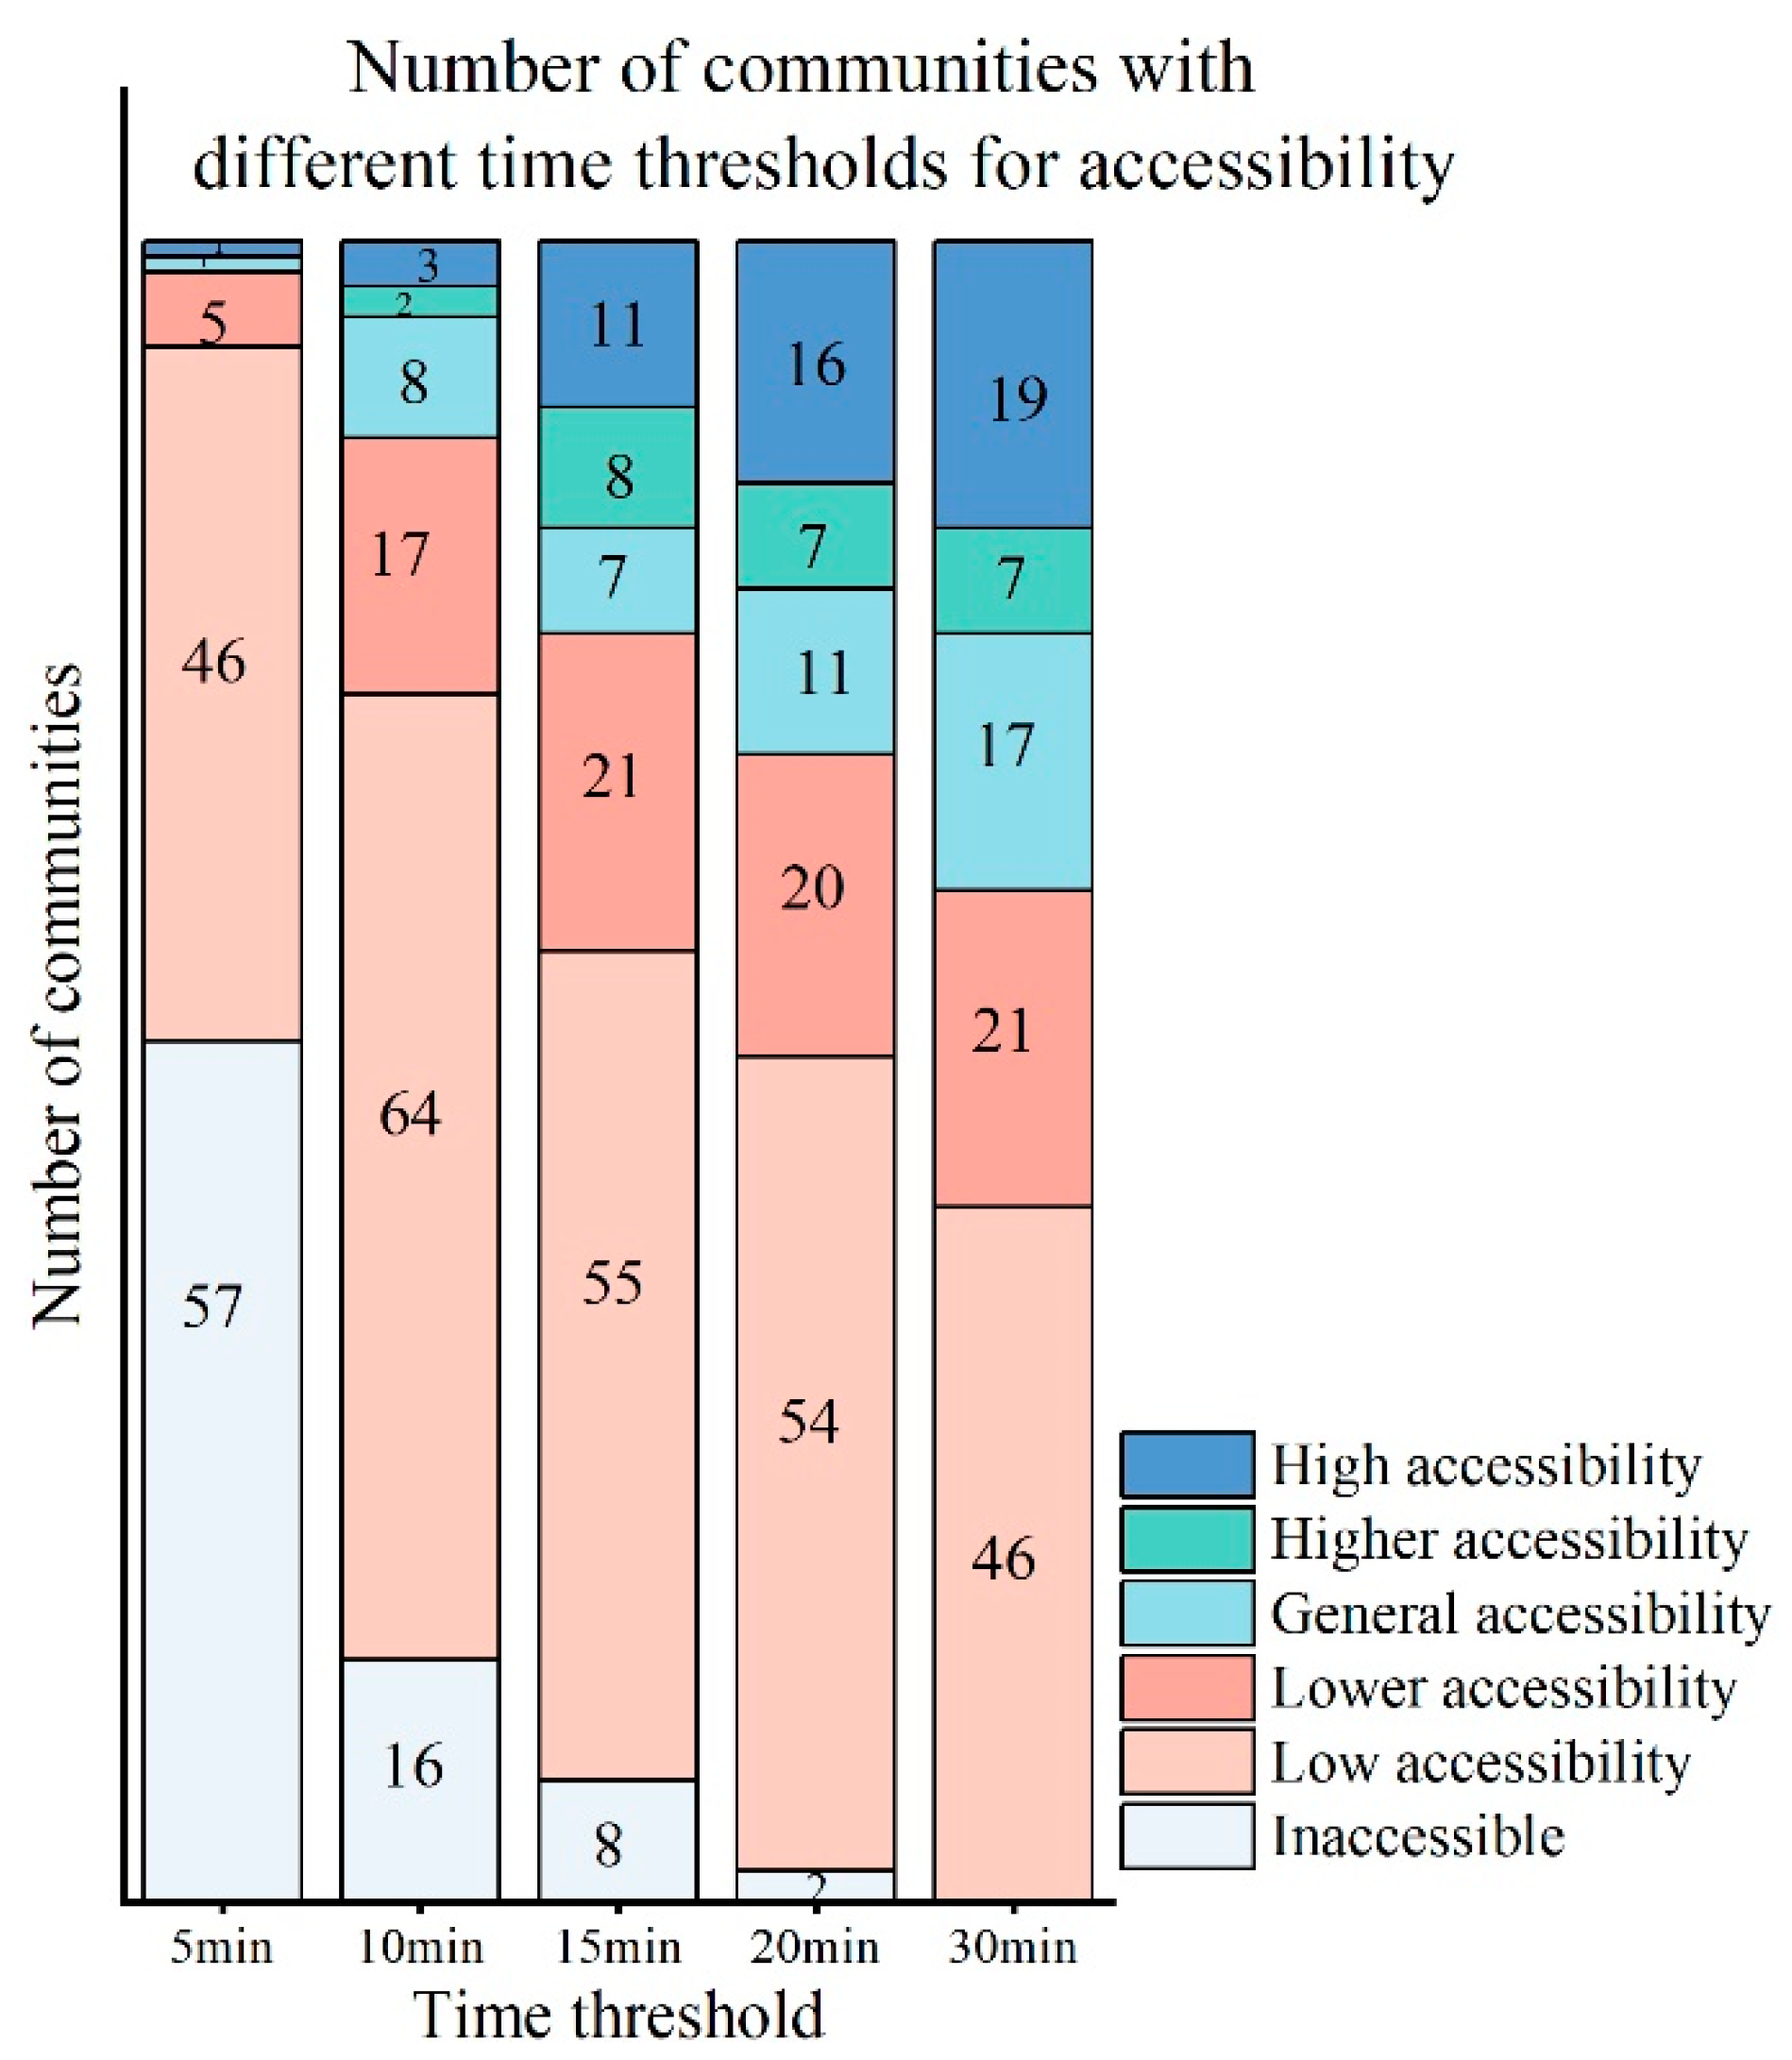
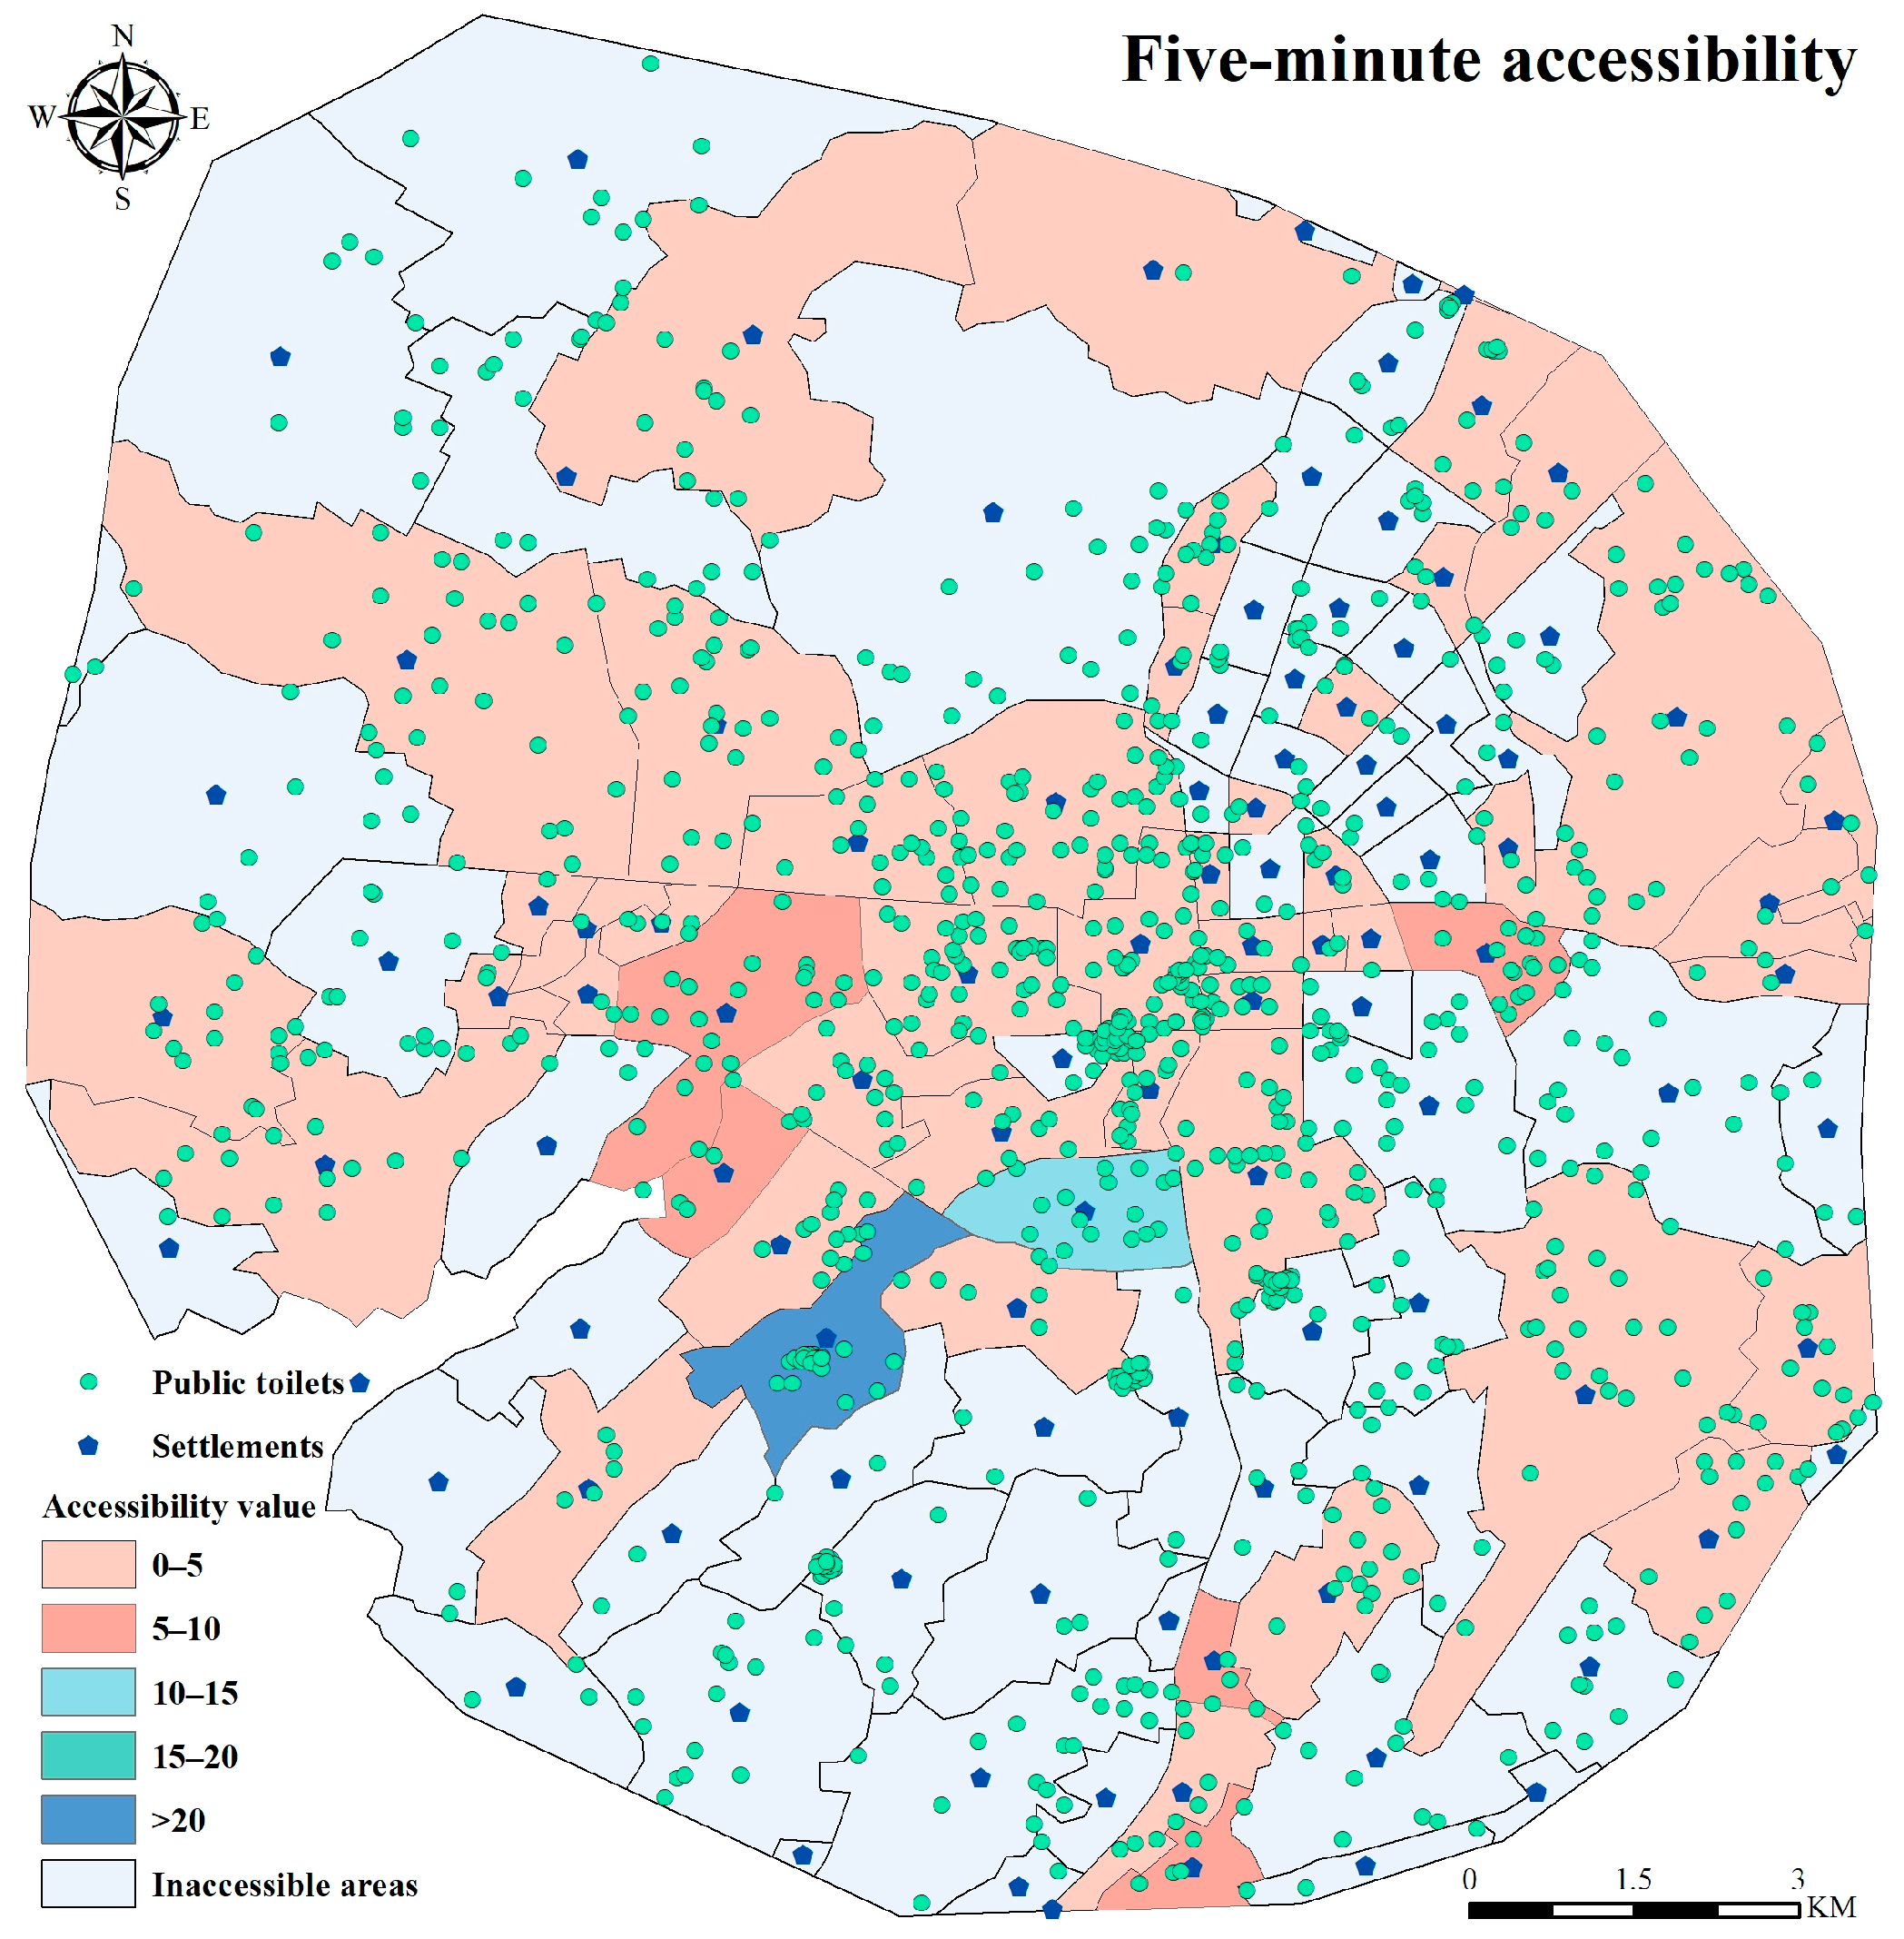
3.1. Public Toilet Accessibility Analysis at a 5-min Threshold
3.2. Public Toilet Accessibility Analysis at a 10-min Threshold
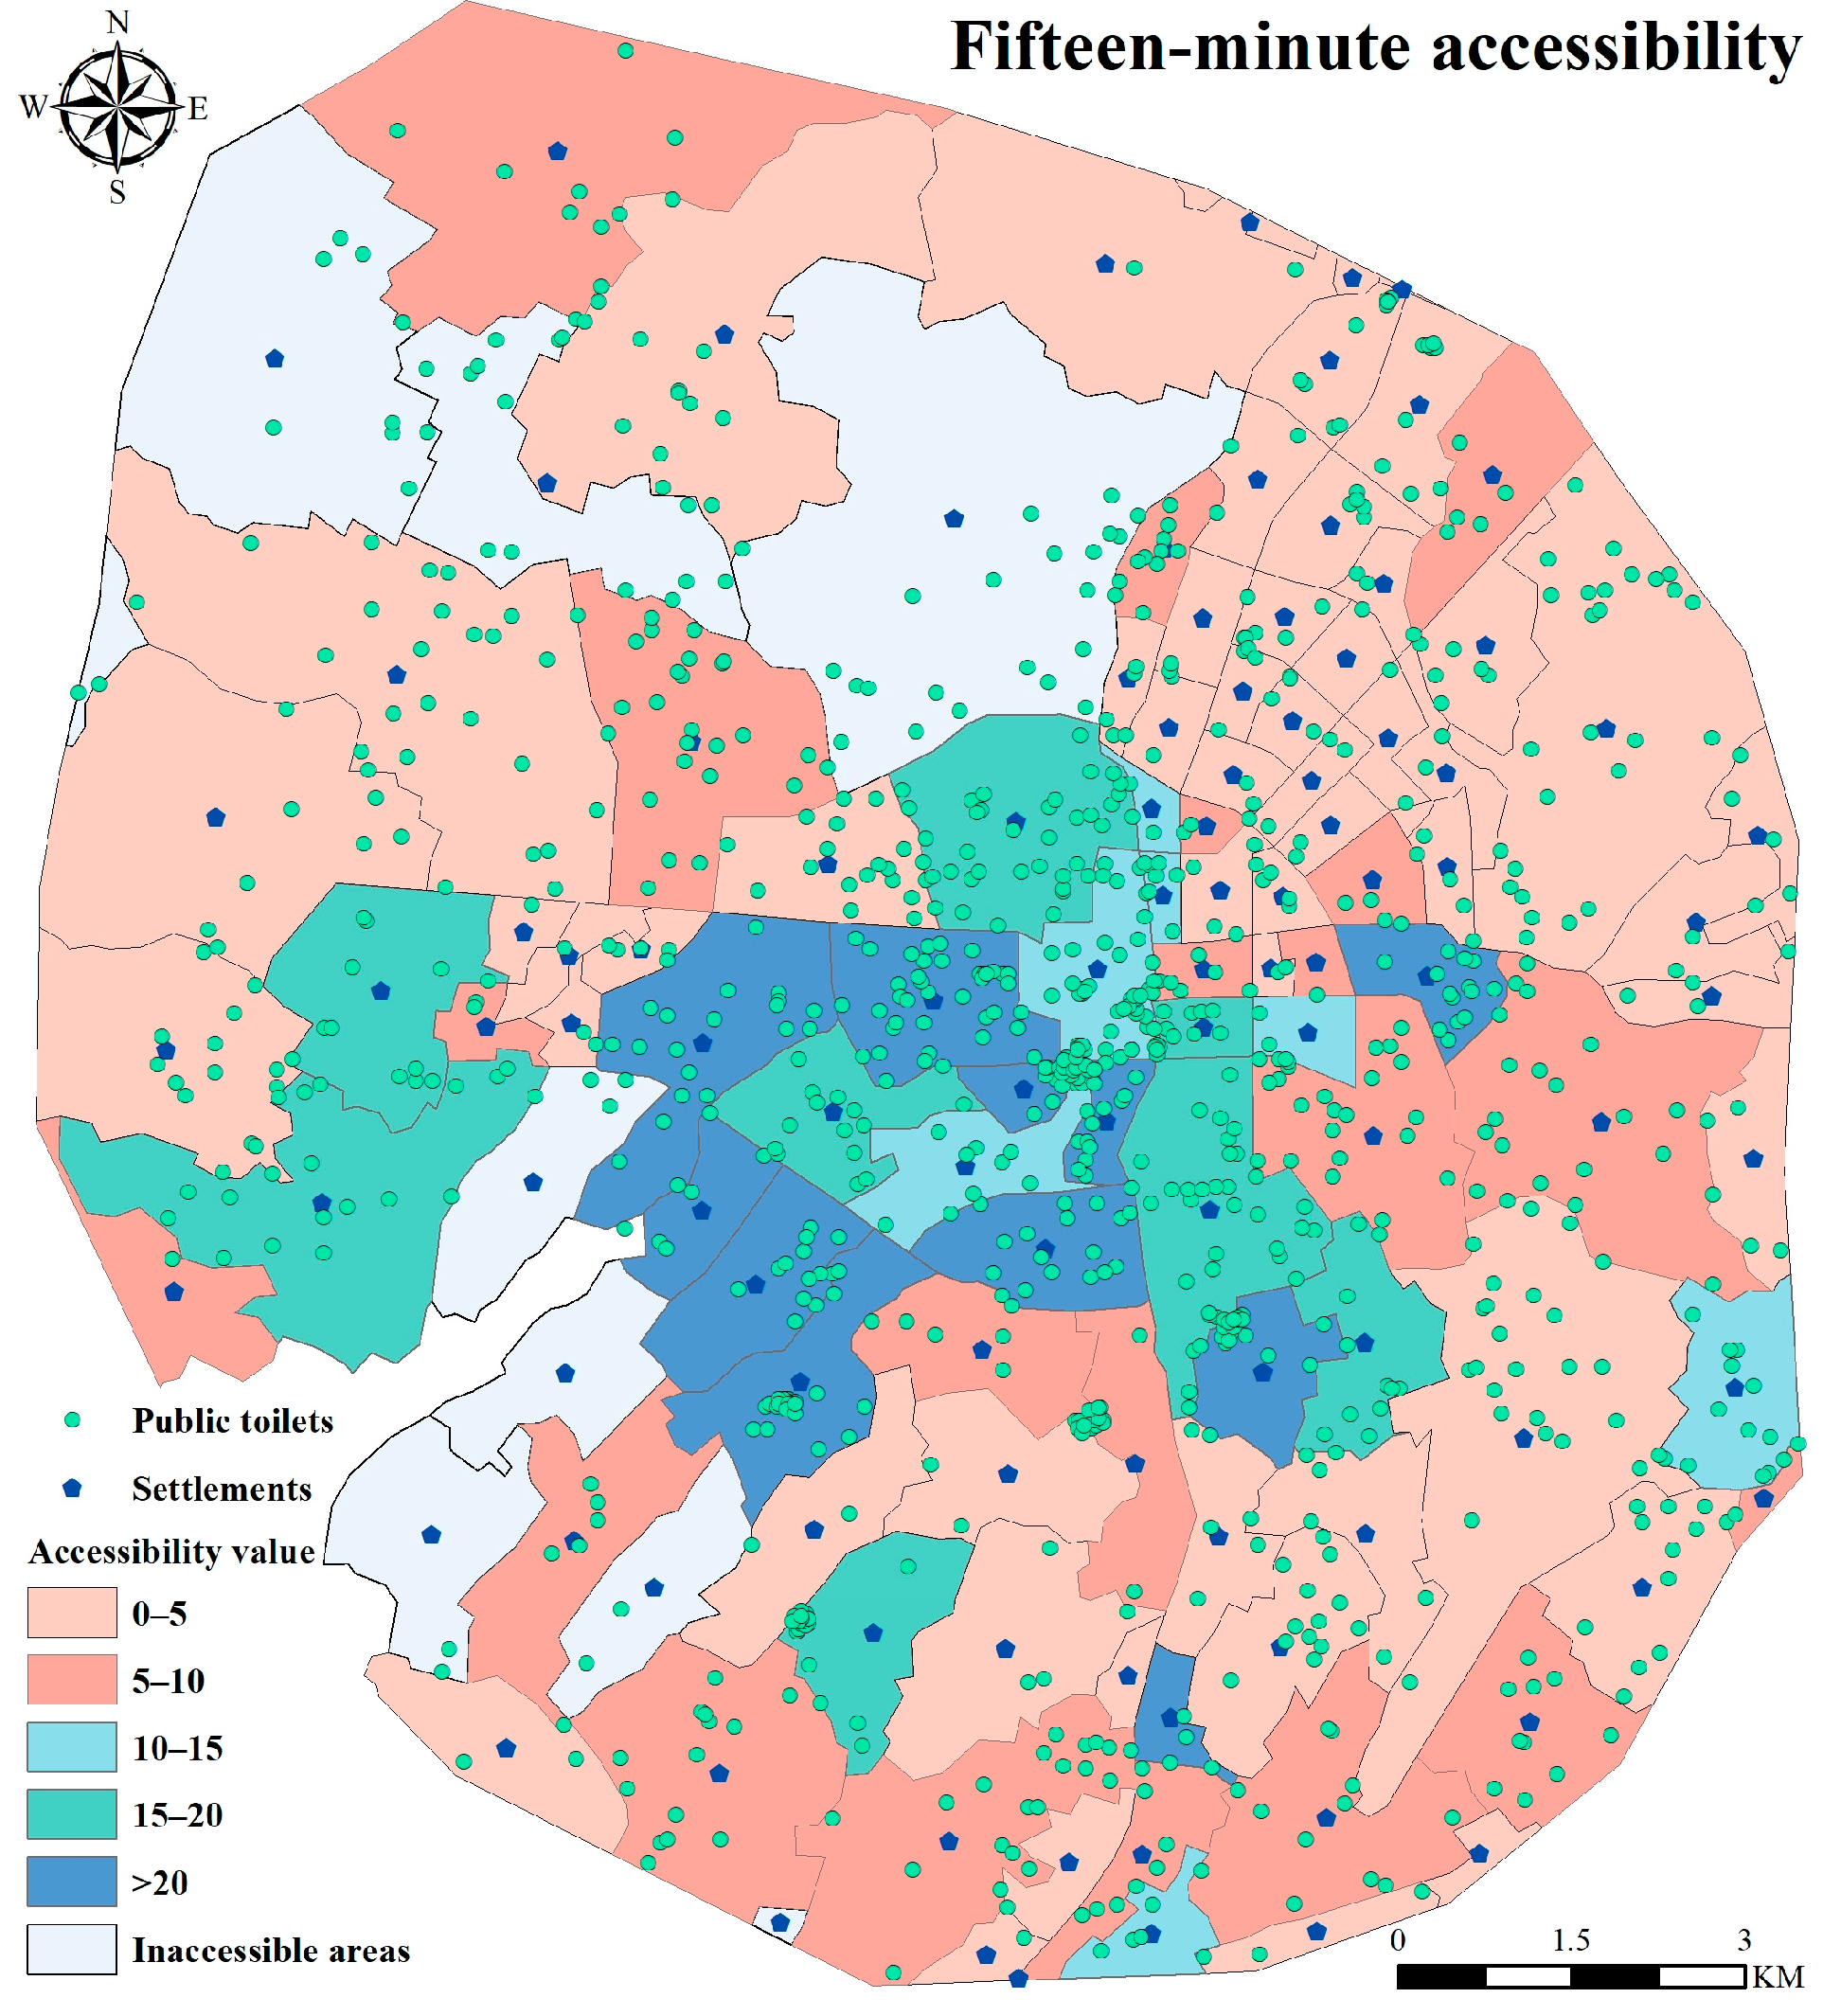
3.3. Public Toilet Accessibility Analysis at the 15-min Threshold
3.4. Public Toilet Accessibility Analysis at the 20 min Threshold
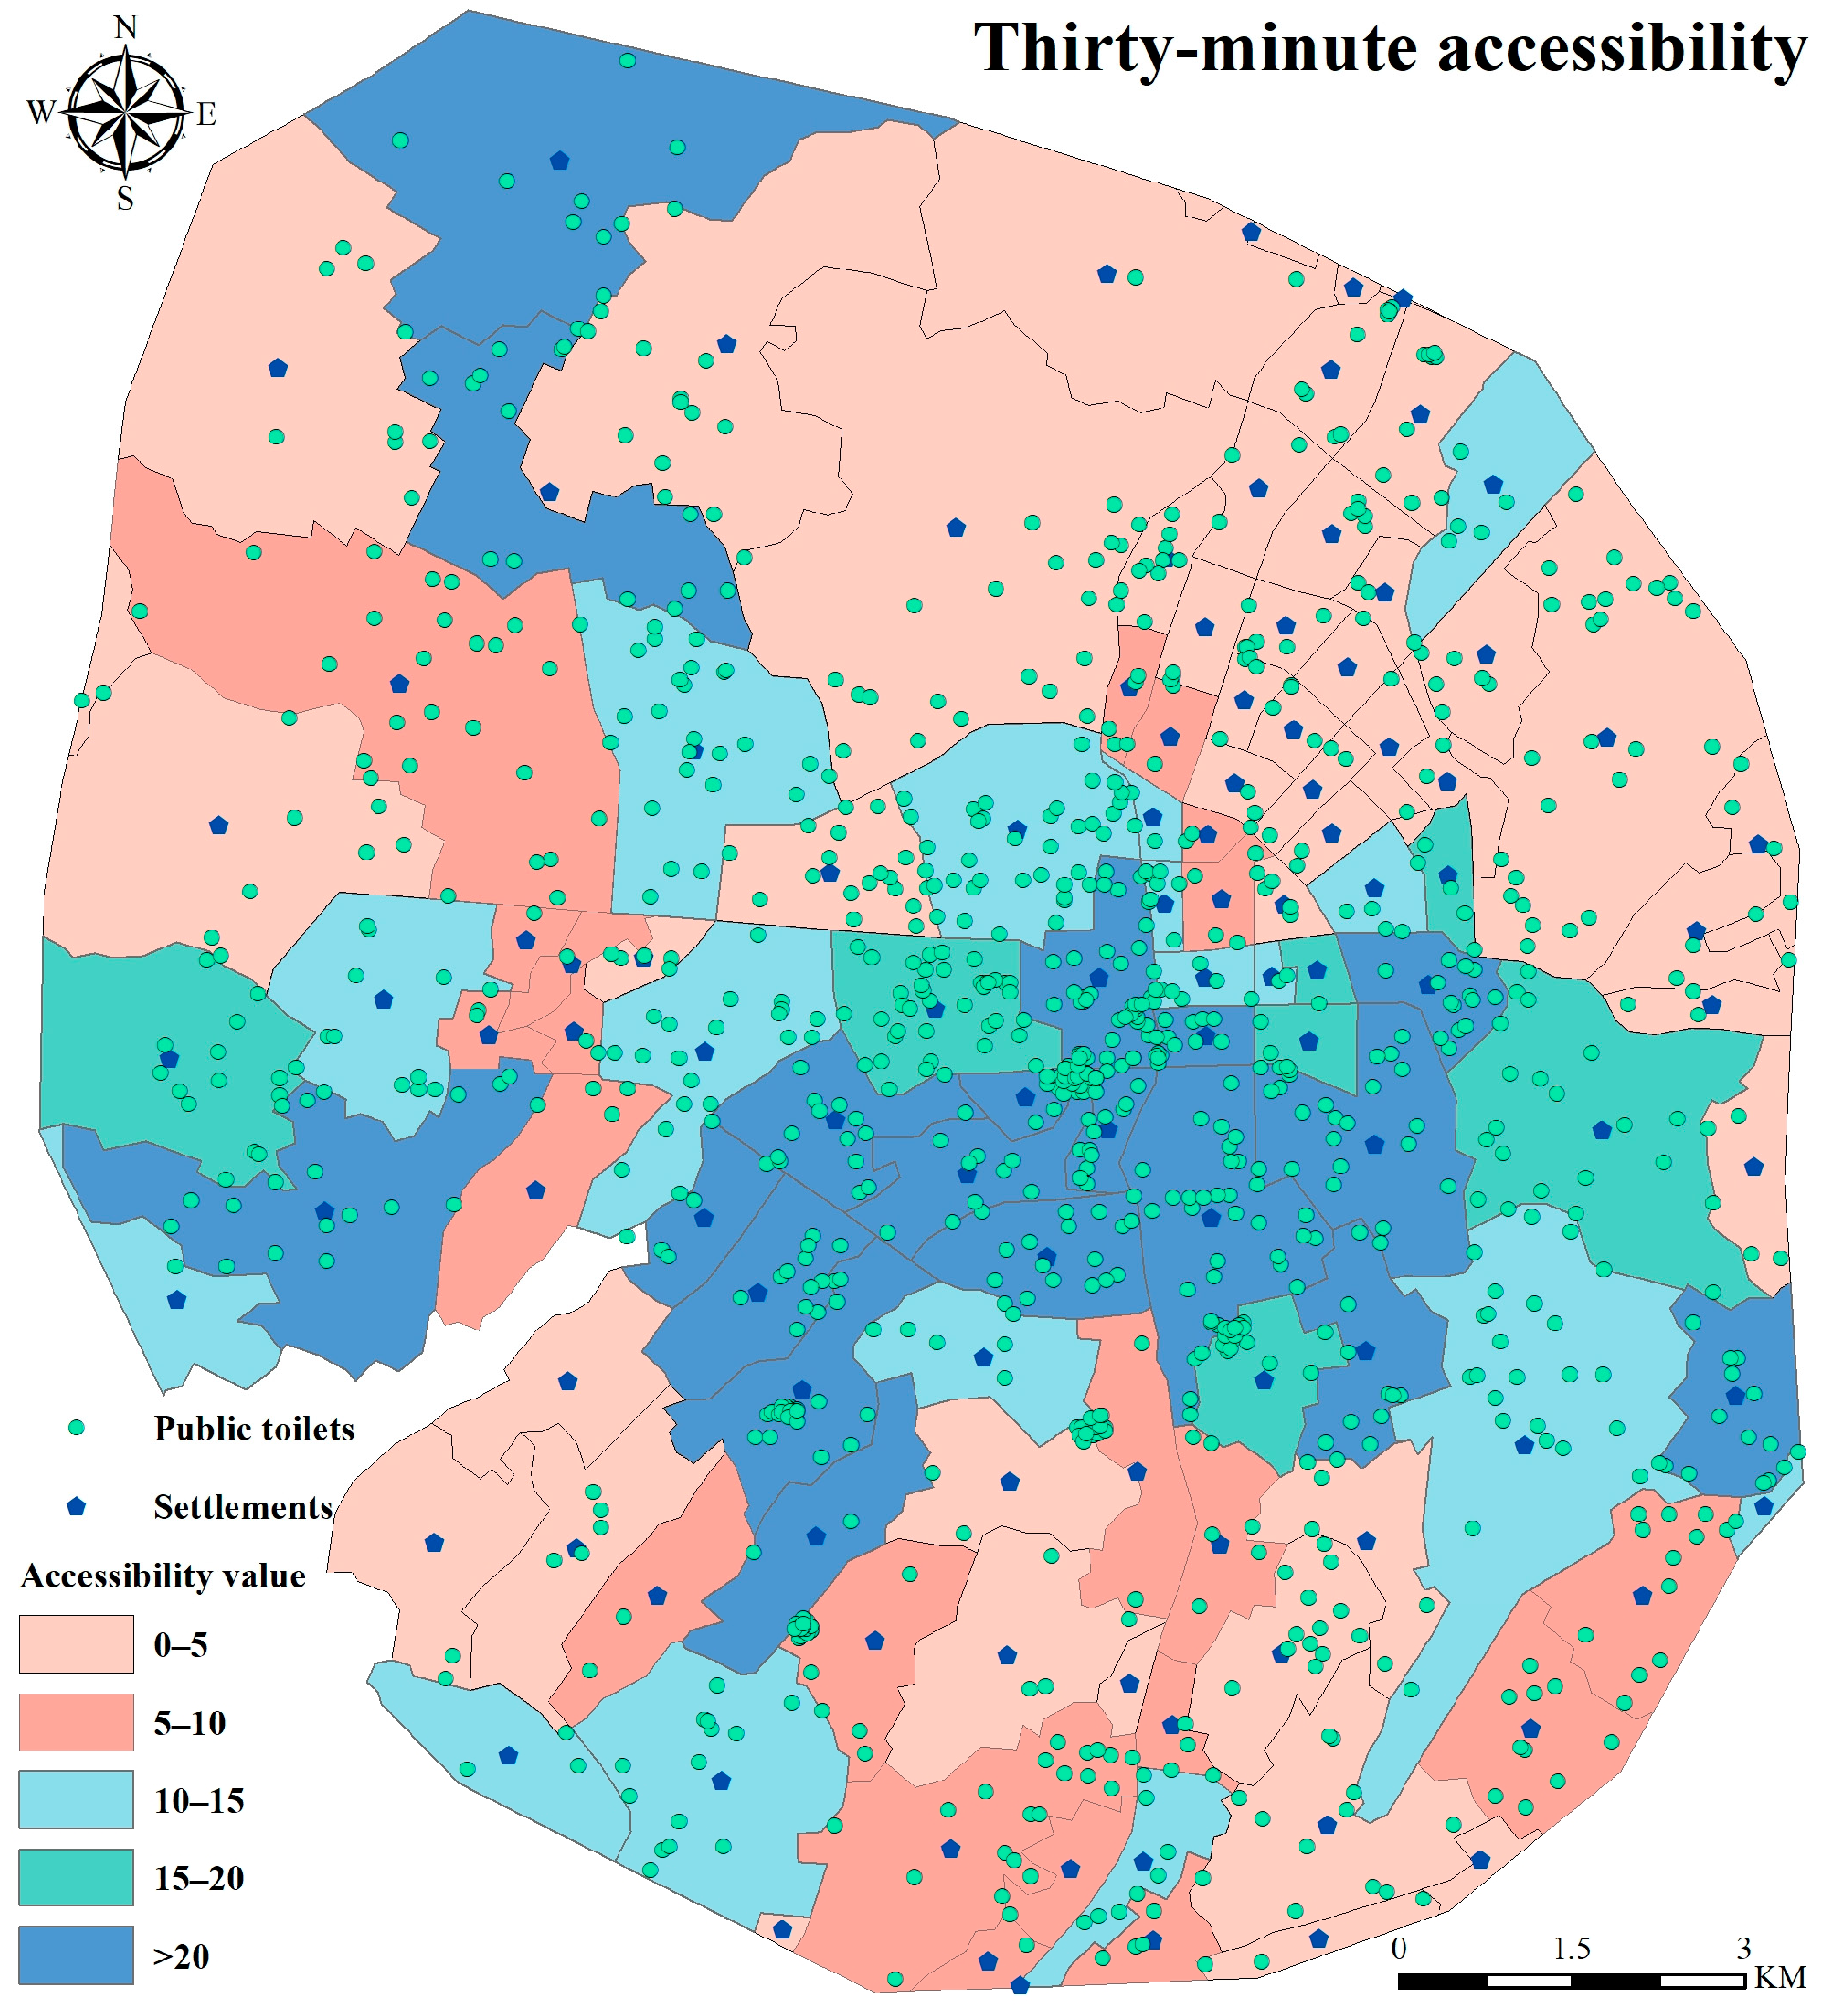
3.5. Public Toilet Accessibility Analysis at the 30 min Threshold
4. Discussion
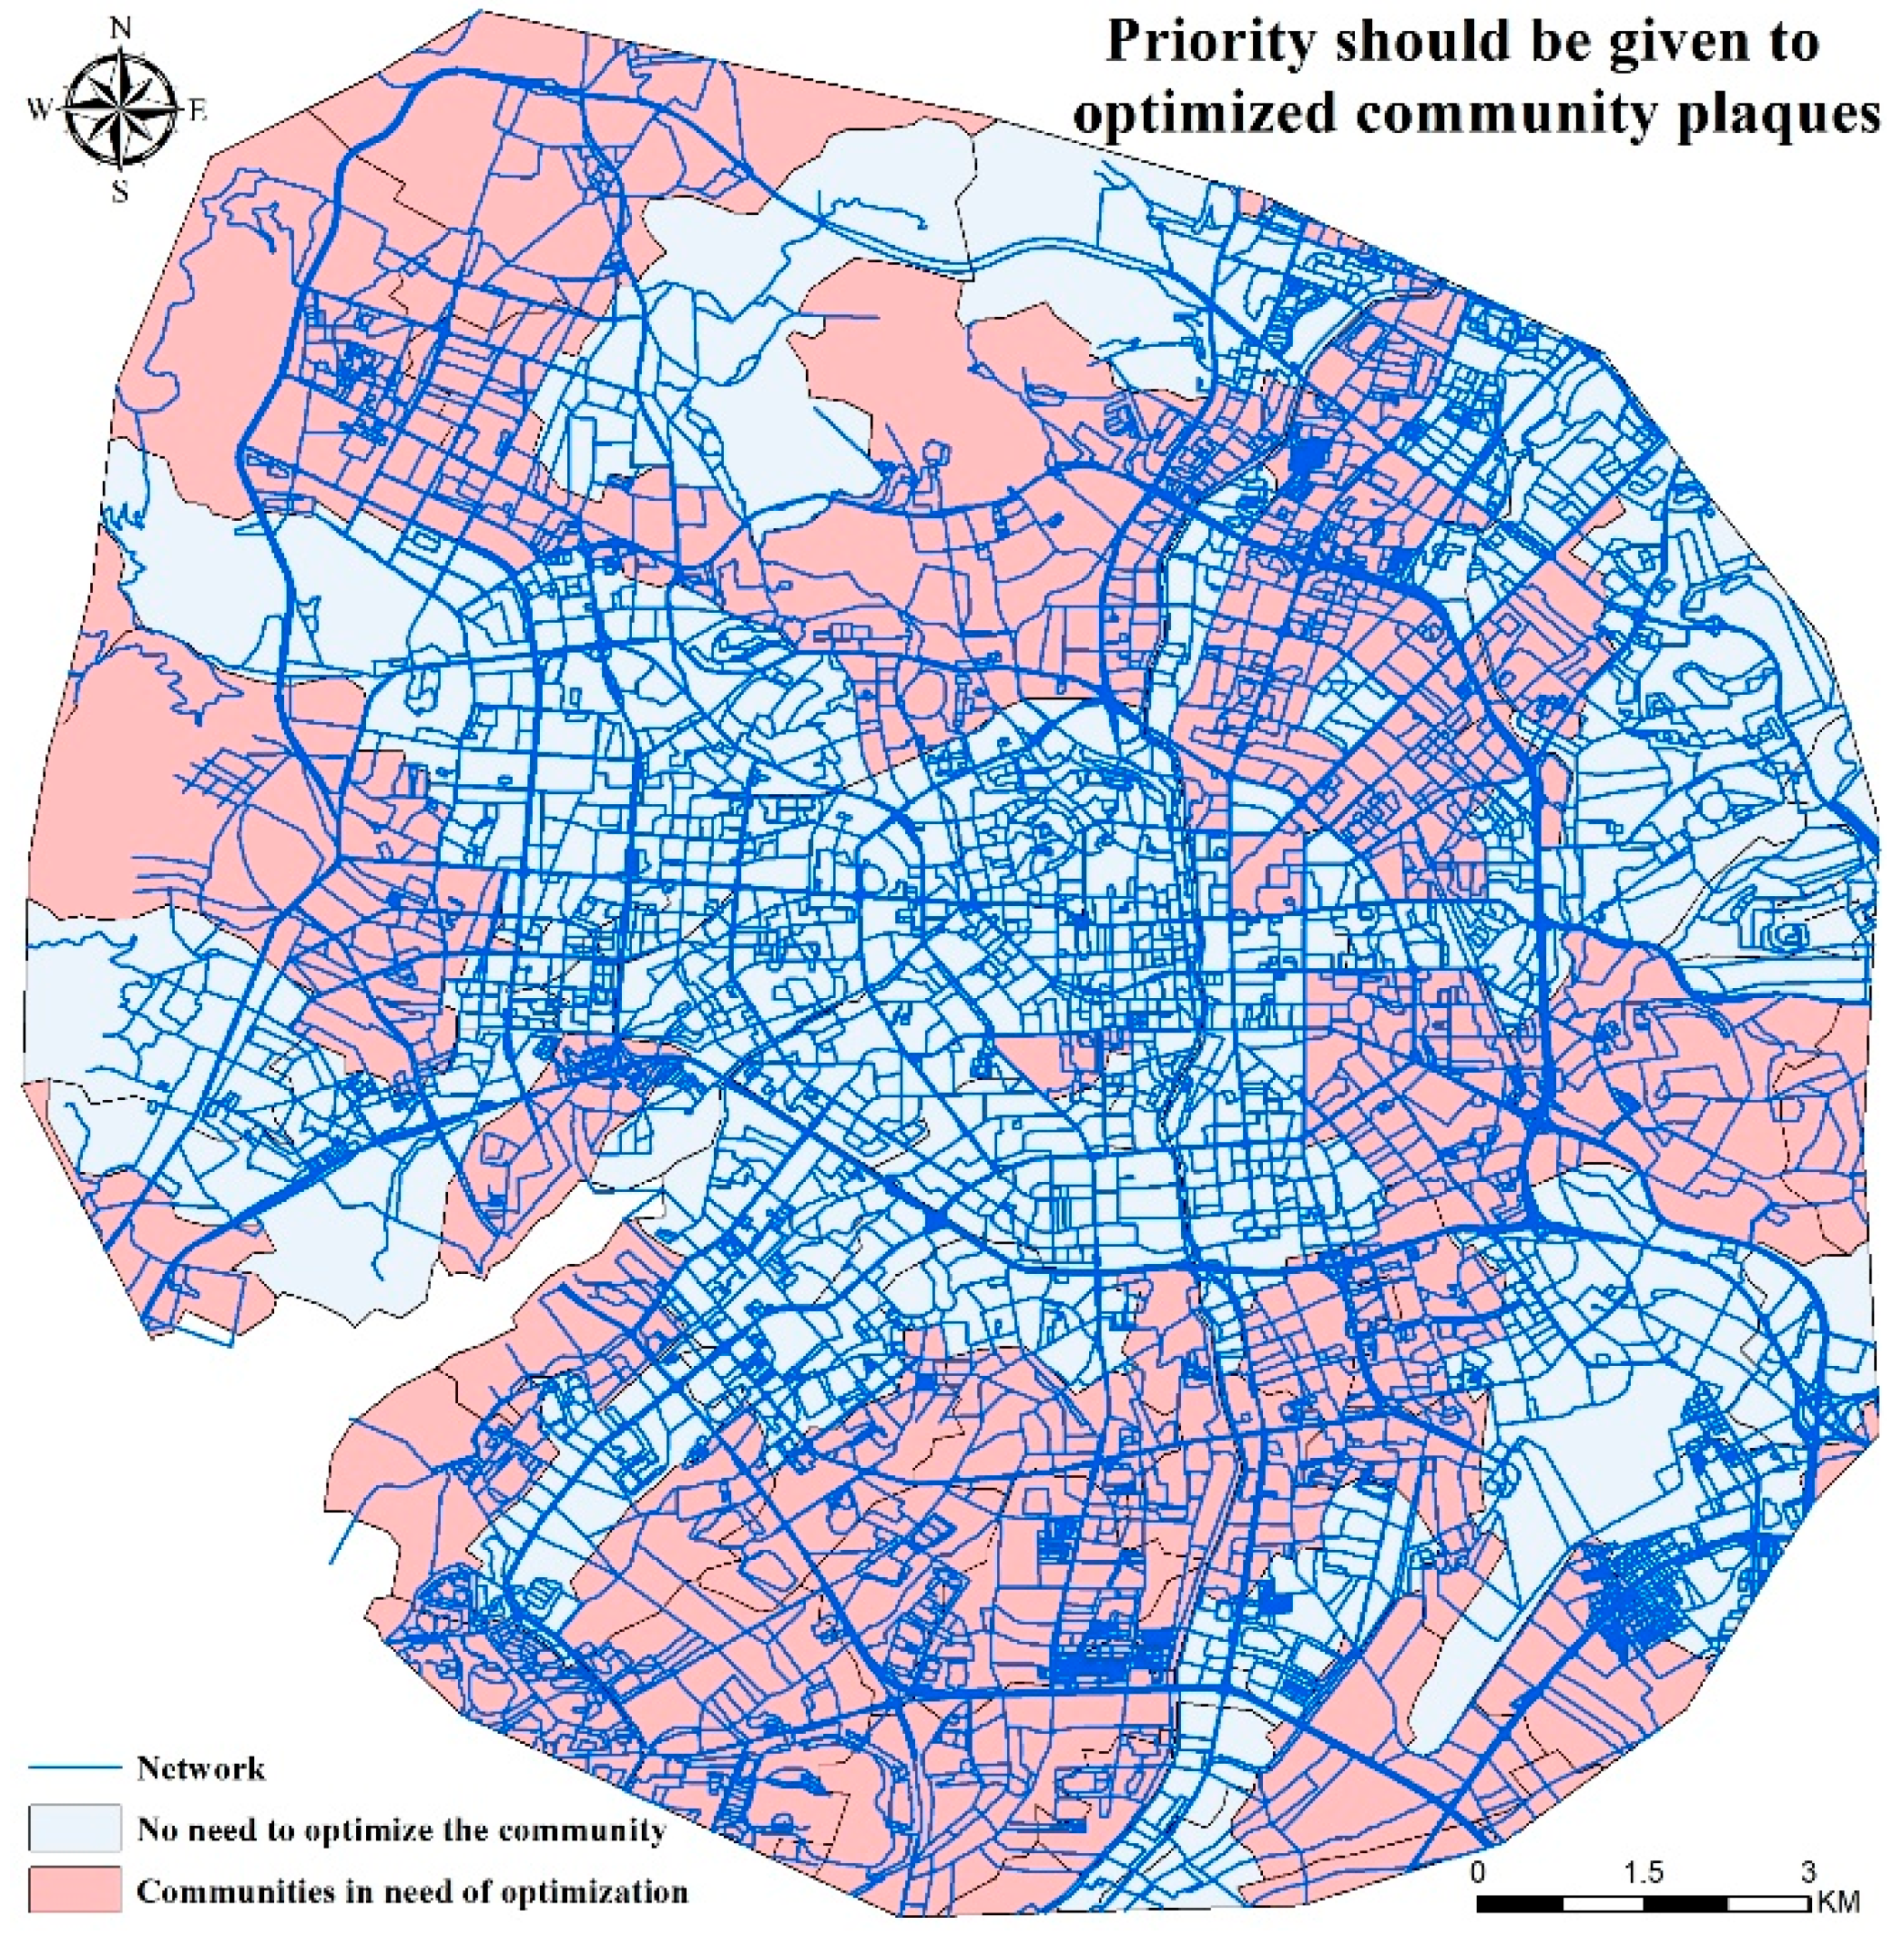
4.1. The Optimization Goal of Public Toilet Layout in the Main Urban Area of Kunming
4.2. Optimization Strategy of Public Toilet Layout in the Main Urban Area of Kunming
4.2.1. Build New Public Toilets near the Road Network
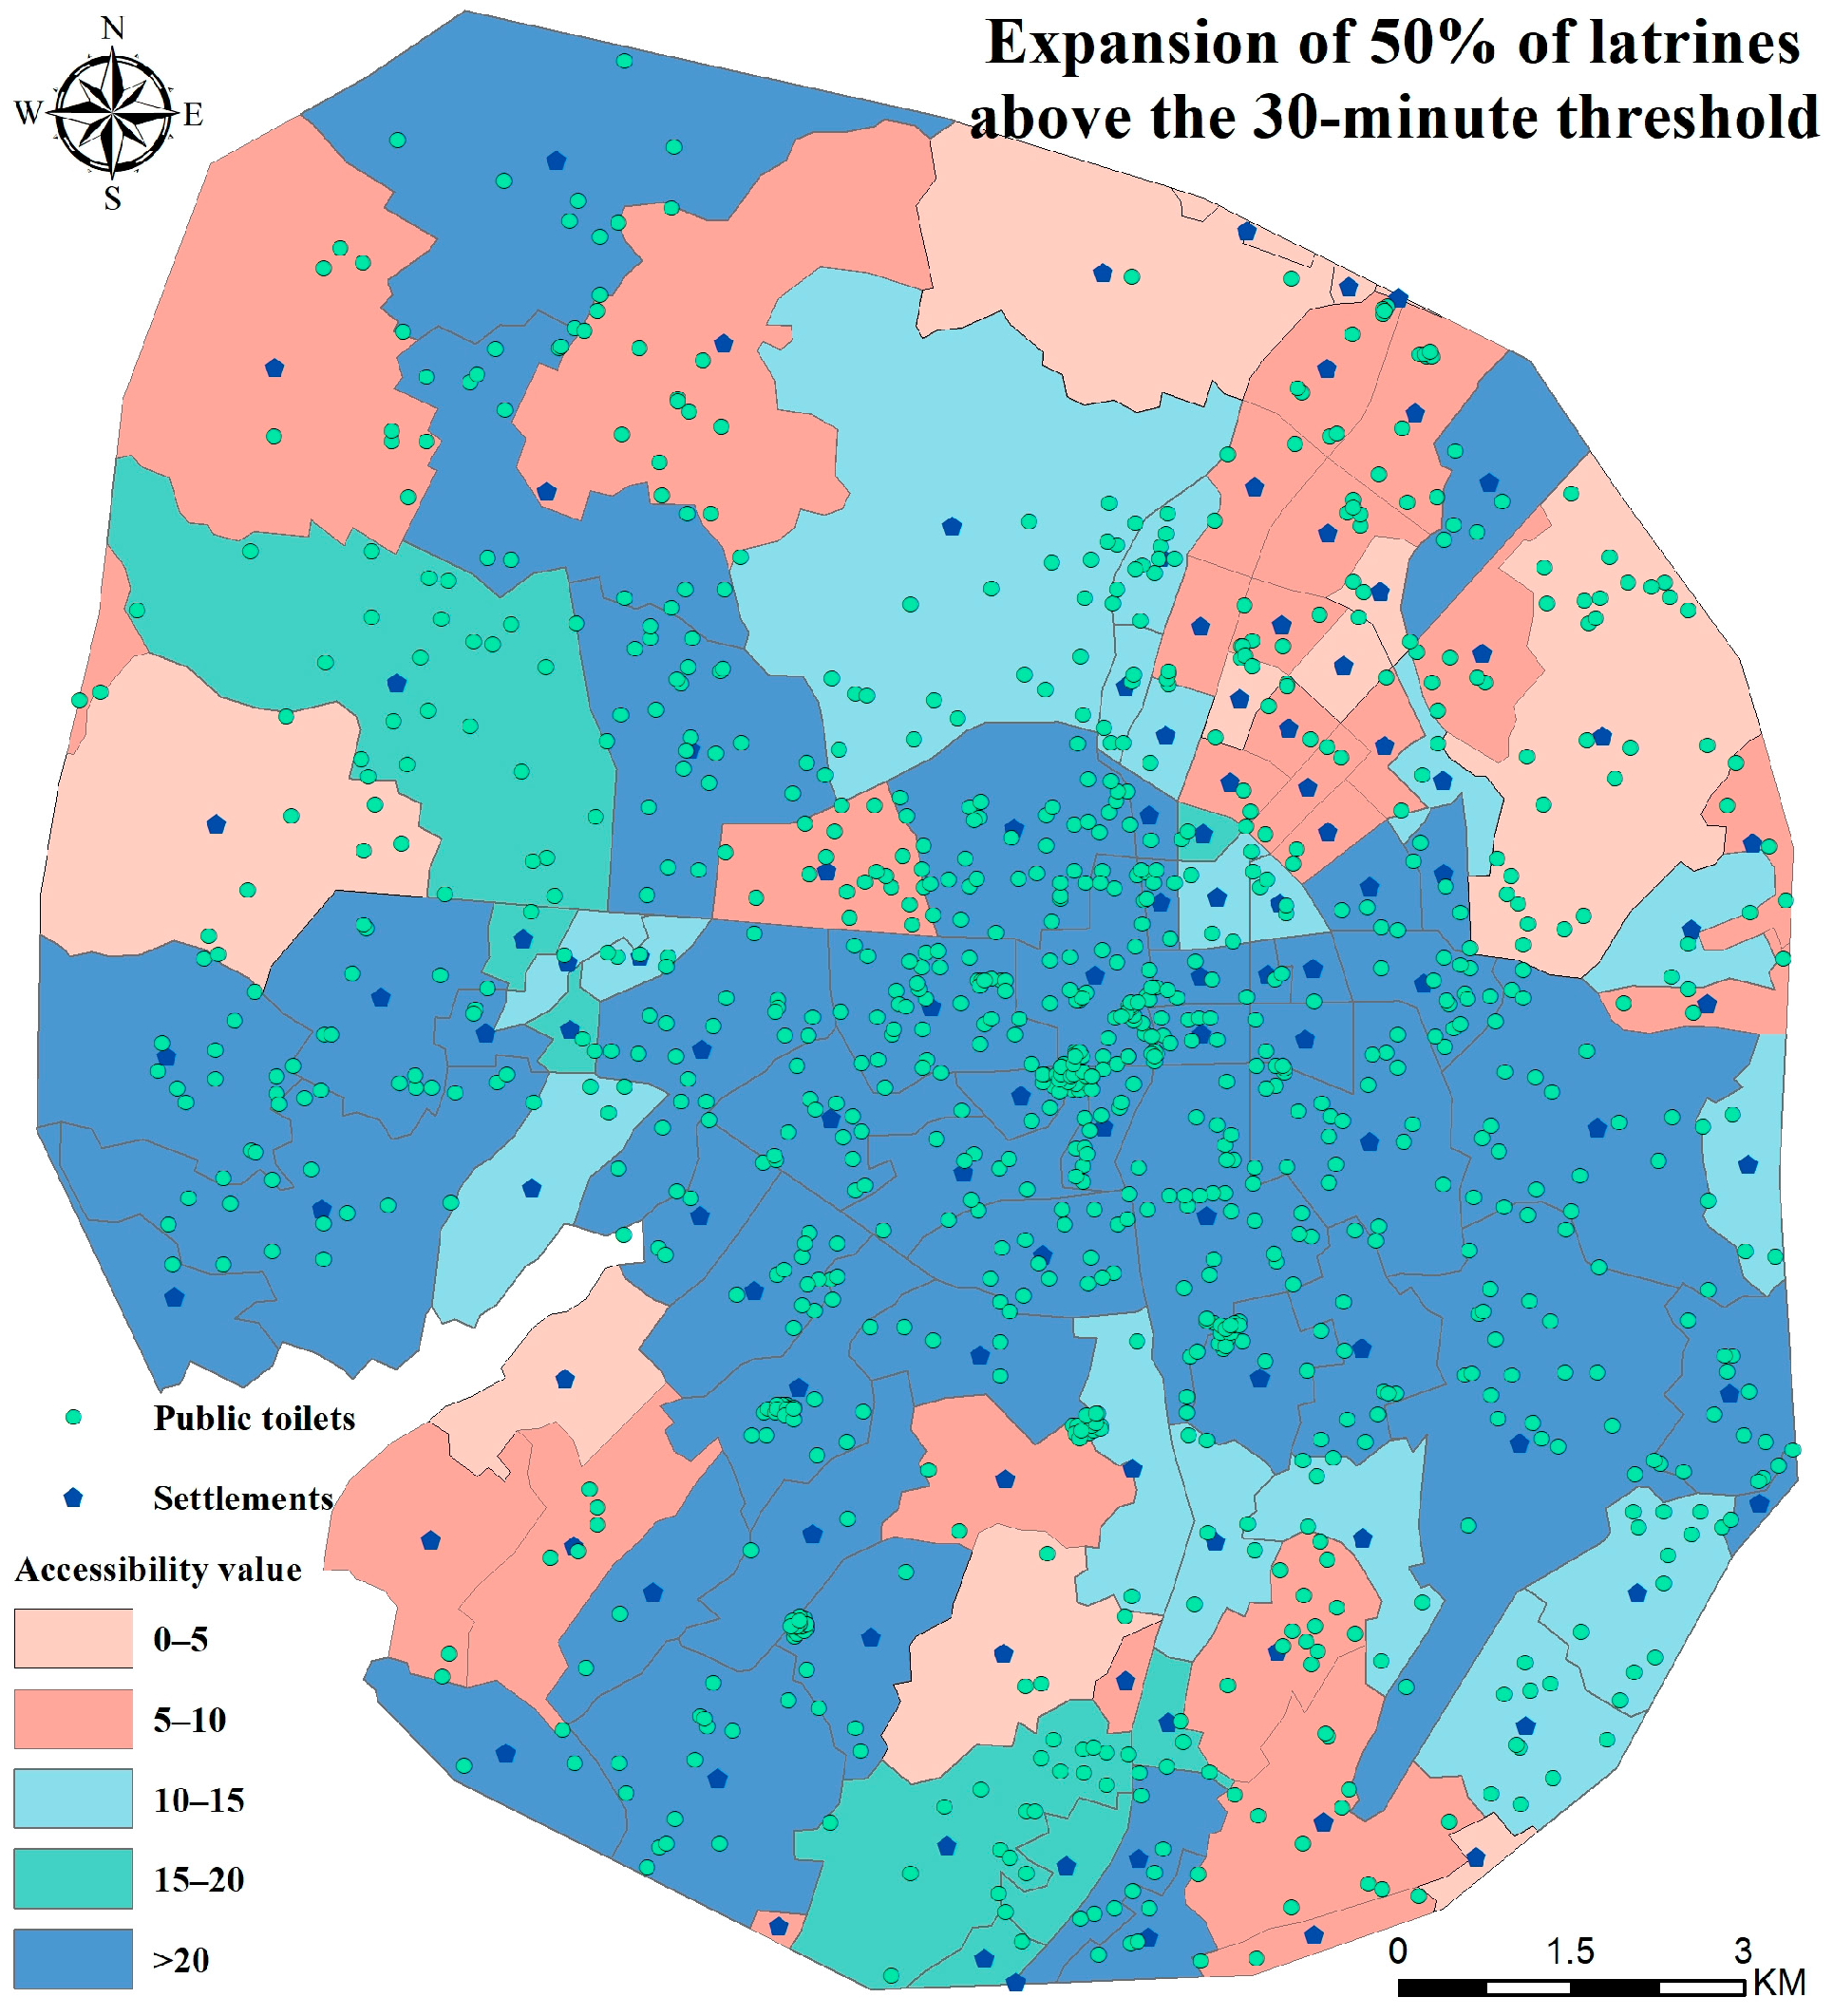
4.2.2. Expansion of Old Public Toilets
4.3. Research Deficiencies and Future Efforts
5. Conclusions
Author Contributions
Funding
Data Availability Statement
Acknowledgments
Conflicts of Interest
References
- Wang, J.W.; Chow, W.T.L.; Wang, Y.-C. A global regression method for thermal sharpening of urban land surface temperatures from MODIS and Landsat. Int. J. Remote Sens. 2019, 41, 2986–3009. [Google Scholar] [CrossRef]
- Zhang, R.; Zhang, J.; Zhang, K.; Xu, D.; Qi, Y.; Deng, X. Do Clean Toilets Help Improve Farmers’ Mental Health? Empirical Evidence from China’s Rural Toilet Revolution. Agriculture 2024, 14, 128. [Google Scholar] [CrossRef]
- Jahish, H.; Mehrdadi, N.; Bedhendi, G.R.N. Evaluating the current state of the wastewater system in Kabul city and its effects on the environment and health by using the Battelle method. Int. J. Environ. Sci. Technol. 2024, 21, 4739–4750. [Google Scholar] [CrossRef]
- Nielsen, A.F. The role of toilets in public spaces: An interview study with individuals experiencing gastrointestinal issues. Soc. Sci. Med. 2024, 362, 117408. [Google Scholar] [CrossRef]
- Nguyen, A.-M.; Maroko, A.R.; Blake, S.; Sugita, E.; Fazzioni, N.H.; Lomboy, M.F.T.C.; Bukenya, J.; Cole, H.V.S.; Gregorio, E.R.; Hopper, K.J.; et al. Exploring the availability and accessibility of menstrual friendly public toilets (MFPTs) in urban spaces: A global multi-city audit study. Health Place 2025, 92, 103412. [Google Scholar] [CrossRef]
- Bliss, D.Z.; Park, Y.S. Public toilets in parklands or open spaces in international cities using geographic information systems. Int. Urogynecol. J. 2019, 31, 939–945. [Google Scholar] [CrossRef]
- Zhang, K.; Chen, X.; Zhang, S.; Wilson-Gray, B. Towards a Healthy Ride: Locating Public Toilets in the Shanghai Metro System. Appl. Spat. Anal. Policy 2016, 11, 381–395. [Google Scholar] [CrossRef]
- Hansen, W.G. How Accessibility Shapes Land Use. J. Am. Inst. Plan. 1959, 25, 73–76. [Google Scholar] [CrossRef]
- Geurs, K.T.; van Wee, B. Accessibility evaluation of land-use and transport strategies: Review and research directions. J. Transp. Geogr. 2004, 12, 127–140. [Google Scholar] [CrossRef]
- Tan, R.; Wang, R.; Wang, Y.; Yi, D.; Chen, Y.; Cai, W.; Wang, X. The Park city perspective study: Revealing the park accessibility influenced by experiences of visitors under different travel modes. Front. Environ. Sci. 2022, 10, 924996. [Google Scholar] [CrossRef]
- La Rosa, D.; Takatori, C.; Shimizu, H.; Privitera, R. A planning framework to evaluate demands and preferences by different social groups for accessibility to urban greenspaces. Sustain. Cities Soc. 2018, 36, 346–362. [Google Scholar] [CrossRef]
- Obeidat, B.; Alourd, S. Healthcare equity in focus: Bridging gaps through a spatial analysis of healthcare facilities in Irbid, Jordan. Int. J. Equity Health 2024, 23, 52. [Google Scholar] [CrossRef] [PubMed]
- Dogan, O.; Han, J.; Lee, S. Opening Gated Communities and Neighborhood Accessibility Benefits: The Case of Seoul, Korea. Int. J. Environ. Res. Public Health 2021, 18, 4255. [Google Scholar] [CrossRef]
- Meire, S.; Derudder, B.; Ooms, K. A bimodal accessibility analysis of Australia’s statistical areas. J. Maps 2019, 15, 77–83. [Google Scholar] [CrossRef]
- Piovani, D.; Arcaute, E.; Uchoa, G.; Wilson, A.; Batty, M. Measuring accessibility using gravity and radiation models. R. Soc. Open Sci. 2018, 5, 171668. [Google Scholar] [CrossRef]
- Tahmasbi, B.; Mansourianfar, M.H.; Haghshenas, H.; Kim, I. Multimodal accessibility-based equity assessment of urban public facilities distribution. Sustain. Cities Soc. 2019, 49, 101633. [Google Scholar] [CrossRef]
- Chang, Z.; Chen, J.; Li, W.; Li, X. Public transportation and the spatial inequality of urban park accessibility: New evidence from Hong Kong. Transp. Res. Part D Transp. Environ. 2019, 76, 111–122. [Google Scholar] [CrossRef]
- Hare, T.S.; Barcus, H.R. Geographical accessibility and Kentucky’s heart-related hospital services. Appl. Geogr. 2007, 27, 181–205. [Google Scholar] [CrossRef]
- Stępniak, M.; Pritchard, J.P.; Geurs, K.T.; Goliszek, S. The impact of temporal resolution on public transport accessibility measurement: Review and case study in Poland. J. Transp. Geogr. 2019, 75, 8–24. [Google Scholar] [CrossRef]
- HIGGS, G. A literature review of the use of GIS-based measures of access to health care services. Health Serv. Outcomes Res. Methodol. 2004, 5, 119–139. [Google Scholar] [CrossRef]
- Moore, L.V.; Roux, A.V.D.; Evenson, K.R.; McGinn, A.P.; Brines, S.J. Availability of recreational resources in minority and low socioeconomic status areas. Am. J. Prev. Med. 2008, 34, 16–22. [Google Scholar] [CrossRef]
- Yang, D.-H.; Goerge, R.; Mullner, R. Comparing GIS-Based Methods of Measuring Spatial Accessibility to Health Services. J. Med. Syst. 2006, 30, 23–32. [Google Scholar] [CrossRef]
- Radke, J.; Mu, L. Spatial Decompositions, Modeling and Mapping Service Regions to Predict Access to Social Programs. Ann. GIS 2000, 6, 105–112. [Google Scholar] [CrossRef]
- Luo, W.; Wang, F. Measures of Spatial Accessibility to Health Care in a GIS Environment: Synthesis and a Case Study in the Chicago Region. Environ. Plan. B Plan. Des. 2003, 30, 865–884. [Google Scholar] [CrossRef] [PubMed]
- Villalba, A.; Vila, L.E.; Carot, J.M. Analyzing patterns of accessibility to schools: A gravitational metrics study in València. AIMS Math. 2025, 10, 809–825. [Google Scholar] [CrossRef]
- Javanmard, R.; Lee, J.; Kim, K.; Park, J.; Diab, E. Evaluating the impacts of supply-demand dynamics and distance decay effects on public transit project assessment: A study of healthcare accessibility and inequalities. J. Transp. Geogr. 2024, 116, 103833. [Google Scholar] [CrossRef]
- Tian, D.; Wang, J.; Xia, C.; Zhang, J.; Zhou, J.; Tian, Z.; Zhao, J.; Li, B.; Zhou, C. The relationship between green space accessibility by multiple travel modes and housing prices: A case study of Beijing. Cities 2024, 145, 104694. [Google Scholar] [CrossRef]
- de Mello-Sampayo, F. Spatial Interaction Healthcare Accessibility Model—An Application to Texas. Appl. Spat. Anal. Policy 2018, 11, 739–751. [Google Scholar] [CrossRef]
- Wang, F. From 2SFCA to i2SFCA: Integration, derivation and validation. Int. J. Geogr. Inf. Sci. 2020, 35, 628–638. [Google Scholar] [CrossRef]
- Guo, S.; Song, C.; Pei, T.; Liu, Y.; Ma, T.; Du, Y.; Chen, J.; Fan, Z.; Tang, X.; Peng, Y.; et al. Accessibility to urban parks for elderly residents: Perspectives from mobile phone data. Landsc. Urban Plan. 2019, 191, 103642. [Google Scholar] [CrossRef]
- Järv, O.; Tenkanen, H.; Toivonen, T. Enhancing spatial accuracy of mobile phone data using multi-temporal dasymetric interpolation. Int. J. Geogr. Inf. Sci. 2017, 31, 1630–1651. [Google Scholar] [CrossRef]
- Salazar Miranda, A.; Fan, Z.; Duarte, F.; Ratti, C. Desirable streets: Using deviations in pedestrian trajectories to measure the value of the built environment. Comput. Environ. Urban Syst. 2021, 86, 101563. [Google Scholar] [CrossRef]


| Application Modules | Data Type | Data Sources |
|---|---|---|
| Supply side | public toilets POI | Gaode Map (https://ditu.amap.com/) and the “You Yunnan” app |
| Demand side | population distribution | The Seventh National Population Census |
| Connected media | road data | OpenStreetMap (https://openstreetmap.org) |
| administrative boundary | Tianditu (https://www.tianditu.gov.cn/) and DataV.GeoAtlas platform (https://datav.aliyun.com) |
| Accessibility Grading Criteria (Toilets/1000 Persons) | ||||||
|---|---|---|---|---|---|---|
| Ai | Inaccessible | Low accessibility | Lower accessibility | General accessibility | Higher accessibility | High accessibility |
| 0 | 0–5 | 5–10 | 10–15 | 15–20 | >20 | |
| Distribution of Numbers of Communities with Different Levels of Accessibility Within the 5 min Living Circle | ||||||
|---|---|---|---|---|---|---|
| Ai | Inaccessible | Low accessibility | Lower accessibility | General accessibility | Higher accessibility | High accessibility |
| 57 | 46 | 5 | 1 | 0 | 1 | |
| Distribution of Numbers of Communities with Different Levels of Accessibility Within the 10 min Living Circle | ||||||
|---|---|---|---|---|---|---|
| Ai | Inaccessible | Low accessibility | Lower accessibility | General accessibility | Higher accessibility | High accessibility |
| 16 | 64 | 17 | 8 | 2 | 3 | |
| Distribution of Numbers of Communities with Different Levels of Accessibility Within the 15 min Living Circle | ||||||
|---|---|---|---|---|---|---|
| Ai | Inaccessible | Low accessibility | Lower accessibility | General accessibility | Higher accessibility | High accessibility |
| 8 | 55 | 21 | 7 | 8 | 11 | |
| Distribution of Numbers of Communities with Different Levels of Accessibility Within the 20 min Living Circle | ||||||
|---|---|---|---|---|---|---|
| Ai | Inaccessible | Low accessibility | Lower accessibility | General accessibility | Higher accessibility | High accessibility |
| 2 | 54 | 20 | 11 | 7 | 16 | |
| Distribution of Numbers of Communities with Different Levels of Accessibility Within the 30 min Living Circle (Units) | ||||||
|---|---|---|---|---|---|---|
| Ai | Inaccessible | Low accessibility | Lower accessibility | General accessibility | Higher Accessibility | High accessibility |
| 0 | 46 | 21 | 17 | 7 | 19 | |
| Distribution of Numbers of Communities with Different Levels of Accessibility Within the 30 min Living Circle | ||||||
|---|---|---|---|---|---|---|
| Ai | Inaccessible | Low accessibility | Lower accessibility | General accessibility | Higher accessibility | High accessibility |
| Before expansion | 0 | 46 | 21 | 17 | 7 | 19 |
| After expansion | 0 | 12 | 26 | 17 | 8 | 47 |
Disclaimer/Publisher’s Note: The statements, opinions and data contained in all publications are solely those of the individual author(s) and contributor(s) and not of MDPI and/or the editor(s). MDPI and/or the editor(s) disclaim responsibility for any injury to people or property resulting from any ideas, methods, instructions or products referred to in the content. |
© 2025 by the authors. Published by MDPI on behalf of the International Society for Photogrammetry and Remote Sensing. Licensee MDPI, Basel, Switzerland. This article is an open access article distributed under the terms and conditions of the Creative Commons Attribution (CC BY) license (https://creativecommons.org/licenses/by/4.0/).
Share and Cite
Xu, Q.; Li, Y.; Niu, J.; Li, Y.; Wu, H. Optimization of a Layout for Public Toilets Based on Evaluation of Accessibility Through the Gaussian Two-Step Floating Catchment Area Approach. ISPRS Int. J. Geo-Inf. 2025, 14, 242. https://doi.org/10.3390/ijgi14070242
Xu Q, Li Y, Niu J, Li Y, Wu H. Optimization of a Layout for Public Toilets Based on Evaluation of Accessibility Through the Gaussian Two-Step Floating Catchment Area Approach. ISPRS International Journal of Geo-Information. 2025; 14(7):242. https://doi.org/10.3390/ijgi14070242
Chicago/Turabian StyleXu, Quanli, Youyou Li, Jiali Niu, You Li, and Huishan Wu. 2025. "Optimization of a Layout for Public Toilets Based on Evaluation of Accessibility Through the Gaussian Two-Step Floating Catchment Area Approach" ISPRS International Journal of Geo-Information 14, no. 7: 242. https://doi.org/10.3390/ijgi14070242
APA StyleXu, Q., Li, Y., Niu, J., Li, Y., & Wu, H. (2025). Optimization of a Layout for Public Toilets Based on Evaluation of Accessibility Through the Gaussian Two-Step Floating Catchment Area Approach. ISPRS International Journal of Geo-Information, 14(7), 242. https://doi.org/10.3390/ijgi14070242