1. Introduction
With the increasing intensity of urban development, high-density building layouts lead to reduced wind speeds, resulting in the accumulation of heat and pollutants, which exacerbates the urban heat island effect and deteriorates air quality [
1,
2,
3,
4,
5,
6]. The design of urban ventilation corridors is a crucial planning strategy for mitigating urban heat islands, controlling air pollution, and regulating microclimates. Its core objective is to optimize the urban wind environment and enhance airflow to improve overall livability [
7,
8,
9,
10,
11,
12]. A well-structured ventilation corridor layout can effectively align with prevailing wind directions, facilitating the inflow of cool air into urban areas, reducing heat island intensity, and promoting pollutant dispersion. This approach plays a vital role in improving air quality, enhancing urban climate resilience, and advancing sustainable urban development [
13,
14,
15,
16,
17,
18].
While CFD provides accurate and detailed insights into urban airflow dynamics, its high computational cost and complexity limit its practicality for large-scale, iterative ventilation planning [
19,
20,
21,
22]. To address these limitations, morphology-based methods have emerged as an efficient alternative, offering faster and more scalable solutions for urban ventilation assessment with significantly reduced computational demands. Morphology-based methods for identifying urban ventilation corridors are typically conceptualized as a two-stage analytical process: (1) constructing an airflow resistance surface [
4] and (2) delineating ventilation corridors based on this resistance surface [
23,
24]. In the modeling of resistance surfaces, numerous studies have proposed a variety of morphological indicators, including building morphological indicators, terrain roughness indices, and vegetation canopy structures. Some research efforts have further attempted to integrate these heterogeneous factors into a unified resistance representation. Among these, one of the most commonly adopted approaches is to apply the Analytic Hierarchy Process (AHP) to assign weights to individual resistance factors, followed by a weighted overlay analysis to generate a composite resistance surface [
5,
10,
11].
The second stage of ventilation corridor identification involves simulating airflow pathways on the resistance surface through varying levels of abstraction and simplification of airflow behavior. Based on the degree of simplification in airflow direction, these methods can be categorized into four types: The first type is the morphological index classification method, which assumes a linear relationship between urban canopy ventilation resistance and wind speed [
23,
25,
26]. In this method, the resistance surface is divided into several classes, with areas exhibiting low resistance identified as potential ventilation corridors. As this method does not explicitly model airflow, the degree of directional freedom is considered to be zero. The second type is the Least Cost Path (LCP) method, which assumes that airflow always moves along the path of least resistance [
27,
28]. This approach enables the rapid identification of primary ventilation routes between inlet and outlet zones. Although multiple directional options are theoretically available at each grid cell, the method ultimately selects only the direction with the minimum resistance, thus offering a directional freedom of one. To enhance directional flexibility, the third type—the circuit model method—was developed [
29,
30]. It assumes that when airflow encounters a branching point, it is distributed inversely proportional to the resistance of each branch. This method increases the degree of directional freedom to four. More recently, the Lattice Boltzmann Method (LBM) was applied to the analysis of urban ventilation corridors [
31]. Capable of simulating the physical processes of air movement, the typical D2Q9 model defines nine discrete velocity directions, allowing for a detailed simulation of airflow distribution within the urban canopy.
A major limitation of the aforementioned methods lies in their inability to establish a direct relationship between airflow distribution and actual wind speed, as they can only approximate the magnitude of airflow. A promising solution is to employ machine learning techniques to construct a mapping between airflow information and wind speed. Building upon the Lattice Boltzmann Method (LBM), Xie applied an unsupervised machine learning approach to extract urban ventilation corridors [
31]. Although the method effectively identified corridor structures, it still failed to establish a quantitative link between airflow and wind speed. Wehrle employed a random forest model to relate urban canopy morphology to wind speed, but the applicability of this approach is confined to pedestrian-level wind conditions and lacks the capacity to address the vertical complexity of the urban canopy [
20]. Therefore, a potential research direction is to leverage machine learning to develop a multivariate mapping model that integrates urban morphological parameters, airflow information, and wind speed.
Building upon the above analysis, this study proposes an integrated framework that first performs simulations using LBM based on building morphological indicators. A random forest model is then trained using a dataset that combines building morphological indicators, LBM simulation results and their augmented versions, along with wind speed data derived from CFD simulations. Airflow information serves as an intermediate variable to establish a mapping between urban morphology and predicted wind speed. The objectives of this study are as follows: (1) to construct an urban ventilation resistance surface from building morphological indicators; (2) to simulate airflow distribution within the urban canopy under prevailing wind conditions using LBM; and (3) to develop a predictive model via random forest that maps urban morphology to wind speed.
2. Materials and Methods
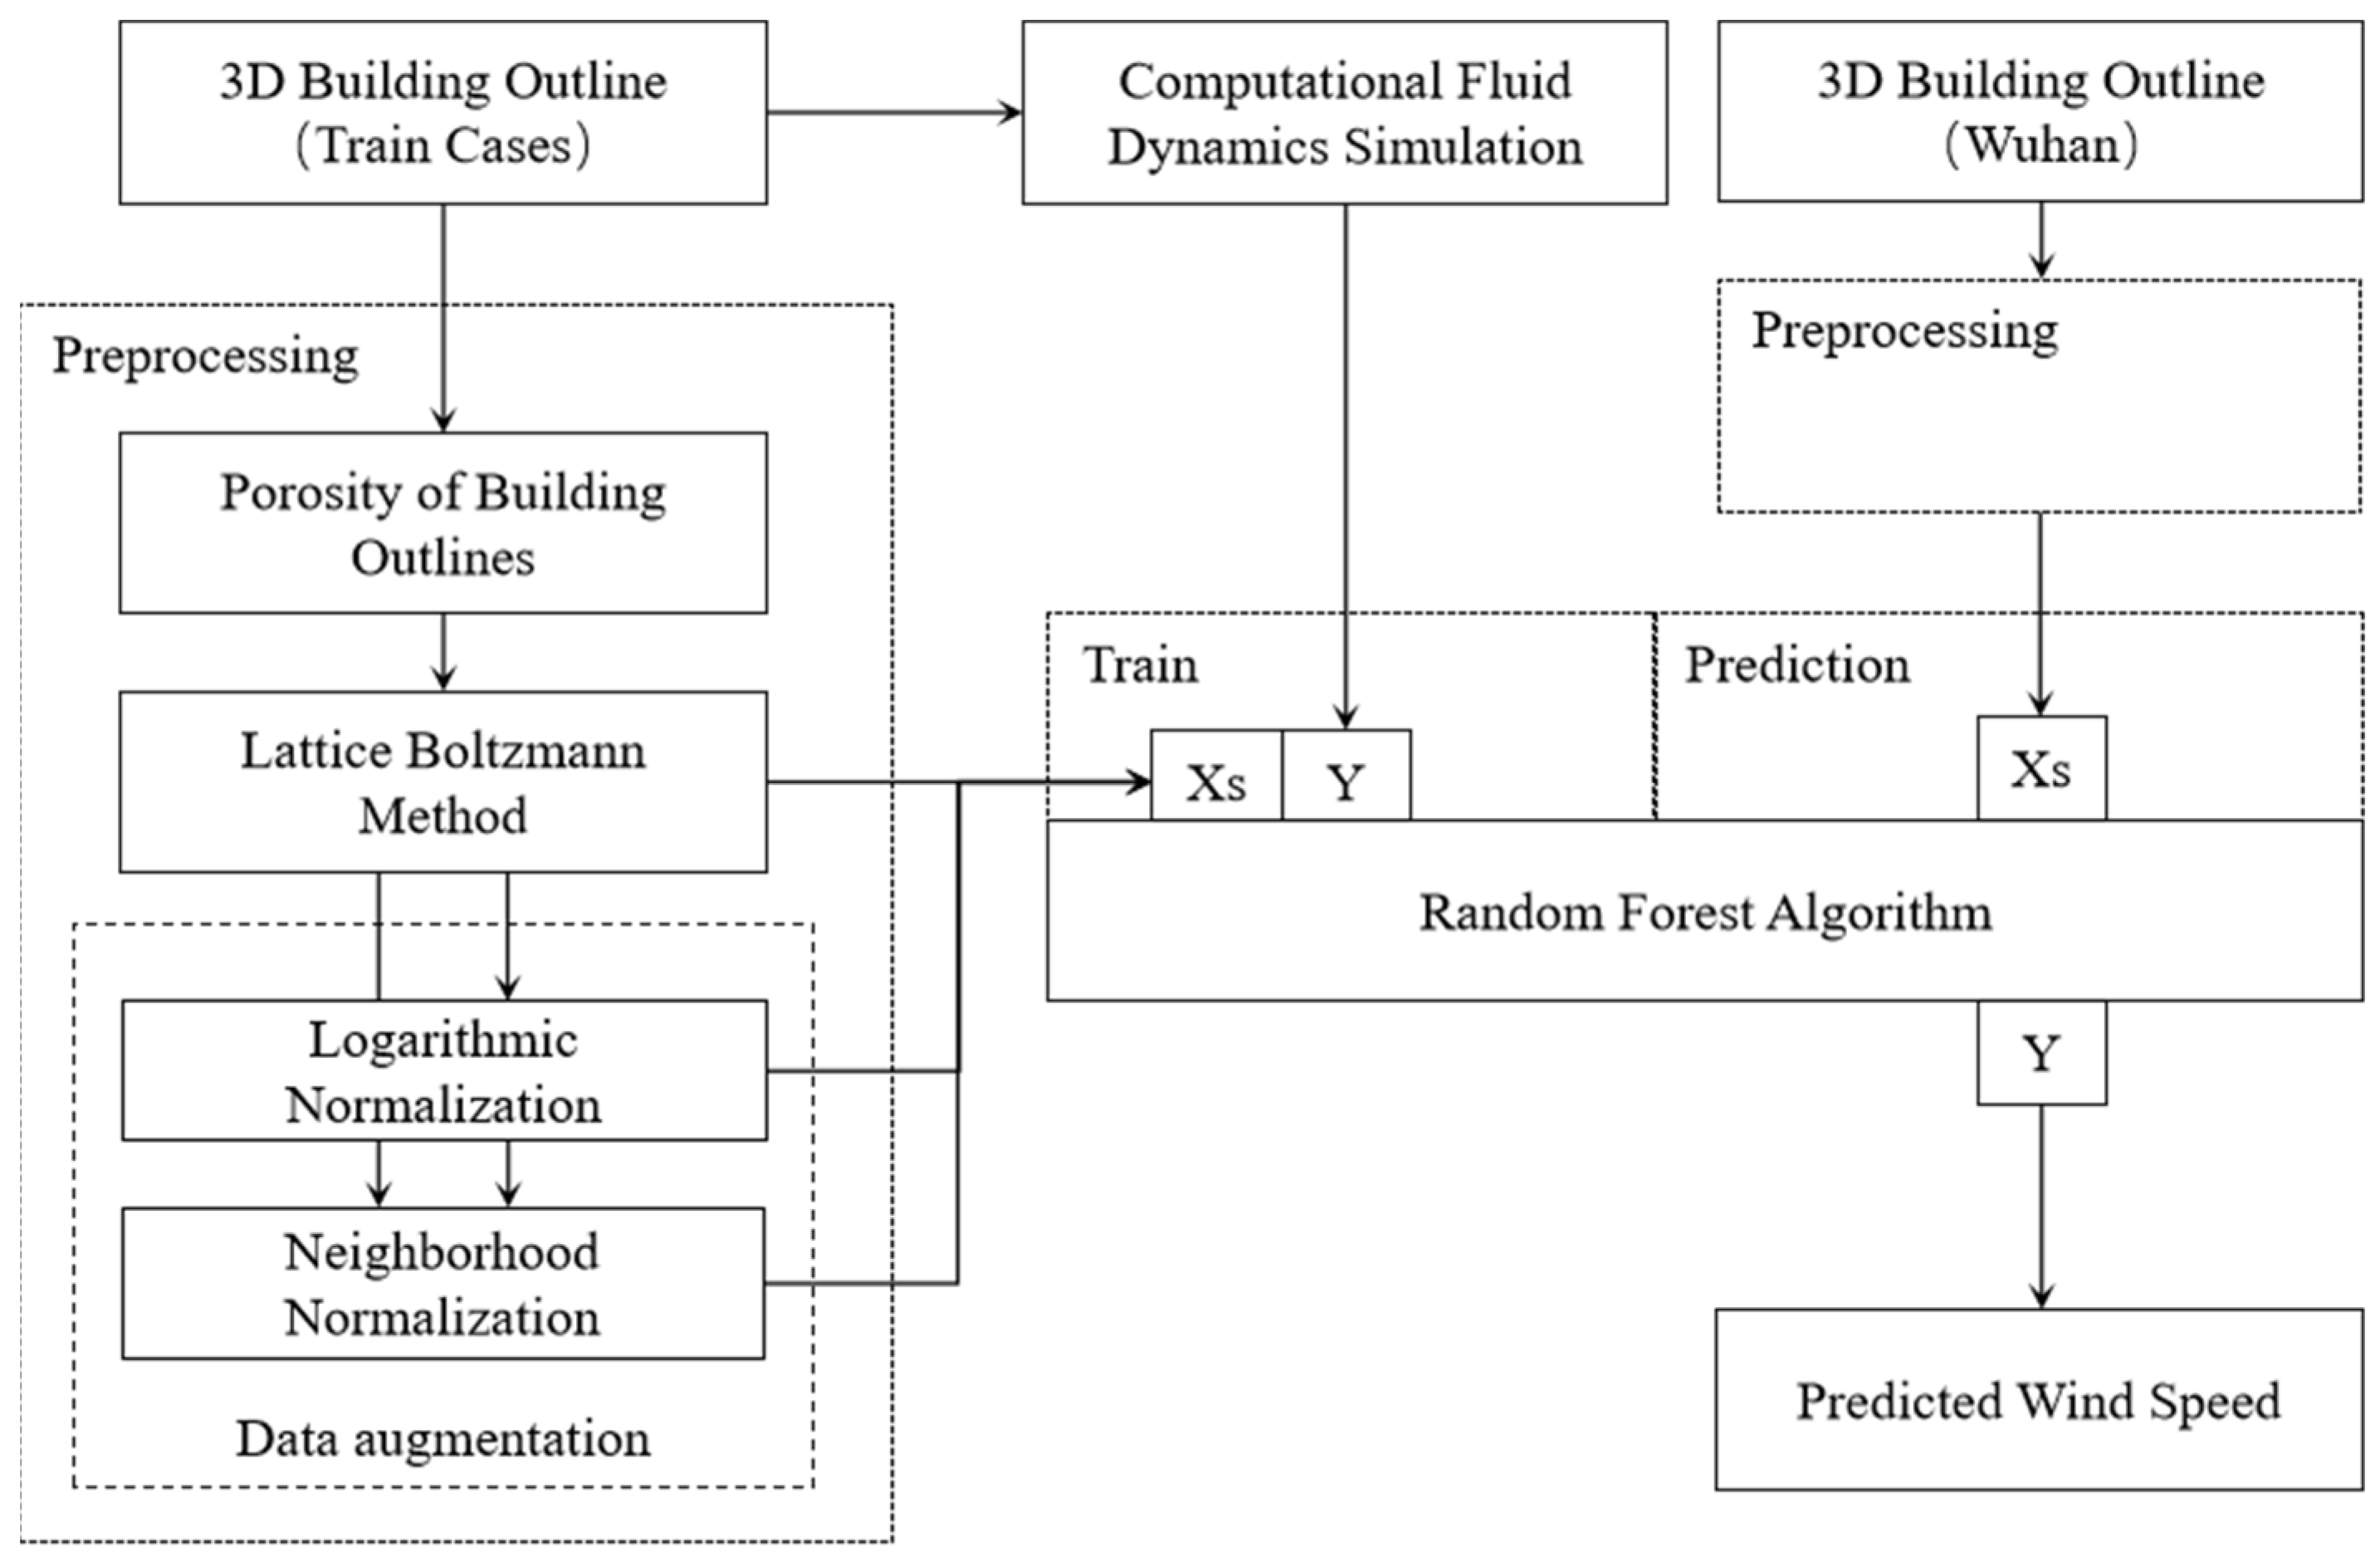
This study follows a systematic methodology to achieve its research objectives (
Figure 1). First, morphological analysis is employed to quantify the porosity of building outlines, providing a measure of the permeability of urban morphology to airflow. Second, LBM simulations are conducted to model the spatial distribution of airflow under specific wind conditions, capturing the key characteristics of urban ventilation and revealing the dynamics of the wind field. Subsequently, data augmentation techniques are applied to enhance the diversity of building morphological indicators and airflow information, generating input samples for the random forest model. Meanwhile, CFD simulations are used to obtain wind speed data under the same building configurations and background wind conditions, serving as output samples for model training. Finally, the model is trained and evaluated, and the trained model is applied to assess urban ventilation performance in the central urban area of Wuhan.
2.1. Morphological Index
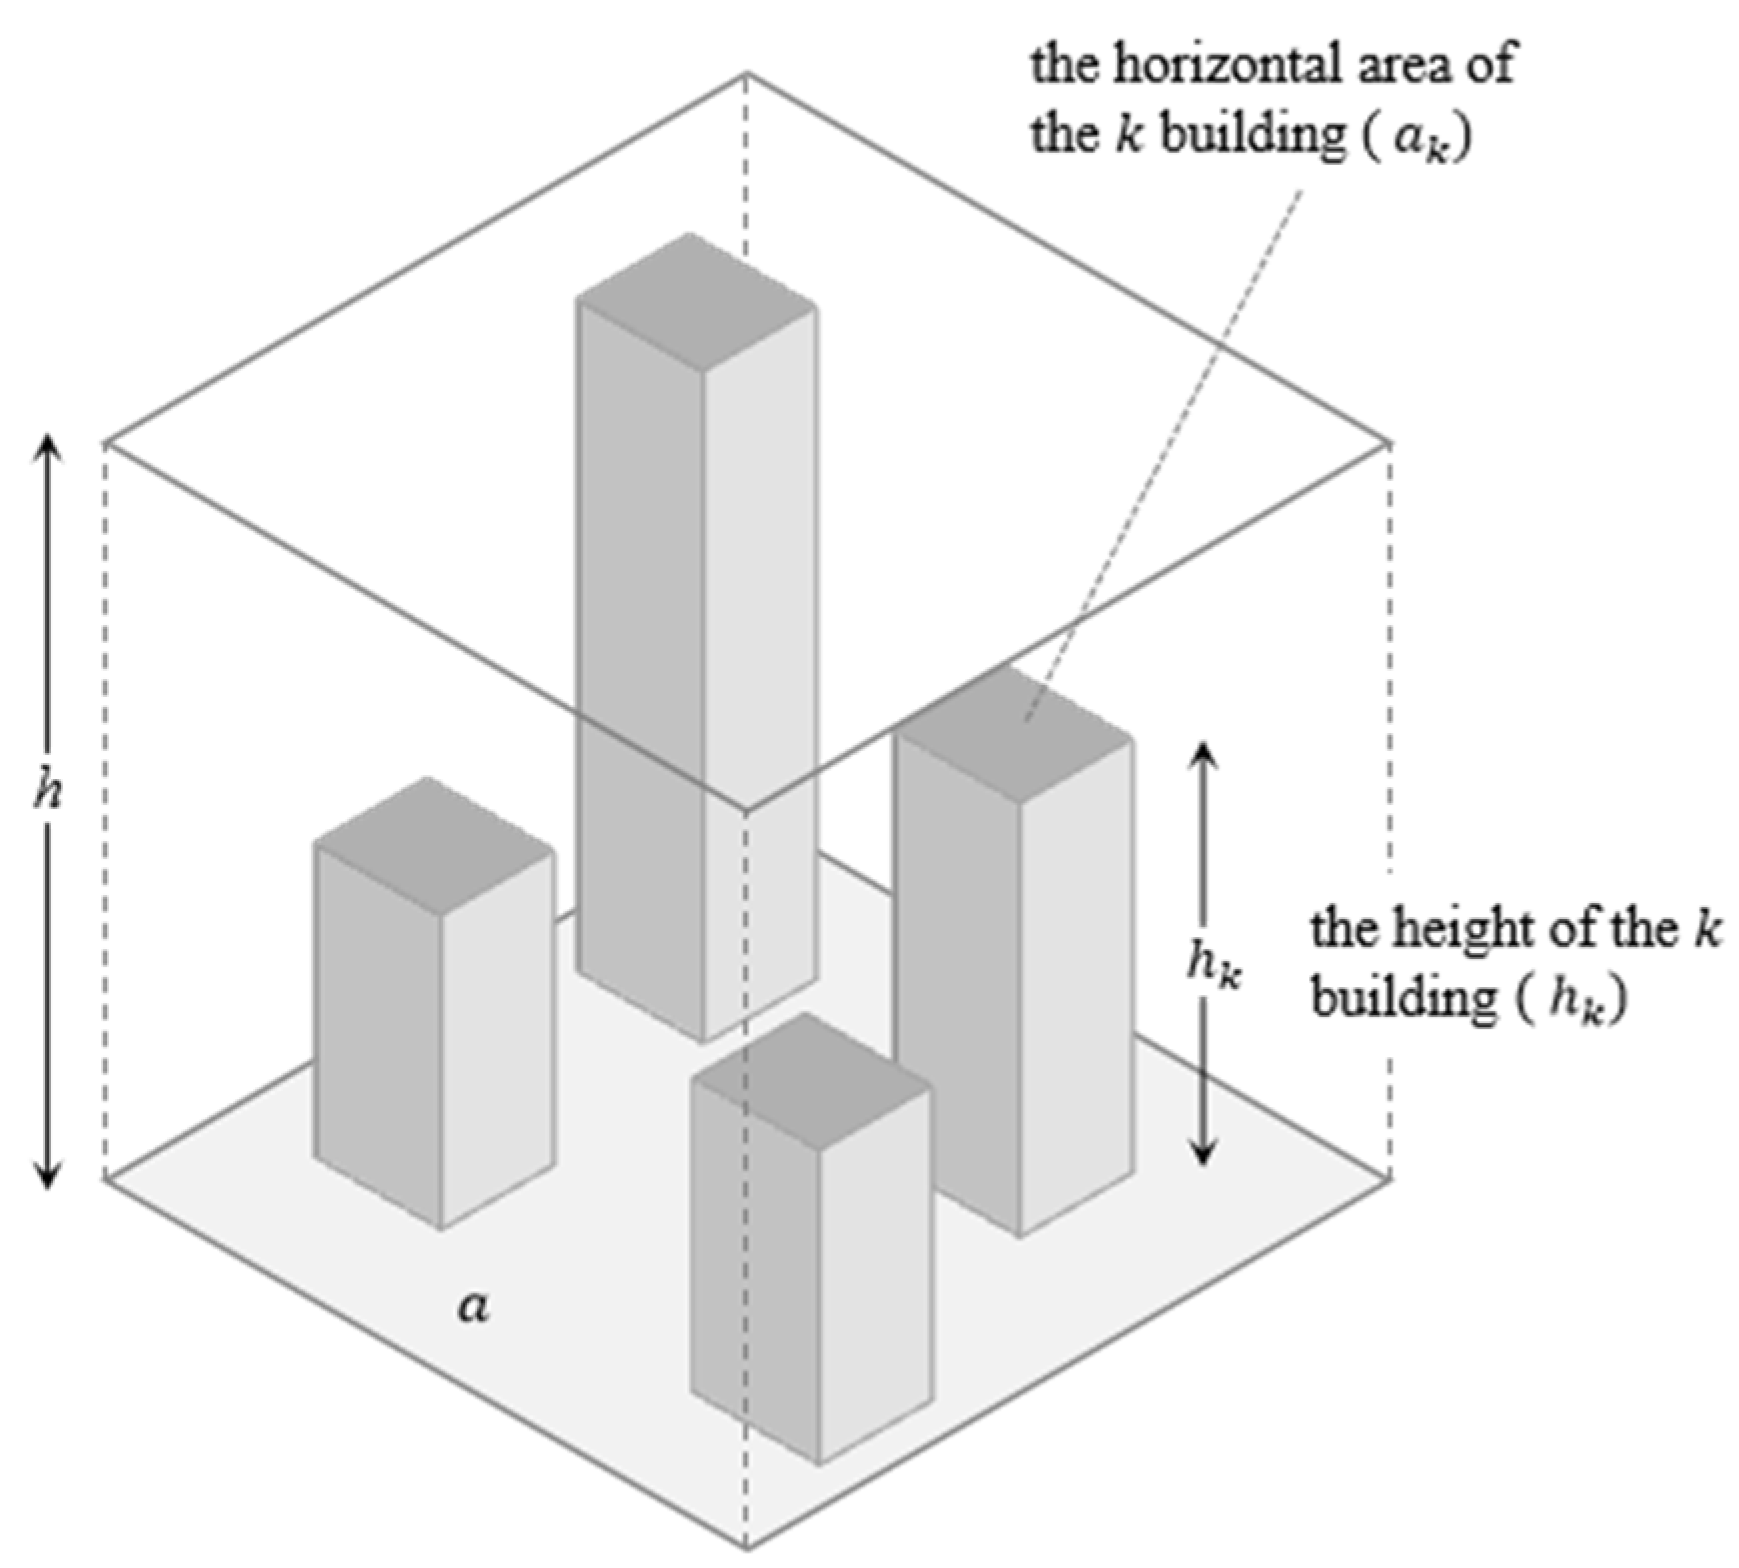
For urban canopies, the ventilation potential of a grid cell is quantified by its porosity, defined as the ratio of the open space volume to the total volume of the cell, expressed as a percentage (
Figure 2). A higher porosity indicates a greater proportion of open space, which facilitates airflow by providing additional flow paths, thereby enhancing overall ventilation efficiency [
5,
32,
33,
34].
Here, represents the total number of buildings within a grid cell, denotes the horizontal footprint of the -th building, and corresponds to its height. refers to the total area of the analysis unit, while represents the specified analysis height. In this study, is set to 100 m to ensure coverage of 99.5% of the buildings.
2.2. Lattice Boltzmann Method
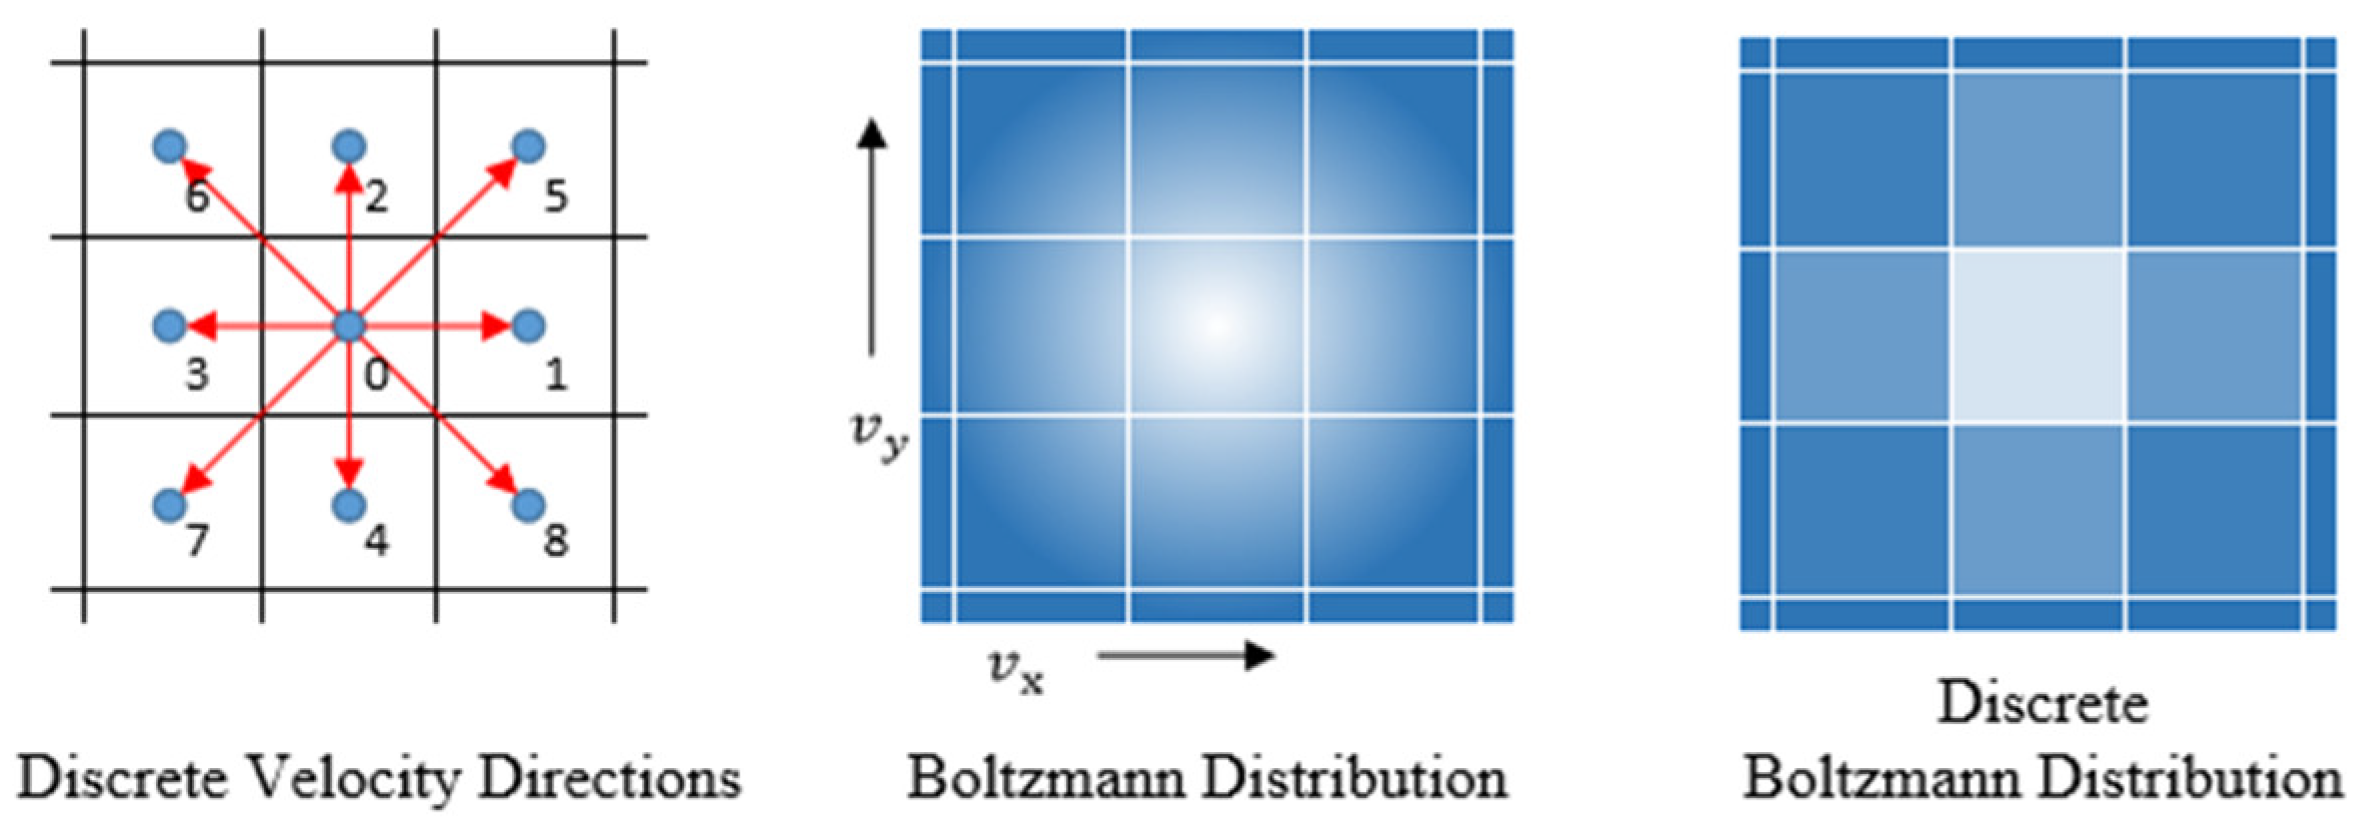
In the LBM framework, both space and time are discretized (
Figure 2). For two-dimensional fluid simulations, the D2Q9 lattice model is commonly employed to define the velocity space. This model consists of nine discrete velocity vectors, as illustrated in
Figure 3. Among them, the central vector corresponds to zero velocity, while the remaining eight vectors point toward the eight neighboring lattice nodes surrounding the central cell. The nine discrete velocity vectors are denoted as
, where
represents the stationary state, and the other eight vectors correspond to distinct velocity directions. Each velocity vector has two components,
and
, with values of −1, 0, or 1, measured in lattice units to ensure numerical stability and computational accuracy.
2.2.1. Collision Process
The LBM framework consists of two fundamental processes: collision and streaming. During the collision step, the key dynamical variables are the particle distribution functions associated with nine discrete velocity directions, all of which have positive values. These distribution functions are used to compute the macroscopic quantities, including the total density and the mean velocity components in the
x and
y directions, denoted as
and
, respectively.
where
represents a set of weighting factors used to transform the Boltzmann distribution into the lattice Boltzmann distribution (
Figure 3). The relationship between the particle distribution function in the
-th direction before and after the collision process can be expressed by the following equation:
where
and
represent the particle distribution functions before and after the collision, respectively, where
describes the equilibrium state of fluid molecules under the Bhatnagar–Gross–Krook (BGK) model. The parameter
is a dimensionless relaxation factor, ranging from 0 to 2. A smaller
value indicates a longer relaxation time required for the system to reach density equilibrium, whereas a larger
value signifies a more rapid collision process, leading to faster attainment of equilibrium density. The specific value of
is determined by the viscosity of the simulated fluid. This study simulates the motion of air at a temperature of 25 °C,
.
2.2.2. Streaming Process
In the streaming process of the LBM model used in this study, fluid moves between lattice nodes, with a portion flowing into neighboring nodes while the remaining portion is reflected back to the original node. The ratio of fluid flowing into adjacent nodes to that being reflected is closely related to the ventilation potential of a given lattice node. The fluid penetration/reflection ratio can be computed using the following equation:
The fluid density along the
direction after the
t-th steaming iteration is represented by
, while
denotes the density along the
direction. Similarly,
and
refer to the corresponding fluid densities prior to the
t-th iteration. The symbols
and
represent the porosity of lattices
and
, respectively. The current value
of the
-th cell is readily computable.
In the above definition, denotes the index of a cell in the lattice, and refers to the index of the discrete velocity direction, ranging from 0 to 8 in the D2Q9 model. The term represents the particle distribution function in the -th direction at the -th cell. The vector is the discrete velocity vector corresponding to direction , with and being its components along the - and -axes, respectively. The current value is defined as the magnitude of the local momentum density vector and serves as an indicator of the flow strength at the -th cell.
2.3. Neighborhood Normalization Method
The LBM flow distribution reflects the natural ventilation capacity under the current conditions. To identify regions with local ventilation advantages, this study employs a neighborhood normalization method. Within a specified neighborhood, if the flow at the central point is greater than the average flow of its surrounding points, the central lattice point is considered a dominant point. We first define a neighborhood normalized flow value
as follows:
where
is a preprocessing function applied to the raw flow value. In this study, we consider two alternatives: raw form
and logarithmic transformation
.
denotes the original current value of the
-th cell obtained from LBM simulations,
is the set of all
values,
denotes the set of neighbors of the
-th cell, and
represents the current value of the
-th cell within the neighborhood.
denotes the associated weight. In the subsequent case studies,
is set as the inverse of the number of grid cells in the neighborhood. When
, the position is identified as a local ventilation advantage area; otherwise, it is considered unfavorable for ventilation.
2.4. Random Forest Algorithm
The random forest algorithm is an ensemble learning method widely applied to regression and classification tasks due to its robustness, interpretability, and ability to handle high-dimensional data. It operates by constructing a large number of decision trees during training and aggregating their outputs—using averaging for regression or majority voting for classification—to improve predictive accuracy and reduce overfitting. Each tree is trained on a bootstrap sample of the original dataset, and at each node, a random subset of features is considered for splitting. This strategy introduces diversity among trees and enhances the model’s generalization capability.
Random forest is particularly effective in capturing nonlinear relationships and interactions among variables, making it well-suited for complex modeling tasks in urban environments. In this study, the random forest model was employed to establish a predictive relationship between urban morphological parameters and wind speed distribution under specific wind conditions.
Four types of LBM-derived features were used for model training: raw values, their logarithmic transformations, and the neighborhood-normalized values of both. The normalization was applied at multiple spatial scales, using radii of 100 m, 500 m, 1000 m, and 2000 m. This multi-representation approach was adopted to capture both absolute magnitudes and local flow contrasts across scales. Additionally, the mean porosity within a 100 m radius was included as a morphological indicator. The output variable was the wind speed derived from CFD simulations under prevailing wind conditions. The dataset was randomly split into training, validation, and testing subsets in a ratio of 80%–10%–10% to ensure model robustness and generalizability.
2.5. Computational Fluid Dynamics Experiment
2.5.1. Numerical Models
Computational Fluid Dynamics (CFD) methods are widely applied to simulate airflow in both indoor and outdoor settings. Among various turbulence modeling approaches, the standard k-ε scheme has proven to be robust and has been extensively validated against experimental results in urban wind environment studies. In this study, the steady-state and isothermal wind field was modeled using ANSYS Fluent 2021, with turbulence effects captured through the implementation of the standard k-ε formulation. The governing equations describing the mean flow and turbulent characteristics are provided below.
The mass conservation equation:
The standard k-ε turbulence model is governed by the following transport equations:
where
denotes the time-averaged velocity components in the streamwise (U), spanwise (V), and vertical (W) directions;
and
denote the kinematic viscosity and kinematic eddy viscosity;
is an empirical coefficient commonly assigned a value of 0.09;
represents the turbulent kinetic energy production term, describing the transfer of energy from the mean flow to turbulence;
denotes the Reynolds stress tensor; and
is the Kronecker delta, which equals 1 when
and 0 otherwise.
A no-slip boundary condition, combined with the standard wall function, was imposed at solid surfaces. The steady, isothermal flow field over the urban domain was resolved using the finite volume method (FVM), with pressure–velocity coupling handled via the SIMPLE algorithm (Semi-Implicit Method for Pressure Linked Equations). To enhance numerical precision, second-order upwind discretization was employed for all governing equations. The under-relaxation factors were set to 0.3 for pressure, 0.7 for momentum, and 0.8 for both the turbulent kinetic energy (k) and its dissipation rate (ε). Convergence was deemed to be achieved when the absolute residuals of continuity, velocity, k, and ε all fell below and stabilized over successive iterations.
2.5.2. Model Description
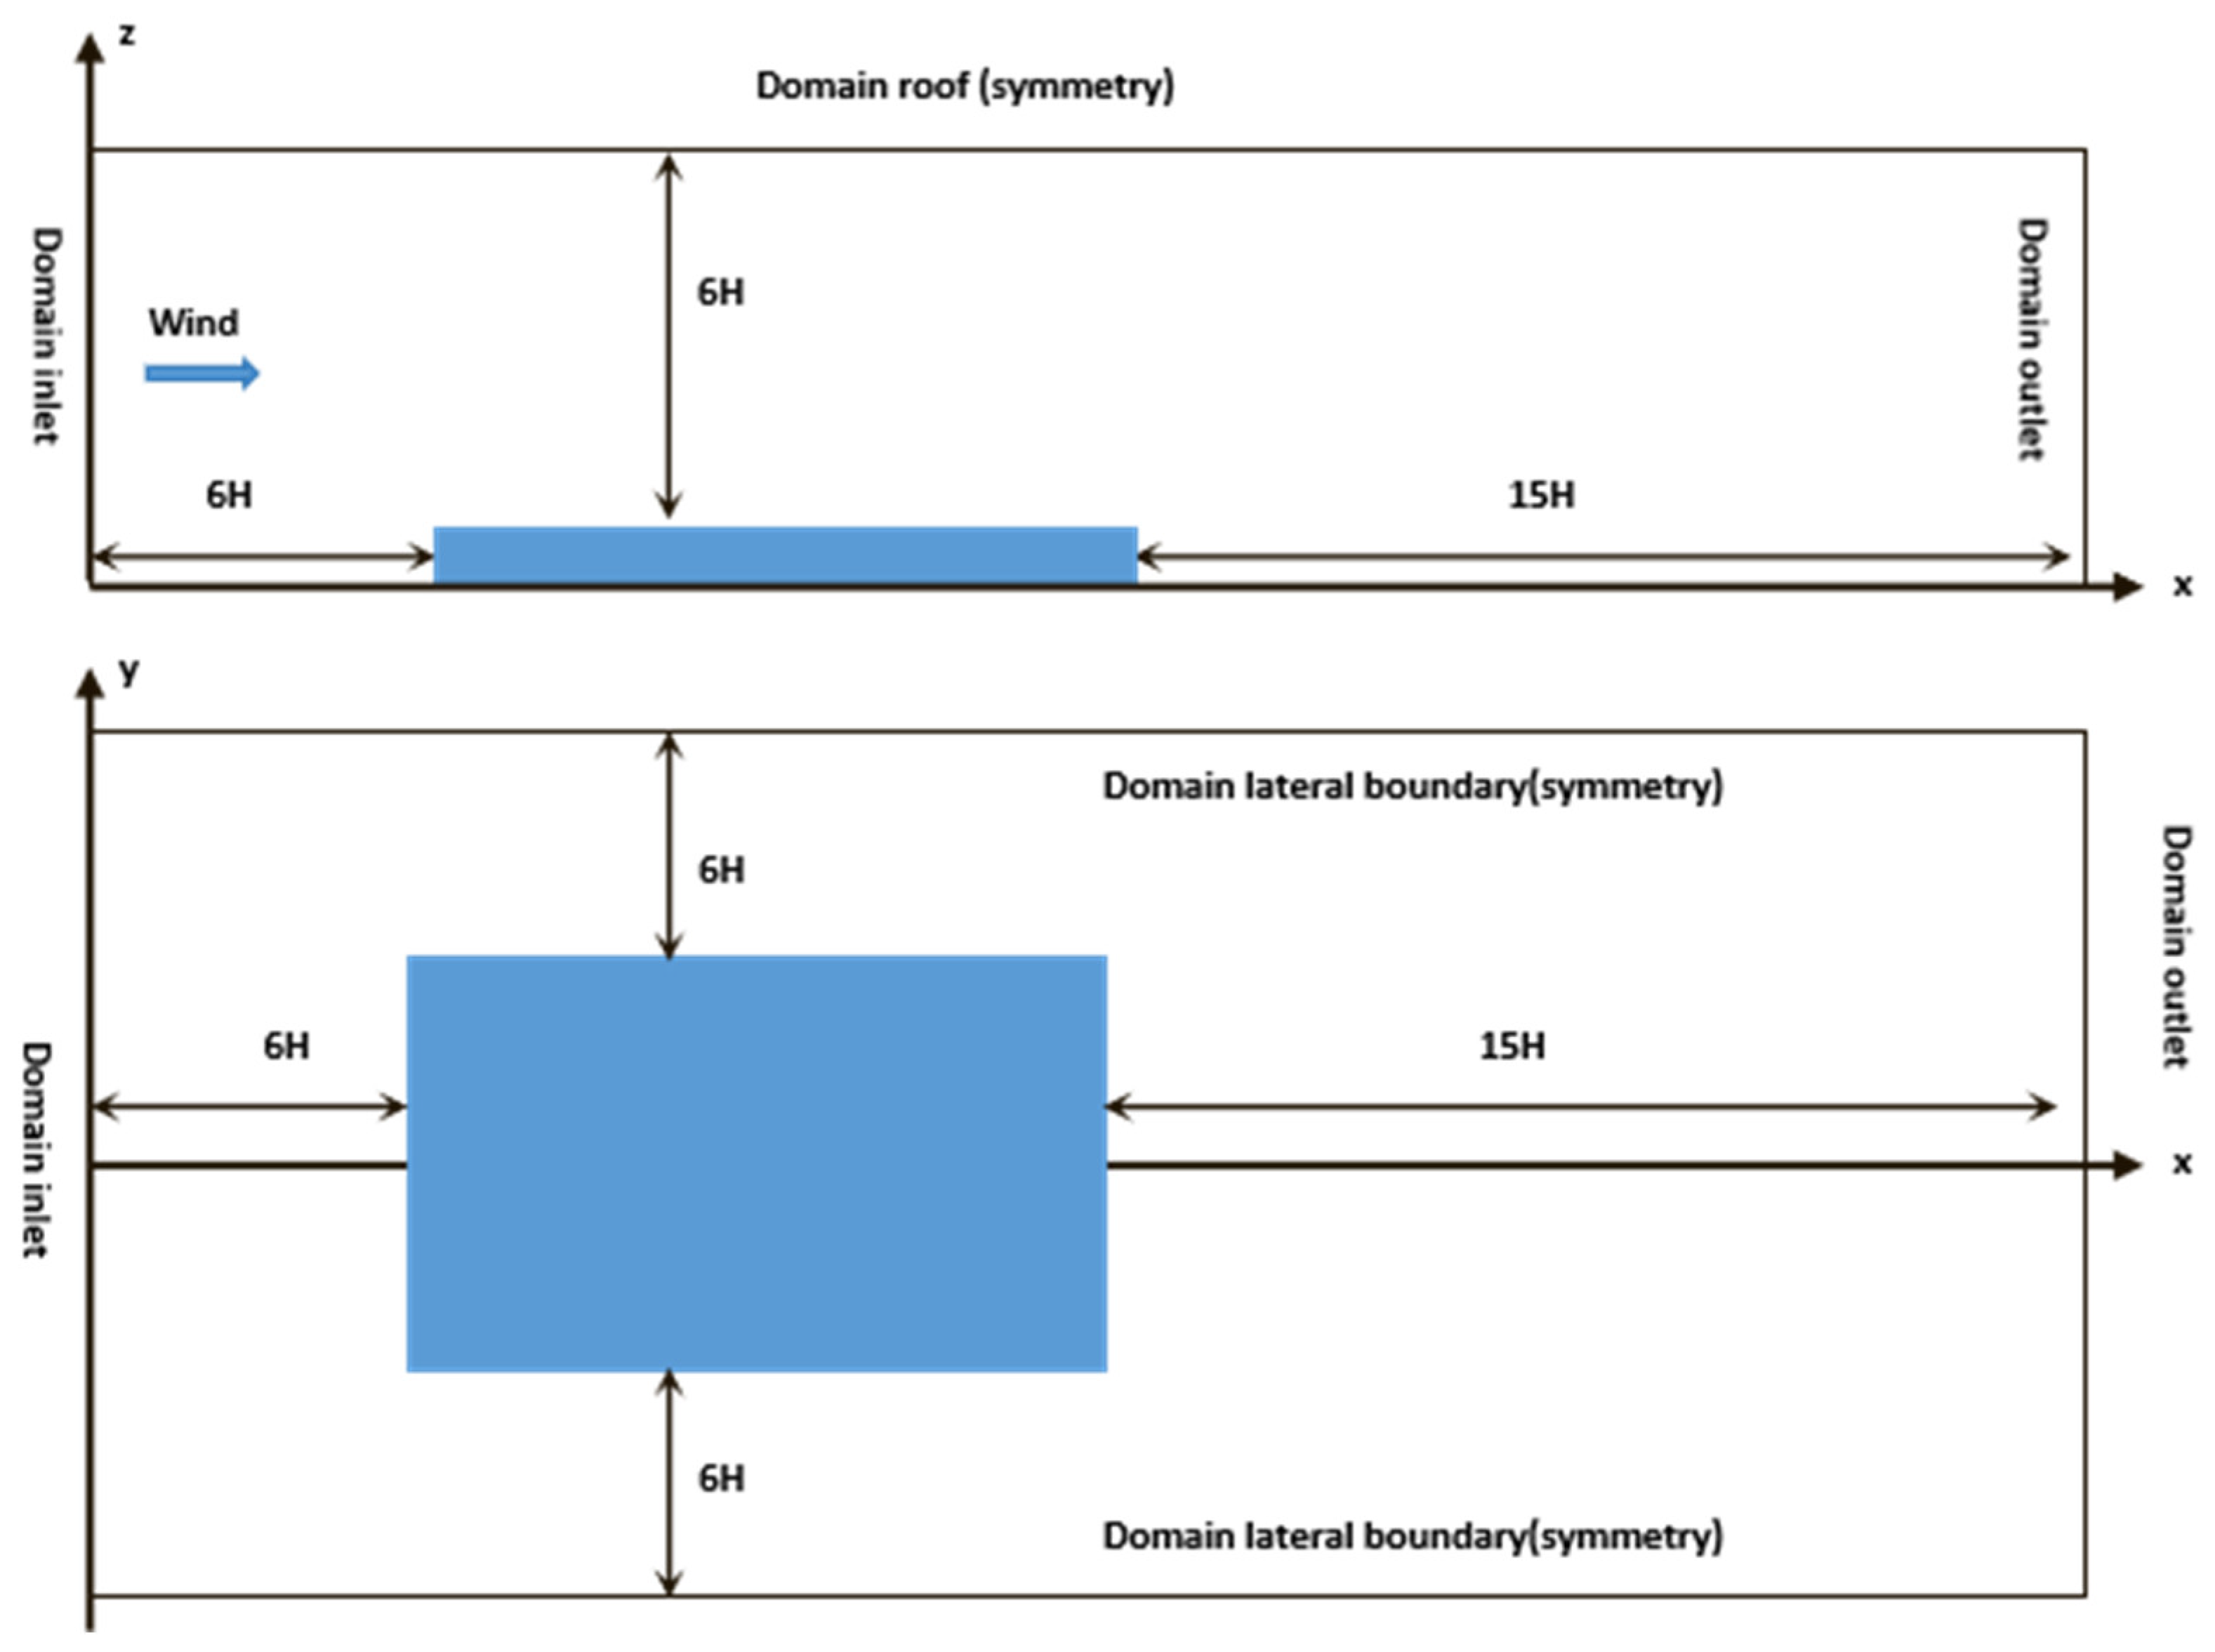
The model setup, computational domain, and boundary conditions are depicted in
Figure 4. The distances from the upstream canopy layer (UCL) to the domain’s top, inlet, lateral sides, and outlet were set to 6H, 6H, 6H, and 15H, respectively. Symmetry was applied at the top and lateral boundaries for velocity, turbulent kinetic energy (k), and dissipation rate (ε), while a zero-gradient condition was imposed normal to the outlet for the same variables. At the inlet, a power law wind profile based on the upstream free-stream velocity
was defined as Equation (13). The vertical distributions of k(z) and ε(z) were derived according to Equations (14) and (15), respectively.
A reference wind speed of 3.0 m/s was defined at the building height (H = 30 m). Standard constants were adopted, including the turbulence coefficient (0.09), friction velocity ( = 0.24 m/s), and von Kármán constant ( = 0.41). Three mesh densities were tested using a grid expansion ratio of 1.2, with the minimum near-wall polyhedral cell size set to 1.0 m. The total mesh counts were approximately 0.42 million for low-rise configurations, 1.40 million for medium-rise, 2.74 million for high-rise, and 1.21 million for mixed-height scenarios.
2.6. Study Area
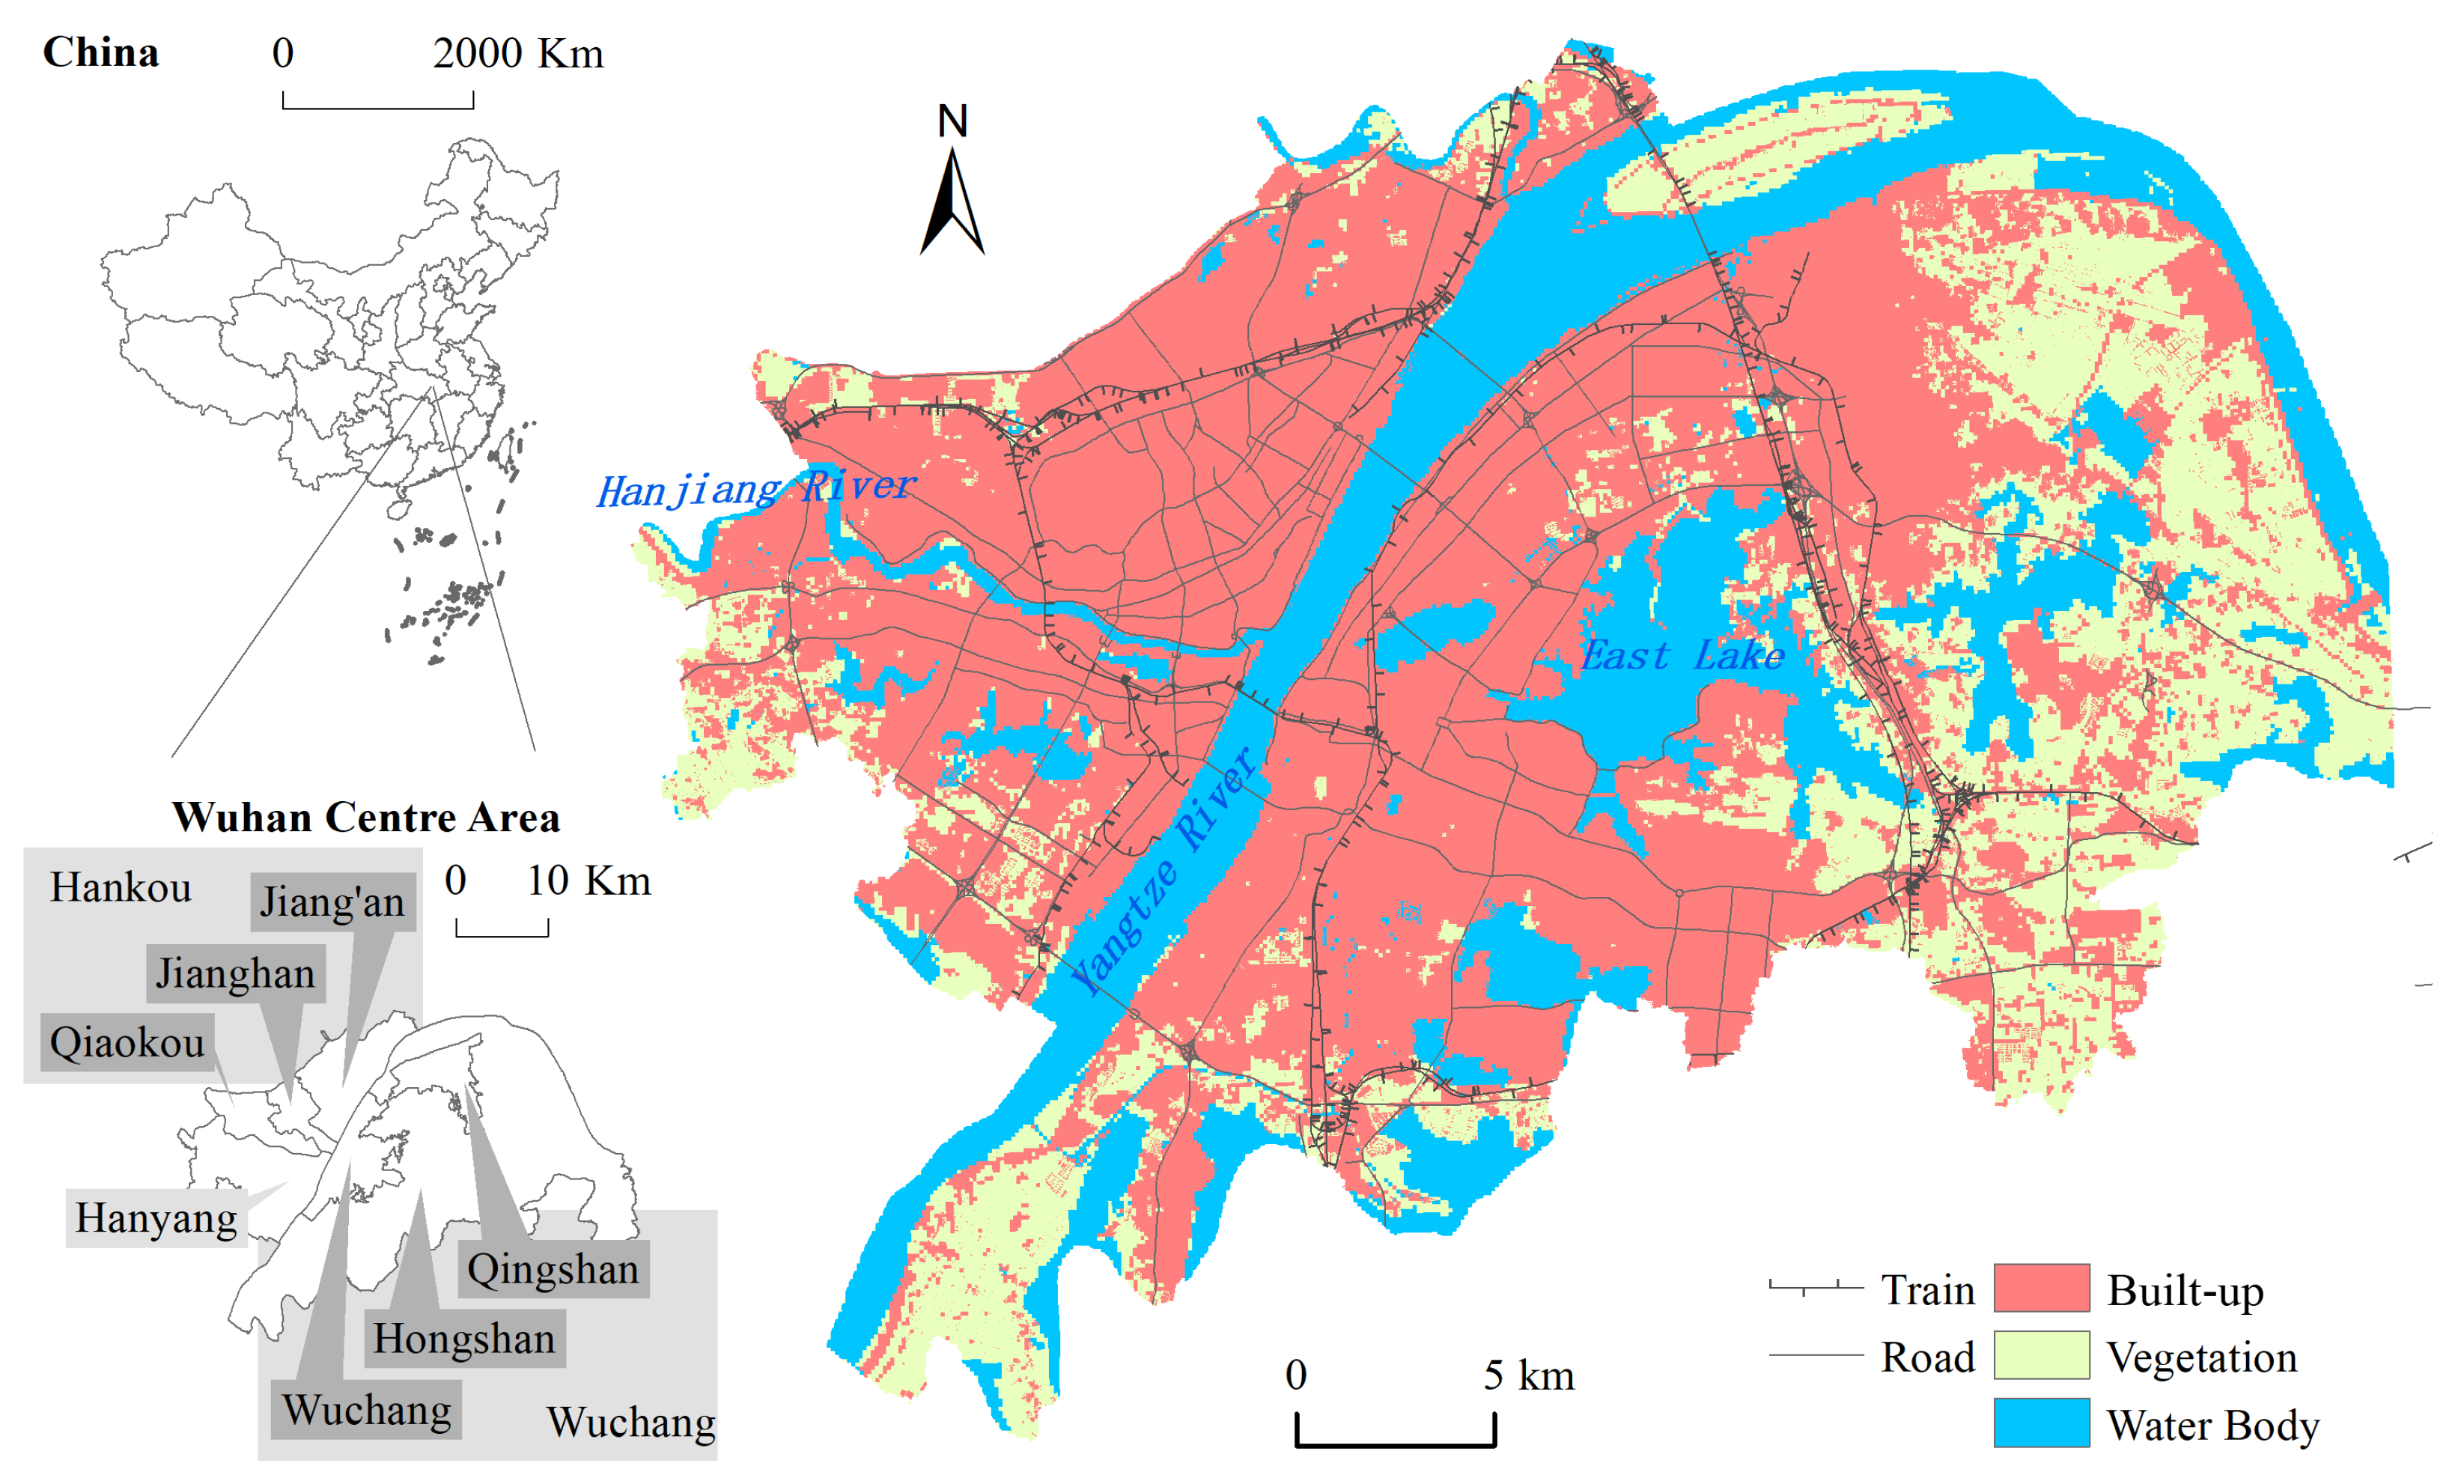
Wuhan, the capital of Hubei Province, is the largest metropolis in central China and serves as a major economic and transportation hub (
Figure 5). The city exhibits a highly complex urban structure, characterized by a dense distribution of high-rise buildings, an extensive road network, and diverse land use patterns. Situated at the confluence of the Yangtze and Han Rivers, Wuhan has undergone rapid urbanization, which has significantly influenced urban ventilation and microclimatic conditions. Divided by the two rivers, the central urban area of Wuhan consists of three distinct districts, Wuchang, Hankou, and Hanyang, each with a unique development focus. Wuchang is primarily designated for education, research, and administrative functions, hosting numerous prestigious universities, while its riverside areas have evolved into hubs for modern business and high-end residential developments. Hankou, as the city’s commercial and financial center, is dominated by business, office, residential, and transportation hub land uses, featuring multiple central business districts and major commercial zones. Hanyang, historically an industrial base, has undergone a transition toward a cultural, tourism, and emerging industries cluster, with extensive green spaces and waterfront parks enhancing urban livability. The land use configuration of these districts varies considerably, shaping Wuhan’s overall urban functional layout and exerting a profound influence on the formation of urban ventilation corridors and airflow dynamics. This study primarily focuses on the spatial distribution of urban ventilation corridors within Wuhan’s central districts, as well as potential areas for further development. The datasets on land use classification, building footprints, and road networks utilized in this research are sourced from the Wuhan Municipal Planning Bureau, ensuring high spatial resolution and data reliability.
3. Results
3.1. Model Training and Validation
To train the random forest model, this study conducted CFD simulations of various building configurations based on the Reynolds-Averaged Navier–Stokes equations. The wind speed results obtained from CFD were used as reference values for supervised learning. To mitigate overfitting and improve generalization performance, four types of urban block arrangements—mixed-rise, low-rise, mid-rise, and high-rise—were selected as training scenarios. Two background wind directions (north and west) were considered, resulting in a total of eight simulation cases. The CFD simulations were performed using ANSYS Fluent. The resulting wind speeds across the eight scenarios ranged from 0 to 9 m/s. This range was evenly divided into ten intervals, which were used as categorical output labels (Y values) for the random forest model. The input features (X values) included airflow information from LBM simulations, processed through logarithmic and domain normalization, as well as the mean porosity values of the building blocks. During model training, 80% of the data samples were used for training, 10% for validation, and the remaining 10% for post-training testing and performance evaluation.
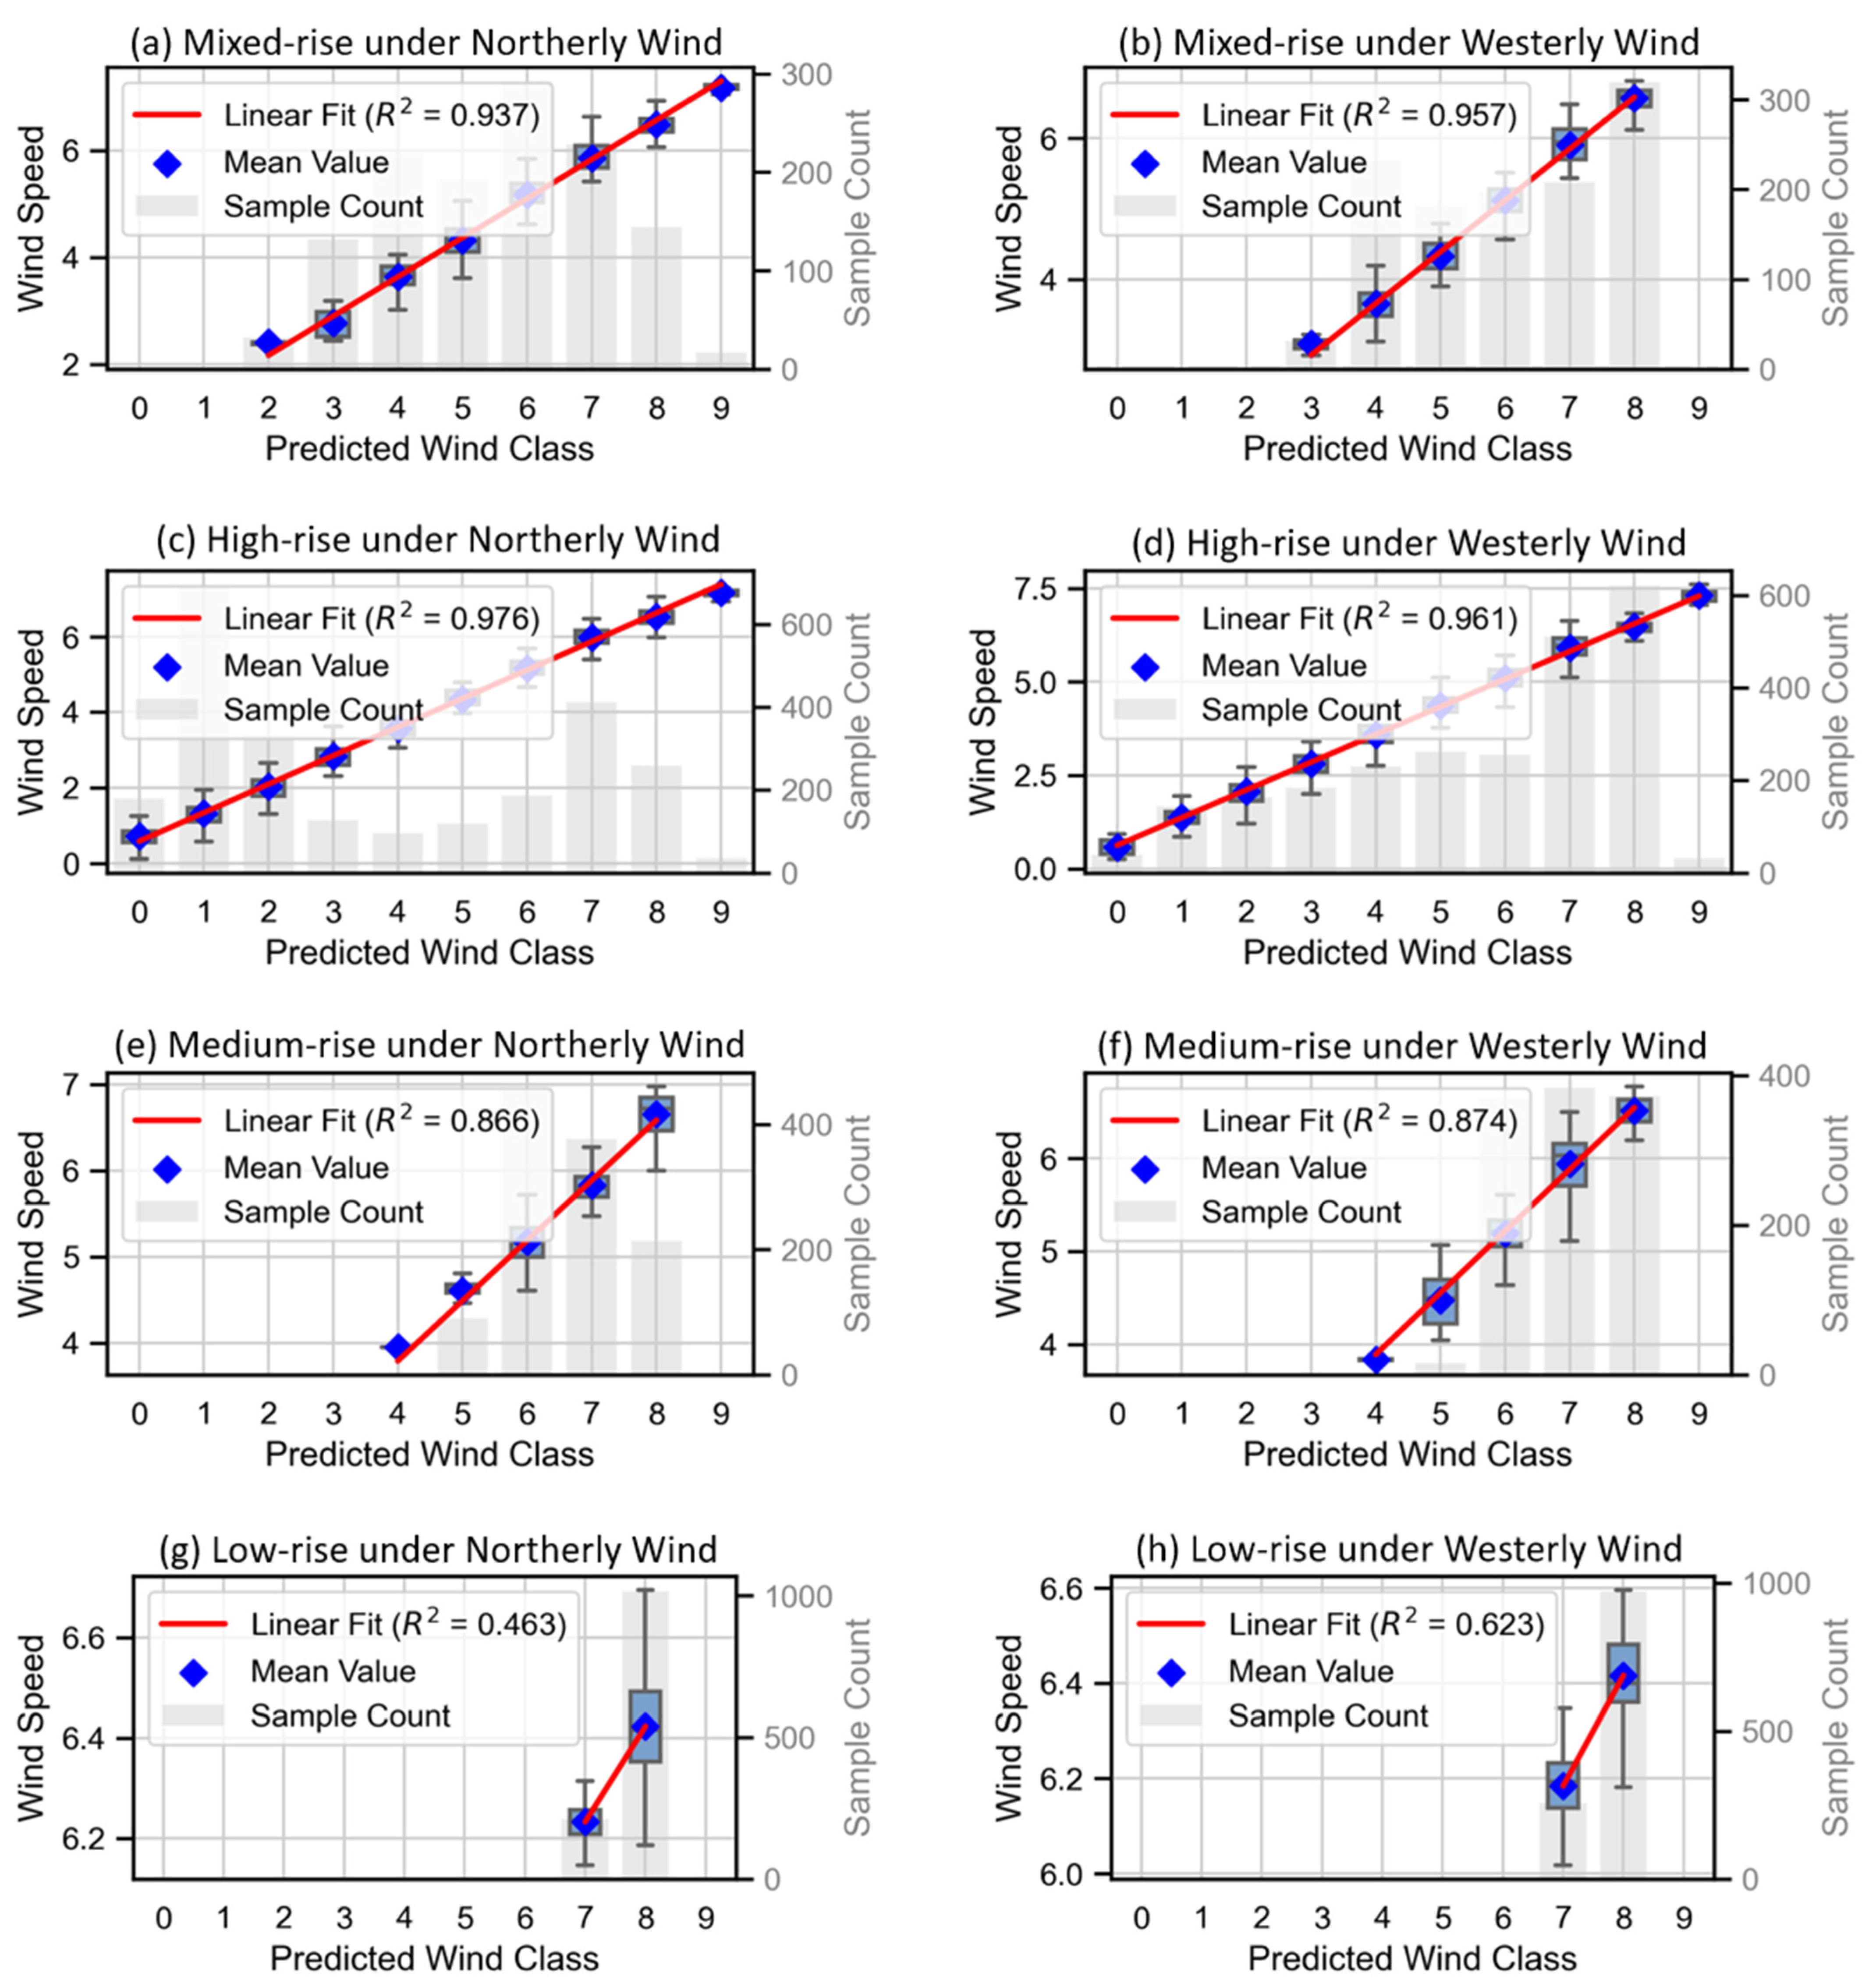
Figure 6 presents the relationship between the predicted wind speed classes from the random forest model and the reference CFD wind speeds on the test dataset. As shown in the figure, the model achieved high prediction accuracy for mixed-rise, high-rise, and mid-rise building configurations. In contrast, the performance was relatively poor for the low-rise scenario.
Figure 7 and
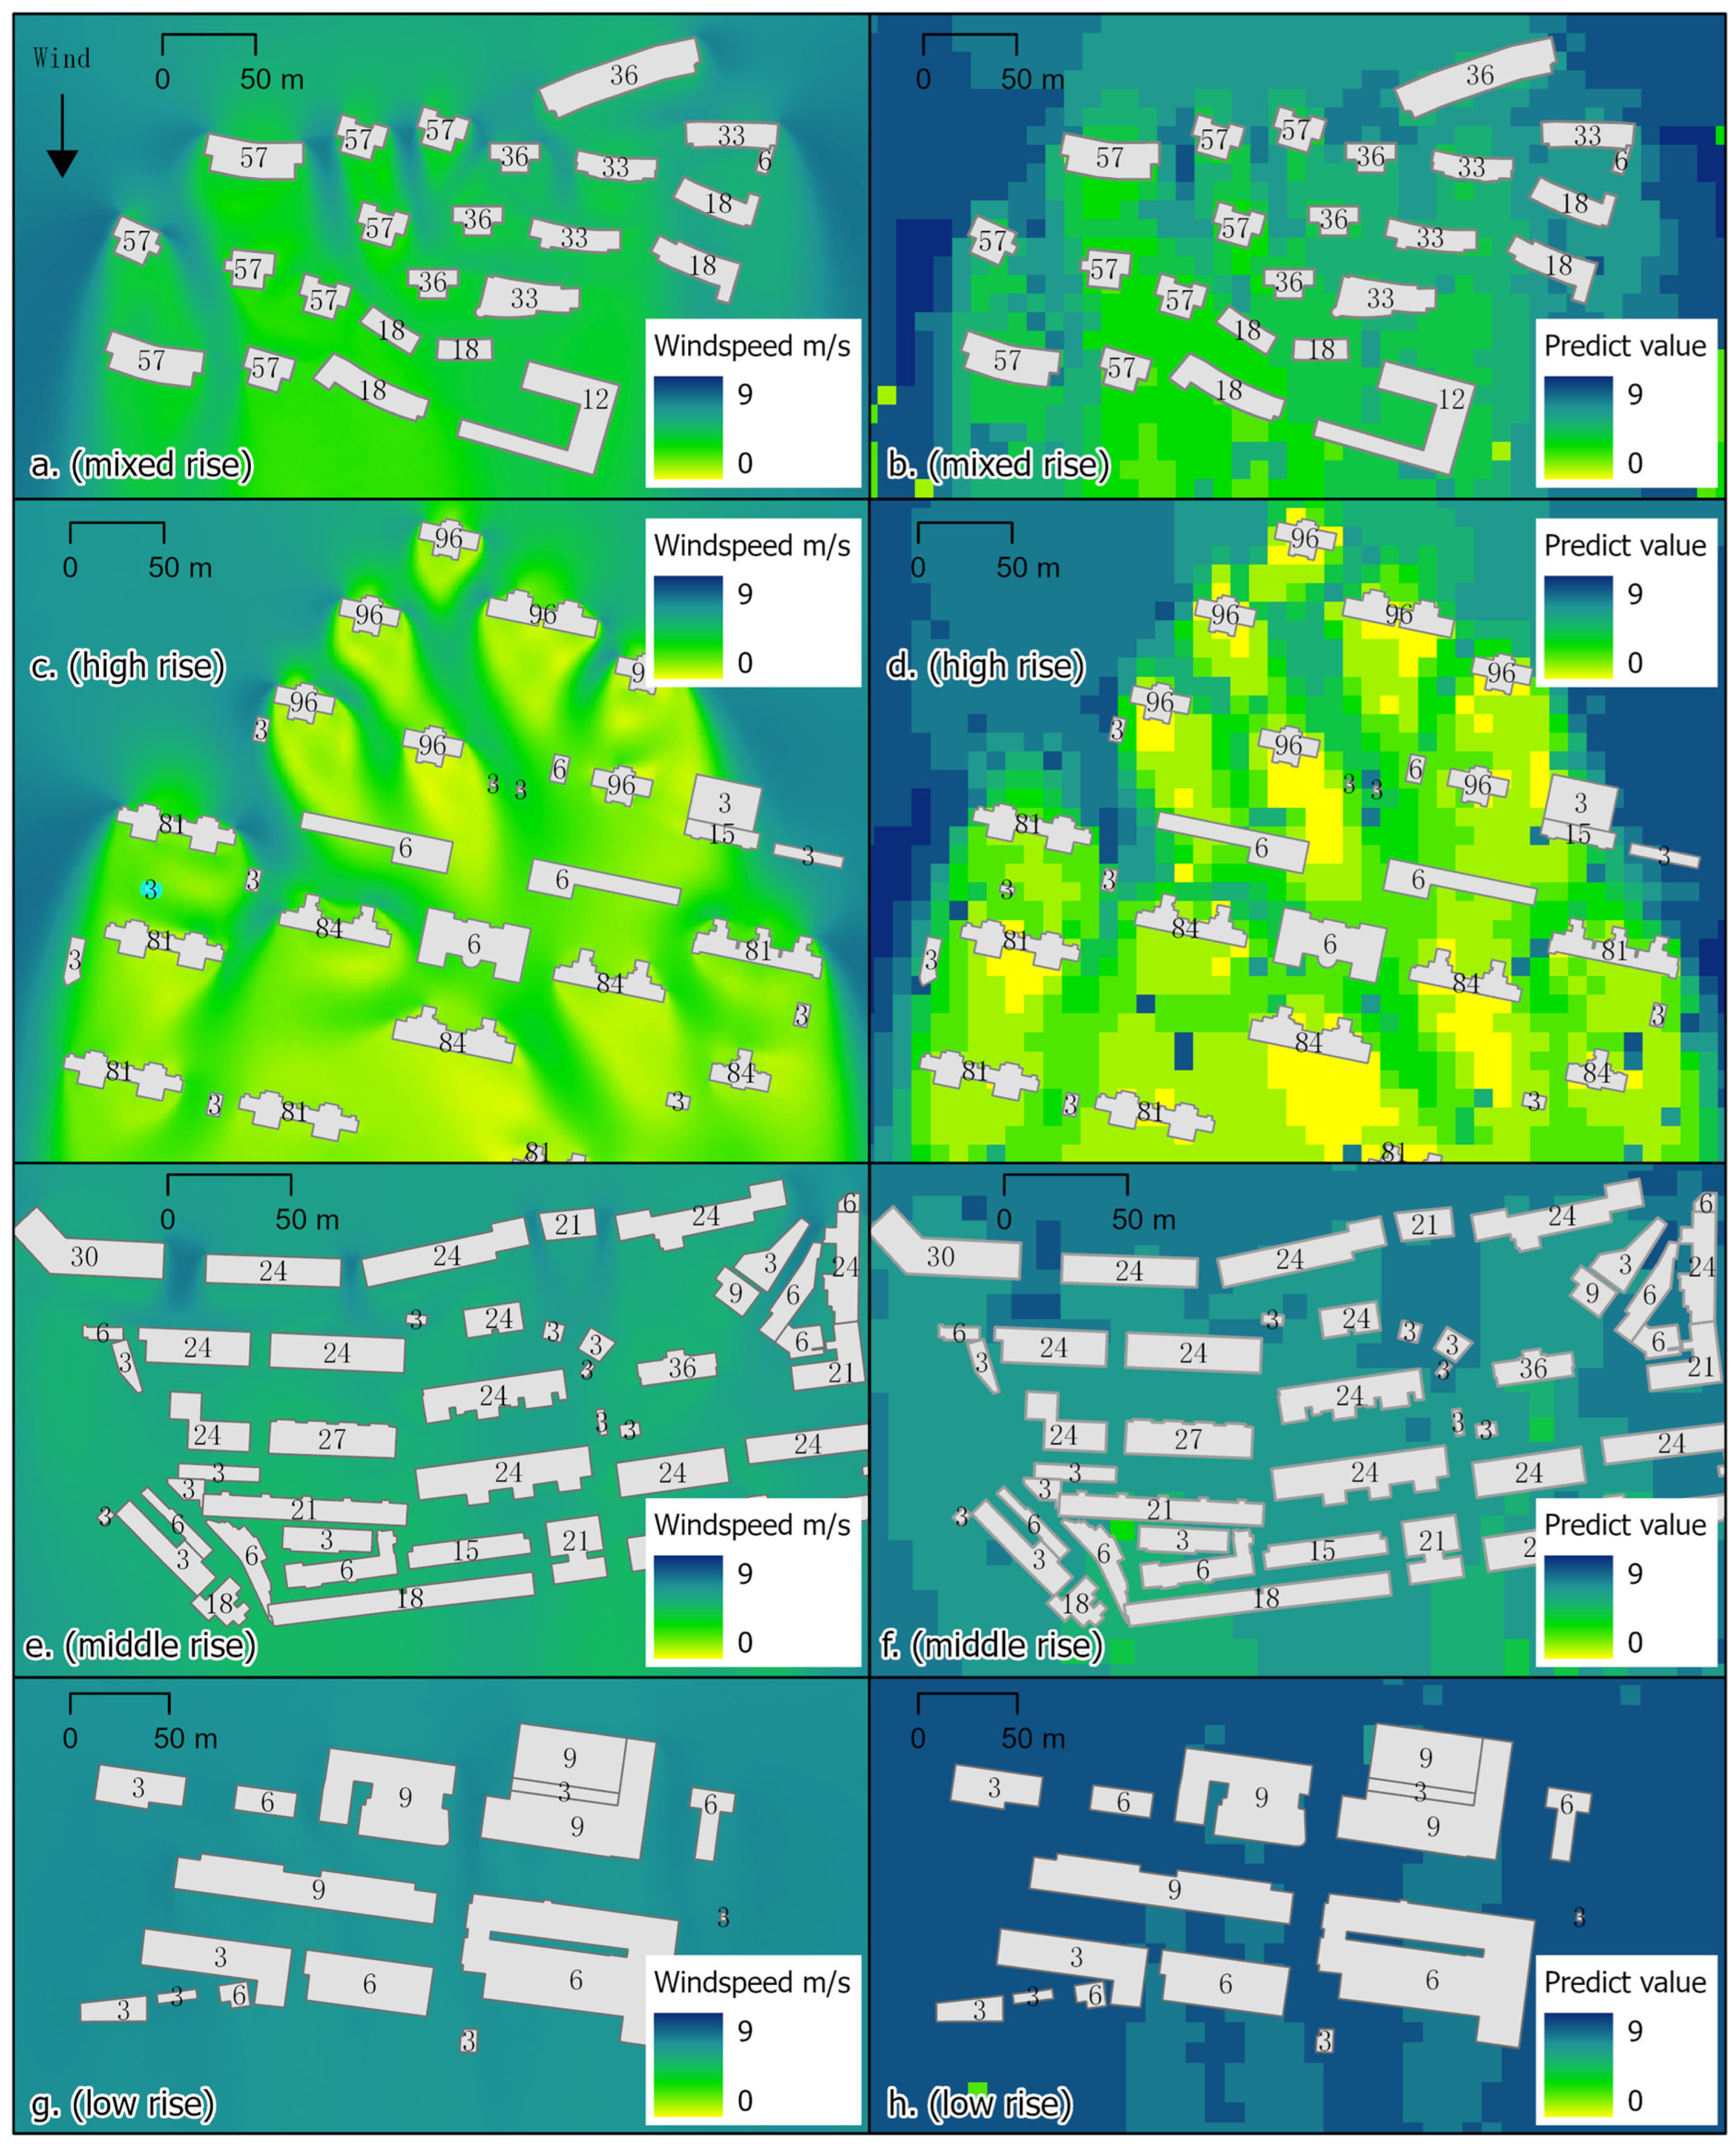
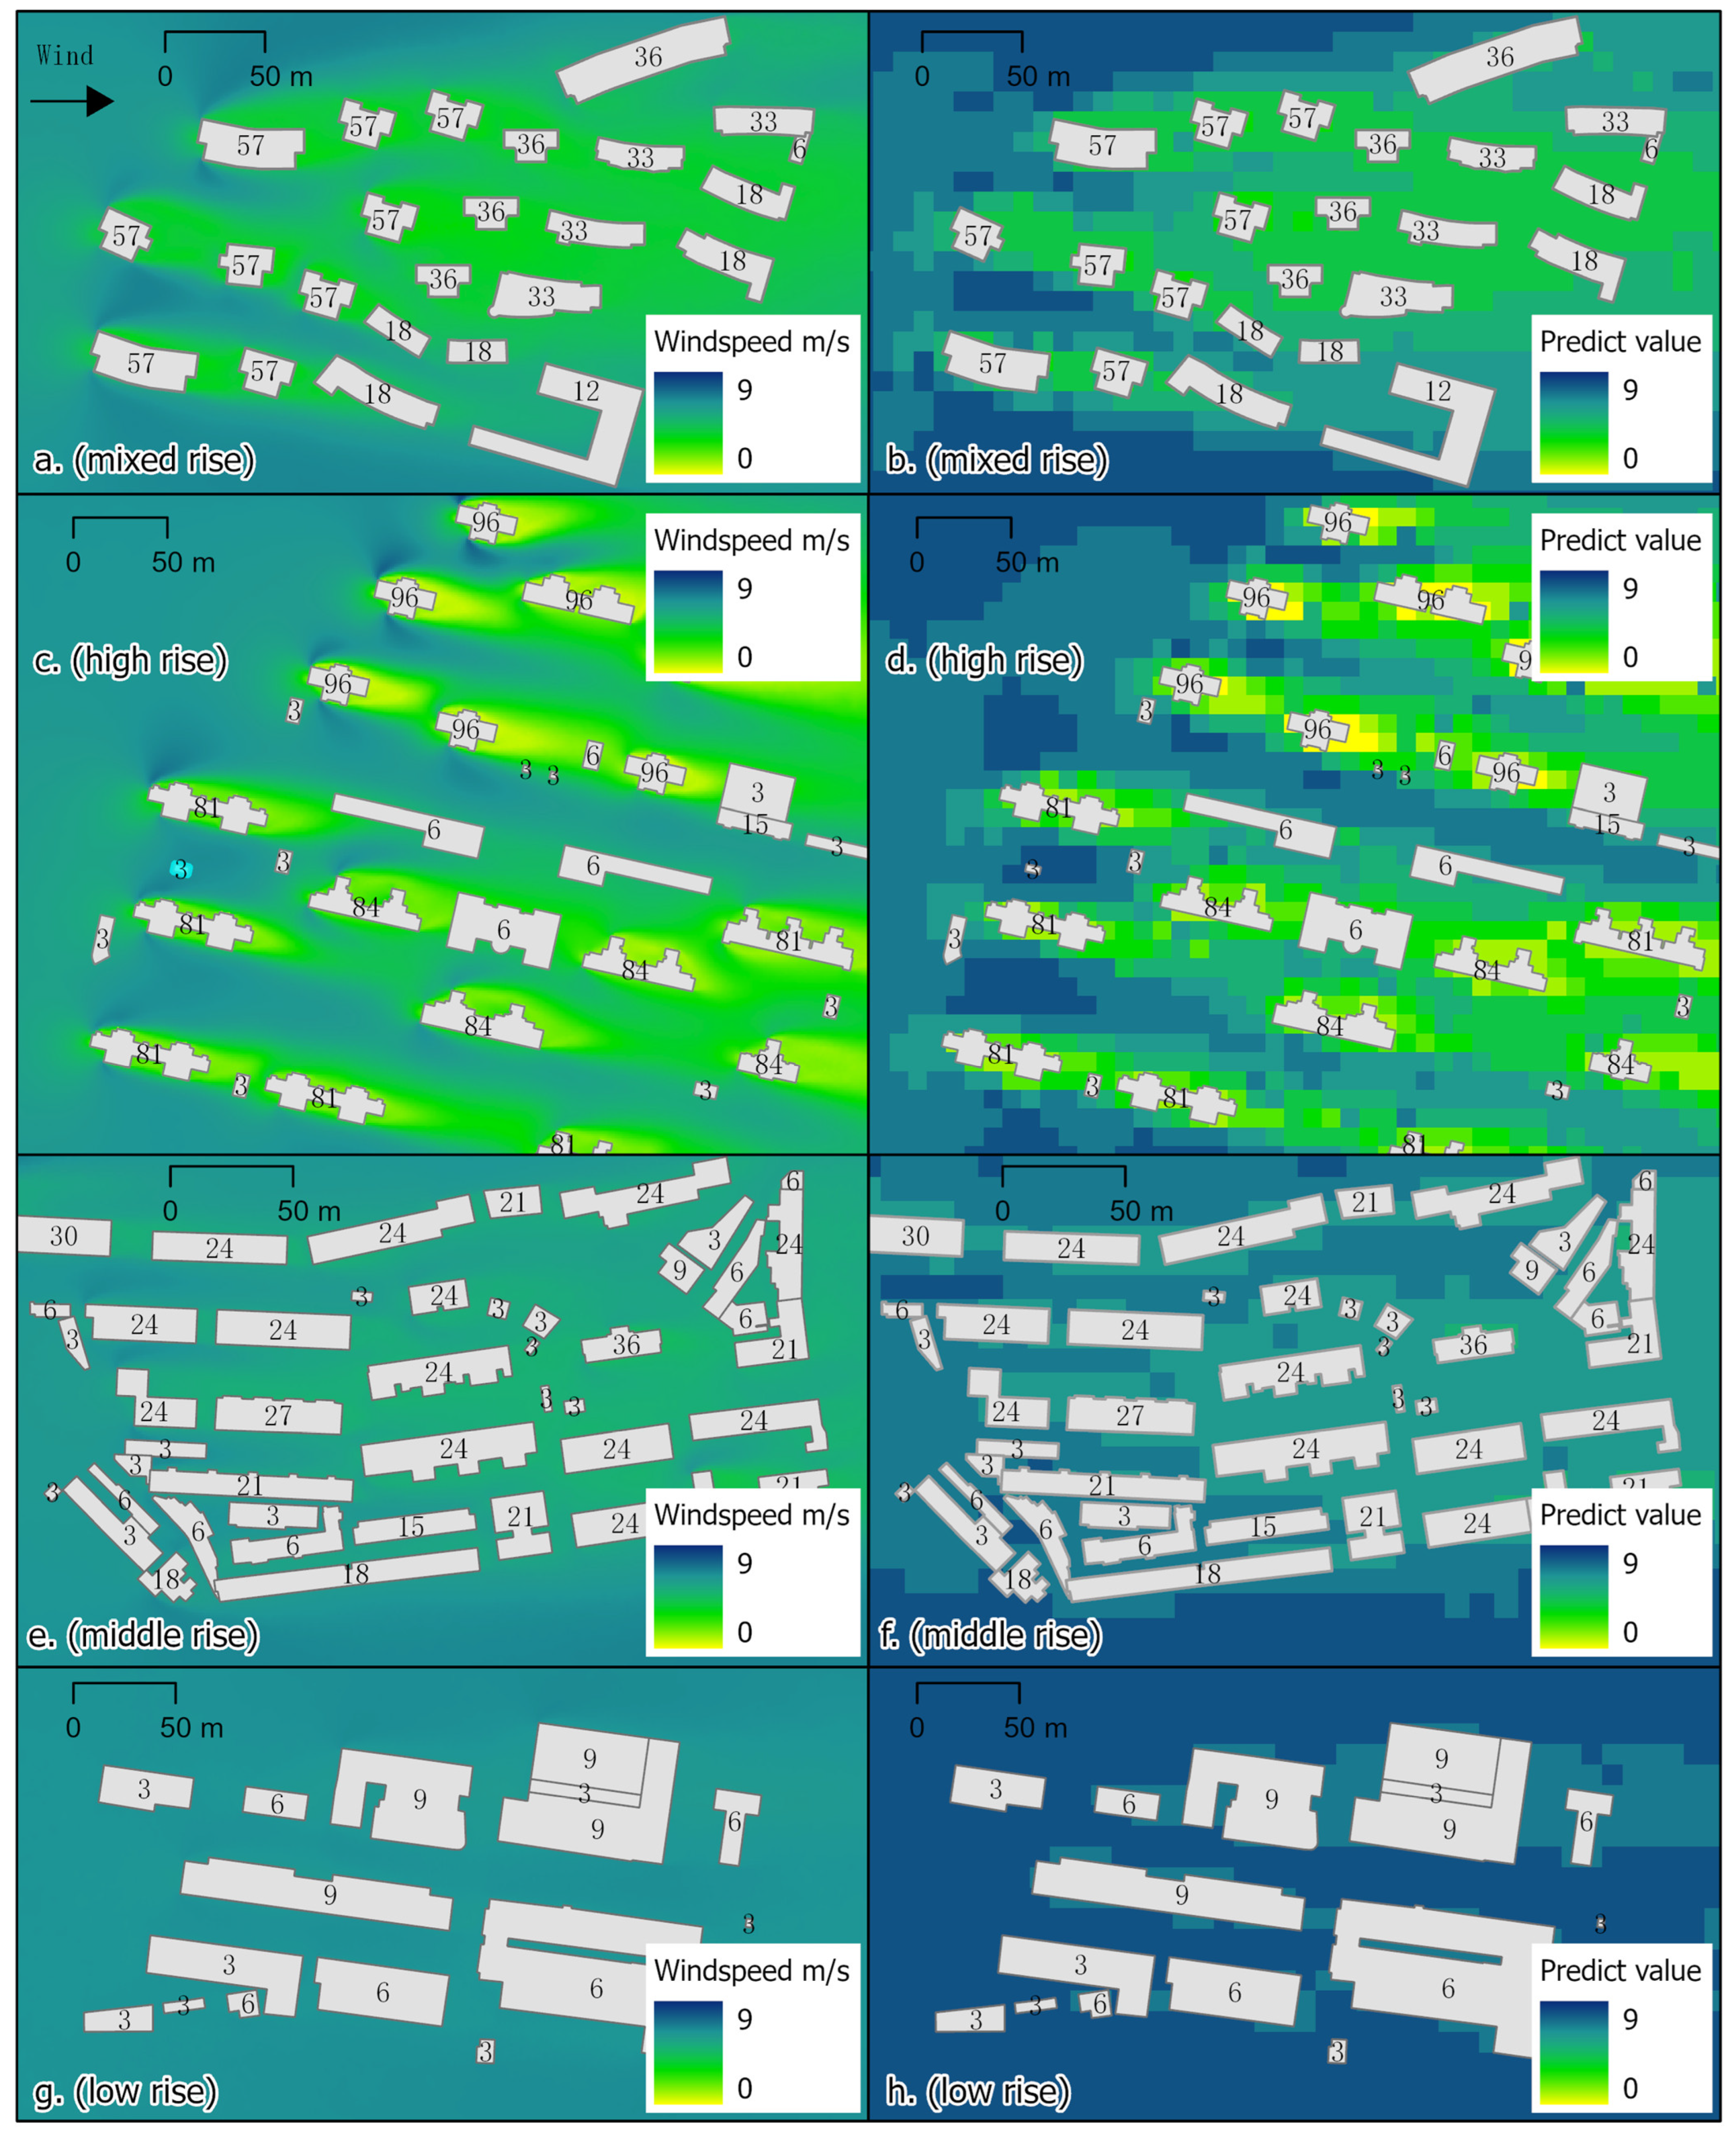
Figure 8 provide a comparative visualization of the CFD simulation results and the predictions from the trained random forest model. Specifically,
Figure 7a,c,e,g and
Figure 8a,c,e,g illustrate the spatial wind speed distributions obtained from CFD simulations under north and west wind conditions for the four building types. In these maps, blue regions indicate stronger winds, yellow represents weaker wind zones, and gray areas correspond to building footprints.
Figure 7b,d,f,h and
Figure 8b,d,f,h show the corresponding predictions generated by the random forest model under the same conditions. Overall, the predicted wind speed distributions exhibit a high degree of spatial consistency with the CFD results across all building configurations.
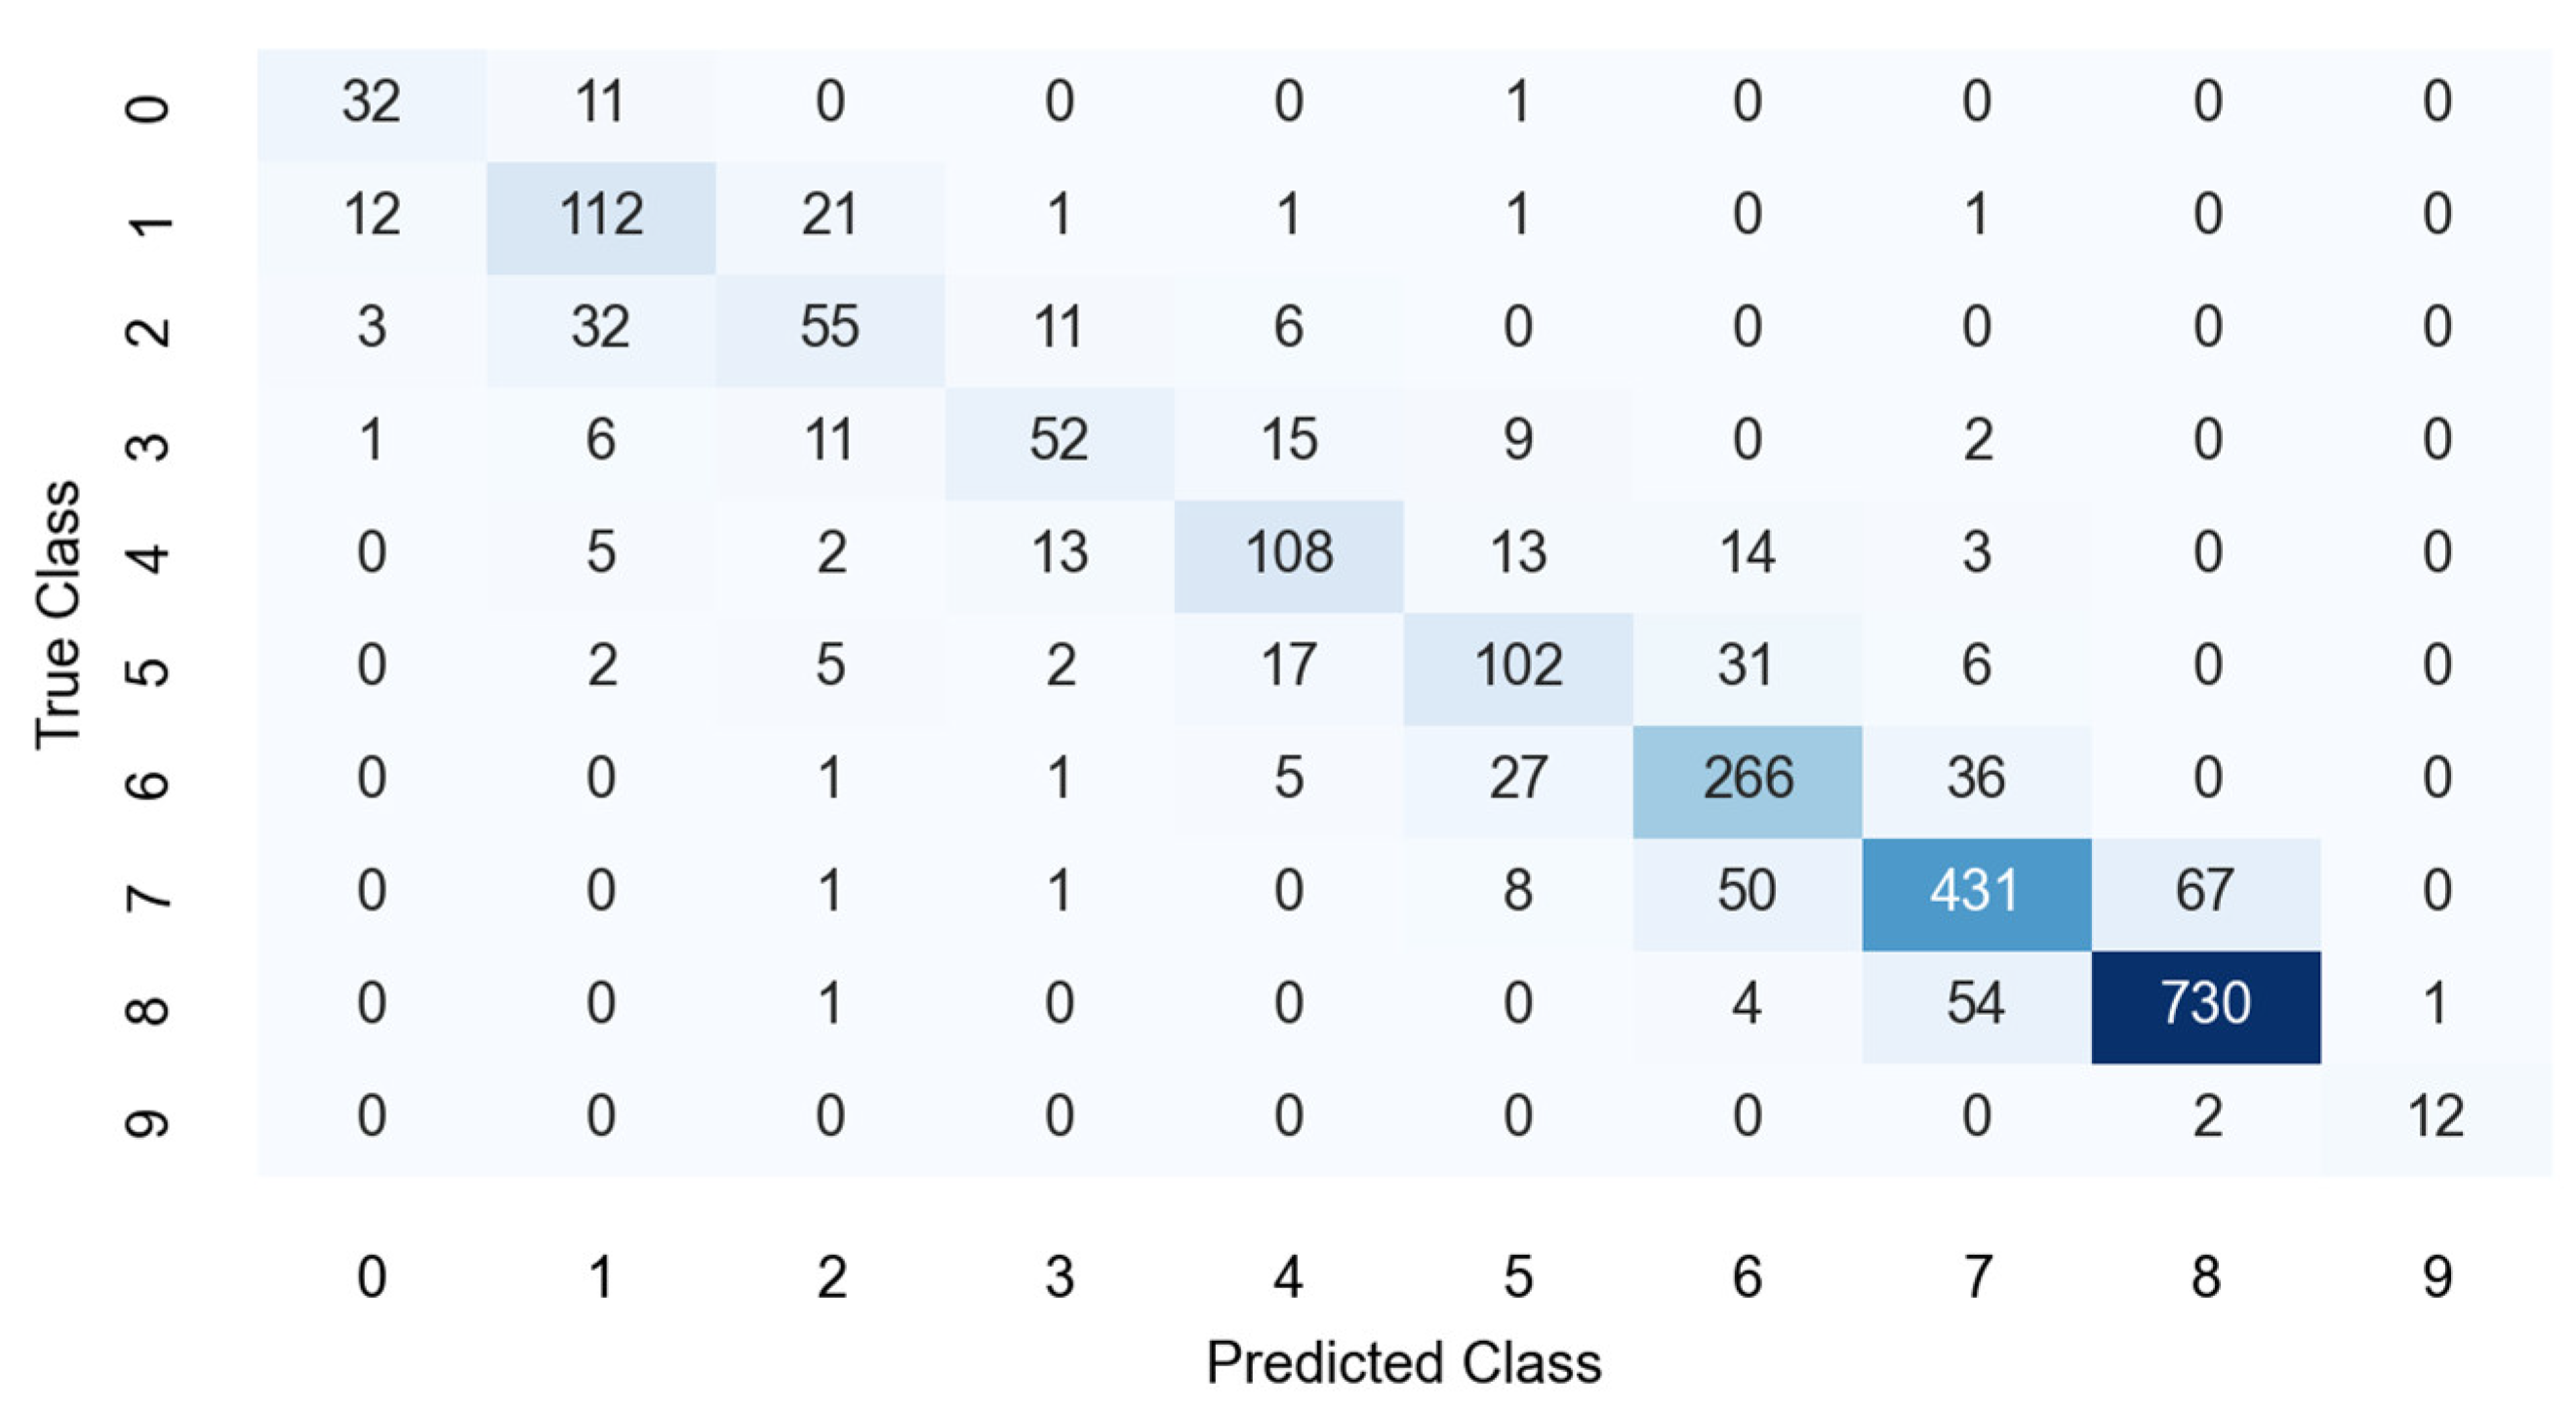
To evaluate the overall performance of the model in predicting wind speed classes, a confusion matrix was generated based on the combined results of eight test cases (
Figure 9). The mean squared error (MSE) was calculated alongside the proportions of predictions falling within different error margins. The results demonstrate that the model exhibits strong predictive accuracy and generalization ability, with an overall MSE of 0.441, indicating a small average deviation between the predicted and actual CFD wind speed classes. Specifically, 78.6% of the cells were predicted exactly correctly, 96.2% of the predictions were within ±1 class, and 98.9% were within ±2 classes. These results suggest that the model achieves not only high accuracy but also stable performance, with most prediction errors confined to a narrow range, underscoring its practical applicability.
Based on the above results, the random forest model—trained on LBM-derived features and their augmented variables—demonstrated strong predictive performance for wind speed classification in mixed-rise, high-rise, and mid-rise building scenarios. However, the model performed less accurately in the low-rise configuration. This reduced accuracy may be attributed to the limited wind speed variation in low-rise cases, where only two wind speed classes were present in the dataset. While further subdividing the wind speed intervals might improve model accuracy, the current bin width of 1 m/s is already relatively fine, and additional refinement would offer limited practical benefit. Moreover, the identification of urban ventilation corridors focuses not on the exact wind speed at individual points but rather on the overall airflow characteristics across broader areas. From this perspective, the use of 1 m/s wind speed intervals is considered appropriate for the purpose of this study.
3.2. Current Ventilation Corridors
In the LBM analysis, the simulation domain extends 4 km to both the north and south, and 1 km to the east and west, forming a rectangular area. The spatial resolution was set to 10 × 10 m, resulting in approximately 20 million analysis units. Boundary conditions were configured as follows: the northern boundary served as the inlet, the southern boundary was set as a free outlet, and periodic boundaries were applied to the east and west to ensure flow continuity within the domain. Given that the prevailing wind direction in Wuhan throughout the year is from the north, the trained random forest model was applied to predict wind speed distribution within the urban canopy under northerly wind conditions. The results are shown in
Figure 10. The findings indicate that the overall urban ventilation pattern is relatively favorable. In the visualization, blue regions correspond to areas with higher ventilation efficiency, whereas yellow regions represent areas with lower ventilation efficiency. The generally favorable ventilation conditions observed in Wuhan can be attributed to the widespread presence of natural water bodies, including the Yangtze River, Han River, and East Lake. These hydrological features facilitate the formation of multiple natural ventilation corridors, which enhance airflow within the urban environment.
The ventilation patterns among Wuhan’s three major urban districts exhibit notable differences. Hanyang, the smallest district with relatively late-stage urban development, features high-ventilation blue zones that effectively fragment the low-ventilation yellow obstruction zones into smaller patches. However, several large ventilation-obstructed areas remain. In contrast, Wuchang, the largest district, generally demonstrates favorable ventilation conditions, largely benefiting from the central positioning of East Lake, which enhances airflow and establishes a significant ventilation advantage. Nevertheless, the Guanggu (Optics Valley) area, a major development hub within Wuchang, exhibits significantly poorer ventilation compared to other parts of the district. Hankou, the most densely developed district, contains multiple ventilation corridors. However, due to their insufficient width and ventilation efficiency, large contiguous ventilation-obstructed zones persist despite the presence of these corridors. These spatial ventilation characteristics highlight the necessity of further optimizing the design of urban ventilation corridors in Wuhan’s city planning to improve the overall microclimatic conditions.
3.3. Spatial Distribution of Local Ventilation Advantages
By applying the neighborhood normalization method to analyze the LBM results (under north wind conditions), a spatial distribution map of local ventilation advantages in Wuhan was generated. In this visualization, blue areas represent regions with significant local ventilation advantages, while red areas indicate zones with local ventilation disadvantages. On a broader scale, the spatial distribution of local advantages, as illustrated in
Figure 11, aligns with the overall ventilation grading pattern shown in
Figure 10. However, at finer spatial resolutions, notable discrepancies emerge, highlighting the method’s capability to more accurately reveal the functional mechanisms of key ventilation corridors.
The analysis reveals distinct characteristics among major ventilation corridors, including the Yangtze River, Han River, and East Lake. Due to the extensive well-ventilated area surrounding East Lake, its local ventilation advantage is less pronounced. Along the Han River, where dense urbanization occurs on both banks, the entire waterway is identified as a critical ventilation corridor. Moreover, secondary ventilation corridors extending into the urban interior exhibit more pronounced local advantages, demonstrating their high significance. This method effectively identifies these key corridors, reinforcing their role in urban airflow regulation. The findings further emphasize the importance of local environmental factors in optimizing urban ventilation patterns, offering valuable insights for urban planning and microclimate improvement.
3.4. Spatial Distribution of Potential Ventilation Corridors
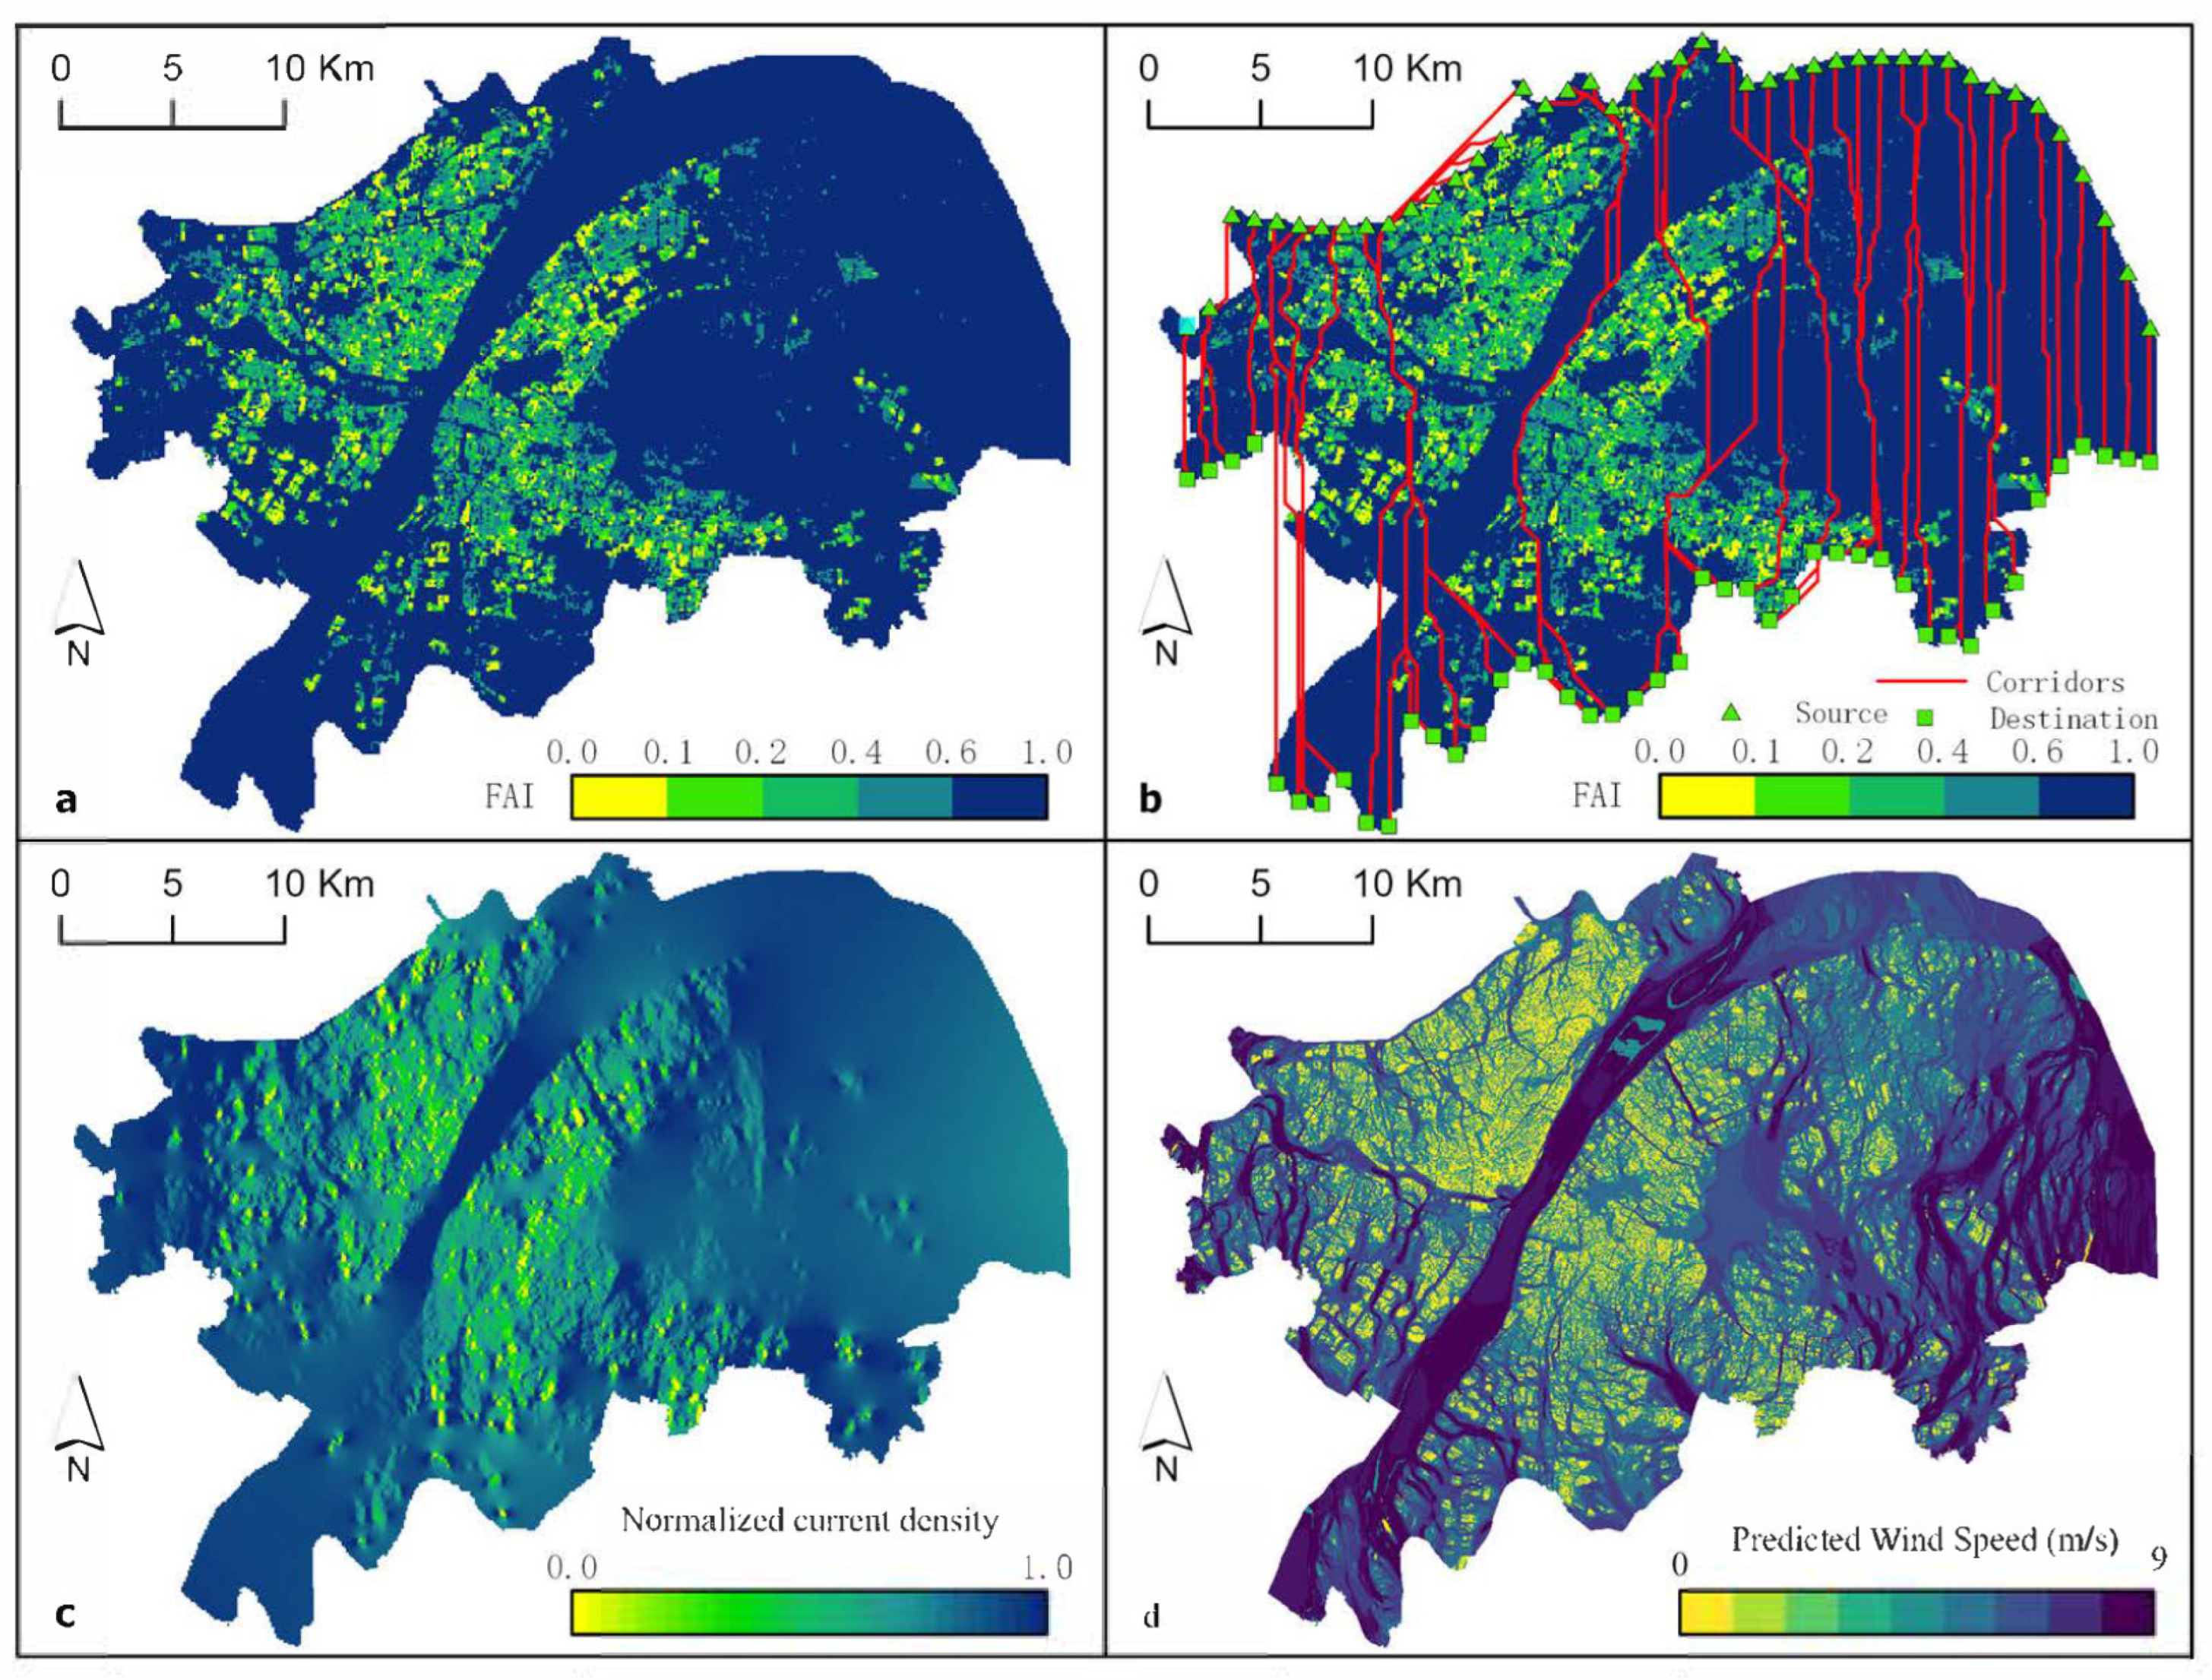
Figure 10 presents a comparative analysis of urban ventilation in the central area of Wuhan under northerly wind conditions, using three established morphology-based methods along with the proposed approach developed in this study. In the FAI-based method, building form indicators were calculated at a spatial resolution of 100 m. Thresholds of 0.1, 0.2, 0.4, and 0.6 were applied to classify the area into five levels of ventilation potential. The LCP method simulated airflow pathways by placing inlets and outlets at 1 km intervals along the northern and southern boundaries. The ventilation cost surface was derived from the FAI values, also at 100-m resolution, allowing for the identification of least-resistance wind corridors. The circuit model method treated the northern and southern boundaries as the positive and negative terminals of a circuit, modeling airflow as electrical conduction. It used conductance, rather than resistance, as the analytical basis, with values determined using a height threshold of h = 100 m. The method proposed in this study integrates LBM-derived airflow features and building morphological indicators within a machine learning framework. Trained using CFD-based wind speed data under northerly wind conditions, this approach enables the spatially continuous prediction of ventilation potential and provides results that are both data-driven and physically interpretable.
Although the spatial results of different methods exhibit a high degree of consistency, each approach presents distinct technical characteristics. As shown in
Figure 12a, the FAI-based classification effectively captures the spatial distribution of ventilation potential across the urban area. However, its adaptability to multi-directional wind conditions is relatively limited. The LCP method (
Figure 12b) can identify key primary ventilation corridors but lacks the ability to provide full spatial coverage. The circuit model approach (
Figure 12c), commonly used for urban ventilation analysis at 100 m resolution, relies on assumptions that diverge from actual airflow dynamics and therefore offers only a coarse approximation of ventilation patterns. In contrast, the method proposed in this study (
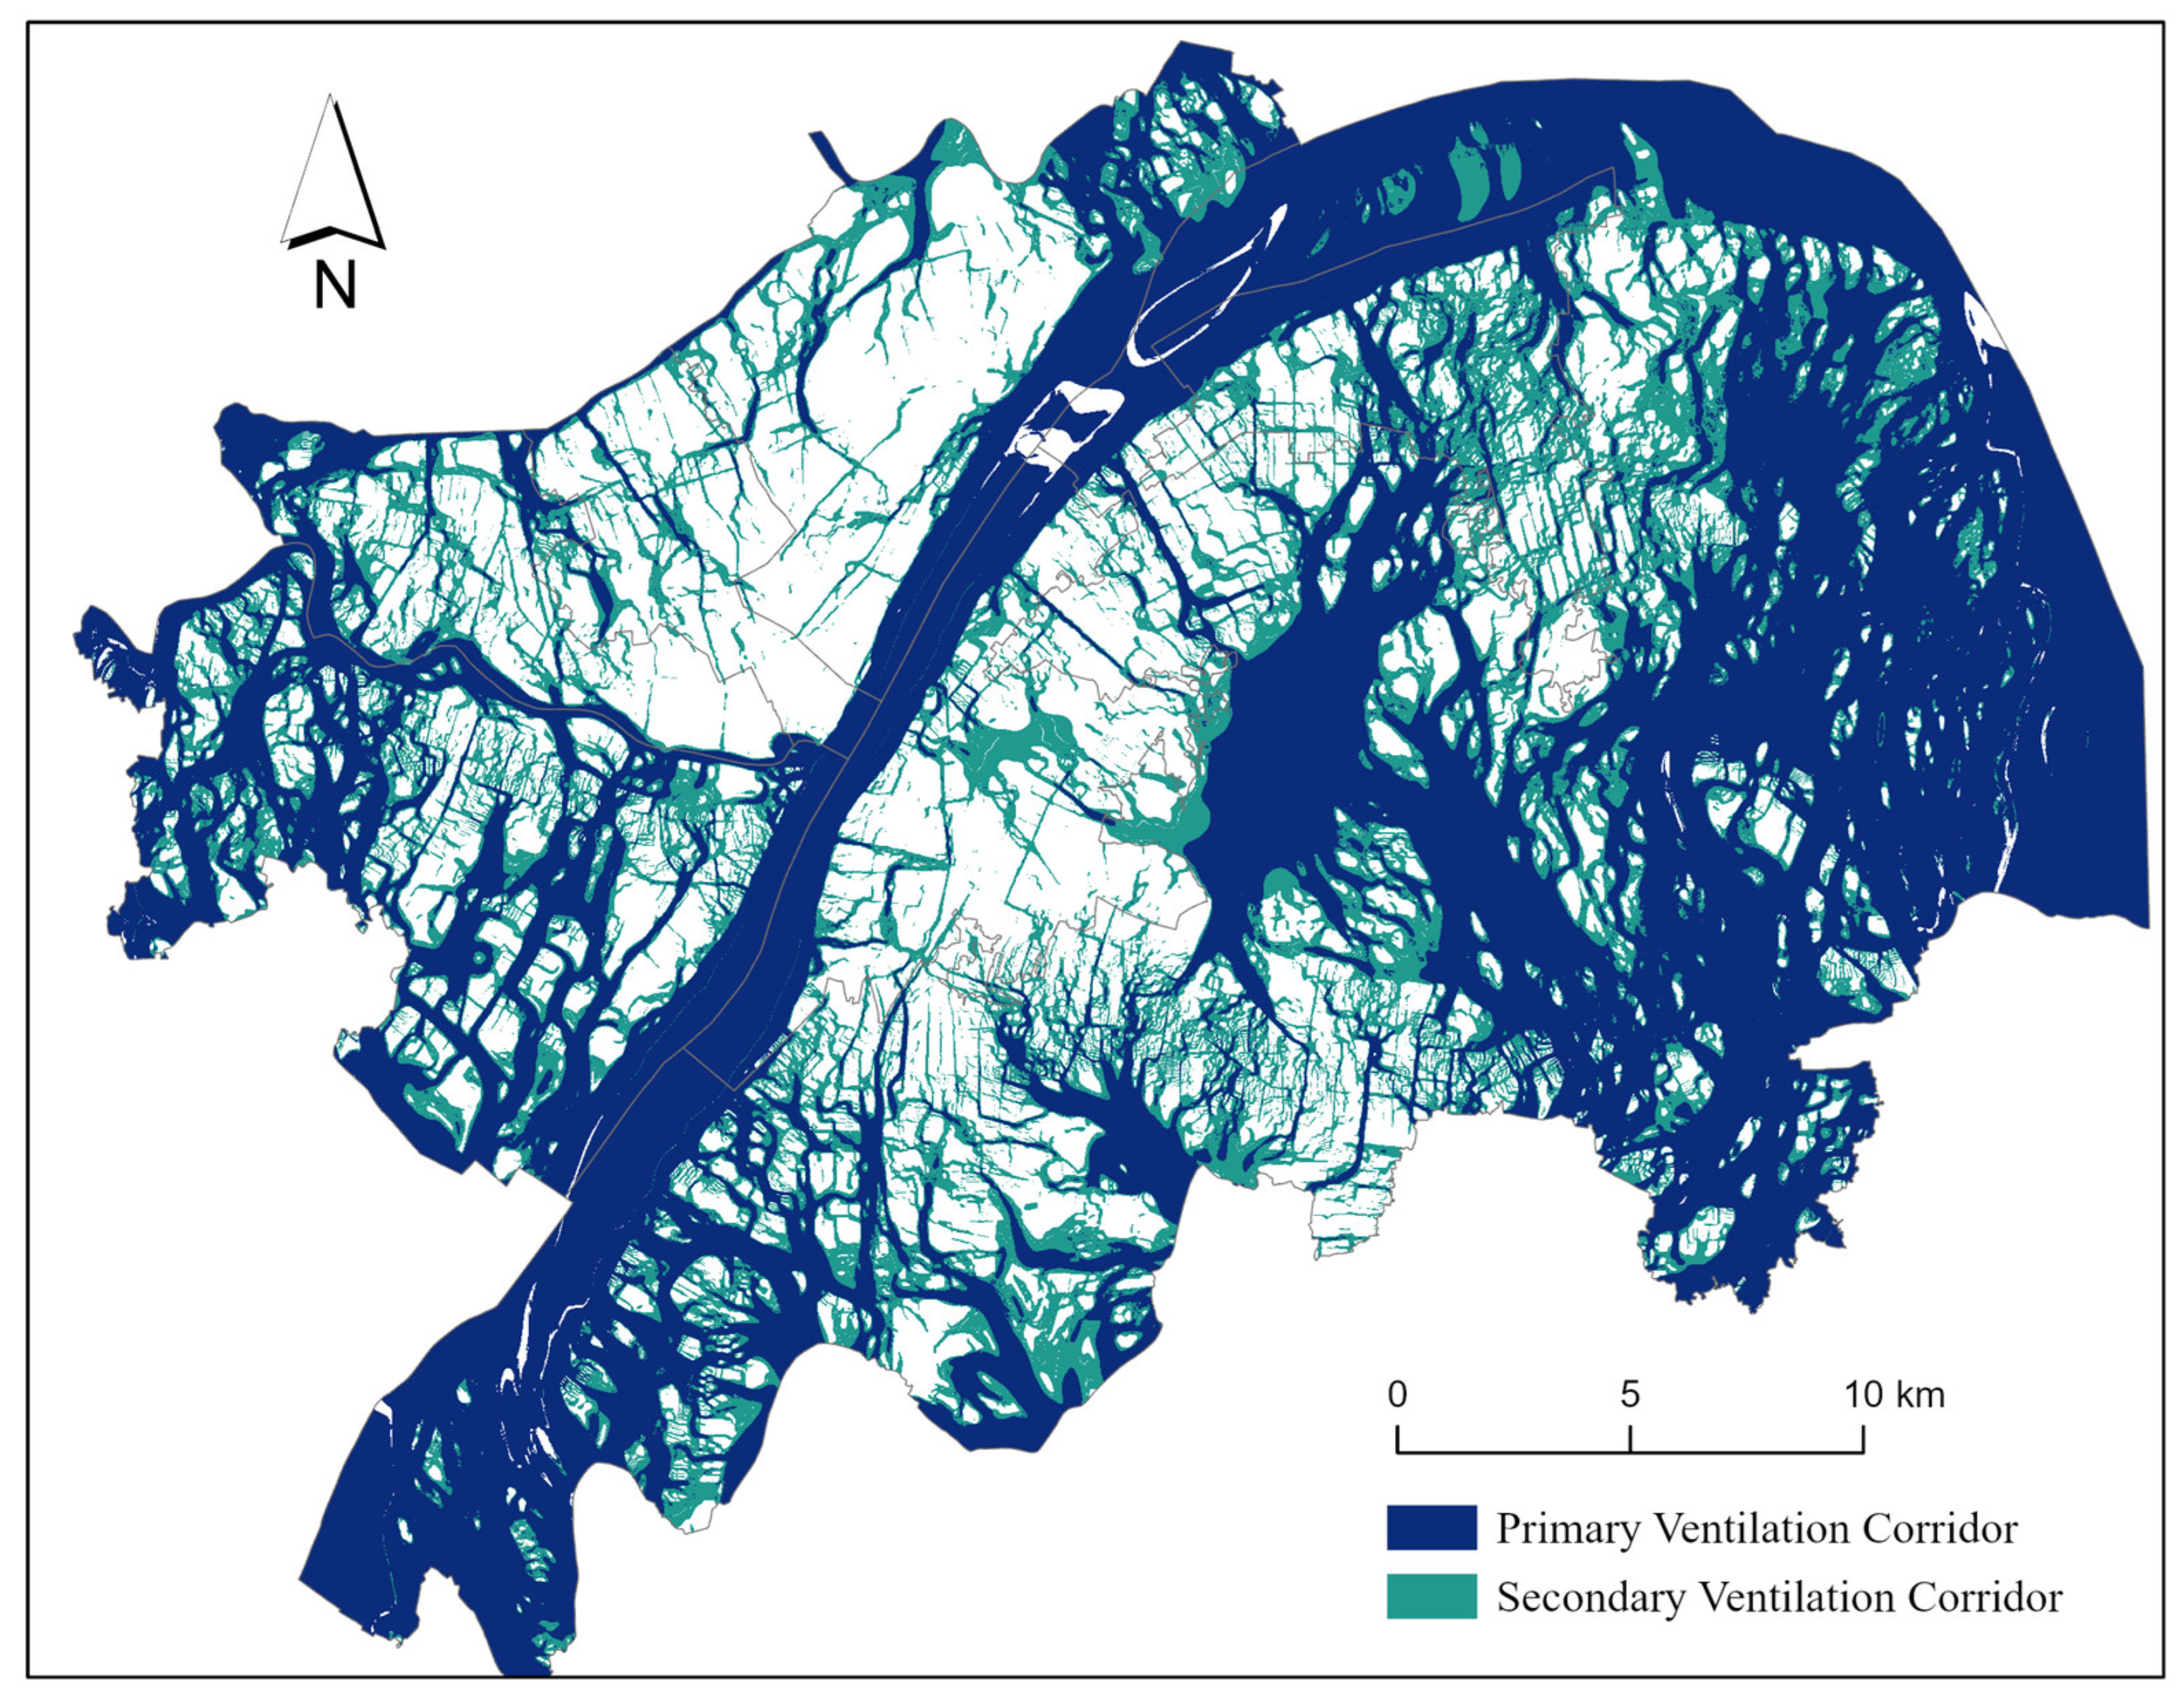
Figure 12d) enables high-resolution wind speed prediction at a 10 m scale and delivers more detailed characterization of ventilation corridors. Based on this, areas with wind speeds exceeding the background level by two or more classes are defined as primary ventilation corridors, while those exceeding by one class are designated as secondary ventilation corridors (
Figure 13). The results show that primary corridors are largely guided by major rivers and lakes, while secondary ones tend to align with main roads and smaller open spaces. Although other methods may suggest similar patterns at a general level, the proposed approach offers more precise spatial delineation and enhanced capability for capturing fine-scale ventilation structures.
4. Discussion
The design of urban ventilation corridors fundamentally aims to optimize the wind environment, thereby improving ventilation, mitigating the UHI effect, and enhancing thermal comfort and air quality. A key basis for such design is the spatial distribution of wind speed within the urban canopy under prevailing wind conditions. CFD is a widely used and powerful tool for ventilation analysis. It enables the high-resolution simulation of how buildings, terrain, surface characteristics, and heat sources interact to influence airflow, providing detailed outputs such as wind speed, pressure, and turbulence. As such, CFD plays a central role in urban climate design and microclimate assessment. However, its application requires complex model setup and substantial computing resources, challenges that are amplified in large-scale or multi-scenario analyses. In urban planning contexts that demand iterative design and dynamic adjustment, the high cost and limited efficiency of CFD often constrain its practical use for supporting timely and comprehensive ventilation optimization decisions.
Morphology-based analysis offers an efficient approach to evaluating urban ventilation performance by extracting spatial features of the built environment, such as building layouts, street networks, and green space distribution. In ventilation corridor identification, these methods typically begin by characterizing the three-dimensional geometric structure of urban canopies and then apply varying levels of simplification to airflow processes, leading to the development of several representative techniques. For instance, the FAI classification method assumes zero degrees of freedom in airflow direction and indirectly infers ventilation potential through correlations between morphological indicators and wind speed [
23]. The LCP method introduces a least-resistance flow assumption (with one degree of freedom) to identify principal ventilation paths [
27]. The circuit model further increases directional flexibility to four, simulating airflow distribution based on the inverse relationship between conductance and resistance across a continuous spatial network [
29,
30]. More recently, the adoption of the LBM has enabled airflow direction to be discretized into nine velocity vectors, significantly improving spatial resolution and directional fidelity [
31]. However, these approaches primarily approximate airflow distribution and lack the ability to predict wind speed values or establish direct quantitative links to real wind fields.
To address this gap, the present study employs a random forest machine learning model trained on LBM results and their augmented datasets, with CFD-derived wind speeds serving as target outputs. This framework establishes a predictive relationship between building morphology and wind speed distribution under prevailing wind conditions. The proposed method is applied to the urban canopy of Wuhan under northerly wind scenarios, generating high-resolution wind speed maps and extracting detailed ventilation corridors. Validation shows strong linear agreement between model predictions and CFD results in mixed-rise, high-rise, and mid-rise building configurations, confirming the effectiveness of the approach. In the low-rise scenario, predictive accuracy is comparatively limited, largely due to minimal wind speed variation, with most samples concentrated within the same wind class. Nevertheless, urban ventilation planning emphasizes the spatial distribution of airflow capacity over precise pointwise wind speed values. Thus, although finer wind speed classification could marginally improve accuracy for low-rise areas, its overall impact on corridor identification remains limited. In summary, the proposed method achieves a favorable balance between prediction accuracy and computational efficiency. It approximates CFD-level outputs while significantly reducing processing time, offering a scientifically grounded and operationally practical solution for urban ventilation corridor identification.
Although the proposed method demonstrates significant advantages in identifying potential ventilation corridors, it also has certain limitations. First, the approach is highly dependent on the quality and accuracy of LBM wind field simulation data. If the simulation data fail to accurately represent the actual urban wind field characteristics—due, for instance, to inappropriate model parameter settings or improper handling of boundary conditions—this may introduce biases in the classification of ventilation grades and the identification of local ventilation advantages. In addition, the urban canopy data used in this study primarily focused on building footprints, while the potential influences of vegetation, topography, and other land use types on urban ventilation were not considered. Incorporating a broader range of surface features into the resistance modeling process would allow for a more realistic representation of the underlying surface conditions, thereby improving the accuracy and reliability of urban ventilation corridor design. Furthermore, the spatial weights in the neighborhood normalization process were heuristically assigned as the inverse of the number of neighboring grid cells. This limitation could be addressed in future studies by optimizing the weights through data-driven calibration methods—such as least squares fitting—based on high-resolution climate model outputs [
24]. Addressing these limitations could significantly enhance the robustness and generalizability of the proposed framework.
5. Conclusions
This study presents an integrated framework for urban ventilation corridor identification that combines Lattice Boltzmann Method (LBM) simulations, neighborhood-based normalization, and a random forest machine learning model. The proposed approach enables the high-resolution prediction of wind speed distribution based solely on urban morphological parameters, offering a computationally efficient alternative to traditional CFD methods for city-scale ventilation analysis. Key findings include the following:
(1) The proposed method successfully establishes a predictive relationship between urban morphological characteristics and wind speed distribution under prevailing wind conditions, demonstrating strong potential for rapid and scalable urban wind environment assessment.
(2) The identified ventilation corridors exhibit distinct spatial patterns: primary corridors are primarily aligned with large rivers and lakes, serving as dominant airflow pathways, while secondary corridors are shaped by arterial road networks and small-scale open spaces, contributing to localized airflow enhancement and spatial continuity.
Despite its strengths, the method has certain limitations. Its predictive accuracy depends on the quality of LBM-simulated wind fields, which may be affected by parameter settings and boundary condition configurations.
Future work may enhance the robustness and applicability of the framework by incorporating additional surface features—such as vegetation, topography, and land cover—into resistance modeling. This would allow for a more comprehensive representation of the urban environment and support the more precise design of both primary and secondary ventilation corridors. In addition, the calibration of spatial weights in the neighborhood normalization process through data-driven methods could further improve the accuracy of local ventilation assessments.
Author Contributions
Conceptualization, methodology, software, validation, formal analysis, investigation, resources, data curation, writing—original draft preparation, visualization, project administration, funding acquisition, Bu Yu and Peng Xie; writing—review and editing, Peng Xie; supervision, Bu Yu. All authors have read and agreed to the published version of the manuscript.
Funding
This research was funded by the National Natural Science Foundation of China Youth Program, grant number 42201466, the Shandong Province Natural Science Foundation Youth Branch, grant number ZR2021QD078, the National Science Foundation of China (42475038), Key Laboratory of Urban Meteorology, China Meteorological Administration (LUM-2024-18), and Hangzhou Urban Meteorological Joint Laboratory (SYSZD202502).
Data Availability Statement
Data available on request due to restrictions.
Conflicts of Interest
The authors declare no conflicts of interest.
References
- Ng, E. Policies and Technical Guidelines for Urban Planning of High-Density Cities—Air Ventilation Assessment (AVA) of Hong Kong. Build. Environ. 2009, 44, 1478–1488. [Google Scholar] [CrossRef]
- Yim, S.H.L.; Fung, J.C.H.; Ng, E.Y.Y. An Assessment Indicator for Air Ventilation and Pollutant Dispersion Potential in an Urban Canopy with Complex Natural Terrain and Significant Wind Variations. Atmos. Environ. 2014, 94, 297–306. [Google Scholar] [CrossRef]
- Liu, Y.; Xu, Y.; Zhang, F.; Shu, W. A Preliminary Study on the Influence of Beijing Urban Spatial Morphology on Near-Surface Wind Speed. Urban Clim. 2020, 34, 100703. [Google Scholar] [CrossRef]
- Li, Q.; Zheng, J.; Yuan, S.; Zhang, L.; Dong, R.; Fu, H. RAV Model: Study on Urban Refined Climate Environment Assessment and Ventilation Corridors Construction. Build. Environ. 2024, 248, 111080. [Google Scholar] [CrossRef]
- Ying, S.; Wang, M.; Zhang, W.; Sun, H.; Li, C. City-Scale Ventilation Analysis Using 3D Buildings with Guangzhou Case. Urban Clim. 2023, 49, 101471. [Google Scholar] [CrossRef]
- He, B.-J.; Ding, L.; Prasad, D. Relationships among Local-Scale Urban Morphology, Urban Ventilation, Urban Heat Island and Outdoor Thermal Comfort under Sea Breeze Influence. Sustain. Cities Soc. 2020, 60, 102289. [Google Scholar] [CrossRef]
- Gu, K.; Fang, Y.; Qian, Z.; Sun, Z.; Wang, A. Spatial Planning for Urban Ventilation Corridors by Urban Climatology. Ecosyst. Health Sustain. 2020, 6, 1747946. [Google Scholar] [CrossRef]
- Xue, J.; You, R.; Liu, W.; Chen, C.; Lai, D. Applications of Local Climate Zone Classification Scheme to Improve Urban Sustainability: A Bibliometric Review. Sustainability 2020, 12, 8083. [Google Scholar] [CrossRef]
- Palusci, O.; Cecere, C. Urban Ventilation in the Compact City: A Critical Review and a Multidisciplinary Methodology for Improving Sustainability and Resilience in Urban Areas. Sustainability 2022, 14, 3948. [Google Scholar] [CrossRef]
- Liu, X.; Huang, B.; Li, R.; Zhang, J.; Gou, Q.; Zhou, T.; Huang, Z. Wind Environment Assessment and Planning of Urban Natural Ventilation Corridors Using GIS: Shenzhen as a Case Study. Urban Clim. 2022, 42, 101091. [Google Scholar] [CrossRef]
- Fang, Y.; Gu, K.; Qian, Z.; Sun, Z.; Wang, Y.; Wang, A. Performance Evaluation on Multi-Scenario Urban Ventilation Corridors Based on Least Cost Path. J. Urban Manag. 2021, 10, 3–15. [Google Scholar] [CrossRef]
- He, B.-J. Urban Morphology, Urban Ventilation and Urban Heat Island Mitigation: A Methodological Framework. In Climate Change and Environmental Sustainability; He, B.-J., Prasad, D., Pignatta, G., Jupesta, J., Eds.; Advances in Science, Technology & Innovation; Springer International Publishing: Cham, Switzerland, 2022; pp. 131–136. ISBN 978-3-031-12014-5. [Google Scholar]
- Qin, H.; Lin, P.; Lau, S.S.Y.; Song, D. Influence of Site and Tower Types on Urban Natural Ventilation Performance in High-Rise High-Density Urban Environment. Build. Environ. 2020, 179, 106960. [Google Scholar] [CrossRef]
- Ren, C.; Yang, R.; Cheng, C.; Xing, P.; Fang, X.; Zhang, S.; Wang, H.; Shi, Y.; Zhang, X.; Kwok, Y.T.; et al. Creating Breathing Cities by Adopting Urban Ventilation Assessment and Wind Corridor Plan—The Implementation in Chinese Cities. J. Wind Eng. Ind. Aerodyn. 2018, 182, 170–188. [Google Scholar] [CrossRef]
- He, Y.; Wong, C.H.M.; Deng, J.; Liu, Z.; Ng, E. Designing Breezeways to Enhance Wind Environments in High-Density Cities: A Comprehensive Analysis of Ten Morphological Parameters. Sustain. Cities Soc. 2024, 116, 105898. [Google Scholar] [CrossRef]
- Fang, Y.; Zhao, L. Assessing the Environmental Benefits of Urban Ventilation Corridors: A Case Study in Hefei, China. Build. Environ. 2022, 212, 108810. [Google Scholar] [CrossRef]
- Luo, X.; Yang, J.; Sun, W.; He, B. Suitability of Human Settlements in Mountainous Areas from the Perspective of Ventilation: A Case Study of the Main Urban Area of Chongqing. J. Clean. Prod. 2021, 310, 127467. [Google Scholar] [CrossRef]
- He, B.-J.; Ding, L.; Prasad, D. Urban Ventilation and Its Potential for Local Warming Mitigation: A Field Experiment in an Open Low-Rise Gridiron Precinct. Sustain. Cities Soc. 2020, 55, 102028. [Google Scholar] [CrossRef]
- Sha, C.; Wang, X.; Lin, Y.; Fan, Y.; Chen, X.; Hang, J. The Impact of Urban Open Space and ‘Lift-up’ Building Design on Building Intake Fraction and Daily Pollutant Exposure in Idealized Urban Models. Sci. Total Environ. 2018, 633, 1314–1328. [Google Scholar] [CrossRef]
- Wehrle, J.; Jung, C.; Giometto, M.; Christen, A.; Schindler, D. Introducing New Morphometric Parameters to Improve Urban Canopy Air Flow Modeling: A CFD to Machine-Learning Study in Real Urban Environments. Urban Clim. 2024, 58, 102173. [Google Scholar] [CrossRef]
- Wang, W.; Xu, Y.; Ng, E. Large-Eddy Simulations of Pedestrian-Level Ventilation for Assessing a Satellite-Based Approach to Urban Geometry Generation. Graph. Models 2018, 95, 29–41. [Google Scholar] [CrossRef]
- Kurppa, M.; Hellsten, A.; Auvinen, M.; Raasch, S.; Vesala, T.; Järvi, L. Ventilation and Air Quality in City Blocks Using Large-Eddy Simulation—Urban Planning Perspective. Atmosphere 2018, 9, 65. [Google Scholar] [CrossRef]
- Yuan, C.; Ren, C.; Ng, E. GIS-Based Surface Roughness Evaluation in the Urban Planning System to Improve the Wind Environment—A Study in Wuhan, China. Urban Clim. 2014, 10, 585–593. [Google Scholar] [CrossRef]
- Nevat, I.; Adelia, A.S. Urban Wind Corridors Analysis via Network Theory. Atmosphere 2023, 14, 572. [Google Scholar] [CrossRef]
- Suder, A.; Szymanowski, M. Determination of Ventilation Channels in Urban Area: A Case Study of Wrocław (Poland). Pure Appl. Geophys. 2014, 171, 965–975. [Google Scholar] [CrossRef]
- Gál, T.; Unger, J. Detection of Ventilation Paths Using High-Resolution Roughness Parameter Mapping in a Large Urban Area. Build. Environ. 2009, 44, 198–206. [Google Scholar] [CrossRef]
- Wong, M.S.; Nichol, J.E.; To, P.H.; Wang, J. A Simple Method for Designation of Urban Ventilation Corridors and Its Application to Urban Heat Island Analysis. Build. Environ. 2010, 45, 1880–1889. [Google Scholar] [CrossRef]
- Qiao, Z.; Xu, X.; Wu, F.; Luo, W.; Wang, F.; Liu, L.; Sun, Z. Urban Ventilation Network Model: A Case Study of the Core Zone of Capital Function in Beijing Metropolitan Area. J. Clean. Prod. 2017, 168, 526–535. [Google Scholar] [CrossRef]
- Xie, P.; Yang, J.; Wang, H.; Liu, Y.; Liu, Y. A New Method of Simulating Urban Ventilation Corridors Using Circuit Theory. Sustain. Cities Soc. 2020, 59, 102162. [Google Scholar] [CrossRef]
- Xie, P.; Yang, J.; Sun, W.; Xiao, X.; Cecilia Xia, J. Urban Scale Ventilation Analysis Based on Neighborhood Normalized Current Model. Sustain. Cities Soc. 2022, 80, 103746. [Google Scholar] [CrossRef]
- Li, T.; Xie, P. A New Method Based on Lattice Boltzmann Method and Unsupervised Clustering for Identification of Urban-Scale Ventilation Corridors. Int. J. Geo-Inf. 2024, 13, 183. [Google Scholar] [CrossRef]
- Liu, P.; Chen, G.-F. Porous Materials: Processing and Applications; Elsevier Butterworth-Heinemann: Oxford, UK, 2014; ISBN 978-0-12-407788-1. [Google Scholar]
- Zhan, Q.; Fan, Y.; Xiao, Y.; Ouyang, W.; Yue, Y.; Lan, Y. Urban Wind Path Planning Based on Meteorological and Remote Sensing Data and GIS-Based Ventilation Analysis. In Big Data Support of Urban Planning and Management: The Experience in China; Shen, Z., Li, M., Eds.; Springer International Publishing: Cham, Switzerland, 2018; pp. 415–433. ISBN 978-3-319-51929-6. [Google Scholar]
- Yin, J.; Zhan, Q. Research on the correlation between urban ventilation and morphology: A case study of Wuhan City. Environ. Prot. 2016, 44, 59–63. [Google Scholar] [CrossRef]
Figure 1.
A machine learning framework for urban ventilation corridor identification.
Figure 1.
A machine learning framework for urban ventilation corridor identification.
Figure 2.
The illustration of urban canopy porosity.
Figure 2.
The illustration of urban canopy porosity.
Figure 3.
Schematic of the classic Lattice Boltzmann Model.
Figure 3.
Schematic of the classic Lattice Boltzmann Model.
Figure 4.
CFD validation setups for realistic urban buildings.
Figure 4.
CFD validation setups for realistic urban buildings.
Figure 6.
Correlation and regression analysis between random forest predictions and CFD results under northerly and westerly wind conditions. Subfigures (a,c,e,g) show the relationship between reference wind speed and predicted wind speed under northerly wind conditions for mixed-rise, high-rise, medium-rise, and low-rise building clusters, respectively. Subfigures (b,d,f,h) show the relationship between reference wind speed and predicted wind speed under westerly wind conditions for mixed-rise, high-rise, medium-rise, and low-rise building clusters, respectively.
Figure 7.
Comparison between the random forest predictions and CFD methods under northerly wind conditions. Subfigures (a,c,e,g) represent the CFD simulation results under the northerly wind condition for mixed-rise, high-rise, medium-rise, and low-rise building clusters, respectively. Subfigures (b,d,f,h) represent the predicted wind speeds under the northerly wind condition for mixed-rise, high-rise, medium-rise, and low-rise building clusters, respectively. The numbers on the building footprints indicate building heights, in meters.
Figure 8.
Comparison between the random forest predictions and CFD methods under westerly wind conditions.Subfigures (a,c,e,g) represent the CFD simulation results under the westerly wind condition for mixed-rise, high-rise, medium-rise, and low-rise building clusters, respectively. Subfigures (b,d,f,h) represent the predicted wind speeds under the westerly wind condition for mixed-rise, high-rise, medium-rise, and low-rise building clusters, respectively. The numbers on the building footprints indicate building heights, in meters.
Figure 9.
Confusion matrix of predicted versus CFD-simulated wind speed classes aggregated across eight test cases.
Figure 9.
Confusion matrix of predicted versus CFD-simulated wind speed classes aggregated across eight test cases.
Figure 10.
Current distribution of ventilation corridors (under northerly wind).
Figure 10.
Current distribution of ventilation corridors (under northerly wind).
Figure 11.
Spatial distribution of local ventilation advantages (under northerly wind).
Figure 11.
Spatial distribution of local ventilation advantages (under northerly wind).
Figure 12.
Comparison of multi-method results under northerly wind conditions. (a) represents the FAI classification method, (b) the least cost path method, (c) the circuit model method, (d) the method proposed in this study.
Figure 12.
Comparison of multi-method results under northerly wind conditions. (a) represents the FAI classification method, (b) the least cost path method, (c) the circuit model method, (d) the method proposed in this study.
Figure 13.
Spatial distribution of primary and secondary ventilation corridors under northerly wind conditions.
Figure 13.
Spatial distribution of primary and secondary ventilation corridors under northerly wind conditions.
| Disclaimer/Publisher’s Note: The statements, opinions and data contained in all publications are solely those of the individual author(s) and contributor(s) and not of MDPI and/or the editor(s). MDPI and/or the editor(s) disclaim responsibility for any injury to people or property resulting from any ideas, methods, instructions or products referred to in the content. |
© 2025 by the authors. Published by MDPI on behalf of the International Society for Photogrammetry and Remote Sensing. Licensee MDPI, Basel, Switzerland. This article is an open access article distributed under the terms and conditions of the Creative Commons Attribution (CC BY) license (https://creativecommons.org/licenses/by/4.0/).


