Abstract
The 15-min city (FMC) is a people-oriented urban development strategy that aims to provide a higher quality of life by manifesting the people’s right to the city. This study proposes an FMC index that measures how close a specific area is to achieving the 15-min accessibility to the six social functions (living, working, supplying, caring, learning, and enjoying). In the case of Pasig City, social function service areas were generated in terms of walkability and walking speeds per age group. Grid-based and population-based FMCI were calculated based on the established weights of points of interest and social functions, as well as the barangay population distribution per age group. The results show that 90% of the barangays achieved an FMCI of 0.5 or higher. This study presents an in-depth yet replicable approach using open-source data, considering facilities in each social function based on necessity of each age group, as well as utilizing pedestrian walkability as an impedance. Further, high population-based FMCI barangays cluster in the southern-central part of the city. The developed FMCI offers a compelling rationale for other HUCs to assess urban planning strategies, such as zoning strategies in the context of the weighted importance of amenities, walkability, and population distribution.
1. Introduction
In 1968, Henri Lefebvre initiated the concept of the right to the city, a stimulus to rethink the urban access status quo [1]. The right to the city insists on the supposed active social participation in urban spaces, where cities are shaped by those who inhabit them rather than industrial forces [1]. However, land use planning, being the governing system of city development, is challenged by political interference and premature mandates, compromising community-based city development [2]. In effect, spatial segregation in relation to economic disparity has become a pressing issue in the urban setting, whereby working and residential resources are unequally accessible in a city [3]. This social exclusion has been significantly linked to car-centric transportation and environmental pressures [4]. With the interconnected challenges, the need to address sustainable urban livability has become clear [5].
The people’s right to the city is manifested in the 15-min city (FMC) concept, an urban planning strategy that has gained popularity in different cities all over the world. The 15-min city is a people-centric urban approach to providing a higher quality of life by ensuring that essential services are accessible to the residents within a 15 min radius by walking or biking [1,6]. It was first introduced in 2016 by Carlos Moreno, a Franco-Colombian scientist and smart city specialist, who developed the model to advocate for human-centered urbanism, where elements like self-actualization, socialization, cultural activities, and healthcare are accessible within a short commute [5]. Then-Paris Mayor Anne Hidalgo initially adopted his model as part of her ‘living smart city’ project called the “Ville du quart d’heure”, or the 15-min city [5], and gradually influenced urban planning worldwide. The FMC has especially gained traction during the COVID-19 pandemic when subsequent lockdowns stressed the importance of accessible amenities, considering that mobility, particularly through public transportation, became constrained [7].
In recent years, several countries have shown support for the 15-min city idea, especially with the benefits that come from the implementation of the urban planning concept. In China, the government promotes the development of its areas into more walkable neighborhoods, ensuring the convenient access of its citizens to essential public services within a 15 min walk, thereby enhancing walking behavior and overall health. This initiative emphasizes the role of walkable neighborhoods in medical efforts to minimize the residents’ risk of having obesity and non-communicable diseases [8]. Other cities that embraced the 15-min city concept include Barcelona, Oxford, and Paris [9].
In the Philippines, although approximately 35% of destinations in Metro Manila are found to be within a 15 min walking or biking distance, most short trips are still made by riding in jeepneys, tricycles, and cars [10], which may be rooted in the status of pedestrian infrastructure in cities. However, in recent years, more city governments have started to solidify their efforts to improve the environmental friendliness of their urban areas. One of them is Pasig City, which launched and maintained initiatives to promote active mobility, such as investing in the creation of pedestrian and elevated walkways, as well as installation of cycling infrastructure [11]. The present study, motivated by such aspirations, aims to evaluate the principles of the 15-min city concept in the case of Pasig City’s urban landscape.
This study aims to develop a 15-min city index (FMCI) that measures how close a specific region or area is to achieving the ideal 15 min accessibility to the six social functions (living, working, caring, supplying, learning, and enjoying). Notably, the research focuses on walking as the mode of transport, utilizing unique walking speeds for each age group classification. This research aims to fill gaps in the existing literature in ensuring a more holistic and in-depth approach to 15-min city assessment by considering the score of facilities in each social function based on the necessity for their services to be within the 15 min radius, as well as the rank of social function based on the needs of each age group.
Moreover, to further describe the pedestrian-based approach, this research takes a novel approach to 15-min city assessment by utilizing walkability as an impedance in the creation of the pedestrian network dataset. This draws inspiration from the existing urban studies about walkability, which score sidewalks based on different parameters such as availability of crossings, cleanliness, disability infrastructure, security from crime, and present obstructions according to open-source data [12]. Through the incorporation of the walkability scores of the sidewalks, the present research considers the different environmental conditions of sidewalks in a city in accessing urban services. The FMCI aims to be obtained for each area of defined tile size in the city, using summation to obtain the score of each barangay, the lowest political administrative unit in the Philippines. The resulting index would overall describe the area’s accessibility to the six social functions within 15 min.
The rest of the paper is organized as follows. Section 2 discusses related studies to broaden the 15-min city concept and existing assessments, as well as urban studies that assess walkability. Section 3 details the research methodology, including the characteristics of the case study area where all data were based and the layers of processes performed to determine the FMCI. In Section 4, the results of the GIS processes are presented, highlighting the spatial patterns of FMCI and the correlation of FMCI to walkability. Section 5 discusses these results and their implications for the developed index. Section 6 provides the conclusion of the study, summarizing the findings and inferences that address the objectives of the research, as well as recommendations for future research directions.
2. Related Studies
Accessibility and proximity are two primary principles advanced in the 15-min city concept geared toward enhancing the quality of life in urban areas [6]. In particular, according to Moreno et al. [13], higher quality of life is linked to the ability of residents to access in a 15 min space-time frame the six essential urban social functions: living, working, supplying, caring, learning, and enjoying. Effective implementation of the 15-min city requires dividing each societal function into subcategories and associating them with specific uses, activities, and infrastructure. Table 1 summarizes the elements and facilities associated with these six social functions (6 SFs).
Table 1.
Elements and facilities integrated into the six social functions.
With the rise of the FMC’s popularity as a contemporary urban planning concept, there is an increased prevalence of assessments related to it, contextualizing and applying the concept differently. Existing 15-min city assessments utilize various metrics to measure the performance of urban areas. Differences can be found in methodological processes such as the selection of urban amenities, consideration of modes of transport, and utilization of travel speeds [14]. Notably, the metrics used reflect the core concept of a 15-min city, which is to provide a high quality of urban life in terms of proximity to urban services, environment sustainability, and consideration of individual characteristics and preferences.
In the selection of the facilities to be included as points of interest in 15-min city assessments, different urban amenities were considered in the existing literature. For instance, in the study of Fazio et al. [15], the points of interest were divided into three categories: recreational (restaurants, tourist destinations), commercial (general services), and educational (school venues). With further detailing of specification, the 2021 study of Graells Garrido et al. [16] categorized urban amenities into eleven categories: (1) government facilities, (2) health facilities, (3) professional services, (4) education, (5) entertainment or those indoor places with access fee, (6) finance like banks and similar establishments, (7) food such as restaurants and cafes, (8) recreational areas, (9) spiritual venues, (10) retail stores including malls and supermarkets, (11) and public transportation. Although the classification of urban amenities differs in detail in existing studies, they generally agree on broad classifications, including education, healthcare, food retail, and recreational facilities [14]. To ensure higher conformity to the 15-min city concept, the present study categorized points of interest under the six social functions defined by Carlos Moreno: (a) living, (b) working, (c) supplying, (d) enjoying, (e) learning, and (f) caring.
Furthermore, many studies about FMC assessments focused on active modes of transport in analyzing proximity to services. This reflects one of the fundamental characteristics of an FMC, which is the alignment of the city’s rhythm with people and not cars [17], consequently promoting sustainable and active modes of transport [18]. Several studies have focused on walking as a mode of transportation for accessing urban amenities [8,19,20,21], while some incorporated cycling, like the study of Hosford et al. [22], which assessed accessibility to local grocery stores in Vancouver, Canada, through walking and cycling at various speeds. Interestingly, many studies assumed an average walking pace of 4 to 5 km/h, which is consistent with various sources [14]. For instance, in the study of Starrico [23], the isochrones were computed based on an average walking pace of 4.8 km/h, which is similar to the Google Maps value and in line with standard definitions in walkability studies that equate walking in 5 min to 400 m [24,25]. Notably, to account for the different characteristics of the defined age groups, other 15-min city assessments utilized varied walking speeds for different age demographics, such as children, adults, and the elderly [20,23]. Considering its significance to the pedestrian-centric approach of FMCs, the present study focused on walking as the mode of transport, utilizing different walking speeds for each age group to ensure more inclusive results.
Alternatively, some existing studies accounted for the diverse characteristics of the population by considering their preferences for urban amenities. In particular, Weng et al. [8] did not incorporate different walking speeds of different pedestrian groups in their assessment but took a different approach to still consider pedestrian characteristics and amenity attributes by giving weights to amenities depending on how commonly they are used by different age groups, determined through a questionnaire survey responses answered by their target age groups. This is similar to the study of Guzman et al. [2], which incorporated the preferences of the population segments by conducting a ranking survey that was used to obtain the respective weights of the facilities and categories. The findings of their research reveal significant differences in the prioritization of urban amenities across different age groups. Furthermore, considering the needs and preferences of residents is essential in building accessible, inclusive, and attentive cities [17] like FMCs. Drawing inspiration from these ideas, the present research considered the relative importance of social functions and services based on the prioritization of the age groups.
After identifying the components to be used in 15-min city assessments, it is essential to determine the method to be used for the measurement of the proximity of the urban amenities or facilities. In the existing body of literature, many studies used network distances [15,26,27,28], while some research opted to use Euclidean distance mainly because of the computational complexity involving road network data [29,30]. The use of network distances is highly recommended as it enables more realistic and accurate findings by considering the actual distances that residents must bike or walk to reach the urban amenities from their locations [14]. On the other hand, Euclidean distance is determined not to be suitable for executing spatial queries in road networks as essential elements like road distance and travel time are underestimated in their usage [31]. To ensure more accurate results, the present study performed network analysis to determine service areas of the points of interest.
Concerning the analytical aspect, indicators used to analyze the results of 15-min city assessments were mostly related to population. For instance, in the study of Starrico et al. [23], to evaluate the accessibility of services, the percentage of the population with access to one or more amenities of the same kind within a 15-min walking distance was calculated. This analysis led to the conclusion of the research that some services are over-concentrated in some regions of the city while amenities are limited or nonexistent in other areas of the city despite the population present in these parts. Similarly, Gaglione et al. [29] analyzed accessibility based on population distribution, specifically population density. They calculated the total population served and not served within 15 min of walking by plotting the population density in the study area and overlaying it on the polygons from the service area of the urban amenities. These studies highlight the relevance of resident population distribution as an indicator of the compliance of urban areas to the FMC concepts and, thus, it is considered in the present study through accounting for the population distribution of age groups in the FMCI.
Considering the people-centeredness of the FMC concept, walkability is a particularly relevant attribute. Walkability is a widely used concept in different fields such as geography, public health, and urban planning [32]. While it is variably defined across the existing literature, Leslie et al. [33,34] describes walkability as the degree to which the built environment’s characteristics and land use are conducive for residents to walk for leisure, recreation, accessing services, or commuting to work. Generally, walkability is known as the measure of the pedestrian-friendliness of an area [35]. With the implication that higher walkability encourages more people to walk in open urban environments, evaluation of the walkability helps urban designers and planners to enhance the pedestrian environment’s quality, which subsequently promotes the development of urban areas into more integrated, attractive, inclusive, and walking conducive spaces [34]. In the study of Knapskog et al. [36], three main factors are identified in the existing literature focused on walkability assessment: (a) infrastructure and traffic, including attributes such as crossings and speed levels; (b) urbanity, encompassing density, proximity, and connectedness; and (c) surroundings and activities, consisting of attributes such as destinations, vibrancy, and experienced safety. On the other hand, Jan Gehl, a renowned architect for people-centered urban design, views walkability as a principle of pedestrian experience and human–space interaction [37]. For instance, Gehl defined the presence of walls, spatial distance, pedestrian speed, vertical movement, and urban furniture orientation to be the parameters that influence human–space interaction, which translates to walkability [37]. Exploratory analyses following the urban design principles of Jan Gehl have been conducted through metrics of liveliness, building height, and façade quality to review its impact on walking activities [38]. Although pedestrian experience, i.e., comfort and attractiveness of walking activity, are considerations for walkability, urban design features’ influence on walking activities may be relative to the study area’s density and real estate type [38].
Relatedly, different tools for walkability evaluation have been developed, with most of them primarily designed in the United States and parts of Europe [39]. Yang et al. [40] correspondingly emphasized that walkability assessment tools made in European and Western countries cannot be directly applied to developing countries because of the differences in the built environments and cultural contexts. For instance, Walk Score, which is a popular U.S.-based website that calculates walkability based on the distance between a house and local amenities, often provides high scores in Asian cities mainly due to their traditional mixed-use characteristics [10,41]. Notably, the Global Walkability Index (GWI) created by Krambeck [42] for the World Bank provides a clearer understanding of the current walkability in Asian cities [10,42]. The modified GWI developed by Wibowo et al. [43] further enhances the applicability of the tool to the Asian context by adjusting the descriptions of the parameters. Fundamentally, this GWI offers an analysis of the walkability of cities by defining nine parameters i.e., walking path modal conflict, availability of walking paths, availability of crossings, grade crossing safety, motorist behavior, amenities, disability infrastructure, obstructions, and security from crime. The GWI is extensively utilized in walkability assessments in the Philippines. Specifically, this methodology is applied to studies analyzing walkability in Tacloban City and Pasig City with corresponding modifications for the local contexts [12,44]. To ensure that the developed FMCI significantly reflects the underlying people-centeredness principle of a 15-min city, the present study took on a new approach of accounting for the walkability scores of walkways in the study area to determine accessibility to points of interest. Specifically, scores utilized were obtained from an established study based in Pasig City, which were derived from the combination of GWI and its modified version. The availability of the walkability scores and the strong local relevance of the used tool in the base study are the major considerations for the innovation in the present research, ensuring the comprehensiveness of the developed FMCI.
Considering the identified trends in FMC assessments and aiming to conform strongly with the FMC concepts, the following objectives are established for this study: (1) use walkability of pedestrian walkways as impedance; (2) execute service area network analysis or isochrone analysis originating from the facilities under the six social functions; (3) develop a 15-min city geospatial framework, defining 15-min city index and modeling the dependence of the FMCI on the needs of each age group; (4) determine the FMC scores of each barangay, defined by the smallest administrative division in the Philippines, using the 15-min city geospatial framework; (5) identify the presence of FMCI clustering and hotspots through spatial autocorrelation. The significance of the developed FMCI is to imply the quality of urban life, aligning with the purpose of the 15-min city concept. While the focus of this study is on Pasig City, the index is designed to be adaptable for application in other urban areas.
3. Materials and Methods
The 15-min city concept was applied in the case study area of Pasig City, Philippines. As an overview, the primary data involved in generating the FMCI are the following: pedestrian network, walkability scores, walking speeds, six social functions, age group classification, and population distribution. From there, network analysis and service areas were generated from points of interest that correspond to each social function. This section details the methodology used in determining the FMCI scores.
3.1. Case Study Area
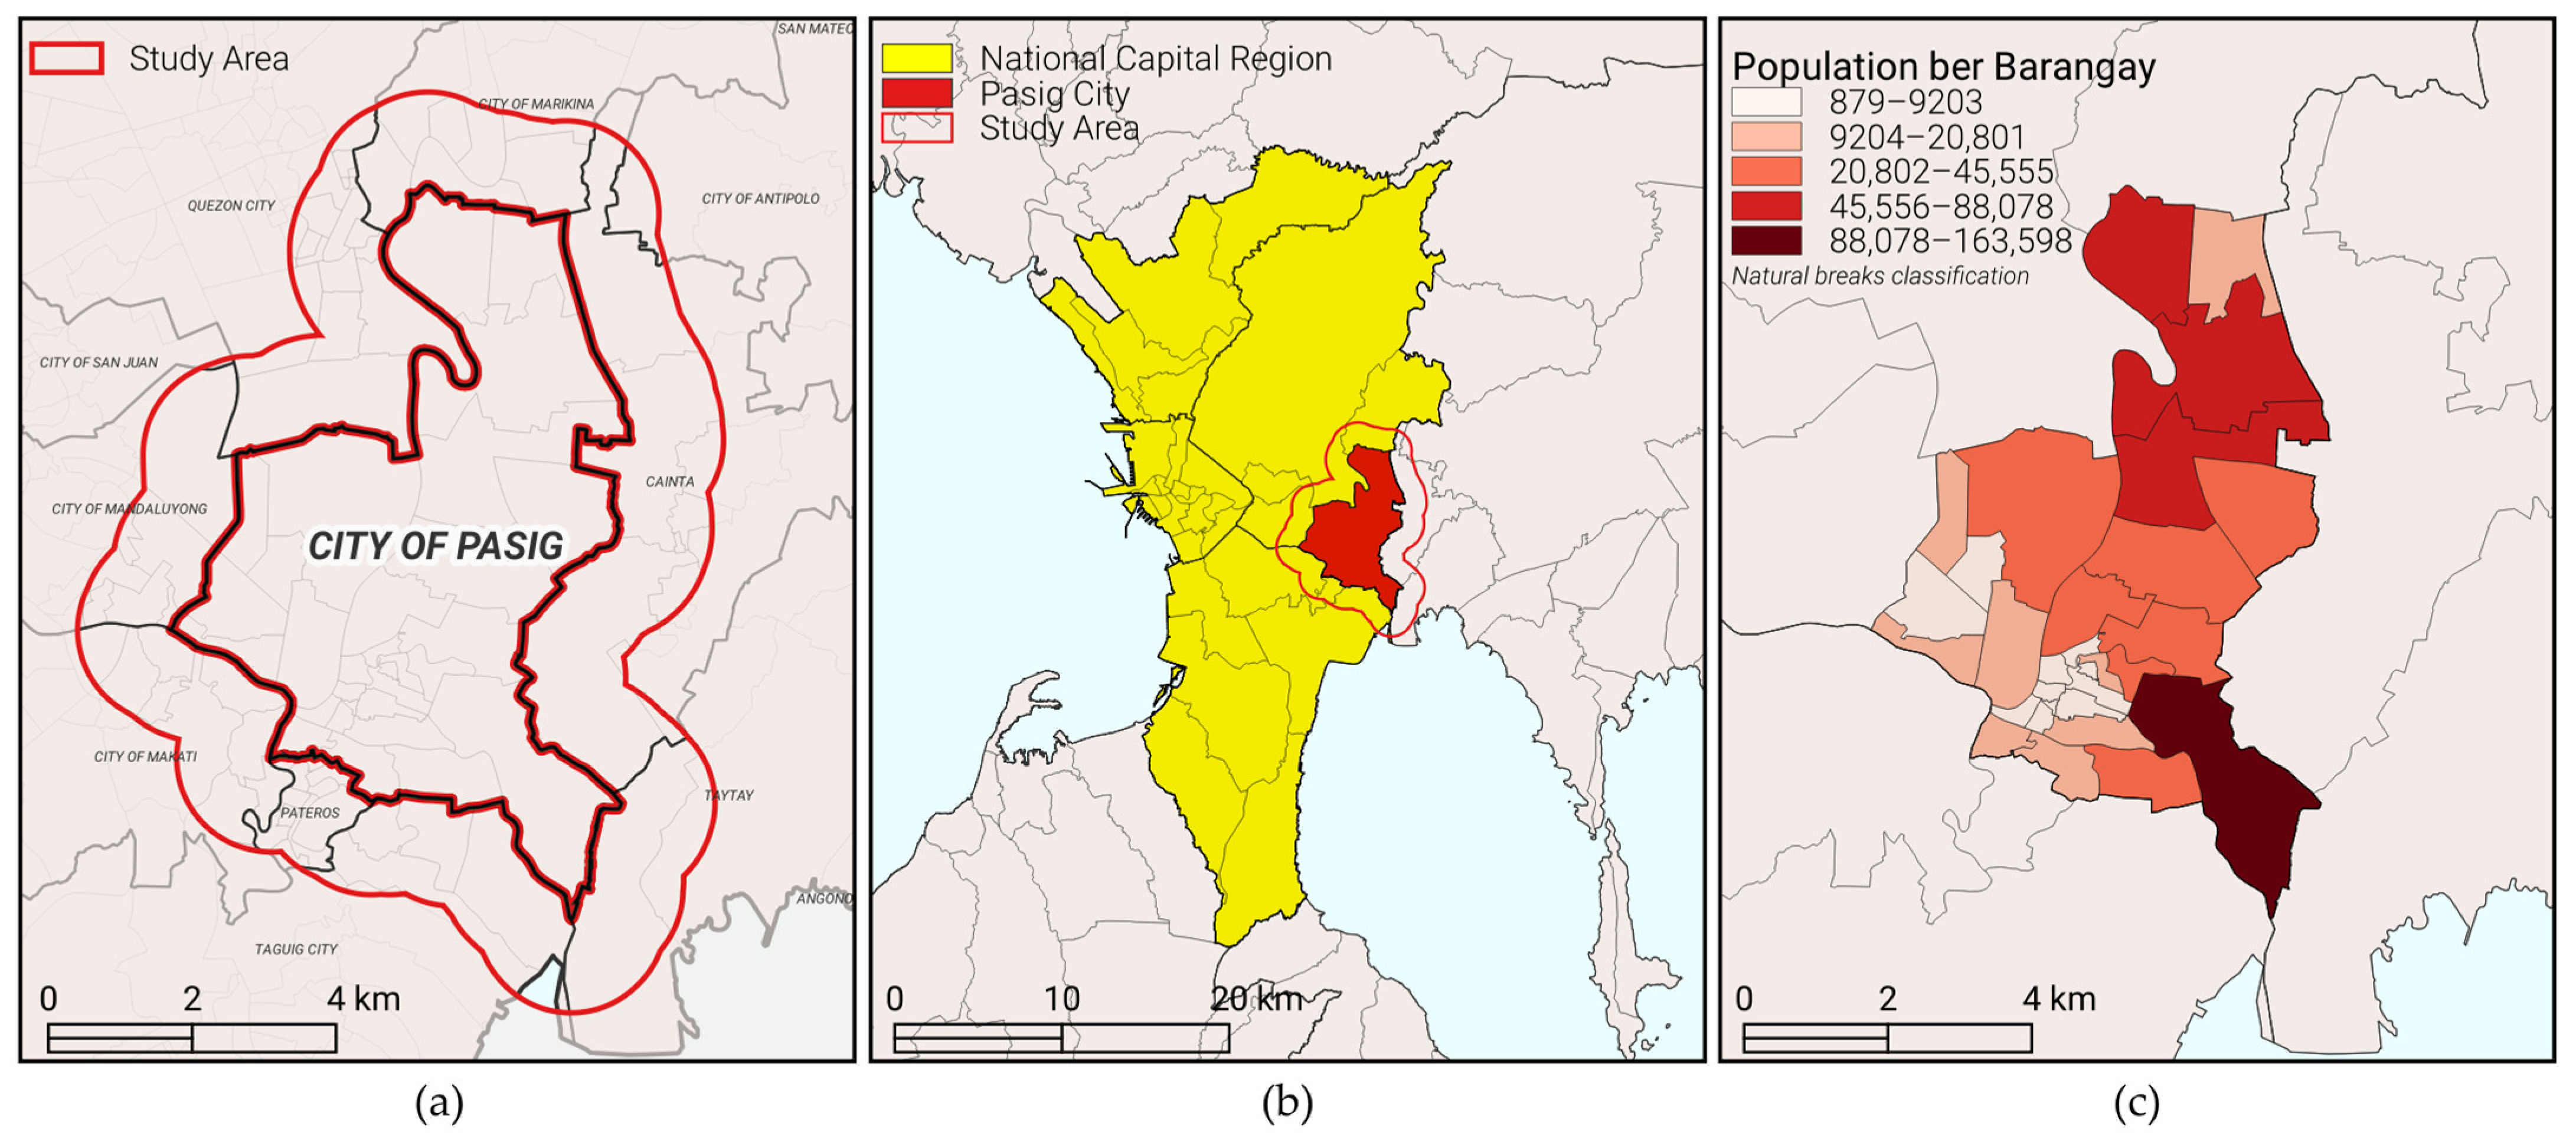
Pasig City is a highly urbanized city (HUC) in the National Capital Region (NCR) of the Philippines. Pasig was historically the capital of Rizal Province until it was elevated to an HUC and transferred to NCR in 1995. Located in Pasig City is a growing business district where multinational companies, commercial centers, and residential towers are catered to [45]. Notably, major roads such as E. Rodriguez Jr. Avenue (C-5 Road), Epifanio de los Santos Avenue (EDSA), and Bonifacio Global City (BGC)-Ortigas Center Road belt the city [
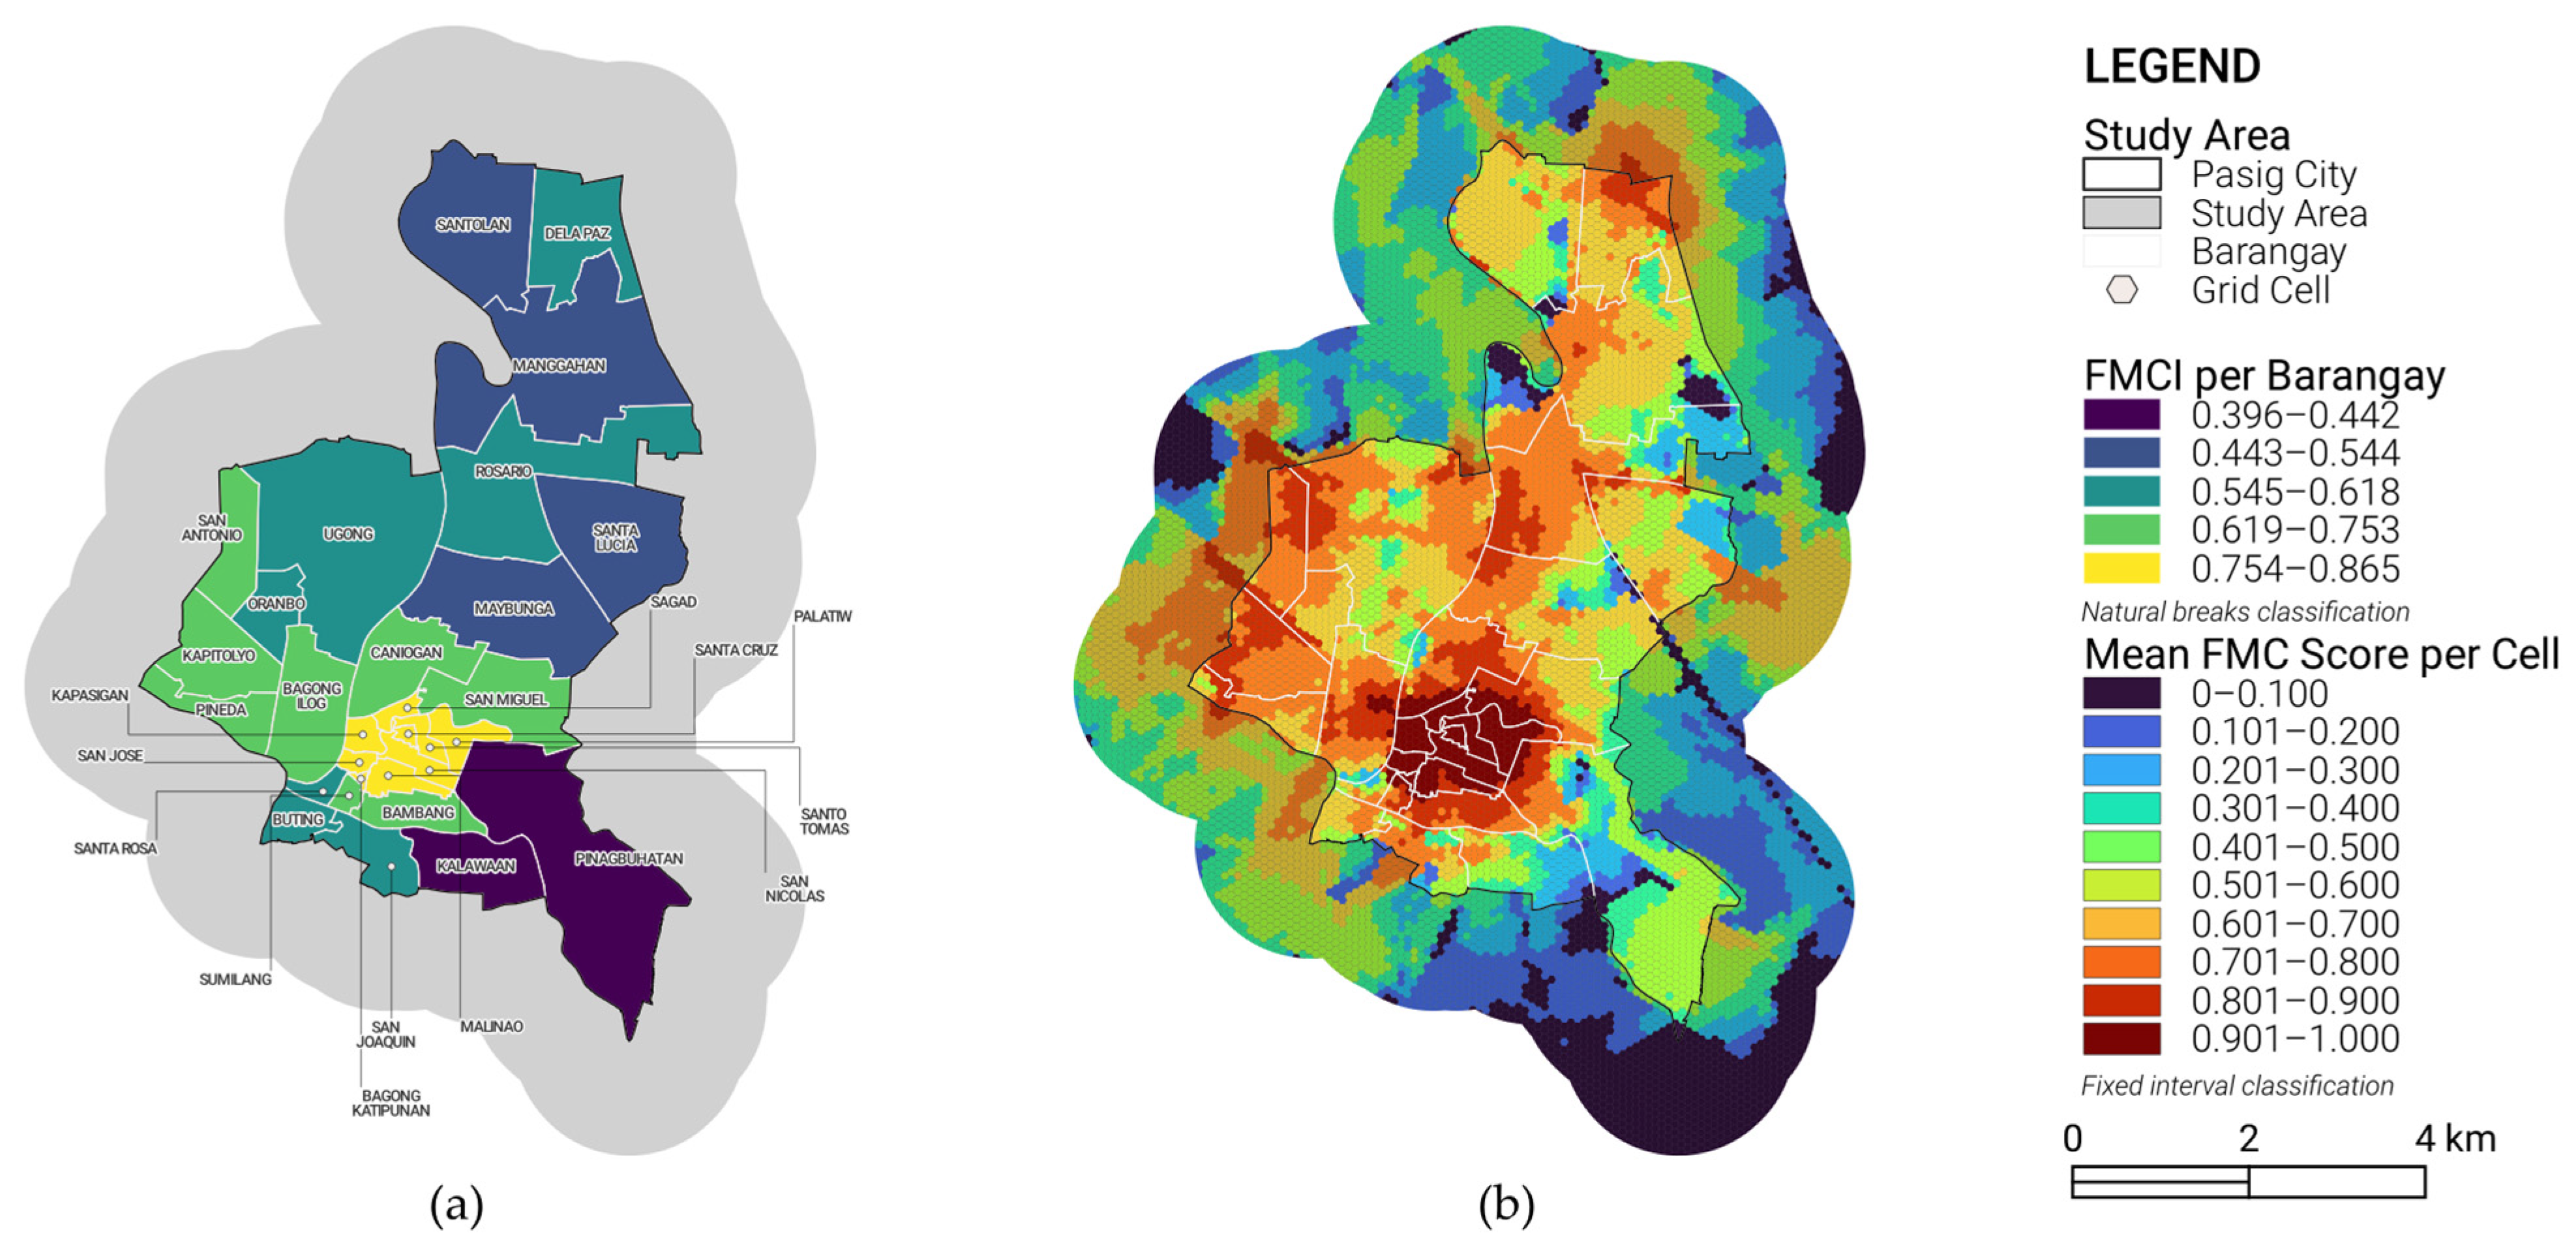
45]. Pasig City is politically divided into 30 barangays, as shown on the map in Figure 1a. In the Philippines, the barangay (brgy.) is the basic political unit, which is also the primary implementing unit of government policies [46]. Such a highly urbanized city warrants consideration of its sustainability. Nonetheless, Pasig City was acknowledged for its efforts to reduce its greenhouse gas emissions along with its economic growth, i.e., having a low-carbon economy [47]. For instance, the city’s approach has gained positive regard in its COVID-19 response, where the local government mobilized bike lanes, urban gardens, and mobile public markets [11].
Figure 1.
(a) Political map of Pasig City with the red line indicating the bounds of the study area; (b) location of Pasig City (red) in the National Capital Region (yellow); and (c) population per barangay of Pasig City.
With the city’s intensely industrial character and its recent motions to be a sustainable city, Pasig City is a suitable case study area that mirrors the pedestrian-centric approach of urban planning, which is the 15-min city. Remarkably, the city government has implemented carless streets in specific areas of the city and at specific times. In 2023, Kapasigan Boulevard in Brgy. Kapasigan was declared a “People’s Street” every Sunday, 6:00 AM to 6:00 PM [48]. Other People’s Streets that were first implemented in 2022 include East Bank Road in Brgy. Manggahan, Caruncho Avenue in Brgy. San Nicolas, MH del Pilar Street in Brgy. Sto. Tomas, and Lopez Jaena Street in Brgy. Sumilang [49].
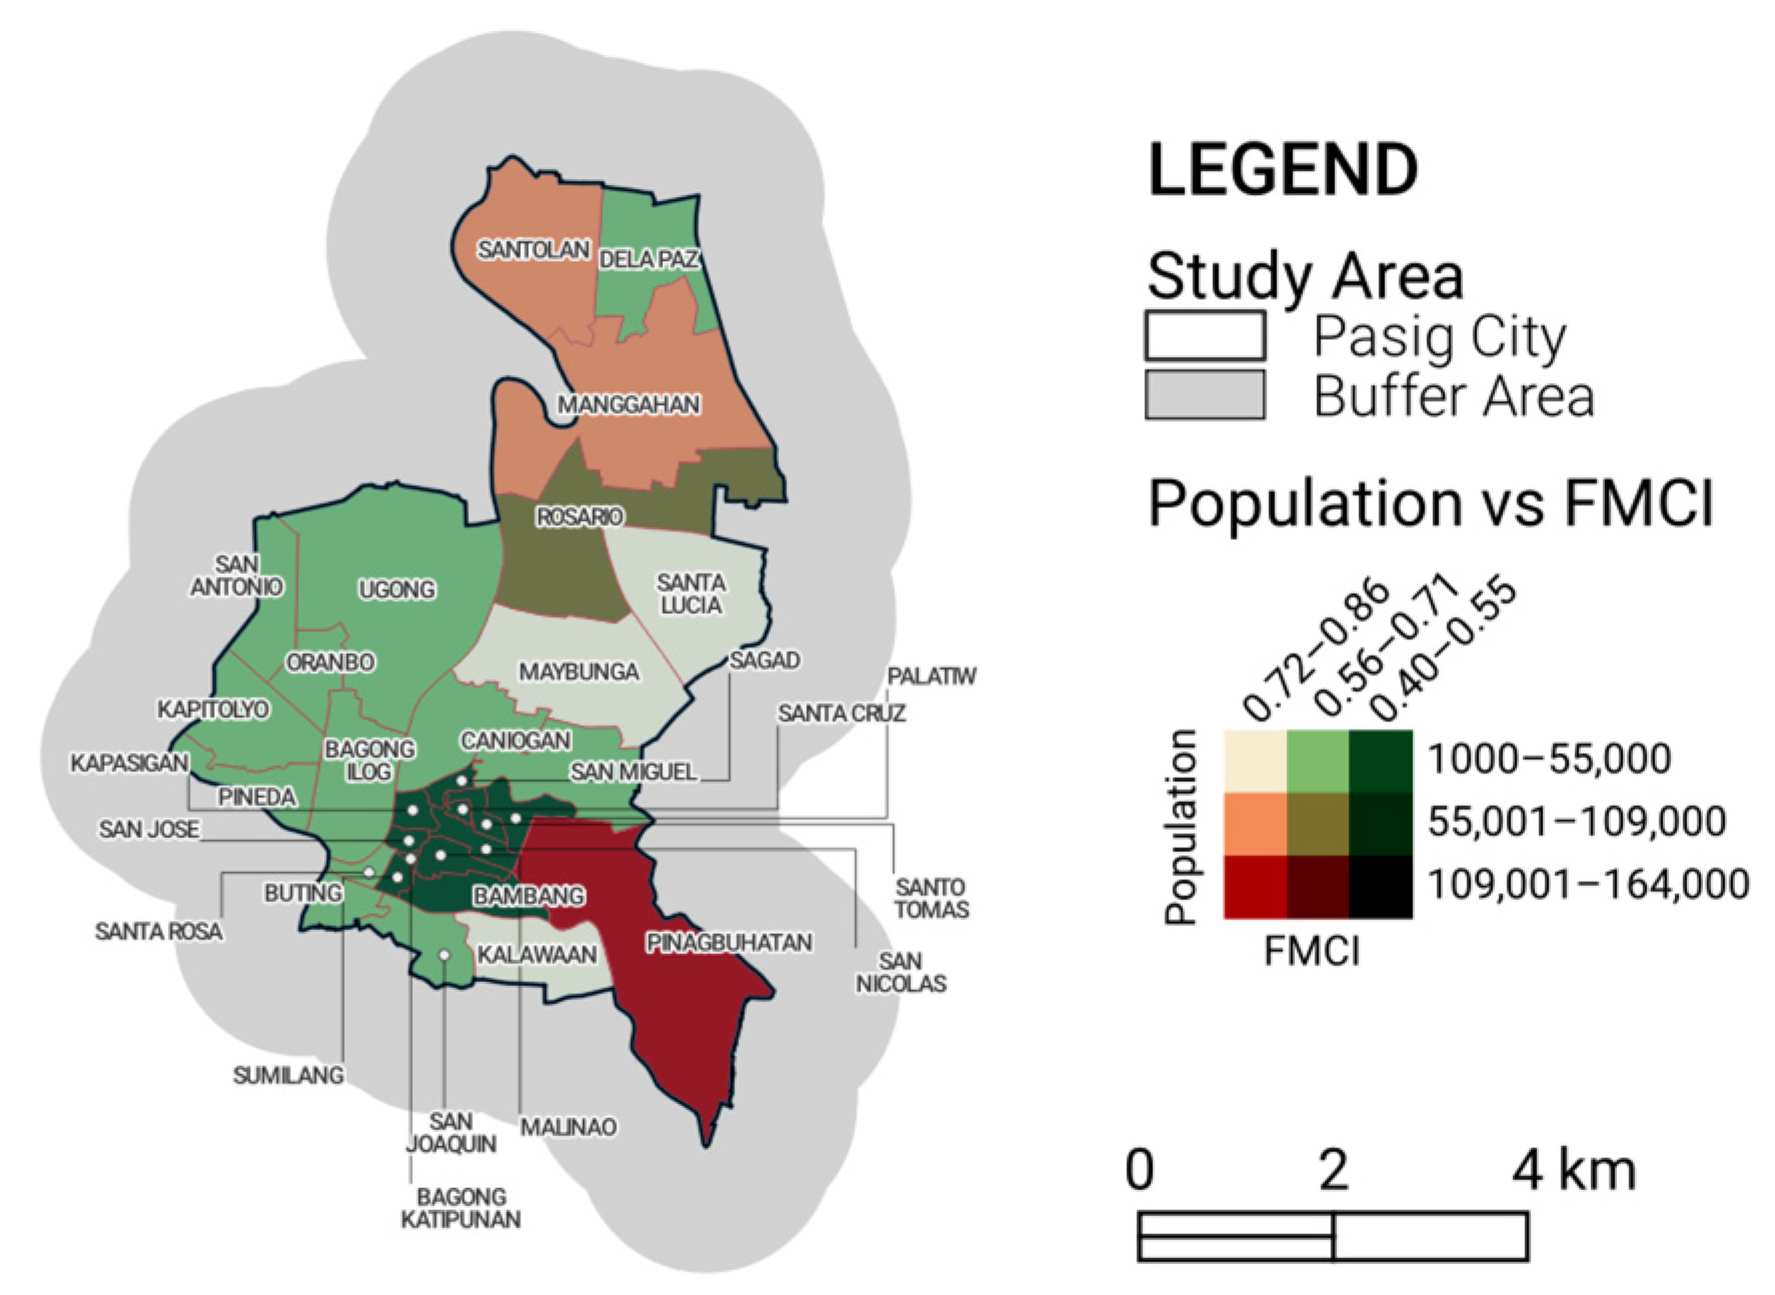
Moreover, the study area shown in Figure 1b includes the territory of Pasig City and a 1.3 km buffer area around the city’s limits. This is to consider paths and points of interest accessed by pedestrians that are outside but adjacent to the bounds of Pasig City. The addition of a buffer ensures that the measure of how close an area is to achieving the ideal 15 min accessibility to the six social functions is not compromised and limited by administrative bounds. For instance, a pedestrian may have 15 min access to social function facilities outside and within Pasig City. Nonetheless, the FMC is achieved for that pedestrian path. Notably, the buffer distance was based on the distance calculated from the maximum walking speed from age group classifications multiplied by 15 min.
3.2. Geospatial Framework
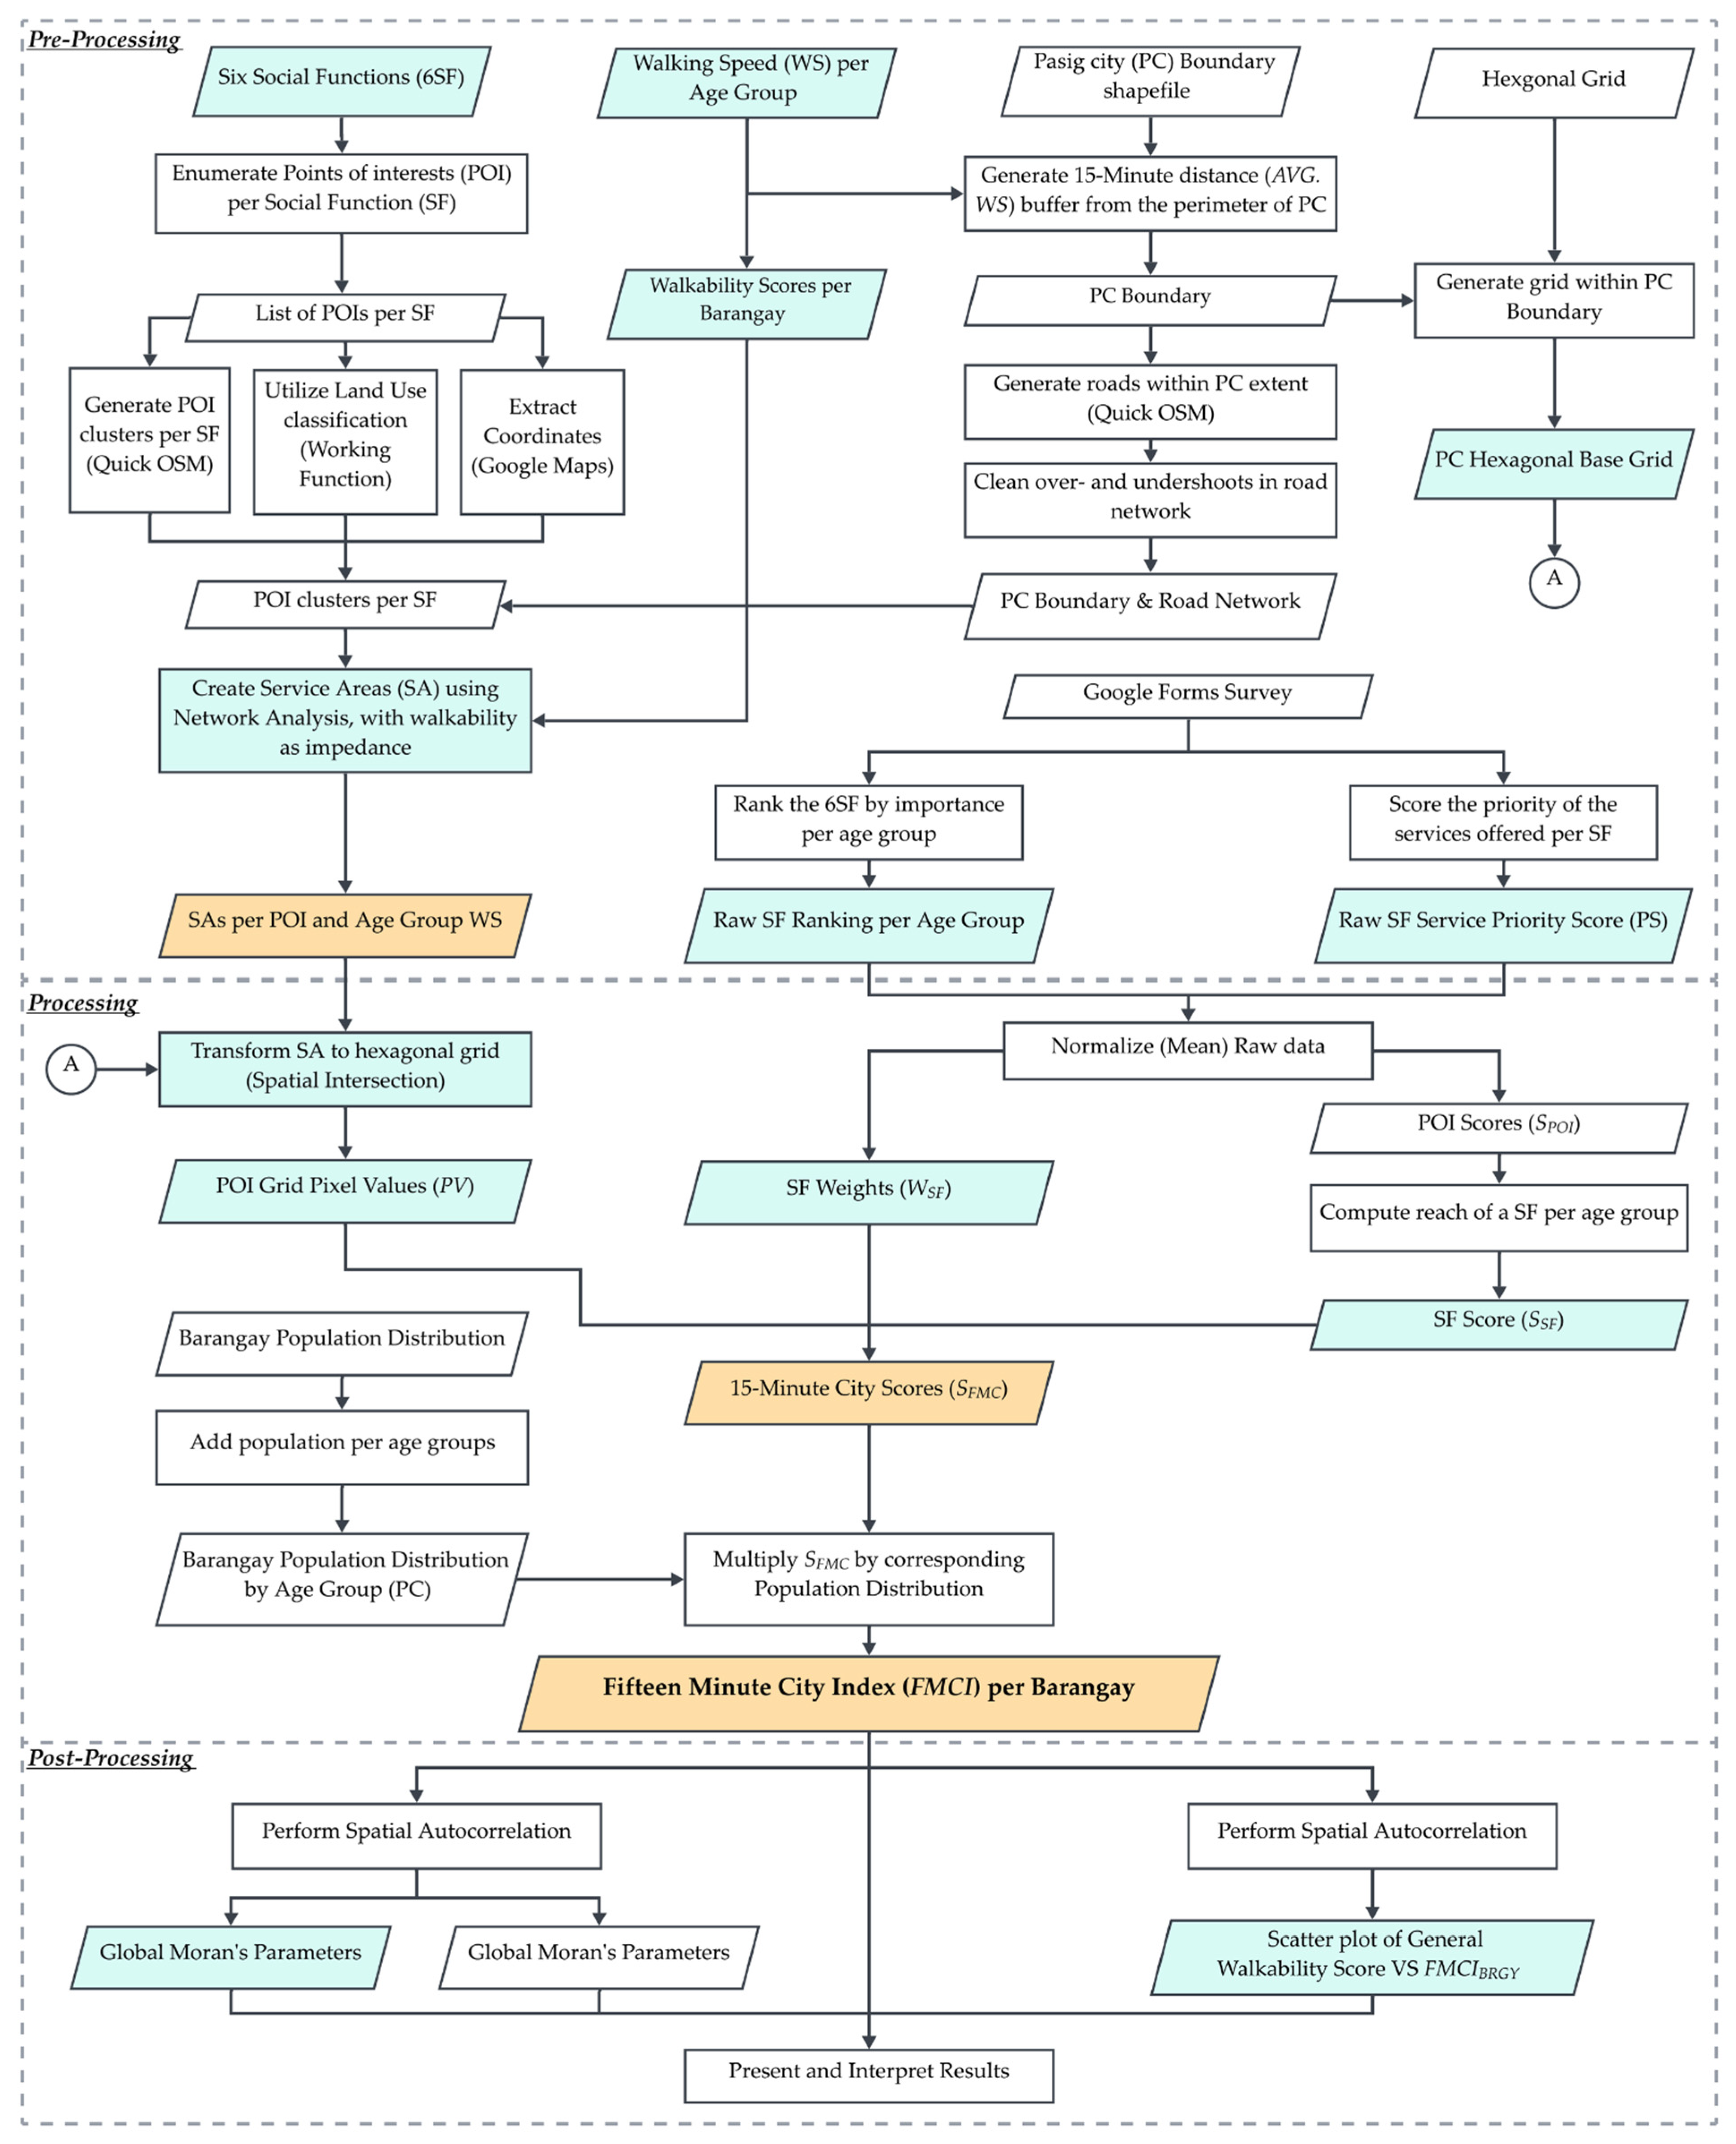
The geospatial framework provides a multi-criteria framework for developing the 15-min city index in the case of Pasig. This displays the interplay and relation of the key components utilized in the methodology to arrive at the final FMCI per barangay, with further post-analytical analysis using spatial statistics.
The geospatial framework in Figure 2 is divided into three parts: the pre-processing, processing, and post-processing parts of the methodology. Pre-processing includes data gathering and data preparation. The details of acquiring the data that represent the key components highlighted in the framework, including the six social functions, walking speed per age group, walkability scores per barangay, points of interest, road network, and respective weights of points of interest and social functions, can be found in Section 3.3. From the data acquired, the pre-processing part of the geospatial framework shows the general outline of how the key components and service areas were generated. Further discussion of the data pre-processing, i.e., data preparation, is presented in Section 3.5. Processing, on the other hand, covers how the outputs from pre-processing were utilized to calculate the FMCI. Section 3.5 provides an in-depth explanation of the data processing. Finally, post-processing delineates statistical, geospatial analyses of the generated FMCI to further provide context and patterns regarding the scores. The post-processing performed in this study can be found in Section 3.6.
Figure 2.
Geospatial framework based on walkability scores and age distribution per barangay in the case of Pasig City (blue—pertinent FMCI criterion; orange—key resulting values).
3.3. Data Gathering
This section discusses the considerations and process of collecting data for the five key components in the study, namely, age group classification, population distribution, walking speed, pedestrian network, and the six social functions.
3.3.1. Age Group Classification
The age group classification, where all the components are referenced for the determination of FMCI in this study, is based on the United Nations Statistics Guidelines 1981 [50], as shown in Table 2. This is the third and most detailed set of classifications defined by the organization for the international demographic, social, and related economic data. It encompasses 12 subject areas, namely, population, family formation, learning, and educational services, earning activities, income distribution, social security, health services and nutrition, housing and its environment, public order and safety, time use, leisure and culture, and social stratification and mobility. Notably, this aligns with the defined social functions in a 15-min city, demonstrating its value for the present study.
Table 2.
Age group classification schemes were used by the United Nations Statistics Guidelines, and the final age group classification was used in this study.
However, since this research focuses on walking as a mode of transport in assessing a 15-min city index in Pasig City, the first age group was modified to 7 to 14 years old instead of 0 to 14 years old to reflect the start of independent mobility among children, which typically starts at age seven [51]. This consideration is essential for the assessment as the study considers the accessibility of services through walking. By focusing on children who can independently walk, the study ensures that POIs are accessible within a 15 min walk for this demographic. Table 2 shows the age group classification based on the UN Statistics Guidelines, along with the determined final age group classification for the present study.
3.3.2. Population Distribution
The population data used in this study were from the 2020 Barangay Census in Pasig City. These data were obtained from the Humanitarian Data Exchange website [52], managed by the Office for the Coordination of Human Affairs Philippines. The dataset included the total population and the population by age and sex for the barangays of Pasig City.
3.3.3. Walking Speed
Each age group has a unique walking speed, established from the study of Fitzpatrick et al. [53]. Table 3 illustrates the initial basis for determining the walking speeds of each age group.
Table 3.
Age group walking speeds from the 15th and 50th percentiles.
Table 4 shows the methods of obtaining the corresponding walking speeds for the age groups listed in Table 2, column 2.
Table 4.
Final age group walking speed.
3.3.4. Pasig City Roads
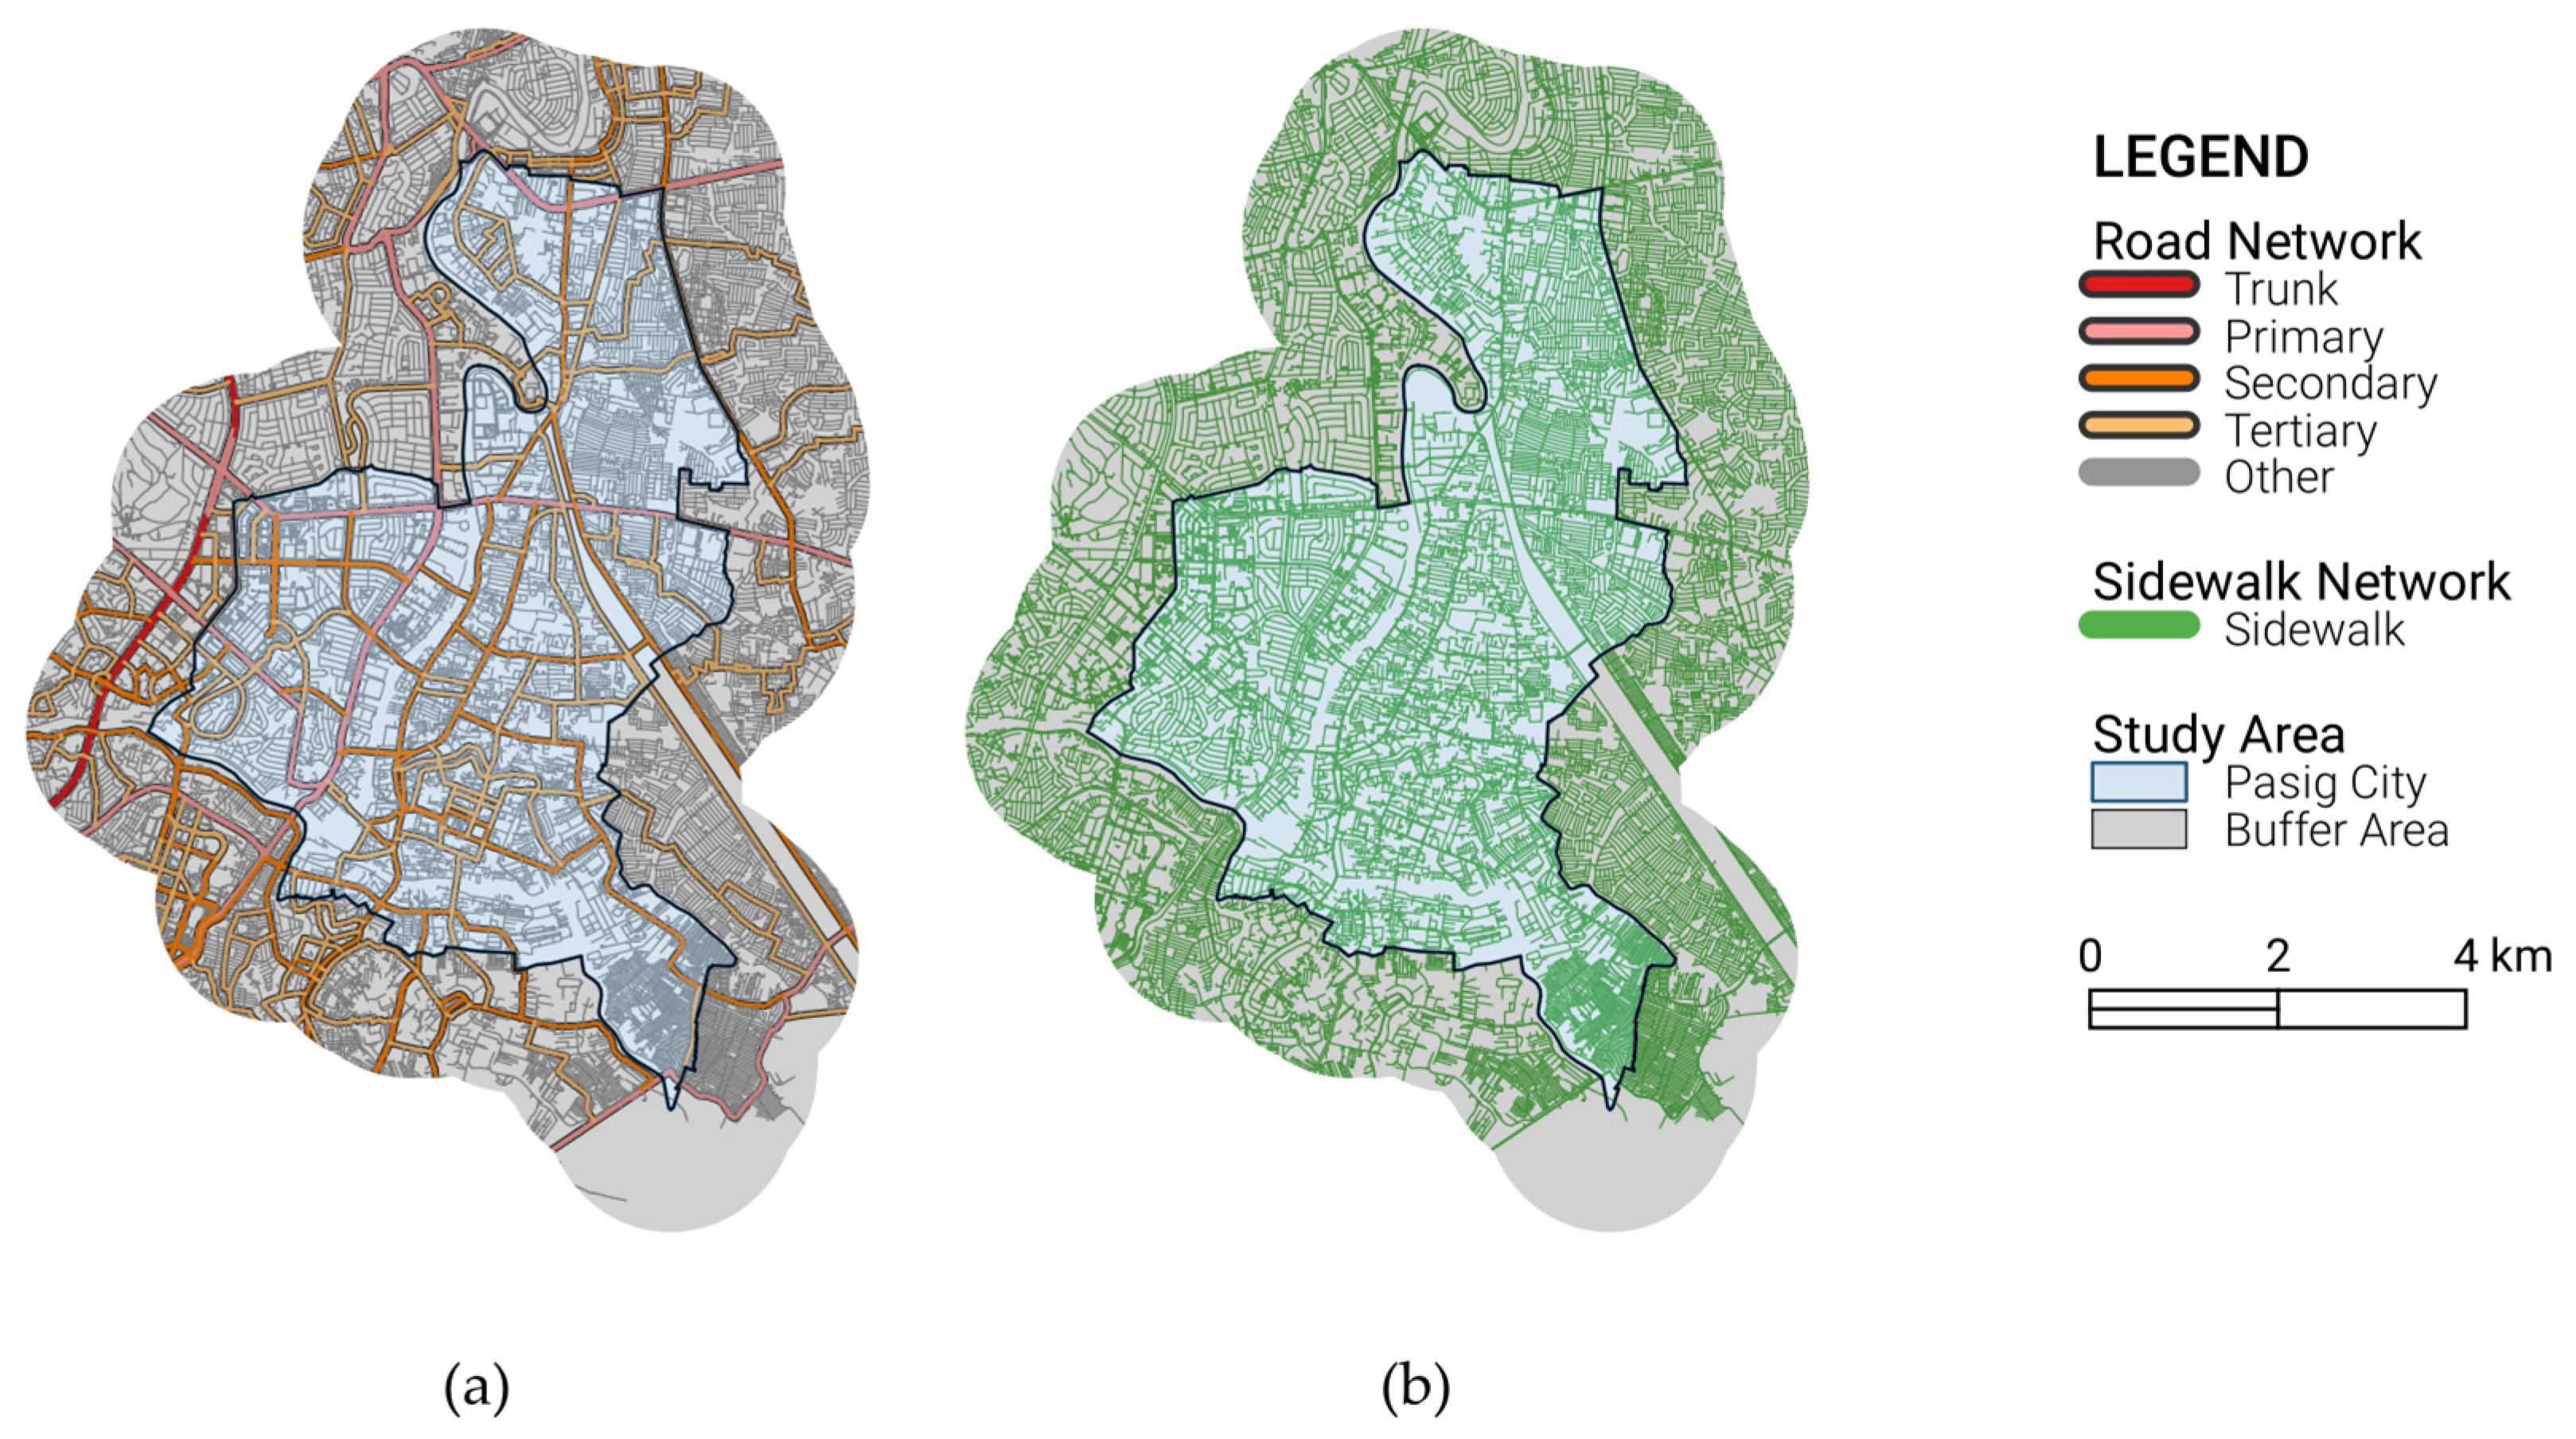
Pasig City road data were obtained through the QuickOSM plugin in QGIS, which facilitates downloading freely available OpenStreetMap (OSM) data [54]. Figure 3 shows an overview of the Pasig City road network derived from OSM. Based on the product of the highest walking speed (m/min) and 15 min, an additional 1.3 km buffer was created to generate more precise results by accounting for routes beyond the immediate boundaries of Pasig City.
Figure 3.
(a) Road network inside the study area, from OpenStreetMap; (b) sidewalk network inside the study area, also from OpenStreetMap, and modified to be used as the network dataset in this study.
3.3.5. Walkability Scores of Roads
Road walkability scores are based on the study of Nogueira et al. [44] where roads are assigned walkability scores based on the following parameters: (1) availability of walking paths, (2) cleanliness, (3) availability of disability infrastructure, (4) absence of obstructions, and (5) availability of amenities. These parameters were derived from Krambeck [42], and further modified by Wibowo et al. [43]. The base study of these walkability scores only assigned scores to road segments that are available on Google Street View. Therefore, the walkability scores are limited by the data available. Road segments were scored on each parameter from 1–3, with 3 being the highest score. The walkability score of each barangay was determined in two steps. First, the weighted scores for each parameter were computed using Equation (1).
where
- ;
- ;
- .
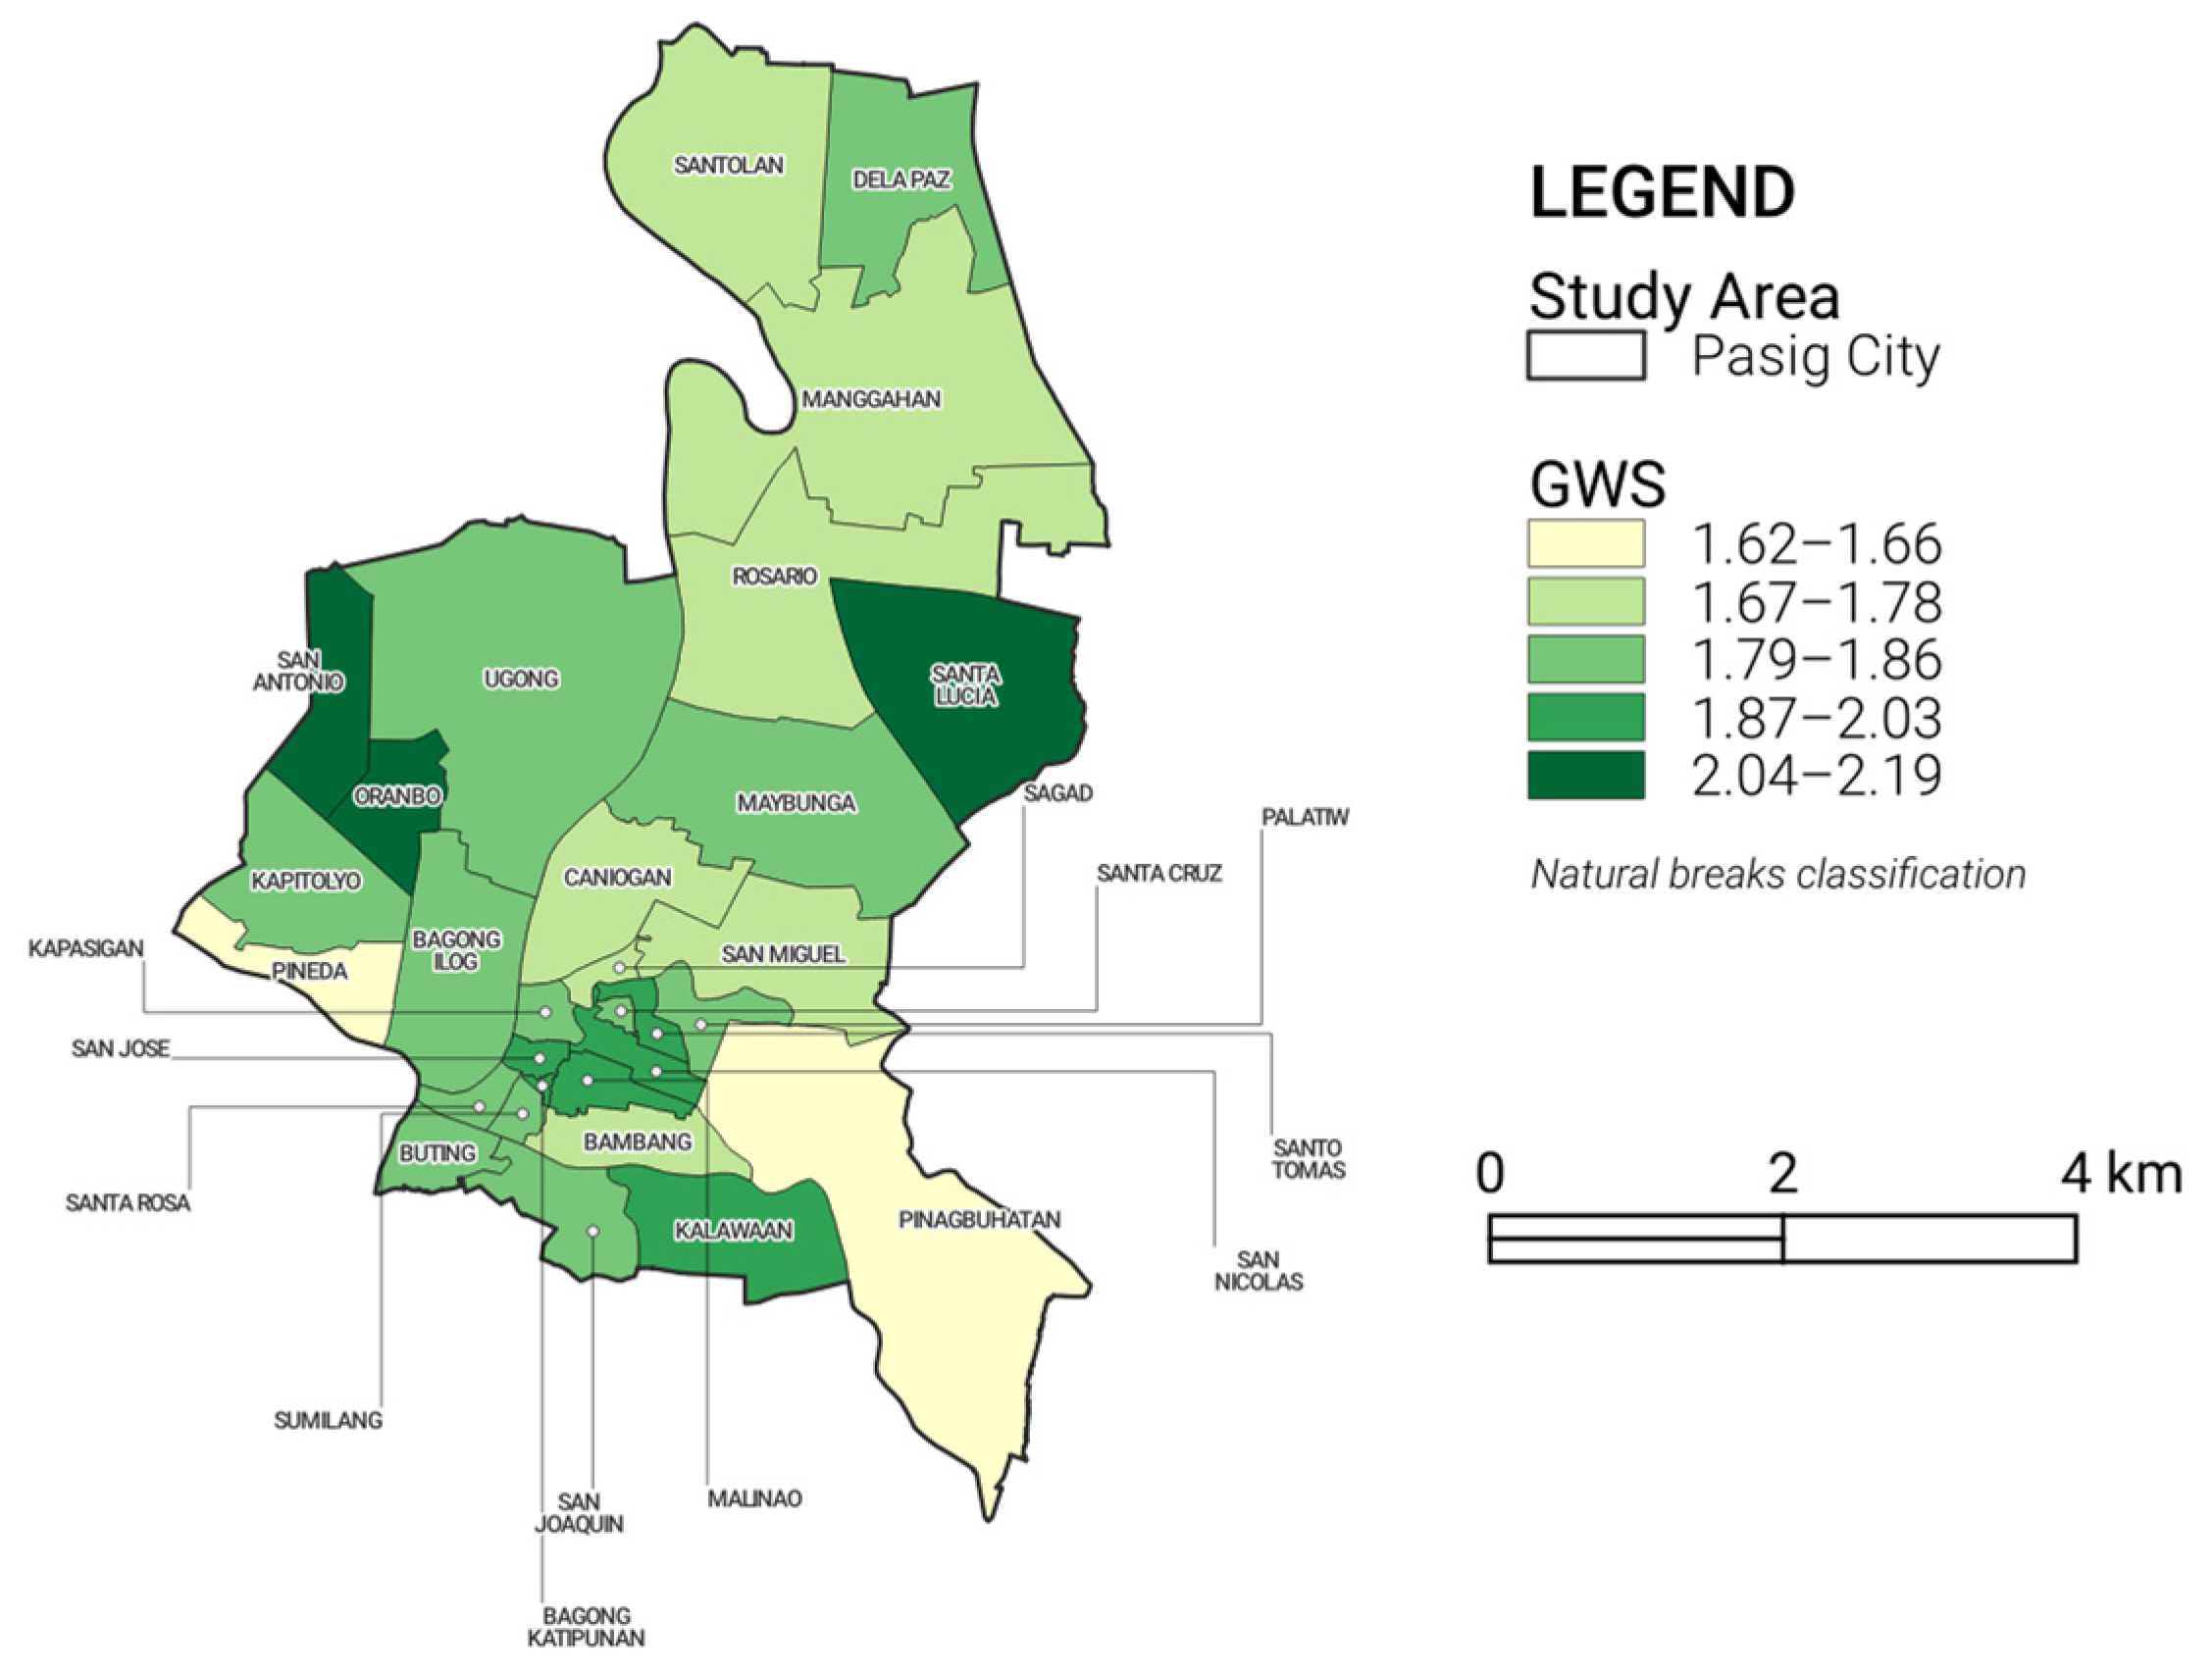
The final walkability score per barangay was determined by Equation (2), and the GWS of each Pasig City barangay is illustrated in Figure 4.
where
- ;
- .
Figure 4.
Pasig City walkability scores per barangay. A score of 1 indicates low walkability; 3 indicates high walkability.
Figure 4.
Pasig City walkability scores per barangay. A score of 1 indicates low walkability; 3 indicates high walkability.

3.3.6. Points of Interest (POIs)
The points of interest of urban amenities included in the study are categorized according to the six social functions outlined by Moreno et al. [13], namely, living, working, supplying, caring, learning, and enjoying. OpenStreetMap was primarily used to acquire data, while collection and verification of other POIs was conducted through Google Maps and other online sources. Table 5 presents the points of interest categorized under each social function and their respective data sources. Figure 5 shows the locations of the points of interest in each social function in the study area.
Table 5.
Points of interest belonging to each social function.
Figure 5.
Distribution of points of interest per SF across the study area, overlain on the Pasig City sidewalk network. (a) living; (b) working; (c) supplying; (d) enjoying; (e) learning; and (f) caring.
3.3.7. Services per Social Function
The social functions are further described by the services that they offer to the community. They were compiled from multiple sources, including various online references, as well as inferred additions based on the researchers’ prior knowledge of common service offerings. These services will help determine the importance of the individual POI in their corresponding social function. Table 6 provides a summary of each social function’s services.
Table 6.
Available services under the six social functions.
3.3.8. Service Scores (SS)
A panel of seven field experts was surveyed to determine the importance of each service. Using a scoring system of 1–3, with 3 being the most important, each service was given by each expert an importance score . The final score was derived by dividing the mean by three, the maximum possible score. Table A1 contains the full list of priority scores given by the experts and the corresponding service scores.
where
- ;
- .
3.3.9. POI Scores (SPOI)
The points of interest were assigned a score depending on the available services it offers. The POI score is computed consecutively using Equations (4) and (5).
where
- ;
- .
The final POI score is determined by dividing the score by the highest received by a POI in the social function to which the POI belongs.
3.3.10. Social Function Weights (WSF)
As this study assumes the age groups prioritize the 6SF differently, the social functions are assigned different weights per age group. To determine the prioritization of the social function for each age group, the expert panel was also requested to rank each social function based on its importance for the five (5) defined age groups, with 1 being the most important. The inverse of the average of the rankings for each social function is obtained using Equation (6).
where
- ;
- ;
- .
Sum-based normalization of prioritization scores is then applied to get the weights of social functions for each age group.
where
- ;
- .
Table A2 shows the complete list of social function weights.
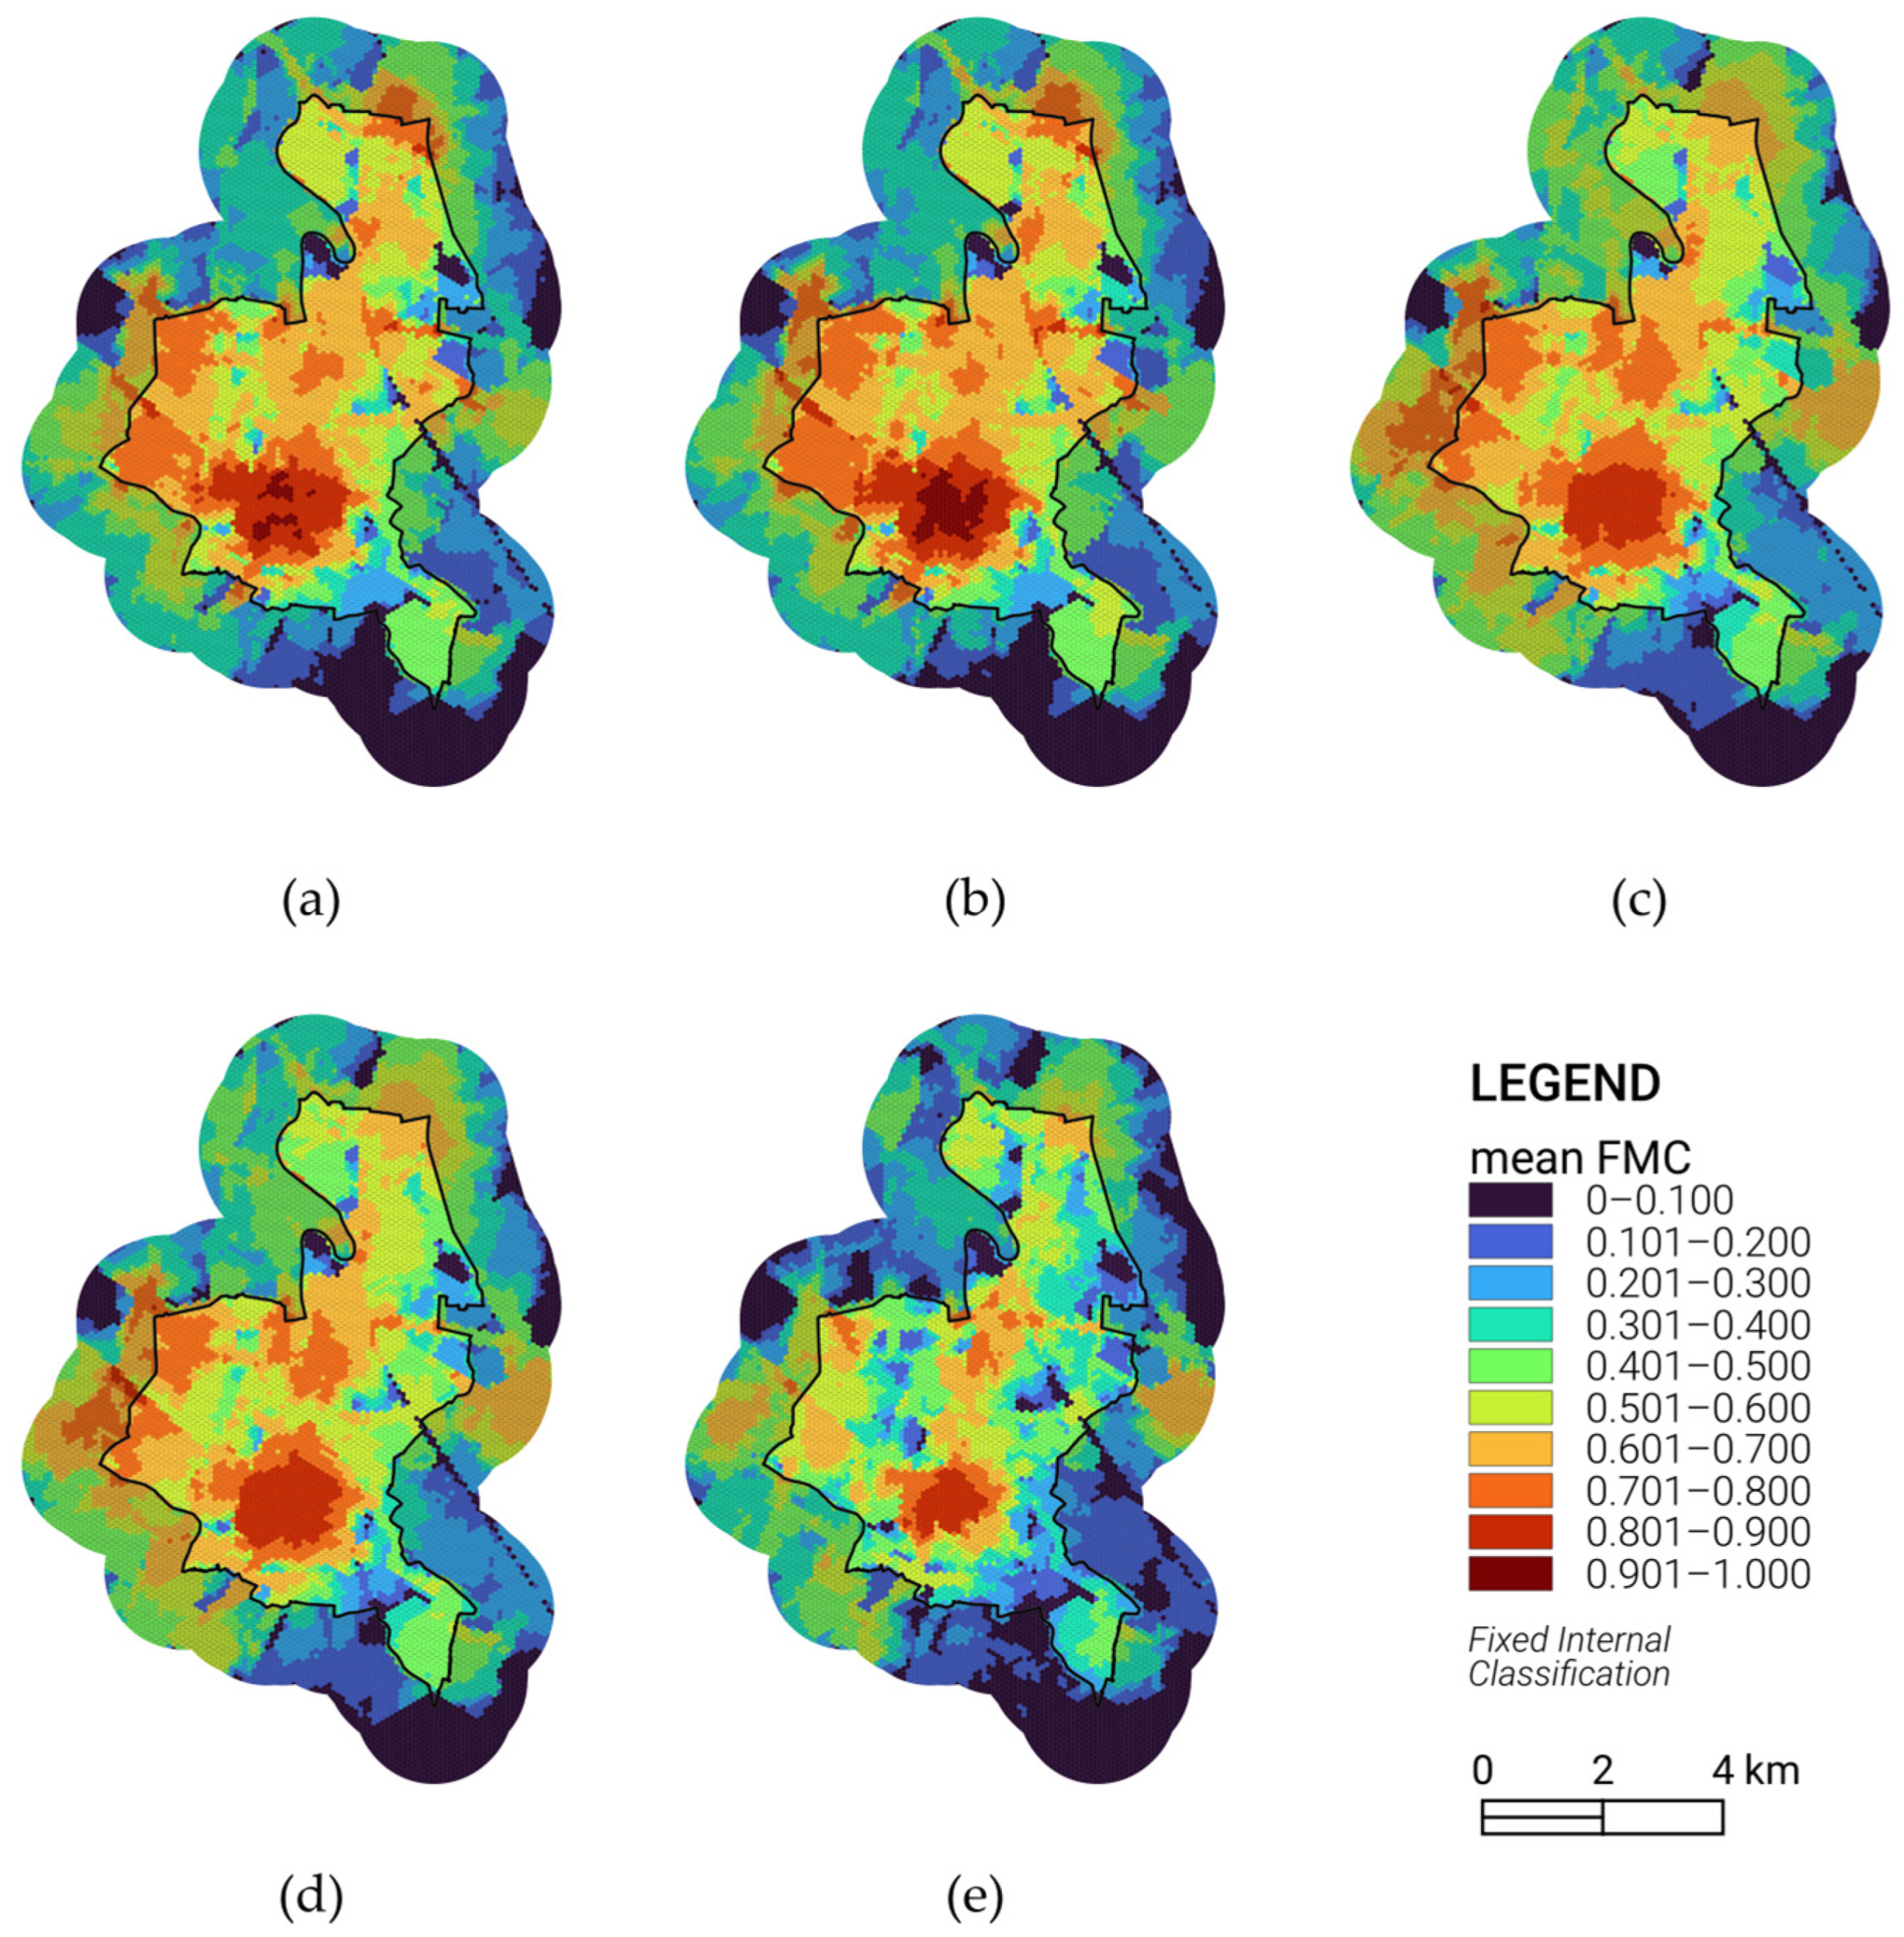
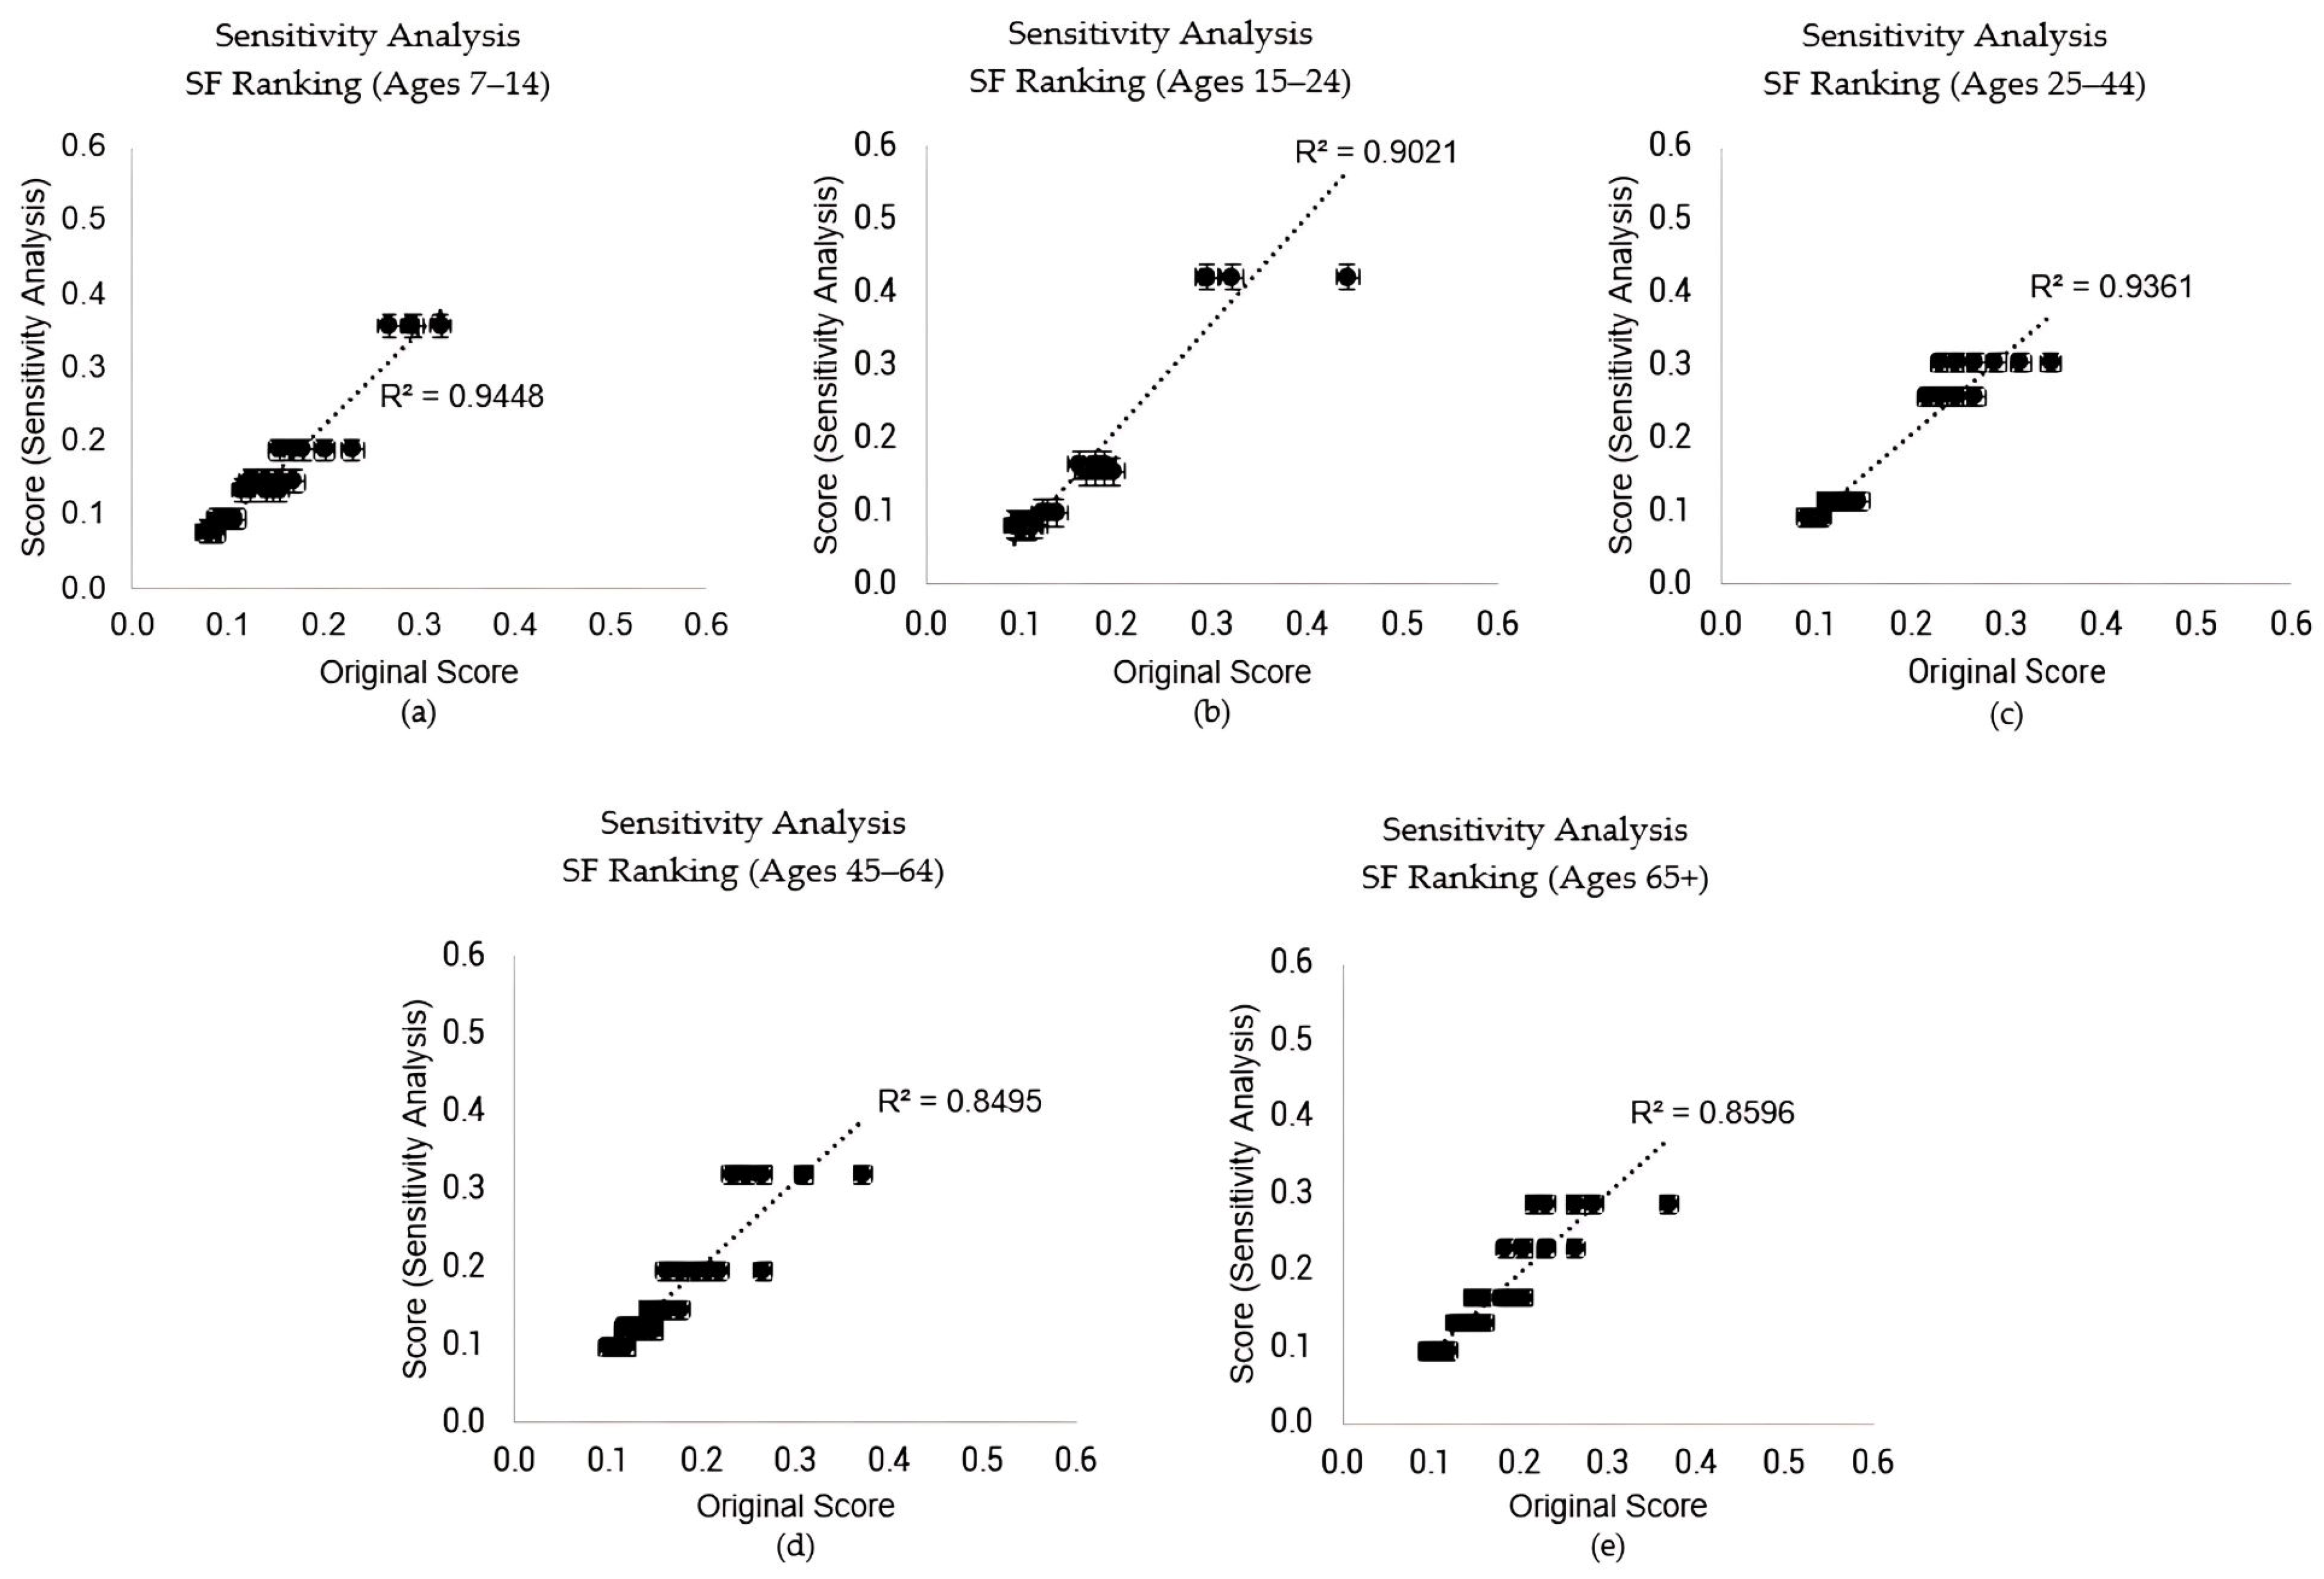
3.4. Sensitivity Analysis
In the acquisition of social function weights through surveying multiple expert opinions, subjectivity arises and may impose implications to the final FMCI. Hence, a sensitivity analysis was conducted from the raw social function rankings obtained from the survey. Sensitivity analysis pertains to the comparison of results of the original analysis performed and another analysis with varying factors [61]. A simple approach in sensitivity analysis is changing input factors one at a time (OAT Method) and analyzing the effect on the output [62]. This assesses the sensitivity of the results when a single input is varied, while the other remaining inputs remain unchanged. Specifically, this study performed the sensitivity analysis in the social function rankings obtained, changing the rankings of one expert through a random number generator to eliminate subjectivity, while the other seven expert’s rankings remained unchanged. A new score was then calculated from the new set of rankings using Equations (6) and (7).
Moreover, to quantify the sensitivity of the results, the standard deviation was calculated from the original and new social function scores. This method was iterated seven times for each age group, and since there were seven experts, each iteration randomized one set of rankings. Using Equation (8), the average standard deviation per iteration was obtained. Furthermore, the seven average standard deviations were averaged using Equation (9) obtaining the average age group standard deviation.
where
- = average standard deviation per iteration;
- = standard deviation between new and old score per SF.
- = average standard deviation per iteration;
- = average age group standard deviation.
Additionally, a linear regression analysis was performed in the context of determining whether the original social function scores are closely related to the new randomized social function scores. The regression analysis is purely a way to graphically show the likelihood of the set of scores and does not intend to show how one variable affect the behavior of the other.
3.5. Data Preparation
This section discusses the various preparation procedures performed for the data gathered, mainly for population distribution by age group per barangays in Pasig City, land use zones POI determination, network dataset and its walkability impedance, and hexagonal grid layout.
3.5.1. Determining Population Distribution by Age Group per Barangay
Pasig City’s 2020 Barangay Census data were used to determine the population distribution per age group. Population was classified per barangay per age year. Considering the age group classification set: 7–14 years old, 15–24 years old, 25–44 years old, 45–64 years old, and 65 years old and above, population data per age year was summed accordingly per age group classification. Since only the population of 7 years old and above was considered to have independent mobility, the total population distribution only ranged from 7 years old to 65 years old and above. Using the population distribution values per age group classification and the total population distribution from 7 to 65 years old and above, the percentages of population distribution per age group classification were calculated.
3.5.2. Getting Points for Land Use Zones Under Working Social Function
The land use (LU) classification for the study area of Pasig City was extracted from the existing LU classification shapefile of the National Capital Region, using simple vector clipping. The three primary land uses included were commercial, industrial, and institutional, and the extracted LU classification’s attribute table with the corresponding land use code was selected.
To generate the points for the extracted land use zones, points along its geometry were generated at a given distance parameter. The distance value used was the average walking speed of the age groups, of 1205.10 m, simulating a 15 min walking distance along the boundary of the land use zones. Additionally, the QuickOSM plugin [54] was also utilized to obtain commercial and industrial land uses, which were different from the previously mentioned source, and were then merged with them.
3.5.3. Network Dataset Preparation
The initial road network dataset was derived from OpenStreetMap and cleaned up to include only the sidewalks and walkable paths. The clean-up processing included removing road segments where pedestrians are not allowed (e.g., expressways), fixing the connections of footbridges to sidewalks, and adding crosswalk segments. Junctions were also ensured to represent the correct sidewalk connections.
3.5.4. Walkability Scores as Impedance
To incorporate walkability in determining the reachable areas from each POI, sidewalk segments were assigned an impedance or cost value based on the General Walkability Score of the barangay to which they belong. The barangay walkability scores from [44] discussed in 2.3.5, ranging from 1.62 to 2.19, were normalized and converted to multipliers ranging from 0.90 to 1.00 using Equation (8).
where
- ;
- .
In this manner, sidewalks in the same barangay have the same multiplier values. Each sidewalk segment’s length was computed, and the final sidewalk impedance was computed from
where
- .
Through this, the walkability parameter was incorporated into the network analysis. Network analyst tools prefer edge segments with lower impedance. Thus, it was established that sidewalks with higher GWS will have lower impedance and higher preferability from the program.
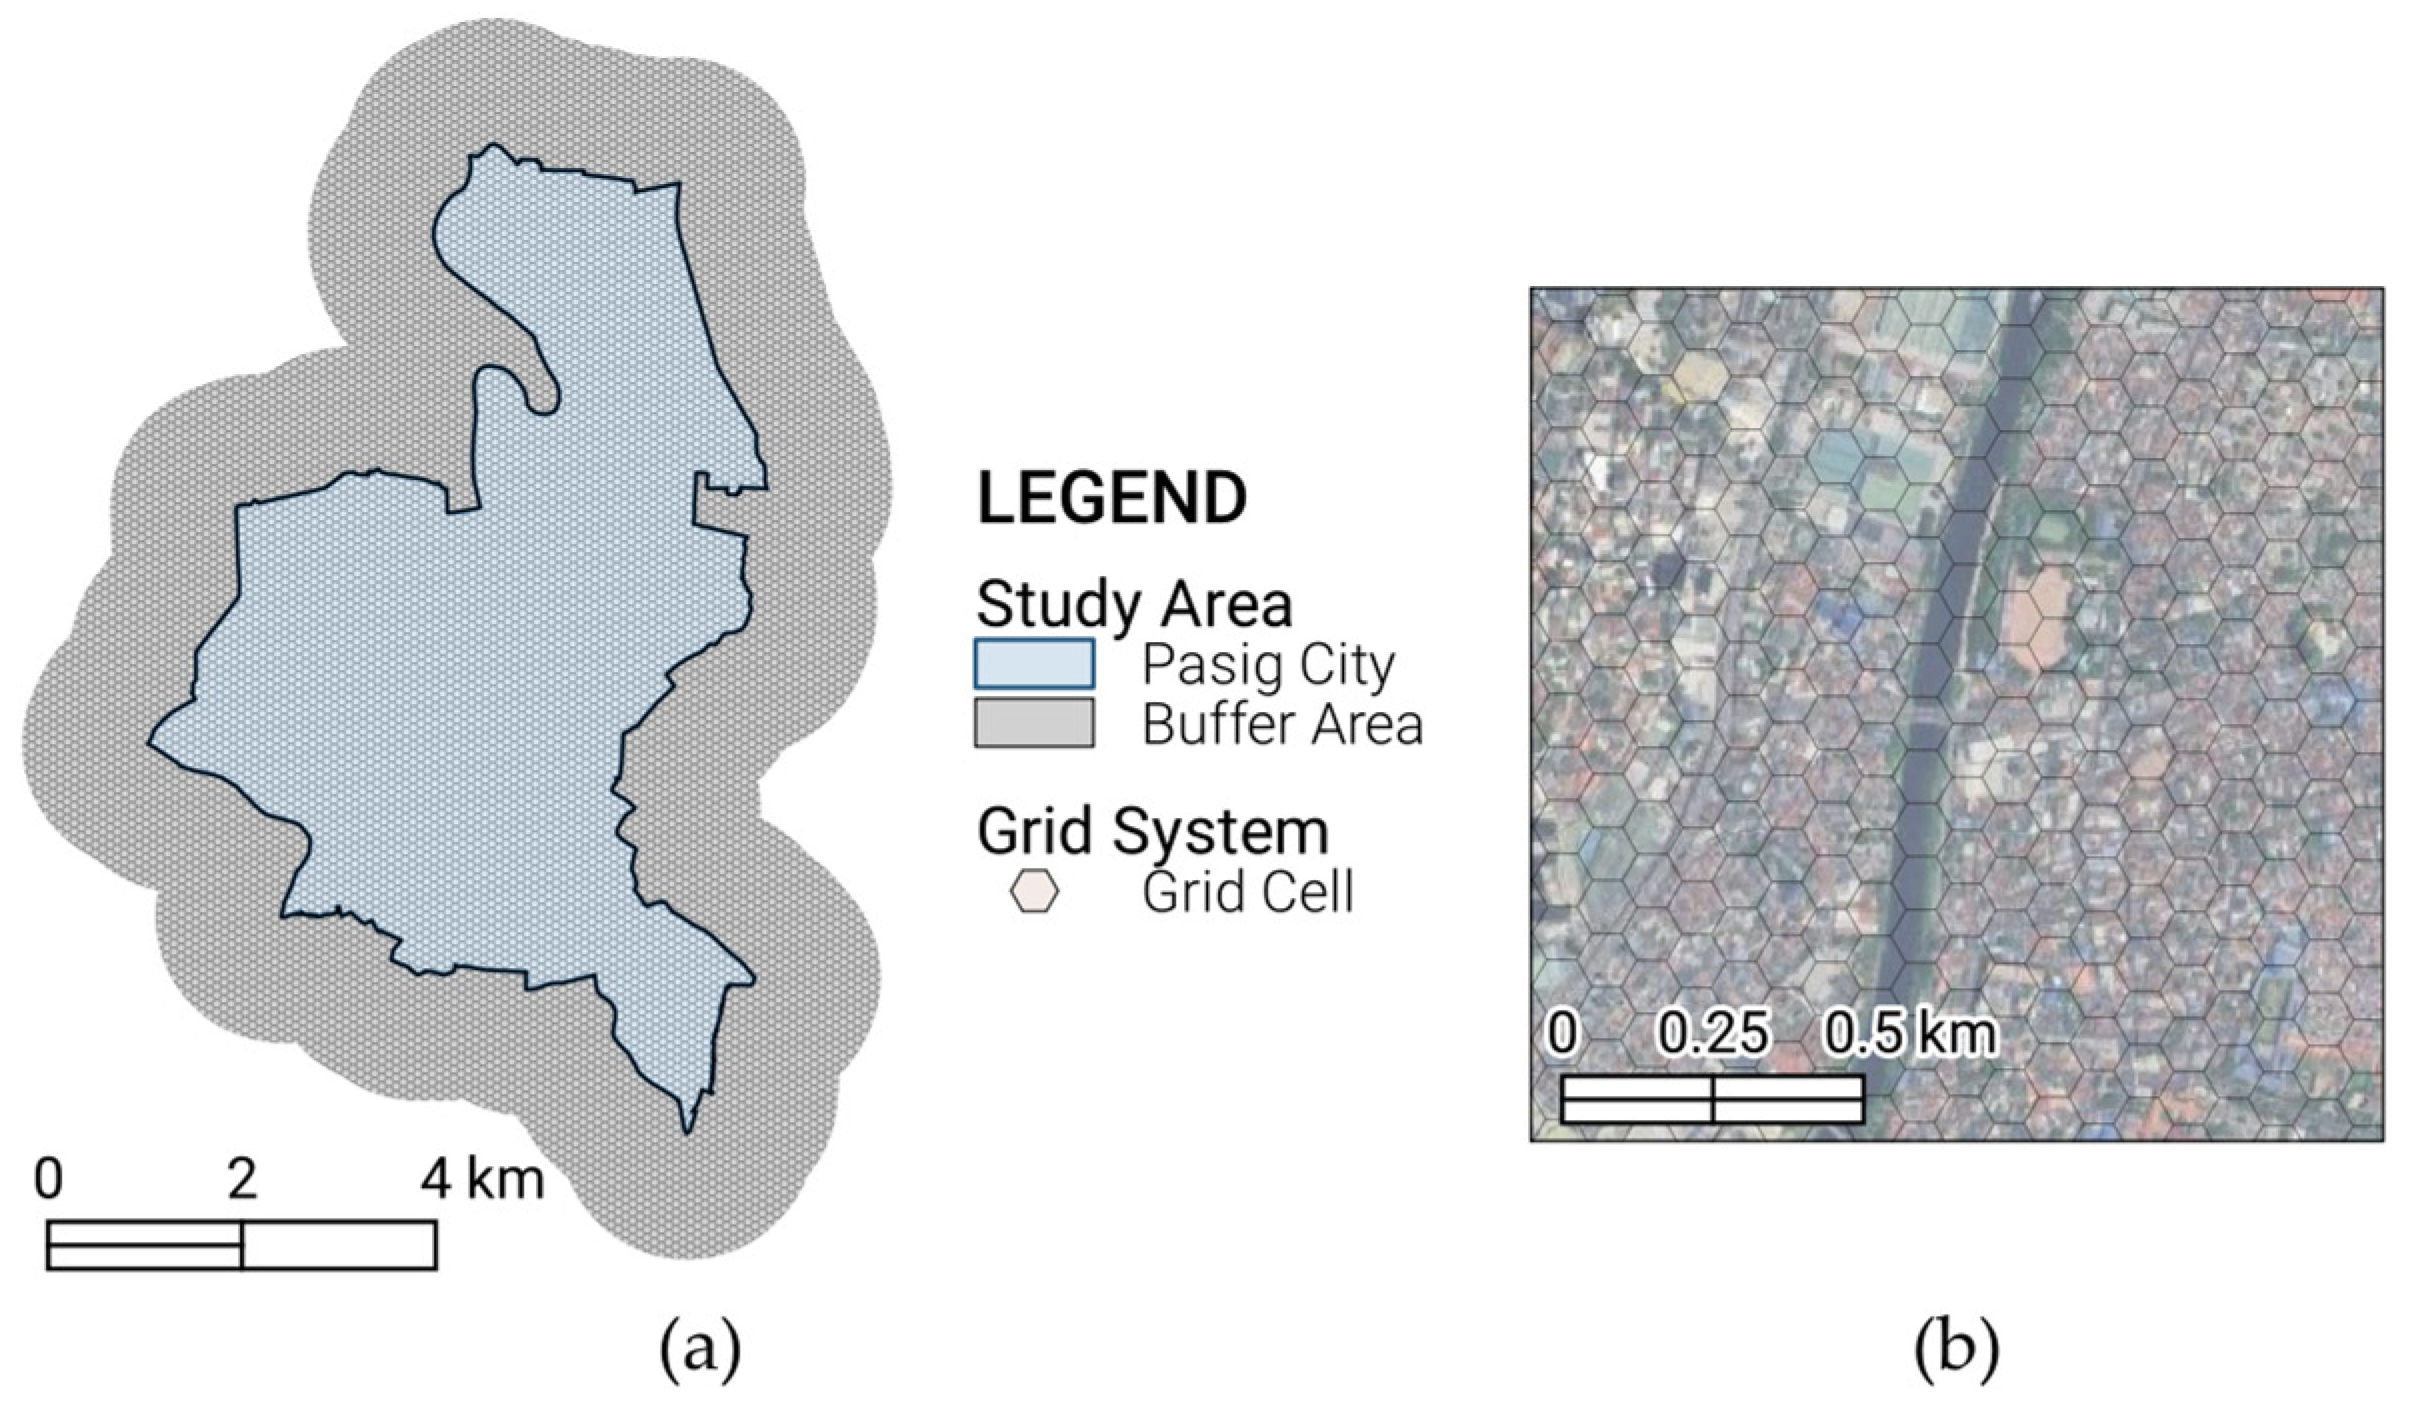
3.5.5. Setting of a Hexagonal Grid Across the Study Area
A hexagonal grid system, illustrated in Figure 6, was generated from the 1.3 km extended buffer area of Pasig City. Each hexagonal cell measured approximately 0.5 m from the center to one corner, having a scope of 0.65 square meters per tile. The cells were set to be the minimum mapping unit of this study. This approach addresses the possible bias in generating the FMCI, which is due to the uneven areas of the city’s barangay blocks. Notably, the setting of the grid system across the study area also enables scalability of determining the FMCI.
Figure 6.
(a) The study area in the hexagonal grid system, consisting of 12,038 tiles. (b) Zoomed-in satellite view within the study area showing the spatial extent of each hexagon.
3.6. Data Processing
This section discusses the intermediate steps in obtaining the FMCI, including the service area generation by network analysis, formulation of POI grid pixel values , Social Function Score , Fifteen Minute City score , and the final computation process to derive the Fifteen Minute City Index .
3.6.1. Network Analysis
The produced sidewalk network was used as the network dataset for the network analysis, which was conducted using ArcGIS Pro’s Network Analyst tool [63]. Points of interest were used to generate facilities and service areas. These service areas represent locations that have access to POIs via a 15 min walk. We established that the age groups have different walking speeds and will, therefore, reach varying distances in 15 min. These distances are listed in Table 7. Service areas originating from each POI were generated at breaks of distances corresponding to those listed above. Each POI had service areas for all age groups.
Table 7.
Distances reached by each age group given the walking speed. Distance was calculated by multiplying the walking speed by 15 min.
3.6.2. POI Grid Pixel Values (PV)
The POI service areas were transformed into the POI hexagonal grid via spatial intersection. Each POI grid cell had five attributes corresponding to the five age groups, with their corresponding pixel values. PVs were either 1, meaning the cell belongs to the corresponding age group’s service area, or 0, otherwise.
3.6.3. Social Function Score (SSF)
Social function scores describe the reach of a social function per age group classification. These were computed using Equation (10).
where
- ;
- ;
- ;
- .
Each age group had a social function score. Table 8 shows a sample computation for determining the .
Table 8.
Sample computation of the for three age groups belonging to the same cell.
3.6.4. Generation of 15-Minute City Scores (SFMC)
Using the social function scores that imply the reach and availability of the social function per age group and the social function weights from experts that quantitively describe the prioritization of social functions per age group, the FMC scores were calculated by multiplying the weight of the social function by the social function scores , rescaling the according to its importance per age group.
where
- 15-min city score;
- ;
- .
To obtain the of the barangays, a spatial join was performed to intersect the Pasig barangay shapefile with the hexagonal grid system. The mean FMC scores per age group of all tiles contained within each barangay were then computed. After this, all barangays subsequently corresponded to FMC scores per age group.
3.6.5. Generation of the 15-Minute City Index (FMCI)
Accounting for the number of people that have access to the SF services, the FMC score of each age group was multiplied by their corresponding population distribution percentage. The products were then summed up to obtain the final FMC scores of each barangay. Equation (10) shows the computation for the FMCI, where the resulting index ranged from 0 to 1, with zero (0) indicating a specific area has no accessibility to any of the six SFs mentioned. In contrast, a score of one (1) indicates an area has access to all six functions within a 15 min distance, fully satisfying the specific needs of each age group.
where
- ;
- ;
- .
The index ranges from 0 to 1, with zero (0) indicating that a specific area has no accessibility to any of the six SFs mentioned. In contrast, a score of one (1) indicates an area has access to all six functions within a 15 min distance, fully satisfying the specific needs of each age group.
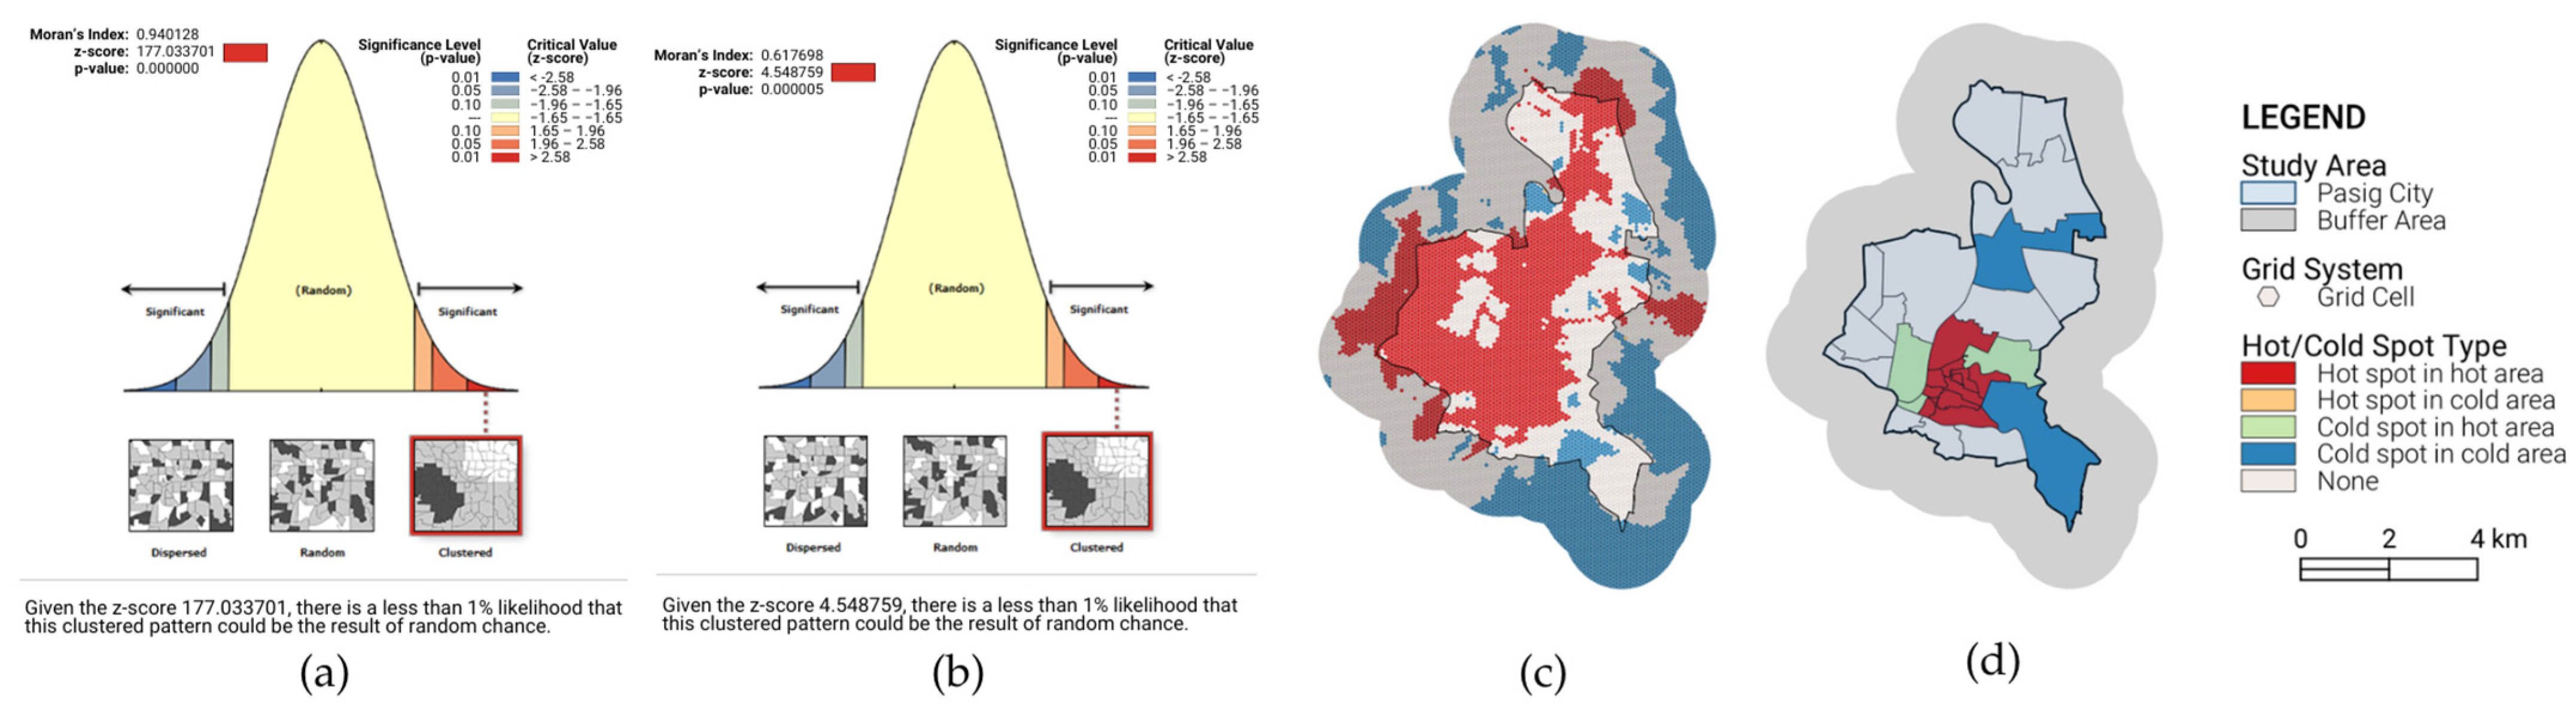
3.7. Spatial and Statistical Analysis of Results
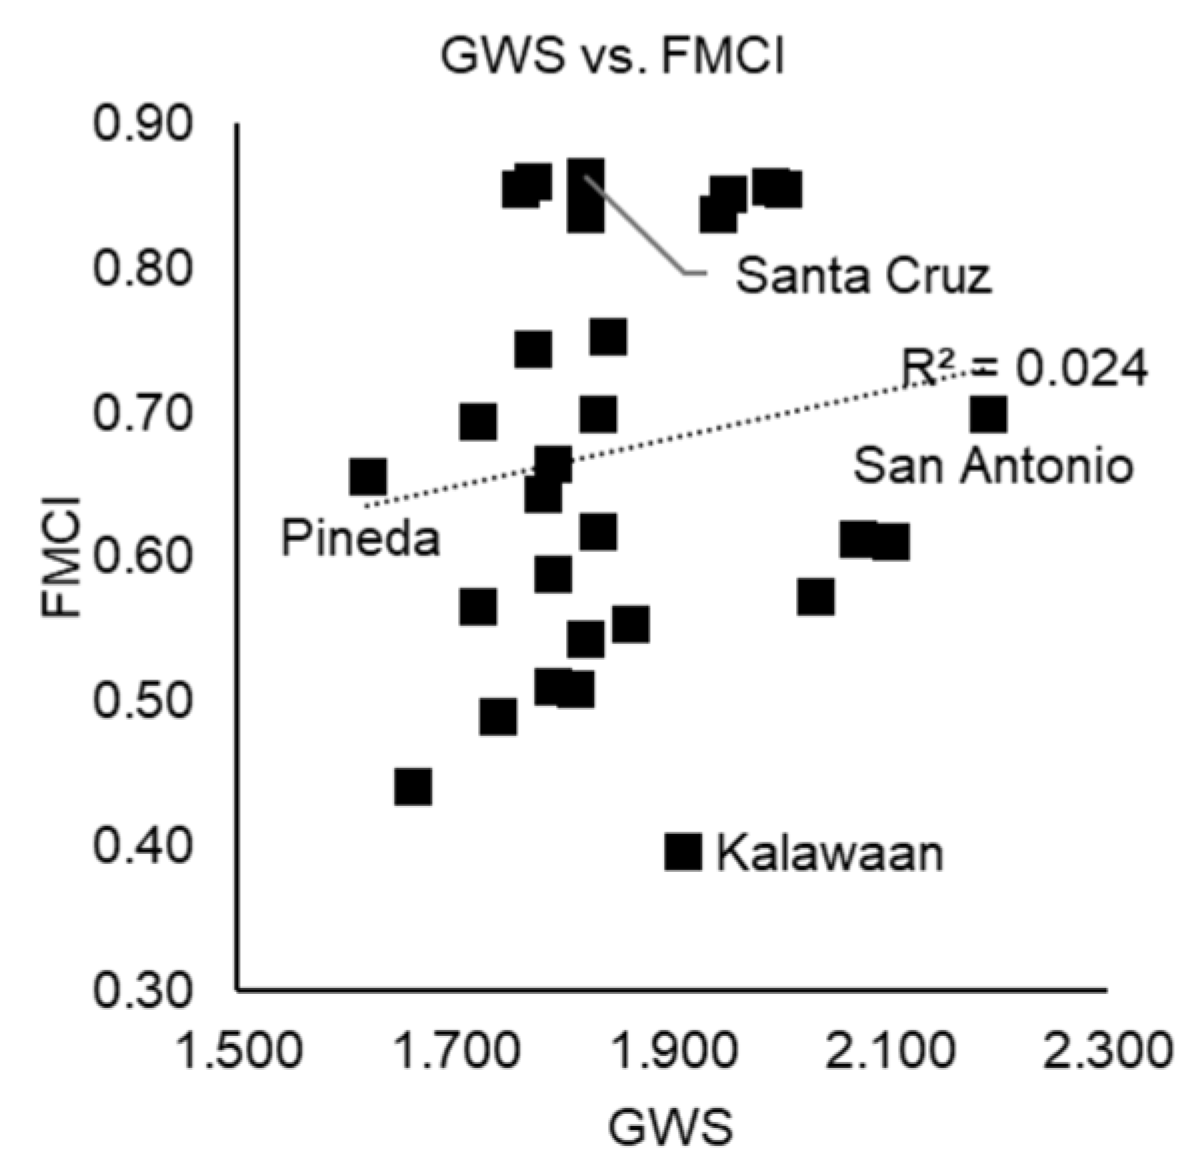
To support the generated grid-based and population-based FMCI, geospatial patterns of the values were explored through spatial autocorrelation and analysis of local clusters and outliers. For spatial autocorrelation, Global Moran’s I was applied for the grid-based and population-based FMCI, including setting the conceptualization of spatial relationships to be inverse distance such that nearer features have a larger influence than farther features. Notably, the distance method applied for spatial autocorrelation was set to be Euclidean distance since adjacent polygonal data in terms of FMCI were the parameters considered. In other words, road network and polygon boundaries were inconsequential. Remarkably, row standardization for spatial autocorrelation was applicable for polygonal and aggregated data. From the Global Moran’s I result, clusters and outliers analysis was further performed for the grid-based and population FMCI to determine areas with significant similarities in FMCI values. It is worth noting that to determine the relationship between the FMCI and GWS of barangays in Pasig City, a linear regression analysis was performed, assessing their correlation through the coefficient of determination (R2).
4. Results
This section discusses the results derived from the methodology described in Section 2. These results include the FMC scores per age group, grid-based FMCI, population-based FMCI, spatial autocorrelation results determining the spatial patterns of the grid-based and population-based FMCI, and the scatter plot analysis identifying FMCI and GWS correlation.
4.1. FMC Scores per Age Group
Figure 7 shows the spatial distribution of FMC scores for each age group.
Figure 7.
FMC scores of the study area in a hexagonal tile system per age group and the mean FMC score of all groups. Pasig City bounds are outlined in black. (a) Age group 7–14; (b) 15–24; (c) 25–44; (d) 55–64; and (e) 65 and above.
For the 7–14 age group (Figure 7a), high FMC scores are in the southern-central part of the city as well as in some parts near the boundary. In the 15–25 age range (Figure 7b), higher FMC scores can be observed in the lower-central region, visually the highest among all age groups. FMC score distribution in other areas was nearly identical to the previously discussed age group. Results for the 25–44 (Figure 7c) and 55–64 (Figure 7d) age groups displayed similar patterns with the other age groups, that is, FMC scores were higher in the central region and near the city boundaries while lower FMC scores were scattered in other areas of Pasig City. For the age group 65 years old and above (Figure 7e), a similar pattern can be observed with other age groups, but a noticeable decrease in locations with FMC scores is apparent. Some areas with high FMC scores for other age ranges recorded lower scores for the last age group, consequently making it the age group to have the lowest distribution of high FMC scores.
4.2. Fifteen-Minute City Index
The FMCI is the comprehensive quantitative value that describes how much the region can access the six social functions (living, working, caring, supplying, learning, and enjoying), as influenced by walkability measures, walking speeds, age group classifications, and social function weights. Further, this section discusses grid-based FMCI and population-based FMCI.
4.2.1. Grid-Based FMCI
From the grid system, each tile had five FMC scores , classified per age group. For every tile, was summarized into a single value that corresponds to the sum of the FMC score across the five age group classifications normalized by dividing it by 5.0, i.e., the perfect total FMC score of all age groups from ages 7 to 65. Figure 8b shows the derived mean FMC scores across the hexagonal grid of the buffered case study area.
Figure 8.
(a) Generated FMCI of barangays in Pasig City. (b) Mean FMC score per cell.
4.2.2. Population-Based FMCI
To integrate demographics as a factor in establishing the FMCI, population distribution per age group classification at the barangay level was integrated as the final weighting factor to the FMC scores. After summing up the products of the FMC scores of each age group and their corresponding barangay population distribution, the 15-min city index of each barangay was generated. This would indicate how many of the actual residents per barangay reach the six social functions within 15 min. Table 9 shows the complete list of barangays in Pasig City and their respective FMCI, sorted from highest to lowest.
Table 9.
FMCI of Pasig City barangays arranged from highest to lowest.
Brgy. Santa Cruz recorded the highest FMCI of 0.865, whereas Brgy. Kalawaan attained the lowest FMCI of 0.396. Although no barangay achieved a perfect FMCI of one (1), 90% or more than half of the barangays recorded an FMCI of 0.5 or higher, implying a relatively high alignment of Pasig City barangays with the FMC concept. Figure 8a displays the generated FMCI of barangays using natural breaks classification.
As shown in Figure 8a, a noticeable clustering of barangays with higher FMCI can be observed in the southern, central part of Pasig City. In contrast, barangays with lower FMCI are scattered in the northern and southern regions of the city. Barangays with relatively high FMCI can also be found near the boundaries of Pasig City, particularly in the south-western area of the city, which connects to the cities of Makati, Mandaluyong, and Taguig.
4.3. Spatial Statistics
To identify significant geospatial-based patterns, spatial autocorrelation, local clusters, and outliers were explored. This would indicate where the 15-min city is significantly achieved in clusters in the case study area, Pasig City. It must be noted that spatial statistics by global and local spatial autocorrelation may provide context as to which regions have high or low accessibility to the six social functions. Due to significant clustering, spatial disparity may also be implied.
4.3.1. Spatial Autocorrelation (Global Moran’s I)
Figure 9a,b present the results of the global spatial autocorrelation through Moran’s I statistic in both the grid-based FMCI and the population-based FMCI per barangay.
Figure 9.
Spatial autocorrelation of grid-based FMCI versus population-based FMCI, showing significant FMCI similarity or dissimilarity of the spatial unit and its neighboring units: (a) Global Moran’s I of the grid-based FMCI. (b) Global Moran’s I of the population-based FMCI per barangay. (c) Hot spots and cold spots of grid-based FMCI overlayed by the extents of the city. (d) Hot spots and cold spots per barangay in Pasig City.
The Moran’s I statistic of the grid-based FMCI was 0.940128, implying positive spatial autocorrelation as it was greater than zero. This indicates significant clustering of FMCI in tiles. In line with this, the significance of the clustering may be reviewed through its z-score of 177.033701 and p-value of absolute zero, indicating that the Moran’s I lies on the tail end of the normal distribution. In other words, there is a less than 1% likelihood that this clustered pattern of barangays’ FMCI values could be the result of random chance. Likewise, the population-based FMCI at barangay levels showed significant clustering, considering Moran’s I statistic of 0.617698, i.e., positive spatial autocorrelation. Furthermore, the z-score of 4.548759 proves the significance of clustering, where there is less than a 1% likelihood that this clustered pattern could be the result of random chance. In other words, there are clusters of barangays in Pasig City that sufficiently reach the six social functions within 15 min of walking.
4.3.2. Cluster and Outlier Analysis (Local Moran’s I)
Cluster and outlier analyses were explored for both the grid-based and population-based areas at barangay levels to determine the areas with significant similarities in FMCI. These results are illustrated in Figure 9c,d.
Remarkably, the majority of Pasig City consists of hot spots, accounting for 51.49% of the total tiles in Pasig City. This is around 1970 square meters of the city. To put it in perspective, wide areas of FMCI hot spots imply that the 15-min city is achieved uniformly across most of the study area. This is considerably large in percentage compared to the consistent areas of cold spots, which is only 6.47% of the city’s grid or 247.7 square meters in total. Note that cold spots in cold areas imply uniformly low measures of 15-min city achievement. Other than that, only 0.04% (hot spot in cold areas) and 0.06% (low spot in hot areas) are outliers. The outliers only cover 3.8 square meters. The remaining extents of the city (41.93%), however, are dispersed in terms of the FMCI.
The FMCI clusters and outliers at the barangay level differed from those at the grid level, showing that the hot spots in hot areas are aggregated in the southern-central barangays of the city, unlike that of the grid-based FMCI that spanned across the city. Such a result may conclude that the integration of the demographics, in terms of the population, proportioned the FMC scores significantly with respect to the number of actual residents per barangay that reach the six social functions within 15 min. Other than the integration of population, geometric variations in terms of shape and area may be attributed to the difference between grid-based FMCI and barangay population-based FMCI clusters and outliers.
Nonetheless, Table 10 presents the summary of clusters and outliers based on FMCI at the barangay level. A total of 12 out of 30 barangays were clustered hot spots of FMCI, which Figure 9 presents in the southern-central part of the city. Notably, 2 out of 30 barangays were tagged to be clustered cold spots of FMCI, but these barangays account for 19.61% of the city’s total area. It may also be noted that low FMCI barangays surrounded by high FMCI barangays (cold spot outliers) are 3 out of 30 barangays, which is 8.26% of the city’s area. Strikingly, the majority of Pasig City’s FMCI at the barangay level is dispersed. This is 13 out of 30 barangays, and 62.50% of Pasig City’s area.
Table 10.
Hot spots and cold spots of barangay FMCI in Pasig City.
To summarize, the clustering of high FMCI spans across most of the study area for a grid-based system. However, population-based FMCI at barangay levels mostly shows dispersed FMCI. Clusters of high FMCI at barangay levels only refer to 12 out of 30 barangays, which is 9.63% of the city in terms of area.
4.4. Walkability and FMCI
The General Walkability Scores from the study of [44] were used to set the sidewalk network’s impedance values. Every barangay had a GWS similar to an FMCI derived from this methodology. Figure 10 shows the GWS-FMCI plot of barangays in Pasig City. The linear regression value of indicates a significant correlation albeit low between the barangay’s walkability and its 15-min city index.
Figure 10.
Scatter plot of general walkability score and FMCI of barangays in Pasig City.
4.5. Sensitivity Analysis of Social Function Weights
The sensitivity analysis was performed for each age group, with seven iterations per group. Table 11 shows the average standard deviation of social function score per age group. Further, Figure 11 shows the New SF Scores vs. Old SF Scores plot per age group classification.
Table 11.
Sensitivity Analysis standard deviations and R2.
Figure 11.
Scatter plot of New Score (sensitivity analysis) and Original Score of social functions per age group: (a) 7–14; (b) 15–24; (c) 25–44; (d) 45–64; (e) 65+.
From the average standard deviation per age group, the sensitivity analysis showed a low effect on the social function scores, implying that the weights mainly used as one of the factors of the FMCI are stable, even when an expert’s ranking changes. Additionally, the five linear regression values were , and for each of the five age groups. Looking at the values and the distributions of points, Figure 11 implies that the new and original social function scores have a high likeliness with each other. Hence, the social function weights are not sensitive to changes, and subjectivity from the expert rankings does not impose a significant effect on the FMCI.
5. Discussion
5.1. Benchmarking of the Fifteen-Minute City Score
The FMC Score was compared to the SmartHubs Accessibility Tool, an automated testing tool for mobility hub scenarios that was supported by the European Commission [64,65]. In particular, the tool measures the accessibility of healthcare, entertainment, restaurant/café/bar, education, supermarket, and service amenity classifications through different transportation modes such as walking within 15 min [65]. Comparatively, the development of an FMCI focuses on an index that measures how close an area is in achieving 15 min accessibility to living, working, supplying, caring, learning, and enjoying social functions. As such, the mobility hubs from SmartHubs were benchmarked to FMC Scores per age group to review the agreement between the two accessibility metrics. FMC Scores per age group are specific to the social function they prioritize, thus representing their likeness to the amenity classification from the SmartHubs Accessibility Tool. Notably, the age group of 65 years old and above was assigned with caring social function as the highest-weighted social function. Thus, the FMC Score of the age group 65 years old and above was benchmarked to the mobility hub scenarios of healthcare amenities in Pasig City. Table 12 presents the agreement between the accessibility extents of the SmartHubs Accessibility Tool and that of the FMC Score of the study by the percentage of overlapping grids.
Table 12.
Accessed healthcare facilities from SmartHubs vs. FMC Score at the grid level.
Considerably, the FMC Score extents of 0.29–0.58 compared to the 0–10 healthcare facilities extents from SmartHubs Accessibility Tool are 63.69% similar. This is followed by 45.48% and 44.51% agreement of the FMC Score extents of 0.29–0.58 compared to the 10–20 and 20–30 healthcare facilities extents, respectively. It is to be noted that most grids of the study area belong within the 0.29–0.58 FMC Score. Thus, it may be expected that the extent agreement of the FMC Score for 0–0.29 and 0.58–0.87 compared with healthcare mobility hubs of SmartHubs Accessibility Tool are minimal. Nonetheless, the two accessibility metrics that were benchmarked present a degree of agreement.
5.2. Implication of the Fifteen-Minute City Index Values
This study computed for the 15-min city indexes of the barangays of Pasig City, Philippines, relying on previously studied walkability data as network analysis service area impedance, using open-sourced facility locations data, and using walking speeds of different age group populations as parameters. From the results in 4.2, we discovered that the barangays in the southern-central part of the city have higher FMCIs than the rest of the city. This area of Pasig, also informally known as its poblacion or downtown area, is home to the city hall and other key public service facilities, which made these barangays have higher social function scores for the Living SF. Interestingly, the findings align with other 15-min city assessment studies that found higher levels of accessibility to urban services in central areas and developed peripheral areas, relating longer historical trends of development to higher 15-min city index scores [21,66]. The results of the developed FMCI in the present study show alignment with the idea that historical and administrative centers, which have been developed for a long time, consist of a higher number and variety of services, and thus are in closer proximity to achieving the FMC ideals. Currently, although there are cities in the Philippines exploring the 15-min city initiative [67], there has been a lack of studies quantitatively analyzing the conformity of cities to FMC, limiting the potential comparison of the present results to other cities that have similar urban designs or structures. However, this also highlights the necessity for an applicable tool to assess urban areas in the local context, which this study offers.
Furthermore, population distribution showed significant importance to the results of the present study. From Section 4.2, the grid-based result (Figure 8b) displayed scattered high FMCI values across the city, but when grids were generalized into barangays and population distribution was considered, the high FMCI values became concentrated in the south-central area. In contrast, moderately high FMCI values are observed in the western region and areas south of the hot spots zone. This demonstrates that the population distribution introduced a change in the pattern, resulting in the population-based FMCI of barangays. However, further analysis can show that the population size of a barangay does not significantly affect its corresponding FMCI. Figure 12 provides a visualization of Pasig City’s population vs. FMCI values at the barangay level. Furthermore, Brgy. Pinagbuhatan, which has the largest population of 163,598, achieved the second to the lowest FMCI, while Brgy. Bagong Katipunan, which has the smallest population size of 879, attained the fourth-highest FMCI among the barangays. Brgy. Sta. Cruz, which attained the highest FMCI, has a population of 5610, whereas Brgy. Kalawaan, which recorded the lowest FMCI, has a population of 32,145. This might indicate the lack of significance of population size in determining the conformity of an urban area to the FMC concept. This result aligns with the findings of Bartzokas-Tsiompras and Bakogiannis [68] and Ellder [69], who argue that such a result implies that 15-min city planning is achievable even in cities of smaller and medium sizes.
Figure 12.
Bivariate choropleth map of Pasig City population per barangay vs. FMCI per barangay.
In terms of population density, Brgy. Sto. Tomas, Brgy. Palatiw, and Brgy. Sagad, which are the three barangays with the highest population density in Pasig City [70], recorded relatively high FMCIs of 0.861, 0.838, and 0.855, respectively. This finding reflects similar observations from the studies of Gaglione et al. [29] and Shatu and Kamruzzaman [71], who found that densely populated areas have a higher probability of being 15-min areas. Yet, the results of the present study display a different observation for barangays with low population density. For instance, Brgy. Bagong Katipunan, Brgy. Sta. Rosa, and Brgy. San Jose, which are the three barangays in Pasig City with the lowest population densities [70], recorded FMCIs of 0.856, 0.573, and 0.879, respectively. This indicates that sparsely populated barangays can still achieve high FMCI values, contrary to the study of Elldér [69], which concluded that increasing population density plays a predictable role in achieving the 15-min city ideals. Notably, the incorporation of the population, along with the diverse points of interest, highlights the alignment of the developed index with the FMC concept by accounting for the density and diversity, which are two of the most important dimensions of the sustainable planning of a 15-min city [7].
5.3. Accessibility and Walkability
Critics of 15-min city assessments argue that the FMC is mostly associated with proximity to essential services exclusively, although there is a collective finding in the existing body of urban planning literature that perceptions and diversity of services influence accessibility [72]. The results of the present study tackle this limitation as the findings are derived from data that take into consideration the variability of the actual travel behavior of people, which is important in addressing the aforementioned issue [26]. Hence, by accounting for varied walking speeds and assigning weights to points of interest and social functions based on the needs of each age group, this research assesses the alignment of urban areas with FMC concepts more comprehensively. Indeed, as evident in Figure 5, this study has shown that FMC scores are significantly different for each age group, demonstrating the influence of the weighted parameters in the results.
Additionally, the present research explored a new method by utilizing walkability scores of Pasig City roads as an impedance for the service area generation. This is to reflect the significance of walkability in 15-min cities, which is grounded in sustainability and inclusivity [33,34]. However, a low correlation was found between the walkability scores and the FMCIs. This could stem from the combination of the parameters utilized in the research methodologies between the two metrics. Since this study used varied walking speeds, weighted POIs, and weighted SFs, the influence of the walkability scores on the result significantly decreased. For instance, Brgy. Santa Cruz, which recorded the highest FMCI, had a relatively lower walkability score than Brgy. Kalawaan, which attained the lowest FMCI. Although high walkability lowered the impedance in the generation of service areas, other factors, such as low population distribution and concentration of the points of interest, could have reduced the practical impact of walkability as impedance.
Moreover, it is worth noting that the walkability scores utilized came from a study conducted during the COVID-19 pandemic (late 2021 to the mid-2022) when site visits were prohibited, causing the researchers to employ a simplified walkability index consisting of GWI parameters that can be observed through Google Street View [44]. This may have caused impact in the result by not perfectly reflecting the actual ground walking conditions in the study area. Although the present study utilized walkability scores measured generally across the barangays of Pasig City, future research may explore alternative methods for obtaining walkability scores such as utilizing other available walkability evaluation tools, using combinations of methods to measure walkability, or further refining parameters of existing walkability indexes to cater to more specific needs of different age groups. For instance, immaterial barriers to accessibility and walkability may be further explored, requiring non-open-source data. These immaterial barriers may include much in-depth modeling of the subject population by adding a layer of barangay-level data to describe the socioeconomic characteristics, e.g., household income levels, employment rates, etc., which may influence FMCI. Other than demographic data, walkability with regard to environment-focused data such as air quality and heat island metrics may be considered to practically demonstrate the pedestrian experience in walking activity in conjunction with the 15-min city.
5.4. Pasig City FMCI as the Model
This study provided a model for the derivation of FMCI using Pasig City as the case study. Solving for the FMCI in other cities in the Philippines, as well as worldwide, can be done by replicating the methodology indicated in this paper, with sufficient data and software. All data used in this study are open-sourced, including the POIs and sidewalk network, sourced from OpenStreetMap [55]. Population data and shapefiles were also publicly accessed from the Humanitarian Data Exchange website [52], and the methodology may be executed in non-commercial software. The nature of the FMCI model in the present study tackles the data availability and computational cost challenges mentioned in the study of Lima and Costa [73] about existing computational methods for 15-min cities. With the replicable framework provided in this study, even city governments with limited budgets may be able to assess urban areas according to FMC ideals.
Furthermore, the methodology in the present study provides innovative FMC assessment by integrating factors that comprehensively capture the FMC concept. This study highlights the heterogeneity of the population in an urban area as its focus. For instance, different walking speeds were assigned to different age groups, which differs substantially from other studies that used an average walking speed to assess the accessibility of urban amenities [21,23,74]. The present study also depicted the diversity of the points of interest by considering the varied importance of services for different age groups and assigning corresponding weights to them. Considering the network characteristics, which is important to provide more accurate and realistic results in FMC assessments [14], we incorporated walkability scores of the roads in the study area, making it the first study to utilize them as impedance in service generation from POIs. This is markedly different from other studies that incorporated network characteristics by excluding poorly designed sidewalks in the assessment process [29,75], which subsequently poses a challenge in capturing the entirety of the network links and assessing cities in a more thorough manner. The study also enhances the methodology proposed by Capasso Da Silva et al. [75] by extending the network analysis beyond the boundaries of the study area, avoiding the impact of inaccurate assessments on areas near the city border—a constraint recognized in the aforementioned study.
Nevertheless, while aiming to provide a replicable and in-depth FMC assessment, the present study recognizes its limitations. Firstly, relying on open-source data could be a drawback as it may include outdated information. Building upon the concepts established in the Pasig model, further FMCI calculations can be refined with POI and sidewalk network data that are verified on the ground and are better reflective of the actual foot traffic of the area. Moreover, the walking speeds used were derived from a study that defined walking speeds for a different set of age groups [53]. Modifying the walking speed data for FMC assessment may include exploring alternative data sources or collecting firsthand data to incorporate walking speeds that are precisely aligned with the defined age groups in the present study. Another data limitation of the study is that the weights assigned to services and social functions heavily depended on expert opinions. Although this approach is resource-efficient, modifications of the FMC assessment could employ the use of surveys or other methods to determine the weights of urban amenities based on the residents to better reflect their needs and preferences. Additionally, although the walkability scores were obtained from a relevant local study, their generalization at the barangay level may obscure accuracy. Improving the walkability data could involve employing a manual scoring approach like Google Street View-based evaluations using refined walkability parameters, as well as other recommendations discussed in Section 5.3.
5.5. Fifteen-Minute City Adoption
The developed FMCI demonstrates alignment with the people-centric FMC concepts by including demographic characteristics and walking as transportation, thus providing results consistent with the underlying principles of a 15-min city. This highlights the reliability of the index, specifically its potential use for adoption in assessing other urban areas. Results that can be derived from the developed index may assist city governments in crafting policies that enhance the quality of life in the urban area. For instance, the analysis of the FMCI variations across the city may help in enhancing land use and zoning regulations by identifying areas where specific types of services are concentrated or dispersed.
In the case study area of Pasig City, a positive spatial autocorrelation was observed in both the grid-based and population-based FMCI, as discussed in Section 4.3.1. This implies close spatial proximity of areas with similar FMCI values. Exploring in greater detail, the cluster and outlier analysis shown in Section 4.3.2 highlighted the collective presence of hot spots in the southern-central part and cold spots in most parts of the city. A closer examination of the cold spot areas would identify abundant and lacking services. These inadequacies influence their FMCI and accordingly support the creation of enhanced zoning regulations to ensure equitable resource distribution. Similarly, a focused analysis of the hot spot areas could be beneficial to identify zones for investment opportunities, advancing the economic growth of the city. In-depth studies of these areas may also reveal environmental challenges and tensions that could have arisen from urban development. Involving residents from FMCI cold spots and hot spots areas in participatory planning would prove useful in assessing the specific needs and challenges experienced in their respective communities. This will help tailor urban areas to the needs of residents, improving their community participation, which is an important aspect of a 15-min city.
Notably, despite the HUC status of Pasig City, it was not able to record high FMCI across the whole area. Furthermore, no barangays were able to attain a perfect FMCI. This can imply that the city favors industrial demands more than urban mobility. The principle of the 15-min city is to standardly promote walking as an active mode of transportation instead of reinforcing car-centric modes of transportation. For walking to be promoted, however, residents should be able to maximize their time in reaching their needs, which are classified as the six social functions. Furthermore, walking to and from the service they intend to access should be convenient.
In that case, deficiency in terms of the developed FMCI may imply the need to examine how much of the population is reinforced to active living and community participation. This case study may be presented to highlight the challenges in adopting the 15-min city in the Philippines, which are low funding allocation for pedestrian-based transport; lack of local job opportunities, i.e., majority of the jobs are non-teleworkable; threats of gentrification; and the traditional land use zoning paradigm [76]. For instance, form-based coding as a zoning strategy has been promoted to align with the principles of FMC, such that the strategy focuses on mixed-use land to decentralize services and ensure that residents across an urban area have access to the essential amenities. However, the traditional and use-based code zoning strategy, which establishes strict land use permits, is still in place. This study challenges the local government units in city planning and development to review such a zoning strategy, specifically its implication on the modes of transportation, service accessibility, and overall spatial segregation. Aside from zoning strategies, cities that have adopted the 15-min city principles made attempts to lessen car-centricity, which may also be initiated by other local governments. For instance, Paris reclaimed car-dominated public spaces to cater more spaces for basic services during the COVID-19 pandemic [77]. Similarly, Valenzuela City, Pasig City, and Quezon City in the Philippines have implemented car-free days to encourage active social participation in the urban city [76,78]. Another notable implementation of 15-min city principles is the Iloilo City River Esplanade that has promoted recreational activities along with ecological sustainability [76,79]. Notably, Pasig River Esplanade has been initiated as a rehabilitation and urban renewal project in 2024 [80]. Indicatively, FMCI offers a compelling rationale for other HUCs to assess their urban areas based on the developed FMCI, which focuses on the weighted importance of amenities, walkability of pedestrian roads, and population distribution by age group.
6. Conclusions and Recommendations
This study reinforces the people-centric urban planning concept of a 15-min city by developing an index that measures how close an area is to accessing essential services under the six essential urban social functions (living, working, supplying, caring, learning, and enjoying) within a 15-min space-time frame. The development of the 15-min city index (FMCI) was based on the multi-criteria geospatial framework, which establishes the interplay and relation of the POIs, defined age groups, and the age distribution population in the creation of FMCI using open-source data. Summarizing all the data requirements and required processes serves as the main reference for the utilization and potential adoption of the index.
With a focus on walking as an active mode of transport, walking speeds based on defined age groups and walkability scores of pedestrian walkways in Pasig City were utilized. The walkability scores were incorporated to account for the walkway conditions in Pasig City and determine accessibility to essential services. Using walkability scores as impedance produced service areas of each social function POI for all age groups on the hexagonal grid system.
Results after integrating the population distribution to the grid-based FMCI presented the FMCI of the barangays in Pasig City. It was revealed that no barangays were able to achieve a perfect FMCI, but 90% of them attained an FMCI of 0.5 or higher. This is further confirmed by the spatial statistics performed such that the clustering of the FMCI was statistically significant, and high population-based FMCI barangays were found in the southern-central part of the city, where the municipal building lies. Although 12 out of 30 barangays were considered FMCI hot spots, they only accounted for less than 10% of the city’s total area, while cold spots are dispersed across most of the city.
Nonetheless, further studies regarding the development of FMCI may consider avenues for integrating more geospatial layers of data that would provide more depth in describing the status quo of the urban community and urban planning strategies. Other demographic characteristics may be included to explore significant shifts in the areas with high FMCI once integrated. Economic characteristics of the population may be one of these characteristics, considering the gentrification threats denoted as a challenge in achieving FMC. Specifically, future research may consider the socioeconomic diversity in cities, which has not been adequately addressed in existing studies about 15-min city assessments. Acknowledging that different social classes have different needs [81], analyzing the urban amenities may be improved by factoring these socioeconomic distinctions through assigning unique weights and considering the varying populations of the different social classes. This would ensure better representation of the residents, leading to a more comprehensive assessment of cities. Insights from such an approach would highlight the “inclusivity” of urban areas, which is significantly emphasized in the 15-min city concept [6].
Furthermore, considering the significant change of areas with high FMCI in grid-based FMCI versus population-based FMCI, future studies may venture on a grid-based FMCI with integrated population data in grids as well. While the present study utilized barangay census data to incorporate population distribution, future research could explore methods to acquire fine-scale population data, such as conducting surveys in households, to enhance the level of detail of demographic analyses and enrich the FMC analysis. The same applies to the opportunity to refine walkability measures, such that the scores are edge-based rather than the barangay-based level of detail. Other than that, active modes of transportation such as cycling may be integrated into achieving the FMC considering the cycling trend and the initiative of bicycle lanes in the Philippines post-COVID-19.
Remarkably, Carlos Moreno, who first promoted the FMC concept, highlights the ubiquity factor, aside from the principles of diversity, proximity, and density [13]. Ubiquity focuses on the city’s technology in building a smart city, promoting efficiency and low costs of living. In that regard, incorporation of the city’s degree of digitalization may be explored: data regarding teleworkable jobs, citizen’s digital files, and digital twins [76] are examples of FMC manifestations employed in cities that have initiated FMC principles.
Finally, the utilization of open-source data to measure how much a region aligns with the 15-min city principles may be further leveraged by ground-truth validation or expert assessment. Ultimately, the development of a 15-min city index or FMCI may provide valuable insights to assist city governments in crafting people-centered, sustainable urban planning policies. For instance, analyzing the FMCI variations in the area may pinpoint areas for improvement in accessibility and walkability. In this regard, the present research aligns with the United Nations Sustainable Development Goal 11, aiming to create inclusive, safe, resilient, and sustainable cities and human settlements [82]. By developing an index that can assess cities based on their alignment with the people-centric FMC concepts and parameters, this research supports the advancement of enhanced urban strategies for sustainable urban development.
Author Contributions
Conceptualization, Carlo Angelo R. Mañago, Marielle G. Nasalita, Cesar V. Saveron, Ynah Andrea D. Sunga and Alexis Richard C. Claridades; methodology, Carlo Angelo R. Mañago, Marielle G. Nasalita, Cesar V. Saveron and Ynah Andrea D. Sunga; software, Carlo Angelo R. Mañago, Marielle G. Nasalita, Cesar V. Saveron and Ynah Andrea D. Sunga; validation, Alexis Richard C. Claridades; formal analysis, Carlo Angelo R. Mañago, Marielle G. Nasalita, Cesar V. Saveron and Ynah Andrea D. Sunga; investigation, Carlo Angelo R. Mañago, Marielle G. Nasalita, Cesar V. Saveron and Ynah Andrea D. Sunga; resources, Alexis Richard C. Claridades; data curation, Carlo Angelo R. Mañago, Marielle G. Nasalita, Cesar V. Saveron and Ynah Andrea D. Sunga; writing—original draft preparation, Carlo Angelo R. Mañago, Marielle G. Nasalita, Cesar V. Saveron and Ynah Andrea D. Sunga; writing—review and editing, Carlo Angelo R. Mañago, Marielle G. Nasalita, Cesar V. Saveron, Ynah Andrea D. Sunga and Alexis Richard C. Claridades; visualization, Carlo Angelo R. Mañago, Marielle G. Nasalita, Cesar V. Saveron and Ynah Andrea D. Sunga; supervision, Carlo Angelo R. Mañago and Alexis Richard C. Claridades; project administration, Carlo Angelo R. Mañago, Marielle G. Nasalita, Cesar V. Saveron, Ynah Andrea D. Sunga and Alexis Richard C. Claridades. All authors have read and agreed to the published version of the manuscript.
Funding
This research received no external funding.
Data Availability Statement
The raw data supporting the conclusions of this article will be made available by the authors on request.
Acknowledgments
The authors express their deepest gratitude to the experts consulted in developing the services and social function prioritization. These experts are Gerardo Lanuza, Carlos Primero Gundran, Rhea Lyn Dealca, Ma. Afrecita Nieva, Aurora Llige, John Abletis, Jonathan Guevarra, Carlyn Ann Ibañez, Dominique Sasha Amorsolo, Kristian Karlo Saguin, and Ana Clara Caixeta Szymanski Nogueira.
Conflicts of Interest
The authors declare no conflicts of interest.
Appendix A
This section contains the complete pertinent table of values used in this study.
Table A1.
Priority scores given by experts to services and the corresponding service scores.
Table A1.
Priority scores given by experts to services and the corresponding service scores.
| SF | Service | Priority Score Given by Expert | Service Score | ||||||
| #1 | #2 | #3 | #4 | #5 | #6 | #7 | |||
| Living | Transportation | 3 | 3 | 3 | 3 | 3 | 3 | 3 | 1.000 |
| Bills payment | 1 | 1 | 3 | 3 | 1 | 3 | 2 | 0.667 | |
| Loading | 1 | 3 | 1 | 3 | 1 | 2 | 1 | 0.571 | |
| Money withdrawal | 2 | 2 | 1 | 3 | 2 | 3 | 2 | 0.714 | |
| Public parking | 1 | 3 | 1 | 2 | 3 | 3 | 1 | 0.667 | |
| Crime prevention and investigation | 3 | 1 | 3 | 3 | 3 | 3 | 2 | 0.857 | |
| Traffic enforcement | 1 | 3 | 3 | 3 | 3 | 3 | 2 | 0.857 | |
| Washing, drying, and folding of clothes | 3 | 3 | 1 | 3 | 1 | 3 | 2 | 0.762 | |
| Repair services | 1 | 1 | 3 | 2 | 1 | 3 | 2 | 0.619 | |
| Internet retail | 3 | 2 | 3 | 2 | 1 | 3 | 1 | 0.714 | |
| Electricity retail | 3 | 3 | 3 | 3 | 1 | 3 | 2 | 0.857 | |
| Water supply | 3 | 3 | 3 | 3 | 1 | 3 | 3 | 0.905 | |
| Sanitation services | 3 | 3 | 3 | 3 | 1 | 3 | 3 | 0.905 | |
| Working | Manufacturing | 2 | 1 | 1 | 2 | 1 | 3 | 3 | 0.619 |
| Wholesale distribution | 1 | 1 | 3 | 2 | 1 | 3 | 3 | 0.667 | |
| Retail service | 3 | 3 | 3 | 2 | 3 | 3 | 3 | 0.952 | |
| Wholesale distribution | 1 | 1 | 3 | 2 | 1 | 3 | 3 | 0.667 | |
| Retail services | 3 | 3 | 3 | 2 | 3 | 3 | 3 | 0.952 | |
| Co-working spaces | 1 | 3 | 3 | 2 | 2 | 3 | 1 | 0.714 | |
| Corporate headquarters | 1 | 1 | 1 | 2 | 2 | 2 | 2 | 0.524 | |
| Warehousing/storage | 1 | 1 | 1 | 2 | 1 | 3 | 2 | 0.524 | |
| Treasury management services | 1 | 1 | 3 | 2 | 3 | 3 | 2 | 0.714 | |
| Lending services | 1 | 3 | 1 | 2 | 3 | 2 | 2 | 0.667 | |
| Insurance services | 1 | 1 | 3 | 2 | 2 | 3 | 2 | 0.667 | |
| Maintenance services | 2 | 3 | 3 | 2 | 3 | 3 | 2 | 0.857 | |
| Supplying | Selling of food and beverages | 3 | 3 | 3 | 3 | 3 | 3 | 3 | 1.000 |
| Selling of food and beverages | 3 | 3 | 3 | 3 | 3 | 3 | 3 | 1.000 | |
| Selling of non-food items | 2 | 2 | 1 | 3 | 2 | 3 | 3 | 0.762 | |
| Pick up services | 2 | 3 | 1 | 3 | 1 | 2 | 2 | 0.667 | |
| Delivery/courier services | 3 | 3 | 3 | 2 | 3 | 3 | 2 | 0.905 | |
| Charging stations | 1 | 3 | 1 | 2 | 3 | 2 | 2 | 0.667 | |
| Clearance issuance | 2 | 2 | 3 | 2 | 2 | 3 | 1 | 0.714 | |
| Government ID issuance | 2 | 2 | 3 | 3 | 1 | 3 | 3 | 0.810 | |
| Permit issuance | 2 | 2 | 3 | 3 | 2 | 3 | 3 | 0.857 | |
| Internship/experience programs | 1 | 1 | 3 | 2 | 3 | 3 | 2 | 0.714 | |
| Enjoying | Fitness development | 2 | 2 | 3 | 2 | 3 | 3 | 2 | 0.810 |
| Dining | 3 | 2 | 3 | 3 | 3 | 3 | 3 | 0.952 | |
| Special occasions venues | 3 | 2 | 1 | 2 | 1 | 3 | 2 | 0.667 | |
| Festivals | 1 | 1 | 1 | 2 | 3 | 3 | 2 | 0.619 | |
| Cultural displays | 1 | 1 | 1 | 2 | 3 | 3 | 2 | 0.619 | |
| Free Wi-Fi and charging stations | 3 | 3 | 3 | 3 | 3 | 2 | 2 | 0.905 | |
| Reservation systems | 1 | 2 | 1 | 2 | 1 | 3 | 1 | 0.524 | |
| Live music | 1 | 1 | 3 | 2 | 2 | 3 | 2 | 0.667 | |
| Music screenings | 1 | 1 | 1 | 2 | 1 | 3 | 2 | 0.524 | |
| Fellowships | 1 | 3 | 3 | 2 | 2 | 3 | 2 | 0.762 | |
| Active recreation spaces | 1 | 3 | 3 | 2 | 3 | 3 | 3 | 0.857 | |
| Community events hosting | 1 | 2 | 1 | 2 | 2 | 3 | 2 | 0.619 | |
| Outdoor plays | 3 | 3 | 3 | 2 | 3 | 3 | 3 | 0.952 | |
| Learning | Formal education | 3 | 3 | 3 | 3 | 3 | 3 | 3 | 1.000 |
| Guidance counseling | 3 | 3 | 3 | 2 | 2 | 3 | 2 | 0.857 | |
| Special education services | 3 | 3 | 1 | 2 | 3 | 3 | 2 | 0.810 | |
| Library and research services | 3 | 3 | 3 | 3 | 2 | 3 | 2 | 0.905 | |
| Tutoring | 3 | 3 | 2 | 2 | 2 | 3 | 2 | 0.810 | |
| Extracurricular programs | 2 | 2 | 2 | 3 | 1 | 3 | 2 | 0.714 | |
| Skills workshops | 1 | 2 | 3 | 3 | 3 | 3 | 2 | 0.810 | |
| Livelihood skills trainings | 1 | 3 | 3 | 2 | 3 | 3 | 2 | 0.810 | |
| Driving lessons | 1 | 1 | 1 | 2 | 1 | 3 | 2 | 0.524 | |
| Skills/knowledge assessments | 1 | 2 | 3 | 3 | 2 | 3 | 2 | 0.762 | |
| Caring | In-patient and out-patient services | 3 | 3 | 3 | 3 | 3 | 3 | 3 | 1.000 |
| Health consultation | 3 | 3 | 3 | 3 | 3 | 3 | 3 | 1.000 | |
| Medication management | 3 | 3 | 3 | 3 | 2 | 3 | 2 | 0.905 | |
| Medical supplies | 3 | 3 | 3 | 3 | 3 | 3 | 3 | 1.000 | |
| Emergency care | 3 | 3 | 3 | 3 | 3 | 3 | 3 | 1.000 | |
| Vaccination | 3 | 3 | 3 | 3 | 2 | 3 | 3 | 0.952 | |
| Biometric measurements | 3 | 3 | 3 | 3 | 1 | 2 | 2 | 0.810 | |
| Free testing services | 3 | 3 | 3 | 3 | 1 | 3 | 3 | 0.905 | |
| Maternal and child health care | 3 | 3 | 3 | 3 | 3 | 3 | 3 | 1.000 | |
| Health education and promotion | 3 | 3 | 3 | 3 | 3 | 3 | 3 | 1.000 | |
| Surgeries | 1 | 2 | 3 | 3 | 2 | 3 | 3 | 0.810 | |
| Body development | 2 | 2 | 3 | 3 | 1 | 2 | 2 | 0.714 | |
Table A2.
Social function importance ranks given by experts and corresponding weights.
Table A2.
Social function importance ranks given by experts and corresponding weights.
| Age Group | SF | SF Rank by Expert | SF Weight | ||||||
| #1 | #2 | #3 | #4 | #5 | #6 | #7 | |||
| 7–14 | Living | 3 | 5 | 3 | 2 | 3 | 2 | 4 | 0.146 |
| Working | 6 | 6 | 6 | 6 | 5 | 6 | 6 | 0.078 | |
| Supplying | 5 | 3 | 5 | 5 | 6 | 5 | 5 | 0.095 | |
| Caring | 1 | 4 | 4 | 4 | 4 | 4 | 3 | 0.134 | |
| Learning | 2 | 1 | 2 | 1 | 1 | 1 | 1 | 0.357 | |
| Enjoying | 4 | 2 | 1 | 3 | 2 | 3 | 2 | 0.189 | |
| 15–24 | Living | 2 | 2 | 3 | 2 | 3 | 2 | 4 | 0.164 |
| Working | 6 | 6 | 4 | 6 | 5 | 4 | 5 | 0.082 | |
| Supplying | 5 | 4 | 6 | 5 | 6 | 5 | 6 | 0.080 | |
| Caring | 3 | 5 | 5 | 4 | 4 | 6 | 3 | 0.098 | |
| Learning | 1 | 1 | 1 | 1 | 1 | 1 | 1 | 0.421 | |
| Enjoying | 4 | 3 | 2 | 3 | 2 | 3 | 2 | 0.155 | |
| 25–44 | Living | 1 | 2 | 2 | 2 | 1 | 1 | 2 | 0.304 |
| Working | 2 | 1 | 1 | 1 | 5 | 2 | 1 | 0.257 | |
| Supplying | 4 | 3 | 4 | 3 | 6 | 6 | 3 | 0.115 | |
| Caring | 3 | 5 | 3 | 4 | 4 | 5 | 5 | 0.115 | |
| Learning | 6 | 6 | 5 | 6 | 3 | 4 | 6 | 0.093 | |
| Enjoying | 5 | 4 | 6 | 5 | 2 | 3 | 4 | 0.115 | |
| 45–64 | Living | 1 | 2 | 2 | 2 | 1 | 1 | 2 | 0.319 |
| Working | 3 | 1 | 1 | 1 | 5 | 6 | 1 | 0.195 | |
| Supplying | 4 | 3 | 4 | 3 | 6 | 5 | 5 | 0.117 | |
| Caring | 2 | 4 | 3 | 4 | 4 | 3 | 4 | 0.146 | |
| Learning | 6 | 6 | 5 | 6 | 3 | 4 | 6 | 0.097 | |
| Enjoying | 5 | 5 | 6 | 5 | 2 | 2 | 3 | 0.125 | |
| 65 and above | Living | 1 | 3 | 3 | 2 | 1 | 2 | 3 | 0.229 |
| Working | 5 | 5 | 5 | 5 | 5 | 6 | 6 | 0.093 | |
| Supplying | 3 | 1 | 4 | 3 | 6 | 5 | 4 | 0.132 | |
| Caring | 2 | 2 | 1 | 1 | 4 | 1 | 1 | 0.286 | |
| Learning | 6 | 6 | 6 | 6 | 3 | 4 | 5 | 0.095 | |
| Enjoying | 4 | 4 | 2 | 4 | 2 | 3 | 2 | 0.164 | |
References
- Barragan, C. Book Review: The Right to the City; Urban Design Lab: Tokyo, Japan, 2024. [Google Scholar]
- Lech, M.; Leppert, G. Current Issues of the Philippine Land Use Planning and Management System; German Institute for Development Evaluation: Bonn, Germany, 2018. [Google Scholar]
- Luo, M.; Zhang, S.; Deng, W. Has Urban Expansion Alleviated Working-Residential Spaces Segregation across Inner-Outer Cities? A Multi-Scale Study with Location-Based Social Bigdata. Habitat Int. 2024, 153, 103183. [Google Scholar] [CrossRef]
- Fernando, M.; Heinen, E.; Johnson, D. Exposure, Timing, and Vulnerability: The Role of Public Transport in Inducing Gentrification. JTLU 2021, 14, 885–910. [Google Scholar] [CrossRef]
- Allam, Z.; Nieuwenhuijsen, M.; Chabaud, D.; Moreno, C. The 15-Minute City Offers a New Framework for Sustainability, Liveability, and Health. Lancet Planet. Health 2022, 6, e181–e183. [Google Scholar] [CrossRef]
- Moreno, C.; Allam, Z.; Chabaud, D.; Gall, C.; Pratlong, F. Introducing the “15-Minute City”: Sustainability, Resilience and Place Identity in Future Post-Pandemic Cities. Smart Cities 2021, 4, 93–111. [Google Scholar] [CrossRef]
- Akrami, M.; Sliwa, M.W.; Rynning, M.K. Walk Further and Access More! Exploring the 15-Minute City Concept in Oslo, Norway. J. Urban Mobil. 2024, 5, 100077. [Google Scholar] [CrossRef]
- Weng, M.; Ding, N.; Li, J.; Jin, X.; Xiao, H.; He, Z.; Su, S. The 15-Minute Walkable Neighborhoods: Measurement, Social Inequalities and Implications for Building Healthy Communities in Urban China. J. Transp. Health 2019, 13, 259–273. [Google Scholar] [CrossRef]
- Vaughn, W. 15-Minute Cities: Where They Can Be Found Across the Globe. Available online: https://www.citymonitor.ai/analysis/15-minute-cities-where-are-they/?cf-view (accessed on 10 December 2024).
- Leather, J.; Fabian, H.; Gota, S.; Mejia, A. Walkability and Pedestrian Facilities in Asian Cities; Asian Development Bank: Mandaluyong City, Philippines, 2011; Volume 17, Available online: https://www.adb.org/sites/default/files/publication/28679/adb-wp17-walkability-pedestrian-facilities-asian-cities.pdf (accessed on 11 December 2024).
- Scott, J. Episode 5: Pasig, Philippines. Available online: https://daringcities.org/podcast/episode-5-pasig-philippines/ (accessed on 10 December 2024).
- Javier, S.F.D.; Ballarta, J.N.; Regidor, J.R.F. Assessing Walkability in the City of Tacloban. In Proceedings of the TSSP 25th Annual Conference, Cagayan de Oro City, Philippines, 26–27 July 2018; Transportation Science Society of the Philippines: Quezon City, Philippines, 2018. [Google Scholar]
- Moreno, C.; Gall, C.; Chabaud, D.; Garnier, M.; Illian, M.; Pratlong, F. The 15-Minute City Model: An Innovative Approach to Measuring the Quality of Life in Urban Settings 30-Minute Territory Model in Low-Density Areas WHITE PAPER N°3; IAE Paris—Université Paris 1 Panthéon-Sorbonne: Paris, France, 2023. [Google Scholar]
- Papadopoulos, E.; Sdoukopoulos, A.; Politis, I. Measuring Compliance with the 15-Minute City Concept: State-of-the-Art, Major Components and Further Requirements. Sustain. Cities Soc. 2023, 99, 104875. [Google Scholar] [CrossRef]
- Fazio, M.; Borghetti, F.; Giuffrida, N.; Pira, M.L.; Longo, M.; Ignaccolo, M.; Inturri, G.; Maja, R. The “15-Minutes Station”: A Case Study to Evaluate the Pedestrian Accessibility of Railway Transport in Southern Italy. Transp. Res. Procedia 2023, 69, 536–543. [Google Scholar] [CrossRef]
- Graells-Garrido, E.; Serra-Burriel, F.; Rowe, F.; Cucchietti, F.M.; Reyes, P. A City of Cities: Measuring How 15-Minutes Urban Accessibility Shapes Human Mobility in Barcelona. PLoS ONE 2021, 16, e0250080. [Google Scholar] [CrossRef]
- Shoina, M.; Voukkali, I.; Anagnostopoulos, A.; Papamichael, I.; Stylianou, M.; Zorpas, A.A. The 15-Minute City Concept: The Case Study within a Neighbourhood of Thessaloniki. Waste Manag. Res. 2024, 42, 694–710. [Google Scholar] [CrossRef]
- Frejie, H.J. The Fifteen-Minute City: The Promotion of Active Modes by a Novel City Planning Concep. Master’s Thesis, Delft University of Technology, Delft, The Netherlands, 2022. [Google Scholar]
- Abdelfattah, L.; Boni, G.; Carnevalini, G.; Choubassi, R.; Gorrini, A.; Messa, F.; Presicce, D. A User-Centric Approach to the 15-Minute City. In Proceedings of the 57th ISOCARP World Planning Congress, Doha, Qatar, 8–11 November 2021. [Google Scholar]
- Willberg, E.; Fink, C.; Toivonen, T. The 15-Minute City for All?—Measuring Individual and Temporal Variations in Walking Accessibility. J. Transp. Geogr. 2023, 106, 103521. [Google Scholar] [CrossRef]
- Ferrer-Ortiz, C.; Marquet, O.; Mojica, L.; Vich, G. Barcelona under the 15-Minute City Lens: Mapping the Accessibility and Proximity Potential Based on Pedestrian Travel Times. Smart Cities 2022, 5, 146–161. [Google Scholar] [CrossRef]
- Hosford, K.; Beairsto, J.; Winters, M. Is the 15-Minute City within Reach? Evaluating Walking and Cycling Accessibility to Grocery Stores in Vancouver. Transp. Res. Interdiscip. Perspect. 2022, 14, 100602. [Google Scholar] [CrossRef]
- Staricco, L. 15-, 10- or 5-Minute City? A Focus on Accessibility to Services in Turin, Italy. J. Urban Mobil. 2022, 2, 100030. [Google Scholar] [CrossRef]
- Barton, H.; Grant, M.; Guise, R. Shaping Neighbourhoods; Routledge: London, UK, 2006; ISBN 978-1-134-46988-8. [Google Scholar]
- Thornton, L.E.; Schroers, R.-D.; Lamb, K.E.; Daniel, M.; Ball, K.; Chaix, B.; Kestens, Y.; Best, K.; Oostenbach, L.; Coffee, N.T. Operationalising the 20-Minute Neighbourhood. Int. J. Behav. Nutr. Phys. Act. 2022, 19, 15. [Google Scholar] [CrossRef] [PubMed]
- Birkenfeld, C.; Victoriano-Habit, R.; Alousi-Jones, M.; Soliz, A.; El-Geneidy, A. Who Is Living a Local Lifestyle? Towards a Better Understanding of the 15-Minute-City and 30-Minute-City Concepts from a Behavioural Perspective in Montréal, Canada. J. Urban Mobil. 2023, 3, 100048. [Google Scholar] [CrossRef]
- Gorrini, A.; Presicce, D.; Messa, F.; Choubassi, R. Walkability for Children in Bologna: Beyond the 15-Minute City Framework. J. Urban Mobil. 2023, 3, 100052. [Google Scholar] [CrossRef]
- Knap, E.; Ulak, M.B.; Geurs, K.T.; Mulders, A.; Van Der Drift, S. A Composite X-Minute City Cycling Accessibility Metric and Its Role in Assessing Spatial and Socioeconomic Inequalities—A Case Study in Utrecht, the Netherlands. J. Urban Mobil. 2023, 3, 100043. [Google Scholar] [CrossRef]
- Gaglione, F.; Gargiulo, C.; Zucaro, F.; Cottrill, C. Urban Accessibility in a 15-Minute City: A Measure in the City of Naples, Italy. Transp. Res. Procedia 2022, 60, 378–385. [Google Scholar] [CrossRef]
- Zhang, S.; Zhen, F.; Kong, Y.; Lobsang, T.; Zou, S. Towards a 15-Minute City: A Network-Based Evaluation Framework. Environ. Plan. B Urban Anal. City Sci. 2023, 50, 500–514. [Google Scholar] [CrossRef]
- Shahid, R.; Bertazzon, S.; Knudtson, M.L.; Ghali, W.A. Comparison of Distance Measures in Spatial Analytical Modeling for Health Service Planning. BMC Health Serv. Res. 2009, 9, 200. [Google Scholar] [CrossRef] [PubMed]
- Tobin, M.; Hajna, S.; Orychock, K.; Ross, N.; DeVries, M.; Villeneuve, P.J.; Frank, L.D.; McCormack, G.R.; Wasfi, R.; Steinmetz-Wood, M.; et al. Rethinking Walkability and Developing a Conceptual Definition of Active Living Environments to Guide Research and Practice. BMC Public Health 2022, 22, 450. [Google Scholar] [CrossRef] [PubMed]
- Maniei, H.; Askarizad, R.; Pourzakarya, M.; Gruehn, D. The Influence of Urban Design Performance on Walkability in Cultural Heritage Sites of Isfahan, Iran. Land 2024, 13, 1523. [Google Scholar] [CrossRef]
- Moura, F.; Cambra, P.; Gonçalves, A.B. Measuring Walkability for Distinct Pedestrian Groups with a Participatory Assessment Method: A Case Study in Lisbon. Landsc. Urban Plan. 2017, 157, 282–296. [Google Scholar] [CrossRef]
- Rafiemanzelat, R.; Emadi, M.I.; Kamali, A.J. City Sustainability: The Influence of Walkability on Built Environments. Transp. Res. Procedia 2017, 24, 97–104. [Google Scholar] [CrossRef]
- Knapskog, M.; Hagen, O.H.; Tennøy, A.; Rynning, M.K. Exploring Ways of Measuring Walkability. Transp. Res. Procedia 2019, 41, 264–282. [Google Scholar] [CrossRef]
- Katsavounidou, G. Life Between Buildings: Using Public Space: The History of Jan Gehl’s Book and the Legacy of Its Philosophy for Designing Cities at Human Scale; Institutionelles Repositorium der Leibniz Universität Hannover: Hannover, Germany, 2023. [Google Scholar] [CrossRef]
- Silvennoinen, H.; Kuliga, S.; Herthogs, P.; Recchia, D.R.; Tunçer, B. Effects of Gehl’s Urban Design Guidelines on Walkability: A Virtual Reality Experiment in Singaporean Public Housing Estates. Environ. Plan. B Urban Anal. City Sci. 2022, 49, 2409–2428. [Google Scholar] [CrossRef]
- Dragović, D.; Krklješ, M.; Slavković, B.; Aleksić, J.; Radaković, A.; Zećirović, L.; Alcan, M.; Hasanbegović, E. A Literature Review of Parameter-Based Models for Walkability Evaluation. Appl. Sci. 2023, 13, 4408. [Google Scholar] [CrossRef]
- Yang, Y.; Qian, Y.; Zeng, J.; Wei, X.; Yang, M. Walkability Measurement of 15-Minute Community Life Circle in Shanghai. Land 2023, 12, 153. [Google Scholar] [CrossRef]
- Walk Score Walk Score Methodology. Available online: https://www.walkscore.com/methodology.shtml (accessed on 14 January 2025).
- Krambeck, H.V. The Global Walkability Index. Available online: http://hdl.handle.net/1721.1/34409 (accessed on 10 January 2025).
- Wibowo, S.S.; Tanan, N.; Tinumbia, N. Walkability Measures for City Area in Indonesia (Case Study of Bandung). J. East. Asia Soc. Transp. Stud. 2015, 11, 1507–1521. [Google Scholar]
- Caixeta Szymanski Nogueira, A.C.; Diaz, C.E.D. Evaluating Public Transport Accessibility and Walkability in Pasig City (Philippines) and Their Correlation to Socioeconomic Factors at the Barangay Level. Asian Transp. Stud. 2023, 9, 100117. [Google Scholar] [CrossRef]
- Adalid, N.G. Pasig City in Focus. Available online: https://business.inquirer.net/402904/pasig-city-in-focus (accessed on 29 November 2024).
- Local Government Academy Barangay Primer 6th Edition. Available online: https://lga.gov.ph/uploads/publication/attachments/1590373315.pdf (accessed on 10 December 2024).
- Lazaroff, T. Becoming a Model Climate Action City: The Journey of Pasig, Philippines. Available online: https://talkofthecities.iclei.org/becoming-a-model-climate-action-city-the-journey-of-pasig-philippines/ (accessed on 29 November 2024).
- Pasig City Government People’s Street Sa Brgy. Kapasigan! Available online: https://pasigcity.gov.ph/news-and-releases/peoples-street-sa-brgy-kapasigan-477 (accessed on 16 January 2025).
- Lariosa, S. More Carless, Public Spaces: Pasig City Adds Four More “People’s Street” Roads. Available online: https://philstarlife.com/news-and-views/284834-pasig-five-more-peoples-street (accessed on 16 January 2025).
- United Nations. Provisional Guidelines on Standard International Age Classifications; United Nations: New York, NY, USA, 1982. [Google Scholar]
- Schoeppe, S.; Duncan, M.J.; Badland, H.M.; Rebar, A.L.; Vandelanotte, C. Too Far from Home? Adult Attitudes on Children’s Independent Mobility Range. Child. Geogr. 2016, 14, 482–489. [Google Scholar] [CrossRef]
- OCHA Humanitarian Data Exchange. Available online: https://data.humdata.org/ (accessed on 16 November 2024).
- Fitzpatrick, K.; Brewer, M.A.; Turner, S. Another Look at Pedestrian Walking Speed. Transp. Res. Rec. J. Transp. Res. Board 2006, 1982, 21–29. [Google Scholar] [CrossRef]
- QGIS QuickOSM—QGIS Python Plugins Repository. Available online: https://plugins.qgis.org/plugins/QuickOSM/#plugin-about (accessed on 29 November 2024).
- OpenStreetMap Contributors. Available online: https://openstreetmap.org (accessed on 16 November 2024).
- Google. Available online: https://www.google.com/maps (accessed on 16 November 2024).
- Department of Education List of Schools. Available online: https://ebeis.deped.gov.ph/beis/reports_info/masterlist (accessed on 16 November 2024).
- National Council on Disability Affairs List of SPED Centers in Pasig City. Available online: https://ncda.gov.ph/list-of-sped-centers/pasig-city/ (accessed on 16 November 2024).
- Technical Education and Skills Development Authority List of TESDA-Accredited Schools in Pasig City. Available online: https://tesdaonlineprogram.com/list-of-tesda-accredited-schools-in-pasig-city/#google_vignette (accessed on 16 November 2024).
- Pasig City Government Comprehensive Land and Water Use Plan and Zoning Ordinance 2023.
- Nahhas, R.W. Introduction to Regression Methods for Public Health Using R, 1st ed.; CRC Press LLC: Boca Raton, FL, USA, 2024; ISBN 978-1-032-20307-2. [Google Scholar]
- Chen, Y.; Yu, J.; Khan, S. Spatial Sensitivity Analysis of Multi-Criteria Weights in GIS-Based Land Suitability Evaluation. Environ. Model. Softw. 2010, 25, 1582–1591. [Google Scholar] [CrossRef]
- Esri What Is the ArcGIS Network Analyst Extension?—ArcGIS Pro | Documentation. Available online: https://pro.arcgis.com/en/pro-app/latest/help/analysis/networks/what-is-network-analyst-.htm (accessed on 29 November 2024).
- SmartHubs Accessibility Tool. Available online: https://www.smartmobilityhubs.eu/smarthubs-tool/accessibility-tool (accessed on 22 January 2025).
- Nichols, A.; Duran, D.; Büttner, B. SmartHubs Accessibility Tool 2023. Available online: https://www.smartmobilityhubs.eu/_files/ugd/c54b12_e489f6049f864e33b545af1780d8a6d6.pdf (accessed on 16 November 2024).
- Liu, D.; Kwan, M.-P.; Wang, J. Developing the 15-Minute City: A Comprehensive Assessment of the Status in Hong Kong. Travel Behav. Soc. 2024, 34, 100666. [Google Scholar] [CrossRef]
- Mawis-Alliston, V. Is There Hope for a Philippine 15-Minute City? The Inquirer, 13 July 2024. [Google Scholar]
- Bartzokas-Tsiompras, A.; Bakogiannis, E. Quantifying and Visualizing the 15-Minute Walkable City Concept across Europe: A Multicriteria Approach. J. Maps 2023, 19, 2141143. [Google Scholar] [CrossRef]
- Elldér, E. Built Environment and the Evolution of the “15-Minute City”: A 25-Year Longitudinal Study of 200 Swedish Cities. Cities 2024, 149, 104942. [Google Scholar] [CrossRef]
- Pasig City Hall Library Geographic Location, Demographic Profile, and Other Data of Pasig City. Available online: https://pasigcityhalllibrary.wordpress.com/2021/11/05/geographic-location-demographic-profile-and-other-data-of-pasig-city/ (accessed on 20 January 2025).
- Shatu, F.; Kamruzzaman, M. Determining Optimum Design Density for 20-Minute Neighbourhoods. Findings 2021. [Google Scholar] [CrossRef]
- Guzman, L.A.; Oviedo, D.; Cantillo-Garcia, V.A. Is Proximity Enough? A Critical Analysis of a 15-Minute City Considering Individual Perceptions. Cities 2024, 148, 104882. [Google Scholar] [CrossRef]
- Lima, F.T.; Costa, F. The Quest for Proximity: A Systematic Review of Computational Approaches towards 15-Minute Cities. Architecture 2023, 3, 393–409. [Google Scholar] [CrossRef]
- Rhoads, D.; Solé-Ribalta, A.; Borge-Holthoefer, J. The Inclusive 15-Minute City: Walkability Analysis with Sidewalk Networks. Comput. Environ. Urban Syst. 2023, 100, 101936. [Google Scholar] [CrossRef]
- Capasso Da Silva, D.; King, D.A.; Lemar, S. Accessibility in Practice: 20-Minute City as a Sustainability Planning Goal. Sustainability 2019, 12, 129. [Google Scholar] [CrossRef]
- Tinio, M.M.R. Adopting the 15-Minute City Approach in Designing a Post-Covid Recovery Strategy in the Philippines to Promote Safer and Smarter Cities; Friedrich Naumann Foundation for Freedom: Makati, Philippines, 2023. [Google Scholar]
- Mocák, P.; Matlovičová, K.; Matlovic, R.; Pénzes, J.; Pachura, P.; Mishra, P.; Kostilnikova, K.; Demková, M. 15-minute city concept as a sustainable urban development alternative: A brief outline of conceptual frameworks and slovak cities as a case. Folia Geogr. 2022, 64, 69–89. [Google Scholar]
- Quezon City Government to Continue Car-Free, Carefree Tomas Morato—Quezon City Government. Available online: https://quezoncity.gov.ph/quezon-city-government-to-continue-car-free-carefree-tomas-morato/ (accessed on 21 January 2025).
- Award-Winning Iloilo River Esplanade Started with a Flood Control Project|GMA News Online. Available online: https://www.gmanetwork.com/news/lifestyle/travel/893267/award-winning-iloilo-river-esplanade-started-with-a-flood-control-project/story/ (accessed on 21 January 2025).
- Romero, A. President Marcos Opens Pasig River Project. Available online: https://www.philstar.com/headlines/2024/06/24/2365124/president-marcos-opens-pasig-river-project (accessed on 21 January 2025).
- Ozkan, K. Consequences of Needs Distributions on Social Stratification: Maslow and Marx Refined. Available online: https://www.researchgate.net/publication/274929043_Consequences_of_Needs_Distributions_on_Social_Stratification_Maslow_and_Marx_Refined (accessed on 16 January 2025).
- United Nations the 17 Goals. Available online: https://sdgs.un.org/goals (accessed on 29 November 2024).
Disclaimer/Publisher’s Note: The statements, opinions and data contained in all publications are solely those of the individual author(s) and contributor(s) and not of MDPI and/or the editor(s). MDPI and/or the editor(s) disclaim responsibility for any injury to people or property resulting from any ideas, methods, instructions or products referred to in the content. |
© 2025 by the authors. Published by MDPI on behalf of the International Society for Photogrammetry and Remote Sensing. Licensee MDPI, Basel, Switzerland. This article is an open access article distributed under the terms and conditions of the Creative Commons Attribution (CC BY) license (https://creativecommons.org/licenses/by/4.0/).


