Abstract
Pedestrian accessibility is a critical dimension of sustainable and inclusive transportation systems, yet many cities lack reliable data on infrastructure features that support visually impaired users. Among these, podotactile paving plays a vital role in guiding movement and ensuring safety at intersections and transit nodes. However, tactile paving networks remain largely absent from digital transport inventories and automated mapping pipelines, limiting the ability of cities to systematically assess accessibility conditions. This paper presents a scalable approach for identifying and mapping podotactile areas from mobile and handheld laser scanning data, broadening the scope of data-driven urban modelling to include infrastructure elements critical for visually impaired pedestrians. The framework is evaluated across multiple sensing modalities and geographic contexts, demonstrating robust generalization to diverse transport environments. Across four dataset configurations from Madrid and Mantova, the proposed DeepLabV3+ model achieved podotactile F1-scores ranging from 0.83 to 0.91, with corresponding IoUs between 0.71 and 0.83. The combined Madrid–Mantova dataset reached an F1-score of 0.86 and an IoU of 0.75, highlighting strong cross-city generalization. By addressing a long-standing gap in transportation accessibility research, this study demonstrates that podotactile paving can be systematically extracted and integrated into transport datasets. The proposed approach supports scalable accessibility auditing, enhances digital transport models, and provides planners with actionable data to advance inclusive and equitable mobility.
1. Introduction
Transportation systems are increasingly expected to support equitable, safe, and inclusive mobility for all users [1]. Within this context, pedestrian accessibility is a fundamental component of sustainable transport planning, as sidewalks, crossings, and public transport interfaces must accommodate diverse user groups, including individuals with visual impairments [2]. In transportation research, growing attention is being placed on equity and inclusivity, with accessibility now recognized as a key requirement for achieving safe, sustainable, and technology-supported mobility systems [3]. At the same time, transport agencies face growing demands to ensure that pedestrian infrastructure supports both safety and sustainability, while reducing inequalities across different user groups. Meeting these expectations requires reliable, up-to-date data on the condition and distribution of pedestrian facilities, an area where traditional manual surveys remain costly and inconsistent, highlighting the need for automated approaches [4].
Among the different elements that shape pedestrian accessibility, podotactile areas (tactile paving) represent a fundamental yet often overlooked element of pedestrian infrastructure. Designed with raised bars or dots in contrasting colours, these surfaces provide tactile and visual cues that enable visually impaired pedestrians to navigate safely and anticipate hazards such as intersections, stairs, or platform edges. Even with their critical role in ensuring independent mobility, podotactile paving is rarely included in digital transport inventories or automated mapping workflows [5,6]. As a result, many cities lack the information needed to assess compliance with accessibility standards, identify underserved areas, or strategically plan infrastructure upgrades. This gap is particularly striking given recent efforts to embed data-driven approaches into transport planning as a way to promote inclusivity and equity [7]. Field-based studies have further confirmed the effectiveness of tactile paving in shaping safe crossing behaviour for visually impaired pedestrians, highlighting the importance of systematically integrating such features into accessibility assessments [8].
The advent of Mobile Laser Scanning (MLS) and Handheld Mobile Laser Scanning (HMLS) represents a major leap in data acquisition technologies for transportation systems. These platforms integrate LiDAR sensors with RGB (red, green, and blue) cameras to capture dense, multimodal point clouds of urban environments. Compared with traditional surveys, MLS and HMLS offer rapid coverage, high spatial resolution, and the ability to record both geometry and appearance, making them particularly suited for transport infrastructure mapping [9,10]. Applications to date have demonstrated effective delineation of sidewalks and pedestrian zones [11], detection of curbs and road boundaries [12,13,14], automatic classification of urban pavements [15], evaluation of roadway geometry [16], and road pavement condition assessment [17]. These successes illustrate the versatility of MLS technology, yet tactile paving remains an unaddressed challenge due to its fine granularity, contextual variability, and frequent location within complex urban intersections [18].
At the same time, advances in deep learning have revolutionized the analysis of spatial data for transportation. Semantic segmentation models, particularly Convolutional Neural Network (CNN)-based architectures, have been successfully applied to road markings, pavements, and sidewalks, achieving high accuracy and scalability [19]. Beyond infrastructure geometry, deep learning has been used to detect surface-level defects such as cracks [20], to analyze cycling conditions and environmental factors using street-view imagery [21], and to support safety-focused urban interventions [22] and traffic safety modelling [23,24]. Together, these studies show that computer vision and machine learning can support transportation research in many useful ways. Our work builds on this by focusing specifically on the automatic detection of podotactile paving, a topic that has received little attention so far. Podotactile surfaces are often overlooked because they are small, made of different materials, and can easily blend in with nearby pavement, which makes them difficult to detect reliably.
Despite the potential benefits offered by MLS and deep learning, detecting podotactile areas presents unique challenges rooted in the complexity of urban transportation environments. One major obstacle is the variability in tactile paving design due to differences in regional standards, materials, and placement practices [18]. Urban sidewalks often contain heterogeneous surface conditions and a high density of contextual elements such as curbs, manholes, vegetation, and street furniture, which introduce significant noise into the point cloud data. These spatial interferences complicate the extraction of fine-scale accessibility features like tactile paving, particularly when these features are small, occluded, or lack strong contrast in spectral or geometric properties. Moreover, podotactile zones are typically located at intersections, points of maximum structural complexity within pedestrian networks.
The automated detection of podotactile areas provides valuable insights for a range of transportation planning and management tasks, including sidewalk infrastructure monitoring, intersection design, and accessibility compliance assessment. By identifying these functional zones, planners can ensure that sidewalks are organized, compliant with accessibility standards, and conducive to pedestrian safety. Furthermore, integrating podotactile detection into intersection-level pedestrian network mapping enables cities to design seamless, walkable environments that connect sidewalks, crossings, and public transport hubs. Such networks are not only essential for accessibility but also contribute to sustainable urban mobility by promoting walking as a mode of transportation.
More broadly, the automated detection of fine-grained pedestrian infrastructure contributes to the digitization of transport systems and the development of data-rich urban models. Advances in sensing and machine learning are increasingly enabling cities to create detailed, continuously updated inventories of sidewalks, crossings, and accessibility features. Such digital representations provide the foundation for smart mobility services, simulation-based planning, and equity-focused infrastructure management. By focusing on podotactile paving, this study addresses a critical but often overlooked element within these broader efforts, ensuring that the needs of visually impaired pedestrians are incorporated into emerging data-driven transport solutions.
To explore the influence of sensor modality data resolution, and geographic diversity on segmentation accuracy, this study evaluates four dataset configurations: (i) MLS data from Madrid, (ii) HMLS data from Madrid, (iii) a combined MLS/HMLS Madrid dataset, and (iv) a merged dataset from Madrid (Spain) and Mantova (Italy). By testing on data from two cities and across multiple sensor types, the study assesses the generalization capacity of the proposed approach, which is critical for the deployment of emerging technologies in diverse transportation settings.
This study addresses a significant gap in transportation accessibility analysis by focusing on the automated detection of podotactile paving using geospatial data. The methodology contributes to the advancing field of geospatial analysis, particularly in the context of MLS and 3D point cloud interpretation. By enabling the precise and scalable mapping of accessibility features, such as tactile paving, within intersection-adjacent sidewalk spaces, this research provides urban planners with data to identify deficiencies in critical pedestrian areas and strategically prioritize improvements. Ultimately, this work illustrates how technological innovation can drive social equity and safety in transportation systems, by integrating inclusive design principles into the infrastructure of smart urban development.
The main contributions of this work are the following:
- A novel framework for automated podotactile paving detection from MLS and HMLS data, using DeepLabV3+ segmentation on images derived from point clouds.
- High resolution RGB rasterization of filtered point clouds to train segmentation models tailored for tactile feature detection.
- Reprojection of predictions back into 3D space and polygon generation for podotactile/non-podotactile sidewalk areas, supporting GIS (Geographic Information System) integration.
- Cross-sensor and cross-city evaluation of model performance across four dataset configurations and two cities from two different countries (MLS Madrid, HMLS Madrid, MLS/HMLS Madrid, and combined Madrid–Mantova), highlighting the impact of sensor resolution, viewpoint, and geographic diversity.
This paper is organized as follows: Section 2 reviews related works and establishes their differences with respect to our work. Section 3 describes the proposed methodology. Section 4 reports the results obtained from applying the methodology to our case study. Finally, Section 5 is devoted to discussing the results and drawing out conclusions from the presented work.
2. Related Work
2.1. Heuristic Rule-Based and Geometric Methods for Urban Ground Segmentation
Urban ground segmentation has traditionally relied on geometric criteria and spatial heuristics to identify transportation infrastructure elements such as roads, sidewalks, and curbs in point clouds. These approaches prioritize interpretability and computational efficiency by leveraging geometry and spatial data rather than learned patterns. For example, Fernández-Arango et al. [11] applied MLS point clouds to delineate sidewalks, road surfaces, and pedestrian zones while correcting occlusions from vehicles and street furniture, generating impedance surfaces for accessibility modelling relevant to pedestrian routing. Similarly, Al Shammas et al. [25] developed a GIS-based algorithm that computes walkability scores by integrating real-time environmental comfort factors such as shading and temperature.
Balado et al. [26] developed a rule-driven algorithm for detecting ground-level occlusions in MLS data, such as vehicles and street furniture. By masking these obstructions, the method refines pedestrian surface segmentation, demonstrating how spatial logic can enhance the extraction of walkable elements even in complex urban contexts. Using airborne LiDAR, a rule-based workflow was proposed for curb detection and segmentation of sidewalks and pavements by combining voxel-based surface modelling, region growing, and heuristic classification [27]. The method achieved F-scores near 95% for pedestrian surface identification, demonstrating the potential of geometry and reflectance data for scalable road network extraction. Di Benedetto et al. [28] proposed a pipeline for modelling pavement surface deformations using MLS data, including detection of pavement geometry from ground filtering and voxel-based surface extraction under occlusion scenarios. Other studies have focused on robust ground filtering and terrain estimation, such as the GroundGrid framework [29], which segments ground from non-ground points using height-based heuristics, and the staged real-time ground segmentation algorithm of [30], which applies multi-stage geometric rules to improve performance in sloped or occluded environments.
Balado et al. [31] also presented a geometry-based pipeline to generate pedestrian navigation graphs directly from MLS data, using surface classification and rule-based path connectivity. Similarly, Horváth et al. [32] introduced a real-time LiDAR-based framework for urban road and sidewalk detection using geometric algorithms (e.g., star-shaped, X-zero, and Z-zero) to identify sidewalk edges and curbs from point cloud data, producing compact vector outputs suitable for path planning and autonomous navigation. Maye et al. [33] further demonstrated a curb detection approach tailored for pedestrian robots in urban environments, showing how geometry-based edge extraction can directly support real-time robotic navigation. In addition, Zhao et al. [34] developed CurbNet, a LiDAR-based segmentation framework that integrates geometric filtering with machine learning to enhance curb detection, bridging the gap between rule-based and data-driven approaches.
A recent approach applied a road-shape classification workflow to 3D point clouds, segmenting road boundaries using geometric rules and grid-based segmentation followed by curve fitting. The approach achieved robust real-time boundary detection across common urban road geometries, reinforcing the viability of rule-based algorithms for urban infrastructure modelling [35]. Zou et al. [36] proposed a four-stage, rule-based pipeline for curb segmentation from MLS data. Their method includes coordinate alignment, coarse curb detection using 2D projections, geometric modelling, and alignment.
Lang et al. [37] proposed a curb extraction framework using multi-feature filtering on MLS point clouds, integrating grid-based height thresholding, sink-normal analysis, and multi-frame MSAC fitting to handle a range of road scenarios (from straight sections and intersections to curved geometries). The method achieves an average precision of 0.94 and F1-score 0.85, demonstrating strong performance. Moreover, Wang and Feng [38] proposed a rule-based pipeline using a low-cost, portable MLS system to perform rapid geometric evaluation of transportation infrastructure. The approach segments ground from non-ground points using random sample consensus (RANSAC)-based planar fitting, extracts shape-change features to delineate boundaries, and computes roadway width and tunnel clearances. The results include real-time, online visualizations and digital maps of measured infrastructure segments.
These studies demonstrate that rule-based and geometrical segmentation remain highly relevant for detecting ground surfaces, especially when interpretability, low computational cost, or sensor constraints limit the use of data-intensive methods. However, as urban transport environments grow in complexity, geometry methods may fall short in capturing subtle surface variations such as podotactile pavements, which cannot be effectively detected without semantic or material-level understanding. These limitations reduce the adaptability of rule-based systems in diverse real-world transport settings, where fine-scale pedestrian accessibility features are increasingly important.
2.2. Deep Learning and Colour-Based Methods for Urban Ground Segmentation
Deep learning models that leverage colour and, in some cases, geometric features have shown significant potential for segmenting urban ground surfaces, especially when identifying features that are difficult to detect using geometric logic alone. These approaches are increasingly relevant for automated analysis of pedestrian infrastructure within modern transportation systems [39]. Several works focus specifically on the detection of tactile paving using deep learning models trained on colour imagery. Zhang et al. [40], proposed GRFB-UNet, an enhanced UNet variant with group receptive field blocks designed to address scale variability, illumination changes, and shadow occlusion in tactile paving segmentation. Their approach operates on 2D imagery and does not integrate 3D spatial information or enable projection of results back into georeferenced urban scenes. Similarly, Ghilardi et al. [41] developed a real-time tactile paving detection system based on smartphone-acquired images and computer vision techniques. Designed to support visually impaired users, the system combines visual descriptors with decision trees to reduce false positives and deliver audio feedback to help users stay aligned with tactile paths. However, their approach is limited to local, device-based applications and does not support automated mapping or transport infrastructure integration.
In a related application, Treccani et al. [42] applied a deep learning approach to segment pedestrian surfaces in heritage sites, using both spectral and geometric features, including colour, intensity, roughness, and Omnivariance, to classify walkable areas. Their work demonstrates how combining visual appearance with geometric features enhances segmentation of complex urban materials. Although their study does not target tactile paving, it reinforces the importance of fine-grained surface descriptors for accessibility analysis. Our approach extends this idea by applying colour-guided semantic segmentation to podotactile features in mobile laser scanning data and reconstructing these areas as georeferenced polygons, enabling integration into urban models and smart mobility applications. Similarly, Hou and Ai [43] developed a network-level sidewalk inventory framework using mobile LiDAR and a PointNet++ deep learning model, achieving high segmentation accuracy—Intersection over Union (IoU) ≈ 0.946—and efficient processing across a state highway case study. Their work demonstrates the feasibility of leveraging deep learning and 3D point cloud data for large-scale pedestrian infrastructure mapping, though their focus remained on sidewalk geometry (e.g., width, slope, cross-slope) rather than fine-grained accessibility features. In contrast, our approach targets podotactile paving, a critical element for inclusive pedestrian mobility.
Beyond tactile paving, other works have applied deep learning to urban ground feature segmentation, particularly targeting surface defects such as cracks. Yussif et al. [44] used a ground-level imagery and a segmentation pipeline to identify sidewalk cracks, showing the effectiveness of colour-enhanced models in recognizing fine surface features similar in geometry and visual complexity to tactile paving. Similarly, Elamin and El-Rabbany [45] combined RGB and elevation maps within a modified U-Net to segment pavement cracks, illustrating how geometric and spectral features can be jointly leveraged to detect subtle surface changes. In addition, Zhang et al. [46] adds attention modules and boundary-aware features to improve edge detection and segmentation of small surface defects.
Deep learning approaches that leverage colour, often in conjunction with geometric information, have demonstrated strong performance in segmenting complex urban ground elements. These methods are particularly effective for identifying fine-grained features such as paving materials and surface defects, tasks that are challenging for rule-based or geometry-only approaches. These studies highlight the critical role of spectral information in improving segmentation accuracy under diverse lighting, material, and contextual conditions. However, no existing approach to date has combined deep learning-based segmentation with 3D point cloud data to automatically extract podotactile areas and reconstruct them as georeferenced polygonal features for integration into pedestrian transportation infrastructure models. Addressing this gap, our work proposes a novel pipeline that integrates colour-guided semantic segmentation with spatial modelling from MLS data, enabling city-scale mapping of tactile paving infrastructure for accessibility applications.
2.3. Research Gap in Podotactile Pavement Detection
Despite the relevance of podotactile paving for mobility, accessibility and transport infrastructure management, most existing detection approaches rely on manual surveys, heuristic rules, or conventional image processing techniques. For example, several studies have used HSV-based colour thresholding [47], handcrafted features [48], or wearable aids coupled with vision sensors [49] to identify tactile tiles. Beyond these, some rule-based methods also utilize colour and shape cues for detecting podotactile surfaces. Yamanaka et al. [50] combined RGB-depth sensing with RANSAC fitting and colour thresholding to detect tactile tiles with 83% precision under controlled conditions, confirming the feasibility of segmenting tactile features from imagery. However, they operate on RGB-Depth sensors in constrained settings, while our pipeline processes high-volume point cloud datasets and outputs city-scale polygon representations. Dynamic HSV-based detection of tactile paving further reinforces the discriminative power of spectral and shape-based features [51]. Still, such threshold-based methods are sensitive to lighting and lack the generalization capacity and semantic richness offered by deep learning approaches.
Other works explore deep learning approaches trained on custom datasets for 2D tactile segmentation tasks [48,52], but they do not leverage 3D spatial data nor offer full automation in realistic urban environments. Meanwhile, studies such as Pembuain et al. [53] focus on evaluating the effectiveness of tactile installations but do not propose detection methodologies. A recent review by Abidi et al. [54] confirms the lack of automated, point cloud-based approaches tailored to tactile paving detection. To our knowledge, there is no prior work that fully automates the extraction of podotactile areas from MLS point clouds. This gap motivates the need for scalable approaches capable of handling real-world urban scenes with high geometric and spectral variability.
Unlike previous approaches, our method combines MLS point clouds with colour imagery to detect and classify tactile paving in urban environments. By projecting point clouds into 2D raster images, we convert 3D measurements into structured inputs suitable for deep learning-based material classification. This strategy leverages both the precise spatial detail from MLS data and the rich colour cues from imagery, enabling more reliable segmentation in complex urban settings. It supports the accurate detection of podotactile areas, which are key ground features for guiding visually impaired pedestrians that are often challenging to identify due to surface wear, lighting variation, or geometric ambiguity. To evaluate the robustness and generalizability of our approach, the segmentation model was trained and tested on four dataset configurations: MLS data from Madrid, HMLS data from Madrid, a combined MLS/HMLS dataset from Madrid, and a cross-city dataset combining Madrid (MLS/HMLS) and Mantova (HMLS). This setup enables a systematic assessment of how sensor modality and geographic diversity influence model performance. The proposed framework offers a scalable, automated solution for transportation accessibility mapping supporting the auditing of inclusive infrastructure and contributing to the development of data-driven pedestrian-aware transport systems.
3. Method
The proposed approach follows a structured pipeline that progresses from raw spatial data to semantically enriched urban models. It is organized into three key stages: preprocessing and filtering of urban point clouds, podotactile pavement detection, and representation of sidewalk functional areas (Figure 1).
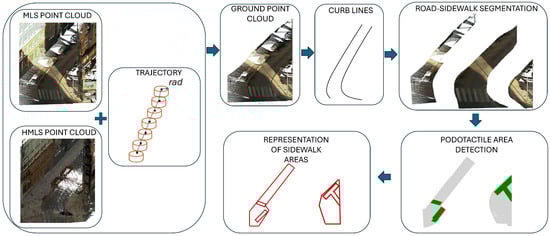
Figure 1.
Overview of the proposed workflow.
3.1. Pre-Processing and Filtering
This study focuses on the analysis of pavement sections located at or near road intersections, where podotactile surfaces are typically installed to assist visually impaired pedestrians at crossing points. To extract these relevant regions, a dedicated preprocessing stage is implemented to reduce the spatial extent of the dataset and isolate the ground-level sidewalk surfaces.
3.1.1. Section-Based Filtering
The first step of the method involves isolating the relevant ground surfaces from the whole urban point cloud. This is achieved through a spatial filtering process based on trajectory segmentation, elevation filtering [55], and localized geometric analysis. The filtering workflow relies on two parameters: , which defines the radius used for segmenting the trajectory into local sections, and h, a height threshold applied to retain only the points that belong to the ground level [29].
The procedure begins by dividing the point cloud into a series of local segments aligned along the MLS acquisition trajectory. This is accomplished by performing a spatial neighbourhood search around the trajectory points, where the parameter determines the extent of each segment. These segments enable a focused, localized analysis of the urban environment that accounts for spatial variability in geometry and elevation.
Within each segment, a vertical filtering is applied using the parameter h, which retains only the points whose elevation does not exceed a fixed height above the local reference surface. This effectively removes elevated features such as buildings, trees, and street furniture while preserving ground-level surfaces relevant for pedestrian infrastructure analysis (Figure 2). Figure 2a shows the raw MLS point cloud. Figure 2b illustrates the segmentation of the dataset into local cylindrical sections with radius around the MLS trajectory. Figure 2c displays the application of the elevation threshold (h) used to remove non-ground objects. Finally, Figure 2d presents the resulting point cloud after filtering, where only ground-level surfaces are retained.
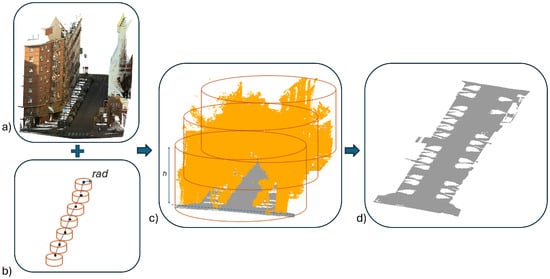
Figure 2.
Ground surface extraction. (a) Raw MLS data, (b) Trajectory-based segmentation, (c) Ground-level filtering, (d) Resulting filtered point cloud.
3.1.2. Curb-Based Sidewalk Extraction
Following this, sidewalk areas are separated from vehicular road surfaces by modelling curb geometries [14]. In the raw point cloud, curbs were already annotated as a distinct semantic class. These labelled curb points serve as the basis for reconstructing the geometric boundaries between pedestrian and vehicular zones. The process begins by dividing the curb point cloud into local cylindrical sections with a specific radius (r) around the MLS trajectory. Within each segment, the spatial distribution of curb points is used to compute representative centroids [31]. These centroids are then connected across adjacent segments to form curb polylines on both sides of the sidewalk.
Once the left and right curb lines are established, a polygonal representation of the sidewalk area is created by linking the start and end points of each line and merging them into a closed boundary. This polygon effectively delineates the extent of pedestrian spaces and is used to spatially filter the point cloud, retaining only those ground-level points that fall within the sidewalk domain. This curb-based spatial segmentation enables the extraction of a clean, well-defined sidewalk surface, suitable for the subsequent detection of tactile paving features (Figure 3). Figure 3a shows the filtered ground-level points obtained in the previous step. Figure 3b illustrates the segmentation of the MLS trajectory into local analysis sections using the cylindrical radius (r) that defines each segment. Figure 3c highlights the curb points annotated in the dataset. Figure 3d shows the grouping of curb points within each local segment and the centroid computed for each group. Figure 3e presents the reconstructed curb lines obtained by connecting centroids across consecutive segments. Figure 3f displays the resulting sidewalk polygon created by enclosing the left and right curb boundaries. In the last step, Figure 3g shows the classification of ground points into sidewalk (green) and road (blue) based on this curb-defined polygon.
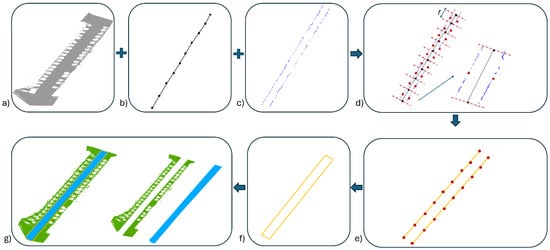
Figure 3.
Curb-based sidewalk extraction. (a) Filtered ground surface points, (b) Segmented MLS trajectory divided into local sections, (c) Curb points, (d) Curb points grouped by trajectory segment, with centroids computed per group (red points) to represent average curb location, (e) Curb lines reconstructed, (f) A polygon is generated from the curb lines, (g) Final classification of ground points as sidewalk (green) and road (blue).
Finally, the filtered sidewalk data is further constrained to regions located near road intersections. Road centrelines, derived from OpenStreetMaps (OSM) [56], are analyzed and each line segment is systematically compared against others to identify their intersection points, locations where two or more street segments converge [57,58]. Around each identified crossing, spatial buffers of radius are constructed, and the sidewalk point cloud is clipped accordingly. This ensures that the final dataset contains only those sidewalk areas that are adjacent to street intersections (Figure 4). Figure 4a shows the extraction of road centrelines from OpenStreetMap and the detection of their intersection points. Figure 4b illustrates the circular buffers created around each intersection using the buffer radius () to spatially limit the analysis to areas where tactile paving is expected. Figure 4c shows examples of intersection-adjacent sidewalk regions obtained after clipping the dataset using these buffers.
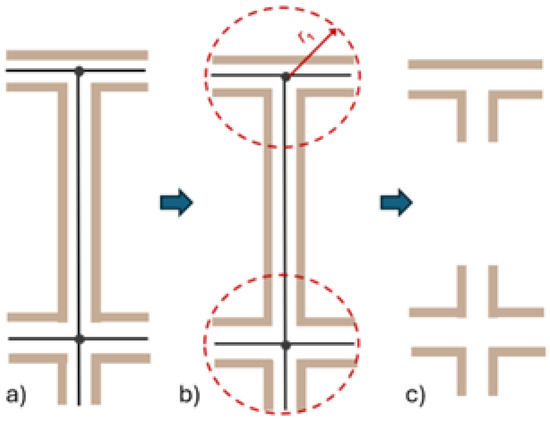
Figure 4.
Filtering sidewalk data based on intersection proximity. (a) Road centrelines are analyzed to detect intersections, (b) Buffers of radius , are generated, (c) Different intersection types.
3.2. Podotactile Pavement Detection
3.2.1. Rasterization and Data Augmentation
Once the sidewalk-specific points close to intersection areas are isolated from the larger urban point cloud, the next stage focuses on detecting podotactile paving using a deep learning–based image segmentation approach. As most semantic segmentation networks operate on 2D raster inputs [59], the filtered 3D sidewalk points are first transformed into image-mask pairs through a rasterization process [42]. A regular 2D grid is overlaid on the X-Y domain of the point cloud with a fixed spatial resolution. Within each grid cell, the RGB values of all included points are averaged to create a full-colour image representing the sidewalk surface. Simultaneously, a binary mask is generated to label the presence of tactile paving: any cell containing points annotated as podotactile is marked as foreground, while all others are assigned to the background. This rasterization step results in paired inputs suitable for supervised training, specifically, high-resolution images of the sidewalk and their corresponding ground-truth annotations.
To address the limited availability and uneven spatial distribution of podotactile samples in the training data, a comprehensive image augmentation strategy is adopted in two stages. In the first stage, general-purpose augmentations are applied uniformly across all image-mask pairs in order to increase visual and geometric diversity. Each original sample was augmented 10 times using randomized combinations of the following transformations: random rotations up to , horizontal flipping with a 50% probability, and vertical flipping with a 30% probability. To simulate variable illumination and image quality conditions, additional photometric changes were applied, including brightness and contrast adjustments (50% probability), additive Gaussian noise with a variance between 10 and 50, and image blurring using kernels up to pixels (30% probability). These augmentations preserved the geometric characteristics of the sidewalk patterns while improving the model’s ability to generalize across different scenes.
The second stage focused specifically on improving the representation of the minority class by augmenting only those samples containing podotactile elements. Each selected sample was first padded using the PadIfNeeded function from the Albumentations library [60]. This function automatically adds pixels to the bottom and right sides of an image if its dimensions are smaller than a specified threshold, in this case pixels. The padding is applied without altering the original image content, ensuring uniform input size across the dataset. This was followed by a cropping operation that guaranteed the cropped region contained podotactile pixels. This ensured that the relevant tactile features remained visible and centred. Then, 20 random augmentations were generated for each such sample using a combination of controlled spatial transformations: random shifts of up to 5% of the image size, scaling between and , and rotations up to along with horizontal and vertical flips (50% and 30% probability, respectively). As in the first stage, brightness/contrast adjustments (50% probability), Gaussian noise applied independently to each RGB channel with a variance between 10 and 50 (40% probability), and blurring ( kernel, 30% probability) were also applied. All images were processed in an 8-bit RGB format with pixel intensity values ranging from 0 to 255. This approach enriches the dataset with foreground-focused examples, improving the model’s sensitivity to small and spatially sparse tactile regions.
3.2.2. Sidewalk Segmentation
To identify podotactile regions within the captured images, this study implements a semantic segmentation model based on the DeepLabV3+ architecture [61]. The model leverages a ResNet-50 backbone [62] pretrained on a large-scale image classification dataset (ImageNet [63]) to extract multi-scale features that are essential for detecting subtle textures in complex urban scenes. The final classification layer of the network is adapted for binary segmentation by replacing it with a two-class output that distinguishes between the background (non-podotactile areas) and the foreground (podotactile surfaces). These class labels are defined based on manually annotated ground truth data, where pixels corresponding to tactile paving surfaces are marked as the foreground, and all other regions are considered background. The model is trained using the Adam optimizer [64], an adaptive learning algorithm that updates the weights of the network to minimize the loss function and improve segmentation performance. The model’s architecture enables it to integrate local texture cues with broader spatial context, which is critical for the precise detection of podotactile pavement.
The model is trained using a hybrid loss function that combines weighted cross-entropy and Dice loss [65]. The cross-entropy component addresses the class imbalance in the dataset by assigning higher importance to the underrepresented podotactile class, ensuring that the model learns to recognize minority class patterns despite their low occurrence. The Dice loss component encourages the overlap between predicted and ground truth masks, improving the segmentation of thin and elongated structures that are characteristic of podotactile features. This combination of loss functions is selected to mitigate class imbalance, improve sensitivity to rare patterns, and enhance the accuracy of the segmentation boundaries.
After the rasterization and augmentation stages, the dataset of sidewalk images and corresponding binary masks is divided into training, validation, and test. A weighted random sampling strategy is employed during training to ensure that podotactile samples are adequately represented in each batch. Specifically, the sampler assigns higher probabilities to images containing a larger proportion of podotactile features, encouraging the model to focus on detecting these minority class patterns during training. This sampling approach addresses the inherent class imbalance in the dataset and helps mitigate the risk of the model being biassed towards the background class. After training, the model was evaluated on the test set, providing an assessment of its generalization performance on previously unseen data. The dataset was split into 80% for training, 10% for validation, and 10% for testing. This splitting procedure was applied independently for each of the four dataset configurations (MLS Madrid, HMLS Madrid, MLS/HMLS Madrid, and the combined Madrid–Mantova dataset). The split was performed after the data augmentation stage to ensure balanced representation of podotactile and non-podotactile samples in all subsets.
Following this, the semantic segmentation predictions are mapped back to the original point cloud data. The predicted binary masks, which indicate the presence of podotactile pavement, are aligned with the corresponding point clouds of the regions of interest. Each point cloud is discretized into a regular 2D grid by projecting the points onto the horizontal plane and assigning each point a unique pixel ID based on its location. The pixel IDs from the rasterized point cloud are then used to transfer the predicted labels from the mask to the original 3D points (Figure 5). Figure 5a shows the input sidewalk point cloud before semantic segmentation. Figure 5b displays the rasterized RGB image. Figure 5c,d illustrate the DeepLabV3+ segmentation process using a ResNet-50 backbone pretrained on ImageNet and adapted to two output classes (background and podotactile). Figure 5e presents the predicted podotactile (blue) and non-podotactile (grey) labels mapped back onto their corresponding 3D points using the pixel-point correspondences established during rasterization.
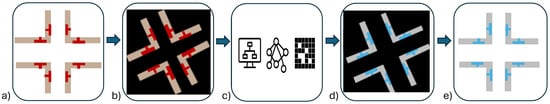
Figure 5.
Semantic segmentation workflow for podotactile surface detection. The point cloud (a) is rasterized into images (b), segmented using DeepLabV3+ with ResNet-50 (c,d) and mapped back to point clouds, (e) with podotactile (blue) and non-podotactile (grey) regions.
3.3. Representation of Sidewalk Functional Areas
Once the semantic segmentation model has been applied and the predicted labels have been mapped back to the original 3D point clouds, the final stage of the methodology involves the geometric modelling of sidewalk functional areas. This includes the creation of separate spatial representations for podotactile and non-podotactile regions.
The first step is to divide the data based on the predicted labels. Podotactile points (label 1) and non-podotactile points (label 0) are saved into separate files, allowing each class to be processed independently. To further isolate distinct tactile paving patches, the podotactile points are clustered using the DBSCAN (Density-Based Spatial Clustering of Applications with Noise) algorithm, which groups spatially dense points into coherent surface segments without requiring prior knowledge of the number of clusters [66]. Each resulting cluster corresponding to a distinct podotactile area is saved individually, while sparse points are discarded as noise.
For each clustered podotactile surface, a 2D alpha shape is generated to construct a precise boundary around the point cloud [67]. The -shape parameter controls the level of geometric detail retained in the reconstructed boundary. Lower -values generate tight, highly detailed polygons that closely follow the local arrangement of points, while higher -values produce smoother and more generalized shapes by bridging small concavities. This step transforms discrete point-based clusters into polygonal geometries that represent the spatial footprint of each tactile paving area. Using only the X and Y coordinates of each cluster, the alpha shape algorithm computes a concave hull based on an alpha parameter, which controls the level of detail in the resulting geometry. Smaller alpha values yield tighter shapes that follow the point distribution closely, while larger values result in smoother, more generalized boundaries. The final outputs are saved as individual shapefiles (i.e., standard geospatial vector files—SHP format—used to store polygon, line, and point geometries together with their associated attributes), each representing a distinct podotactile patch.
In contrast to directly computing a sidewalk polygon from each sidewalk point cloud, sidewalk outlines are derived by differencing two alpha shape geometries computed at the intersection scale. First, an intersection alpha shape is generated from the intersection point cloud (including both roadway and sidewalks). Second, a road alpha shape is generated from the road-only point cloud. The sidewalk extent is then obtained as the geometric difference between these two polygons.
Next, to distinguish tactile paving zones from the surrounding sidewalk area, a geometric difference operation is applied between the sidewalk alpha shapes and the podotactile alpha shapes. For each sidewalk segment, the podotactile alpha shapes are subtracted from the corresponding sidewalk polygon, resulting in a new geometry that precisely outlines the non-podotactile region (Figure 6). Figure 6a shows the predicted point cloud obtained from the semantic segmentation stage. Figure 6b isolates the podotactile points (class = 1). Figure 6c presents the results of DBSCAN clustering to group spatially dense tactile points into individual patches. Figure 6d displays the alpha shape polygons generated for each tactile cluster. Figure 6e shows the sidewalk polygon derived from larger-scale alpha shapes computed for road and intersection point clouds. Finally, Figure 6f illustrates the resulting sidewalk surface after subtracting the podotactile polygons from the sidewalk polygon. The subtraction is carried out using geometric operations on the shapefiles, ensuring that tactile paving footprints are excluded.
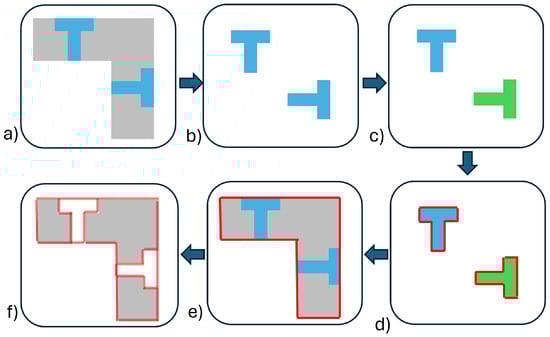
Figure 6.
Workflow for sidewalk area modelling. From the predicted point cloud, (a), podotactile points are isolated (b), clustered (c), and converted to alpha shapes (d). The full sidewalk surface is also modelled (e) and podotactile shapes are subtracted to extract non-podotactile areas (f).
4. Results and Discussion
4.1. Case Study and Data Acquisition
The proposed methodology was tested on urban road networks in two European cities: Madrid (Spain) and Mantova (Italy). The Madrid dataset covers approximately 9 km (Figure 7a) and is divided into two zones: zone 1 (≈6 km, Figure 7c) and zone 2 (≈3 km, Figure 7b). The Mantova dataset covers approximately 625 m, focusing on sidewalk infrastructure (Figure 7d). Across the two case study areas, a total of 47 intersections were analyzed (23 in Madrid Zone 1, 16 in Madrid Zone 2 and 8 in Mantova). These intersections include the pedestrian crossing environments where tactile paving is typically installed. The tactile paving surfaces in both cities usually cover areas between 3 and 12 , depending on the width of the crossing ramp and the tactile pattern required by local accessibility regulations.
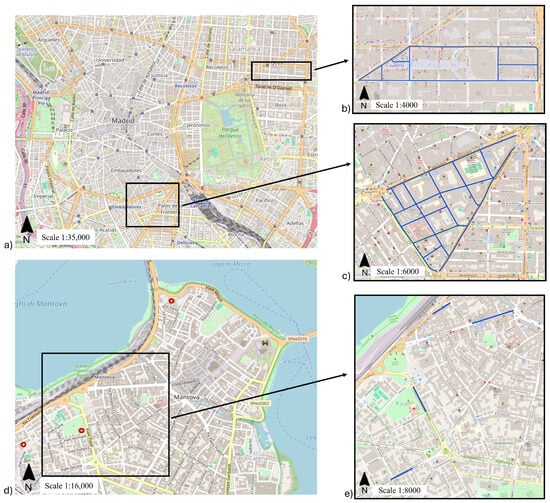
Figure 7.
Case study areas used for tactile paving segmentation. (a) City of Madrid with the locations of two acquisition zones highlighted. (b) Madrid Zone 2 comprising 8 streets, (c) Madrid Zone 1 comprising 11 streets, (d) City of Mantova with the surveyed area highlighted, (e) Detailed view of the Mantova study area.
Both case studies relied on point clouds acquired using complementary geospatial systems. The Madrid dataset includes data from two instruments: the Leica Pegasus TRK700 Evo mobile mapping system [68] and the Leica BLK2Go handheld mobile laser scanning (HMLS) device [69]. In contrast, the Mantova dataset was acquired exclusively with the Stonex X70GO HMLS [70], providing high-resolution scans of targeted pedestrian zones. To provide additional context on the acquisition procedures, we describe here how each laser scanning survey was conducted. The Leica Pegasus TRK700 Evo was mounted on a vehicle at approximately 2.20–2.40 m above ground level, with data collected at typical urban driving speeds of 20–35 km/h, resulting in an effective acquisition duration of 2–4 min per kilometre. The handheld Leica BLK2Go was carried at chest height (1.20–1.50 m) by an operator walking at 4–5 km/h and following looped trajectories to support SLAM stability and complete coverage of sidewalks and crossings. The Stonex X70GO was similarly operated at chest height (≈1.60 m) and was occasionally raised to ≈1.90 m especially at changes in direction or in areas with a particularly rich detail to be surveyed. Surveys were organized as closed loops, with the start and end positions of each acquisition corresponding. Ideally the survey path followed the sidewalks and the zebra crossing, so starting from one position, the paths followed one sidewalk, the zebra crossing, the sidewalk on the other side of the road, another zebra crossing, a portion of sidewalk to go back to the starting position. The acquisition speed corresponded to a relaxed walking pace (between 4 and 5 km/h). The data were saved in the instrument’s internal memory and the survey was managed using a proprietary app installed on a tablet or phone (Android or iPhone). For MLS data, trajectory estimation, georeferencing, and pre-classification were performed in Leica Cyclone Pegasus OFFICE on a workstation equipped with an Intel i7 processor, 32 GB RAM, and an NVIDIA GPU. Both MLS and HMLS datasets were stored on SSD-based devices due to their size and I/O demands, with typical data volumes ranging from 5 to 15 GB per kilometre for MLS acquisitions and 1–3 GB per section for HMLS.
The point clouds from Madrid captured by the TRK700 Evo were pre-classified using Cyclone Pegasus OFFICE, which automatically assigned semantic classes such as ground, curbs, buildings, trees, and others [71]. Cyclone Pegasus OFFICE performs object classification based on geometric, radiometric, and trajectory-derived features. According to the manufacturer, the TRK700 Evo mobile mapping system provides a positional accuracy of ≤20 mm RMS and a relative point accuracy of 8–15 mm under standard urban operating conditions. The classification engine in Cyclone Pegasus OFFICE follows rule-based detection of surface discontinuities, height jumps, planar regions, and linear curb structures to assign semantic labels. In contrast, the data from the BLK2Go system and Stonex X70GO did not include semantic labels and was processed using height-based and spatial filtering techniques, as described in Section 3.1, to isolate sidewalk surfaces. All datasets include not only 3D spatial coordinates (X, Y, Z), but also RGB colour values and laser intensity information.
Each acquisition platform differs in both field survey speed and the computational effort required to process the resulting point clouds. The workflow used in this study involves five main processing stages: trajectory computation, height and spatial filtering, rasterization, semantic segmentation and polygon reconstruction. For the Pegasus TRK700 Evo, these stages typically require approximately 10–20 min, 3–5 min, 2–4 min, 1–2 min and 1–3 min per kilometre, respectively. For the handheld BLK2Go and Stonex X70GO systems, trajectory computation generally requires 5–10 min per loop, while the remaining processing stages require approximately 3–5 min, 3–5 min, 1–2 min and 1–3 min per kilometre, respectively.
Once a georeferenced LAS file is available, the total processing time required by the proposed workflow is broadly similar across all systems, typically 20–35 min per kilometre, as the same filtering, rasterization and segmentation procedures are applied regardless of the acquisition method. Table 1 summarizes the survey effort and processing characteristics for each platform, including survey time per kilometre, total workflow processing time, typical data volumes and an indicative cost category.

Table 1.
Representative survey and processing characteristics for the three acquisition systems.
4.2. Input Datasets
To analyze how data resolution and acquisition system impact the segmentation of podotactile surfaces, four distinct datasets were defined based on the available point clouds. The MLS Madrid dataset includes only data collected using the TRK700 Evo system, representing standard mobile laser scanning quality (Figure 8a). The HMLS Madrid dataset contains only data captured with the BLK2Go device, offering higher spatial resolution suitable for finer surface features (Figure 8b). The third dataset, referred to as the MLS/HMLS Madrid dataset, merges input from both systems to train a unified model that benefits from sensor diversity. Finally, the combined dataset merges input from all three sources: MLS Madrid, HMLS Madrid, and HMLS Mantova, allowing the model to benefit from both sensor diversity and geographic variability.
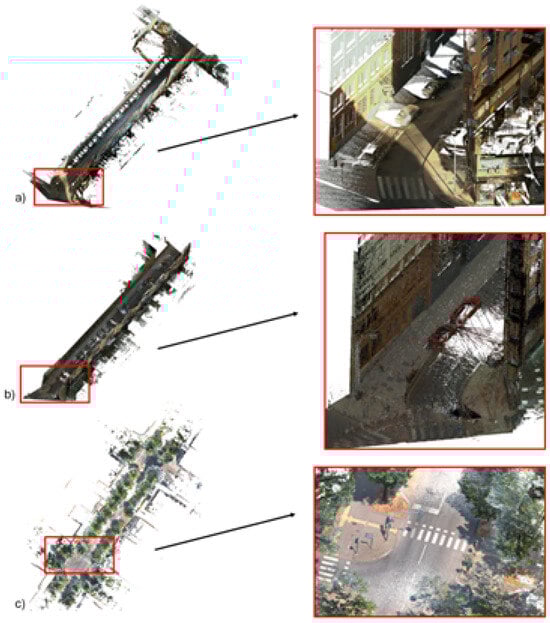
Figure 8.
Examples of input point clouds from Madrid acquisition systems. (a) MLS Madrid data acquired using the Leica Pegasus TRK700 Evo, (b) HMLS Madrid data captured with the Leica BLK2Go, (c) HMLS Mantova data captured with the Stonex X70GO.
4.3. Implementation
4.3.1. Section-Based Filtering
The section-based filtering process was applied to the entire point cloud dataset, with the objective of isolating ground-level surfaces while removing non-pedestrian elements. Using a cylindrical radius of 10 m () around the MLS trajectory, the point cloud was segmented into localized cylindrical sections. This allowed the filtering to adapt to the local geometry of each urban scene and maintain spatial continuity along the acquisition path.
A single-stage vertical filtering procedure was implemented by applying a height threshold (h) of . This operation retained only the points located below the threshold effectively removing elevated structures such as building facades, trees, and vehicles while preserving walkable surfaces like sidewalks (Figure 9). Figure 9a shows an example of the original unfiltered point cloud. Figure 9b shows the same region after applying the height threshold ( m), where only ground-level surfaces remain.
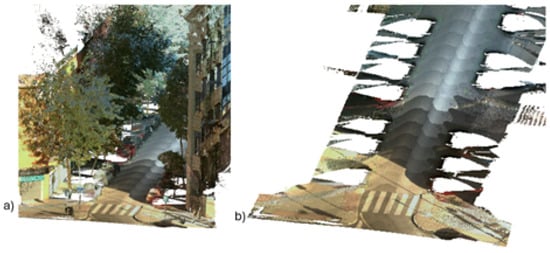
Figure 9.
Section-based filtering. (a) Original point cloud, (b) After ground height filtering, showing only walkable surfaces like sidewalks and roadways.
After applying the section-based filtering step, an average of 41% of the original points were retained across all segments. This reduction highlights the effectiveness of the filtering strategy in discarding irrelevant elements while preserving detailed information on pedestrian surfaces. The retained points form a refined subset optimized for subsequent sidewalk extraction and tactile surface analysis.
4.3.2. Curb-Based Sidewalk Extraction
After isolating ground-level surfaces through filtering, the next stage focused on distinguishing pedestrian sidewalk areas from adjacent road surfaces using curb-based segmentation. In the dataset captured by the Pegasus TRK700 Evo, curb elements had already been annotated as a distinct semantic class by the processing software. These labelled curb points served as the foundation for reconstructing sidewalk boundaries.
The curb point cloud was first segmented into localized sections based on the MLS trajectory, using a cylindrical radius (r) of 5 m. Within each segment, curb points were grouped, and their spatial distribution was used to compute representative centroids. These centroids were then connected across adjacent sections to generate continuous curb polylines on both sides of the sidewalk. In most cases, this step produced clear curb lines corresponding to the left and right edges of pedestrian zones. These curb lines were then merged into closed polygons that accurately delineated the sidewalk boundaries. The resulting polygons were used to spatially filter the ground-level point clouds, retaining only the points falling within the defined sidewalk areas. This operation effectively excluded road surfaces, resulting in a clean and well-structured dataset focused exclusively on sidewalk zones.
The approach performed consistently across the network, with most segments yielding geometrically accurate sidewalk boundaries. A total of 62 sidewalk surfaces were extracted from the dataset, corresponding to 30 for Madrid zone 1, 24 for Madrid zone 2 and 8 for Mantova dataset (Figure 10). The segmentation process produced clear and continuous sidewalk boundaries. Even in areas with curved geometries or varying widths, the resulting polygons closely followed the actual curb layout.
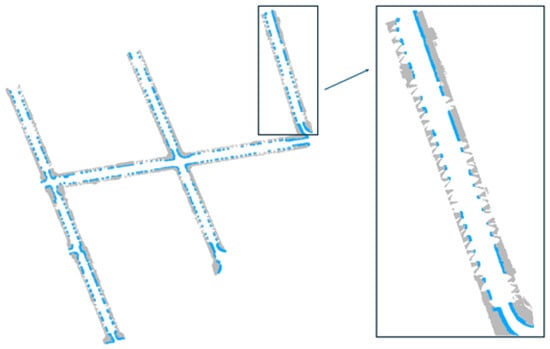
Figure 10.
Some of the resulting sidewalk surfaces in grey colour and their curbs in blue colour.
To limit the analysis to tactile paving-relevant areas, the extracted sidewalks were clipped using circular buffers of radius () equal to 20 m around road intersections, identified from OpenStreetMap centrelines. A total of 47 intersections were detected within the study area, 23 for Madrid zone 1, 16 for Madrid zone 2, and 8 for Mantova. After applying the intersection buffers, 137 sidewalk surfaces were retained, corresponding to the sidewalk segments adjacent to these crossings. These filtered sidewalk areas formed the final input dataset for the detection and modelling of tactile paving features, ensuring that the analysis was spatially focused on regions where such elements are expected to occur.
4.3.3. Rasterization and Data Augmentation
After isolating the sidewalk surfaces near intersections, the filtered 3D point clouds were converted into rasterized image-mask pairs using a top-down projection. Each raster image represented an sidewalk segment at a spatial resolution of 2 cm per pixel, resulting in images of pixels. RGB values within each grid cell were averaged to produce coherent images that preserved surface colour and texture characteristics (Figure 11).
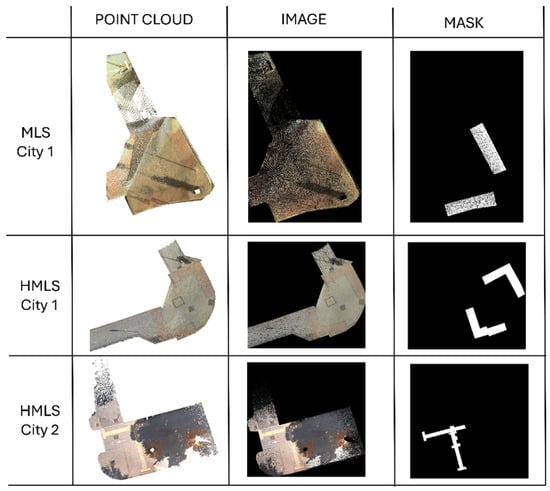
Figure 11.
Examples of the rasterization process used to generate training data.
Binary masks were generated in parallel to annotate the presence of podotactile surfaces. In each mask, pixels corresponding to podotactile point cloud labels were marked as foreground (1), while the remaining pixels were assigned to the background (0). As expected, tactile paving covered only a small fraction of most scenes, but nearly all rasterized pairs contained at least some tactile elements, since the selection focused on crossing-adjacent sidewalk areas.
To address class imbalance and improve the robustness of the segmentation model, a two-stage data augmentation procedure was applied independently to each dataset configuration. For the MLS Madrid subset, 65 original image–mask pairs were first augmented 10 times using general-purpose transformations, resulting in 650 additional samples. A second augmentation stage targeting podotactile variability was then applied, producing 1200 more samples. This led to a total of 1915 samples for the MLS dataset. For the HMLS Madrid subset, the original 51 samples were similarly augmented, generating 510 images during the first stage and 960 during the second, resulting in 1521 HMLS Madrid samples overall. For the MLS/HMLS Madrid configuration, the full set of 116 original images was processed through both augmentation stages, leading to a total of 3320 samples. Finally for the combined dataset of Madrid and Mantova, a total of 137 original image-mask pairs were used. Due to smaller size of the Mantova subset, its samples were first augmented 20 times, followed by an additional 40 augmentations targeting minority-class (podotactile) features. This resulted in a higher number of synthetic samples per original pair. Overall, the combined dataset produced 5897 samples, incorporating a broader diversity of surface materials, urban textures, and acquisition conditions across cities.
The final datasets ensured a more even representation of both background and tactile paving regions across training inputs, addressing the imbalance at the spatial level and enhancing the model’s ability to learn subtle but meaningful distinctions (Figure 12). Figure 12a shows an original sidewalk image containing podotactile features. Figure 12b illustrates a geometric augmentation (rotation), and Figure 12c shows a photometric augmentation (brightness change). Figure 12d,e present foreground-focused augmentations where transformations are applied specifically to preserve and enhance podotactile regions.
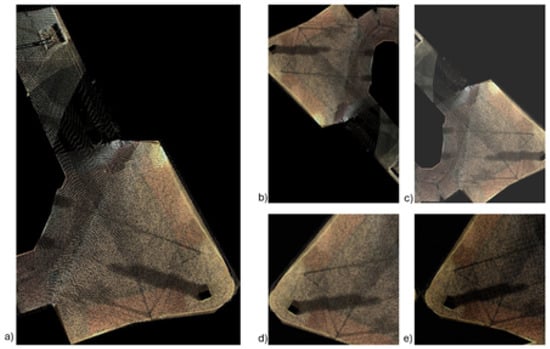
Figure 12.
Example of image augmentations on MLS Madrid images with podotactile areas. (a) Original input image, (b) Geometric augmentation using rotation, (c) Photometric change in brightness, (d) Foreground-focused augmentation (minority class) using rotation and cropping, (e) Foreground-focused brightness adjustment.
4.3.4. Sidewalk Segmentation
The DeepLabV3+ model with a ResNet-50 backbone was trained on the rasterized dataset to segment podotactile surfaces from surrounding sidewalk areas. The model architecture, implemented using PyTorch [72] and TorchVision [73] frameworks, was initialized with ImageNet-pretrained weights, and its final classification layer was modified to output two classes: background and podotactile surface. The training input consisted of pixel RGB raster images, normalized using standard ImageNet mean and standard deviation values. The patch size was chosen to balance local spatial context with computational efficiency, ensuring that most input tiles contain complete sidewalk areas while remaining memory efficient.
The model was trained using the Adam optimizer with an initial learning rate of and learning rate scheduling was handled through a ReduceLROnPlateau, which reduced the learning rate when the validation F1-score plateaued. The loss function combined weight cross-entropy (with class weights of for background and for podotactile) and Dice loss [74], emphasizing accurate segmentation of the minority class. A weighted random sampler was employed to ensure that images with higher podotactile content were more likely to appear in each training batch, directly addressing class imbalance at the sample level.
Training was conducted independently for each of the four datasets: MLS Madrid, HMLS Madrid, MLS/HMLS Madrid and the combined Madrid–Mantova dataset. In all cases, the same training configuration was applied to ensure fair comparison. Each dataset was trained over 40 epochs with a batch size of 8. The augmented training sets contained 1915 samples for the MLS Madrid subset, 1521 samples for the HMLS Madrid subset, 3320 samples for the MLS/HMLS Madrid subset, and 5897 samples for the combine Madrid–Mantova subset. For each configuration, the data was split in 80% for training, 10% for validation, and 10% for testing.
Performance was evaluated using standard segmentation metrics: pixel accuracy, precision, recall, F1-score, and Intersection over Union (IoU), computed separately for the podotactile and non-podotactile classes [75]. Pixel accuracy measures the proportion of correctly classified pixels across the entire image. Precision quantifies the share of predicted tactile-paving pixels that correspond to true positives, while recall measures the proportion of reference tactile-paving pixels that are correctly detected. The F1-score, defined as the harmonic mean of precision and recall, offers a balanced measure of performance when both false positives and false negatives are relevant. The Intersection over Union expresses the spatial agreement between predicted and reference masks by comparing their area of overlap to their area of union. On the validation set, the MLS Madrid model achieved a podotactile F1-score of and an IoU of , reflecting solid performance despite the lower point cloud resolution. The combined Madrid–Mantova dataset yielded an F1-score of and an IoU of , showing improved generalization across cities and acquisition conditions. The MLS/HMLS Madrid model further enhanced performance, reaching a podotactile F1-score of and an IoU of , confirming the benefit of combining sensor modalities. However, the best results were obtained by the HMLS Madrid model, which achieved a podotactile F1-score of and an IoU of , underscoring the value of higher-resolution input in accurately capturing tactile features (Table 2).
Table 2.
Performance metrics for the classification.
Despite the model’s overall effectiveness, some misclassifications persist across all configurations. False positives were most frequent in sidewalk areas with texture variations or surface wear patterns that visually resemble tactile paving, particularly in the lower-resolution MLS Madrid setup. False negatives were more common in occluded or shadowed regions, or in scenes with faint or degraded podotactile markings. Separate normalized confusion matrices for the four datasets (MLS Madrid, HMLS Madrid, MLS/HMLS Madrid and combined Madrid–Mantova) are shown in Figure 13a–d, respectively, summarizing pixel-level classification performance in each case. A comparative view of segmentation results from the three trained models is provided in Figure 14, illustrating differences in spatial accuracy and prediction consistency across the datasets. Each row shows the rasterized input image (left), ground-truth mask (middle), and model prediction (right). Rows correspond to examples from MLS Madrid, HMLS Madrid, and HMLS Mantova, demonstrating differences in spatial resolution, surface texture, and prediction accuracy. Examples of failure cases, highlighting false positive and false negative predictions, are shown in Figure 15, offering insight into common sources of error. These observations underscore the challenges of real-world urban scenes and motivate further refinements in data diversity and model design.
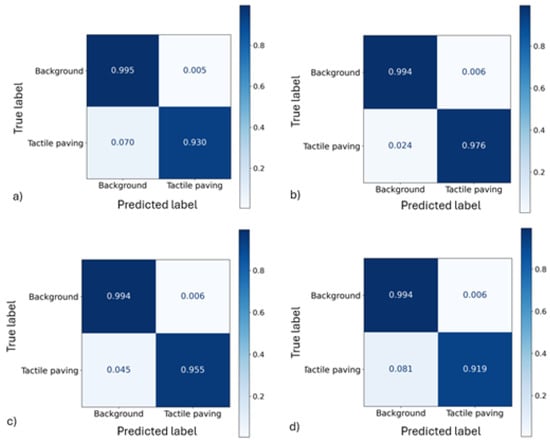
Figure 13.
Normalized confusion matrices showing pixel-wise classification performance for the two target classes: background and podotactile surface. Results are presented for (a) the MLS Madrid dataset. (b) the HMLS Madrid dataset. (c) the MLS/HMLS Madrid dataset. (d) the combined Madrid–Mantova dataset.
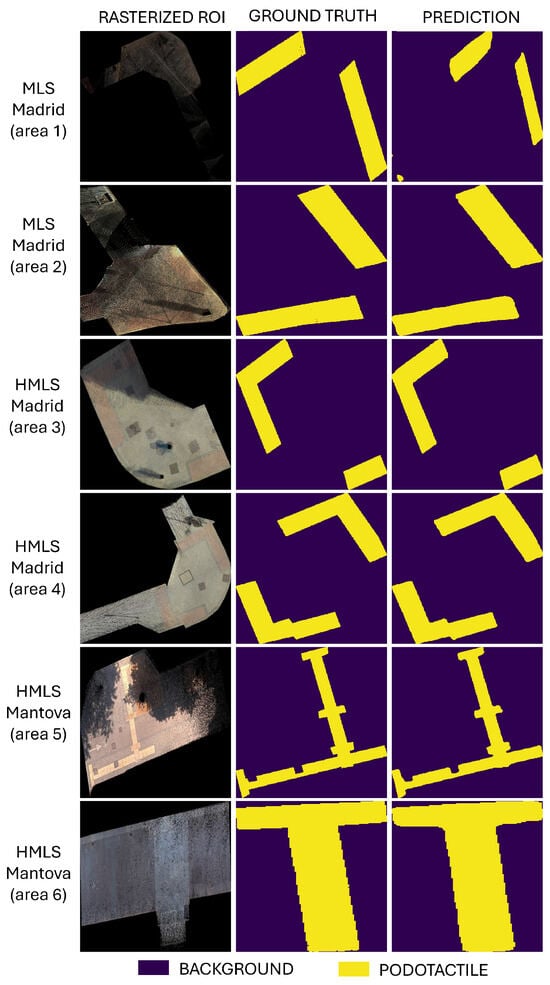
Figure 14.
Examples of podotactile surface segmentation results for various input configurations. Each row shows a rasterized input region (left), the corresponding ground truth mask (middle), and the model prediction (right). The examples include data from MLS Madrid (zoom 1–2), HMLS Madrid (zoom 3–4), and HMLS Mantova (zoom 5–6). Yellow indicates podotactile areas, and purple indicates background.
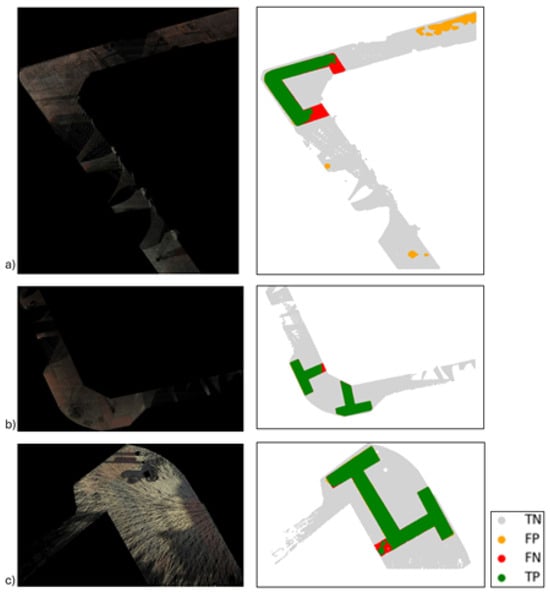
Figure 15.
Classification errors in three scenes (a–c). Left: input images; right: segmentation with true positives (green), true negatives (grey), false positives (orange), and false negatives (red).
4.3.5. Representation of Sidewalk Functional Areas
Following the segmentation of podotactile surfaces, the predicted labels were transferred back to the original 3D point clouds, enabling the spatial modelling of distinct functional sidewalk zones. This process is illustrated in Figure 16, which shows the transition from input point clouds to predicted podotactile regions and the resulting polygonal representations. From the full set of 137 intersection-adjacent sidewalk segments across Madrid and Mantova, podotactile points were detected in approximately 88% of the cases, confirming the model’s ability to identify tactile surfaces across a wide range of conditions.
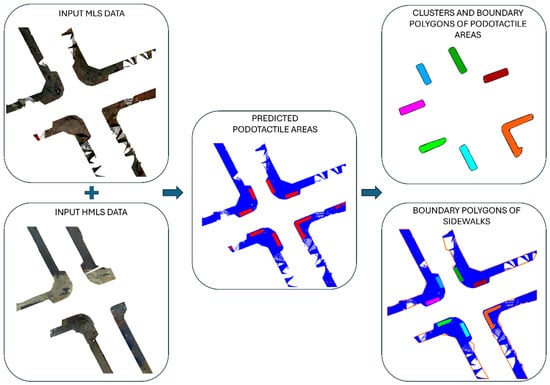
Figure 16.
Input point clouds from MLS and HMLS. Predicted podotactile (red) and non-podotactile (blue) areas. Cluster polygons and full sidewalk boundaries are derived from the segmented output.
To further structure the predicted podotactile regions, a clustering process was applied using the DBSCAN algorithm. The clustering was performed using a minimum number of points (min_samples = 10) and a neighbourhood radius (eps = 0.1). These values were empirically selected to balance noise removal with the preservation of relevant tactile patches. As a result, 132 distinct podotactile clusters were identified across the dataset: 110 from Madrid and 22 from Mantova.
Each tactile cluster was transformed into a 2D polygon using alpha shape generation, with an parameter of , which provided sufficiently detailed geometries without overfitting to noise. These polygons successfully captured the spatial extent of the tactile tiles and were exported individually as shapefiles.
For the sidewalks, polygonal outlines were obtained through a two-step alpha-shape process. First, an intersection alpha shape was computed grom the point cloud of each crossing area, followed by a road alpha shape generated from the corresponding road-only points. Both were created using the same alpha value (), selected to ensure consistent boundaries. The sidewalk polygons were then derived as the geometric difference between these two shapes, resulting in valid sidewalk boundary geometries for all 132 segments.
Finally, to represent non-podotactile areas, the union of podotactile polygons was subtracted from the corresponding sidewalk polygons. The result was a clear partition of each sidewalk segment into podotactile and non-podotactile zones. These outputs, exported as separate shapefiles, provide a detailed and structured spatial representation of sidewalk functionality, suitable for GIS analysis or integration into 3D urban models.
4.4. Discussion
The results presented in this study demonstrate the effectiveness of using mobile laser scanning and handheld mobile laser scanning data, combined with semantic segmentation techniques, to detect and model podotactile pavement in urban environments. The highest segmentation performance was achieved on the HMLS Madrid dataset with, F1-score and IoU, reaching and , respectively. Given that most existing tactile paving assessments rely on 2D image analysis, this study introduces an automated solution based on 3D spatial data, offering a more scalable and transport-relevant alternative for mapping pedestrian infrastructure at city scale.
The comparative evaluation across four dataset configurations, MLS Madrid, HMLS Madrid, MLS/HMLS Madrid, and the combined Madrid–Mantova dataset, highlighted key insights into the influence of sensor type and geographic diversity. While the HMLS Madrid model delivered the highest accuracy due to its fine spatial resolution and ground-level perspective, the combined dataset showed notable strength in generalization. With an F1-score of and an IoU of , the model trained on data from two cities and mixed acquisition platforms performed consistently well across diverse urban settings. These findings highlight the feasibility of deploying this approach across cities for consistent, data-driven auditing of tactile infrastructure in support of inclusive transport systems.
A significant contribution lies in the model’s ability to detect small, structurally distinct features such as tactile paving, which typically occupy a minor portion of the scene. In particular, the Mantova dataset, being smaller in size, benefited from a more intensive augmentation strategy, which contributed to the balance and robustness of the combined training set. The majority of detected podotactile areas were red, while the Mantova dataset contributed additional variability with grey and yellow tiles. This chromatic diversity highlights the method’s ability to generalize across tactile paving materials and colour variations.
The structured reconstruction of functional sidewalk areas from segmentation results represents another key contribution. By applying clustering and alpha shape generation, the method translated raw predictions into GIS-compatible polygonal geometries that distinguish between podotactile and non-podotactile regions. This step enabled the creation of precise, usable outputs that can be integrated into existing spatial databases or 3D urban models.
Despite these promising results, some limitations remain. While high performance was achieved across all datasets, generalization to unseen environments with different materials, lighting, or occlusion patterns has not yet been extensively validated. The reliance on RGB raster data introduces potential sensitivity to visual distortions caused by surface wear, shadowing, or obstruction. In addition, the alpha shape parameter used for polygon generation may require adjustment when applied to point clouds of different densities or scales.
The three acquisition systems used in this study present different trade-offs between cost, survey effort and achievable accuracy. The Pegasus TRK700 Evo (MLS) provides the fastest data collection speed (2–4 min/km), although it requires higher-cost equipment. The handheld BLK2Go and Stonex X70GO systems involve lower equipment costs and are well suited for pedestrian environments but require substantially longer survey times (approximately 48–55 min/km). Once a georeferenced point cloud is produced, however, the processing time required by the proposed workflow is comparable across systems (20–35 min/km), as the same filtering, rasterization and segmentation steps are applied regardless of the acquisition platform.
When compared with traditional approaches for documenting tactile paving, such as manual field surveys or rule-based colour/intensity filtering, the proposed deep-learning workflow offers substantial advantages in accuracy, robustness and scalability. Manual surveys are labour-intensive and costly to update across entire cities, while rule-based techniques are highly sensitive to illumination changes, surface wear and material heterogeneity. The improved detection accuracy, automation and cross-city generalization demonstrated in this study therefore justify the increased initial investment in mobile laser scanning and computational processing, particularly for applications requiring consistent and up-to-date tactile paving inventories.
Another aspect for consideration is the dependence on intersection-focused sampling, which, while appropriate for capturing podotactile zones, may limit the model’s applicability to other tactile paving deployments (e.g., in transit stations or mid-block crossings). Future work could extend the sampling and detection framework to encompass a wider range of tactile installations and examine the generalizability of the approach across diverse urban typologies and geographic contexts.
5. Conclusions
This paper introduced an end-to-end methodology for the automated detection and spatial modelling of podotactile paving using 3D point clouds acquired from both mobile and handheld laser scanning platforms. The workflow integrates geometric filtering, image-based semantic segmentation, and spatial clustering to generate structured, GIS-ready representations of sidewalk areas with and without tactile paving. Targeting sidewalk segments adjacent to pedestrian crossings, where podotactile surfaces are commonly found, the approach demonstrates high potential for large-scale deployment in transportation accessibility assessments and smart mobility systems.
High-resolution rasterization was used to convert point clouds into image-mask pairs for DeepLabV3+ model training under four scenarios: MLS Madrid data, HMLS Madrid data, MLS/HMLS Madrid, and a combined Madrid–Mantova dataset.
Evaluation results revealed that the HMLS Madrid model achieved the highest F1-score and IoU, benefiting from its finer resolution and closer ground perspective. The combined Madrid–Mantova dataset demonstrated strong generalization across cities and sensor types. The MLS/HMLS Madrid configuration slightly outperformed the MLS Madrid model, indicating the value of data fusion despite minor variance.
Importantly, while the majority of the detected podotactile surfaces were red (typical in the Madrid dataset) the model also successfully segmented grey and yellow tiles found in the Mantova dataset. This indicates the pipeline’s robustness to visual and material variation across different urban contexts.
To our knowledge, there is no previous work that fully automates the extraction and spatial modelling of podotactile paving from point clouds. This study therefore addresses an important gap in transportation accessibility research by providing a scalable and adaptable solution based on deep learning and geospatial analysis.
Overall, the proposed pipeline addresses a notable gap in transportation infrastructure mapping by offering a scalable, automated solution for detecting tactile paving infrastructure. The use of semantic segmentation models in conjunction with point cloud geometry offers a promising direction for translating raw MLS data into meaningful, actionable insights for urban planning, pedestrian safety, transport equity, and inclusive design.
Future research will explore extending the method to include additional sidewalk attributes, integrating it with standardized 3D city model formats such as CityGML 3.0 [76], and validating the approach across more diverse urban contexts and MLS platforms. By supporting the automated documentation of accessibility features, this work contributes to the development of more inclusive, data-driven urban environments.
Author Contributions
Methodology, Elisavet Tsiranidou and Daniele Treccani; software, Elisavet Tsiranidou and Daniele Treccani; resources, Daniele Treccani, Andrea Adami and Lucía Díaz-Vilariño; investigation, Elisavet Tsiranidou; visualization, Elisavet Tsiranidou; supervision, Andrea Adami, Antonio Fernández and Lucía Díaz-Vilariño; conceptualization, Antonio Fernández and Lucía Díaz-Vilariño; writing—original draft preparation, Elisavet Tsiranidou; writing—review and editing, Daniele Treccani, Andrea Adami, Antonio Fernández and Lucía Díaz-Vilariño; funding acquisition, Lucía Díaz-Vilariño. All authors have read and agreed to the published version of the manuscript.
Funding
This work was partially supported by human resources grant RYC2020-029193-I funded by MCIN/AEI/10.13039/501100011033 and FSE ‘El FSE invierte en tu futuro’, by grant ED431F 2022/08 funded by Xunta de Galicia, Spain-GAIN, and by the projects CNS2022-135730 funded by MCIN/AEI/10.13039/501100011033 and by European Union NextGenerationEU/PRTR and PID2024-157803OB-I00 funded by MICIU/AEI/10.13039/501100011033/FEDER, UE.
Data Availability Statement
The raw data supporting the conclusions of this article will be made available by the authors on request.
Conflicts of Interest
The authors declare no conflicts of interest.
References
- Lucas, K. Transport and social exclusion: Where are we now? Transp. Policy 2012, 20, 105–113. [Google Scholar] [CrossRef]
- Geurs, K.T.; van Wee, B. Accessibility evaluation of land-use and transport strategies: Review and research directions. J. Transp. Geogr. 2012, 12, 127–140. [Google Scholar] [CrossRef]
- Pereira, R.H.M.; Schwanen, T.; Banister, D. Distributive justice and equity in transportation. Transp. Rev. 2017, 37, 170–191. [Google Scholar] [CrossRef]
- Chidiac, S.E.; Reda, M.A.; Marjaba, G.E. Accessibility of the Built Environment for People with Sensory Disabilities—Review Quality and Representation of Evidence. Buildings 2024, 14, 707. [Google Scholar] [CrossRef]
- Hosseini, M.; Sevtsuk, A.; Miranda, F.; Cesar, R.M.; Silva, C.T. Mapping the walk: A scalable computer vision approach for generating sidewalk network datasets from aerial imagery. Comput. Environ. Urban Syst. 2023, 101, 101950. [Google Scholar] [CrossRef]
- Yang, J.; Fricker, P.; Jung, A. From intangible to tangible: The role of big data and machine learning in walkability studies. Comput. Environ. Urban Syst. 2024, 109, 102087. [Google Scholar] [CrossRef]
- Alnaim, M.M.; Mesloub, A.; Alalouch, C.; Noaime, E. Reclaiming the Urban Streets: Evaluating Accessibility and Walkability in the City of Hail’s Streetscapes. Sustainability 2025, 17, 3000. [Google Scholar] [CrossRef]
- Ma, Y.; Gu, X.; Zhang, W.; Hu, S.; Liu, H.; Zhao, J.; Chen, S. Evaluating the effectiveness of crosswalk tactile paving on street-crossing behavior: A field trial study for people with visual impairment. Accid. Anal. Prev. 2021, 163, 106420. [Google Scholar] [CrossRef]
- Braun, A.; Warth, G.; Bachofer, F.; Schultz, M.; Hochschild, V. Mapping Urban Structure Types Based on Remote Sensing Data—A Universal and Adaptable Framework for Spatial Analyses of Cities. Land 2023, 12, 1885. [Google Scholar] [CrossRef]
- Schnebele, E.; Tanyu, B.F.; Cervone, G. Review of remote sensing methodologies for pavement management and assessment. Eur. Transp. Res. Rev. 2015, 7, 7. [Google Scholar] [CrossRef]
- Fernández-Arango, D.; Varela-García, F.A.; González-Aguilera, D.; Lagüela-López, S. Automatic Generation of Urban Road 3D Models for Pedestrian Studies from LiDAR Data. Remote Sens. 2022, 14, 1102. [Google Scholar] [CrossRef]
- Suleymanoglu, B.; Soycan, M.; Toth, C. 3D Road Boundary Extraction Based on Machine Learning Strategy Using LiDAR and Image-Derived MMS Point Clouds. Sensors 2024, 24, 503. [Google Scholar] [CrossRef]
- Wang, J.; Dong, X.; Liu, G. Extraction of Urban Road Boundary Points from Mobile Laser Scanning Data Based on Cuboid Voxel. ISPRS Int. J. Geo-Inf. 2023, 12, 426. [Google Scholar] [CrossRef]
- Zhao, L.; Yan, L.; Meng, X. The Extraction of Street Curbs from Mobile Laser Scanning Data in Urban Areas. Remote Sens. 2021, 13, 2407. [Google Scholar] [CrossRef]
- Díaz-Vilariño, L.; González-Jorge, H.; Bueno, M.; Arias, P.; Puente, I. Automatic classification of urban pavements using mobile LiDAR data and roughness descriptors. Constr. Build. Mater. 2016, 102, 208–215. [Google Scholar] [CrossRef]
- Tran, T.H.; Taweep, C. Automated extraction of expressway road surface from mobile laser scanning data. J. Cent. South Univ. 2020, 27, 1917–1938. [Google Scholar] [CrossRef]
- Tamagusko, T.; Gomes Correia, M.; Ferreira, A. Machine Learning Applications in Road Pavement Management: A Review, Challenges and Future Directions. Infrastructures 2024, 9, 213. [Google Scholar] [CrossRef]
- Lakoud, M.; Morales, E.; Ruiz-Rodrigo, A.; Feillou, I.; Mathieu, S.; Routhier, F. Enhancing shared street accessibility in heritage sites for individuals with visual disabilities: A Canadian perspective. Front. Rehabil. Sci. 2024, 5, 1419446. [Google Scholar] [CrossRef]
- Zhang, Y.; Wang, J.; Wang, X.; Dolan, J.M. Road-Segmentation-Based Curb Detection Method for Self-Driving via a 3D-LiDAR Sensor. IEEE Trans. Intell. Transp. Syst. 2018, 19, 3981–3991. [Google Scholar] [CrossRef]
- Deng, L.; Zhang, A.; Guo, J.; Liu, Y. An Integrated Method for Road Crack Segmentation and Surface Feature Quantification under Complex Backgrounds. Remote Sens. 2023, 15, 1530. [Google Scholar] [CrossRef]
- Ito, K.; Biljecki, F. Assessing bikeability with street view imagery and computer vision. Transp. Res. Part C Emerg. Technol. 2021, 132, 103371. [Google Scholar] [CrossRef]
- Bustos, C.; Rhoads, D.; Solé-Ribalta, A.; Masip, D.; Arenas, A.; Lapedriza, A.; Borge-Holthoefer, J. Explainable, automated urban interventions to improve pedestrian and vehicle safety. Transp. Res. Part C Emerg. Technol. 2021, 125, 103018. [Google Scholar] [CrossRef]
- Silva, P.B.; Andrade, M.; Ferreira, S. Machine learning applied to road safety modeling: A systematic literature review. J. Traffic Transp. Eng. (Engl. Ed.) 2020, 7, 775–790. [Google Scholar] [CrossRef]
- Sohail, A.; Cheema, M.A.; Ali, M.E.; Toosi, A.N.; Rakha, H.A. Data-driven approaches for road safety: A comprehensive systematic literature review. Saf. Sci. 2023, 158, 105949. [Google Scholar] [CrossRef]
- Al Shammas, T.; Gullón, P.; Klein, O.; Escobar, F. Development of a GIS-based walking route planner with integrated comfort walkability parameters. Comput. Environ. Urban Syst. 2023, 103, 101981. [Google Scholar] [CrossRef]
- Balado, J.; González, E.; Verbree, E.; Díaz-Vilariño, L.; Lorenzo, H. Automatic detection and characterization of ground occlusions in urban point clouds from mobile laser scanning data. ISPRS Ann. Photogramm. Remote Sens. Spat. Inf. Sci. 2020, VI-4/W1-2020, 13–20. [Google Scholar] [CrossRef]
- Soilán, M.; Truong-Hong, L.; Riveiro, B.; Laefer, D. Automatic extraction of road features in urban environments using dense ALS data. Int. J. Appl. Earth Obs. Geoinf. 2018, 64, 226–236. [Google Scholar] [CrossRef]
- Di Benedetto, A.; Fiani, M.; Petti, L.; Repetto, E. Road surface modelling and characterization from terrestrial LiDAR data. Int. Arch. Photogramm. Remote Sens. Spat. Inf. Sci. 2023, XLVIII-1/W1-2023, 113–120. [Google Scholar] [CrossRef]
- Steinke, N.; Goehring, D.; Rojas, R. GroundGrid: LiDAR Point Cloud Ground Segmentation and Terrain Estimation. IEEE Robot. Autom. Lett. 2024, 9, 420–426. [Google Scholar] [CrossRef]
- Deng, W.; Chen, X.; Jiang, J. A Staged Real-Time Ground Segmentation Algorithm of 3D LiDAR Point Cloud. Electronics 2024, 13, 841. [Google Scholar] [CrossRef]
- Balado, J.; Díaz-Vilariño, L.; Arias, P.; Lorenzo, H. Point clouds for direct pedestrian pathfinding in urban environments. ISPRS J. Photogramm. Remote Sens. 2019, 148, 184–196. [Google Scholar] [CrossRef]
- Horváth, E.; Pozna, C.; Unger, M. Real-Time LiDAR-Based Urban Road and Sidewalk Detection for Autonomous Vehicles. Sensors 2022, 22, 194. [Google Scholar] [CrossRef]
- Maye, J.; Kaestner, R.; Siegwart, R. Curb detection for a pedestrian robot in urban environments. In Proceedings of the 2012 IEEE International Conference on Robotics and Automation, Saint Paul, MN, USA, 14–18 May 2012; pp. 367–373. [Google Scholar] [CrossRef]
- Zhao, G.; Ma, F.; Qi, W.; Liu, Y.; Liu, M.; Ma, J. CurbNet: Curb Detection Framework Based on LiDAR Point Cloud Segmentation. IEEE Trans. Intell. Transp. Syst. 2025, 26, 8961–8974. [Google Scholar] [CrossRef]
- Xu, P.; Liu, S.; Zhang, Y.; Wu, X.; Zhao, D. Urban road boundary detection method based on 3D LiDAR and road shape classification. Measurement 2025, 256, 118073. [Google Scholar] [CrossRef]
- Zou, Z.; Lang, H.; Lu, J.; Ma, Q. Coarse-to-refined road curb segmentation from MLS point clouds. Autom. Constr. 2024, 166, 105586. [Google Scholar] [CrossRef]
- Lang, H.; Peng, Y.; Zou, Z.; Zhu, S.; Peng, Y.; Du, H. Multi-Feature-Filtering-Based Road Curb Extraction from Unordered Point Clouds. Sensors 2024, 24, 6544. [Google Scholar] [CrossRef]
- Wang, H.; Feng, D. Rapid Geometric Evaluation of Transportation Infrastructure Based on a Proposed Low-Cost Portable Mobile Laser Scanning System. Sensors 2024, 24, 425. [Google Scholar] [CrossRef]
- Cui, P.; Abdel-Aty, M.; Han, L.; Yang, X. Multiscale geographical random forest: A novel spatial ML approach for traffic safety modeling integrating street-view semantic visual features. Transp. Res. Part C Emerg. Technol. 2025, 179, 105299. [Google Scholar] [CrossRef]
- Zhang, X.; Liang, L.; Zhao, S.; Wang, Z. GRFB-UNet: A new multi-scale attention network with group receptive field block for tactile paving segmentation. Expert Syst. Appl. 2024, 238, 122109. [Google Scholar] [CrossRef]
- Ghilardi, M.C.; Macedo, R.C.; Manssour, I.H. A New Approach for Automatic Detection of Tactile Paving Surfaces in Sidewalks. Procedia Comput. Sci. 2016, 80, 662–672. [Google Scholar] [CrossRef]
- Treccani, D.; Fernández, A.; Díaz-Vilariño, L.; Adami, A. Automating the inventory of the navigable space for pedestrians on historical sites: Towards accurate path planning. Int. J. Appl. Earth Obs. Geoinf. 2023, 122, 103400. [Google Scholar] [CrossRef]
- Hou, Q.; Ai, C. A network-level sidewalk inventory method using mobile LiDAR and deep learning. Transp. Res. Part C Emerg. Technol. 2020, 119, 102772. [Google Scholar] [CrossRef]
- Yussif, A.M.; Zayed, T.; Taiwo, R.; Fares, A. Sidewalk Pavement Defect Detection with Instance Segmentation: A Step Towards Improving Sidewalk Quality. Proc. CIB Conf. 2025, 1, 378. [Google Scholar] [CrossRef]
- Elamin, A.; El-Rabbany, A. UAV-Based Image and LiDAR Fusion for Pavement Crack Segmentation. Sensors 2023, 23, 9315. [Google Scholar] [CrossRef] [PubMed]
- Zhang, Y.; Gao, X.; Zhang, H. Deep Learning-Based Semantic Segmentation Methods for Pavement Cracks. Information 2023, 14, 182. [Google Scholar] [CrossRef]
- Yuki, I.; Premachandra, C.; Sumathipala, S.; Sudantha, B.H. HSV Conversion Based Tactile Paving Detection for Developing Walking Support System to Visually Handicapped People. In Proceedings of the 2019 IEEE 23rd International Symposium on Consumer Technologies (ISCT), Ancona, Italy, 19–21 June 2019; pp. 138–142. [Google Scholar] [CrossRef]
- Takano, T.; Nakane, T.; Yu, J.; Zhang, C. Tactile Paving Detection and Tracking Using Tenji10K Dataset. IEEJ Trans. Electr. Electron. Eng. 2024, 19, 1661–1672. [Google Scholar] [CrossRef]
- Poggi, M.; Mattoccia, S. A wearable mobility aid for the visually impaired based on embedded 3D vision and deep learning. In Proceedings of the 2016 IEEE Symposium on Computers and Communication (ISCC), Messina, Italy, 27–30 June 2016; pp. 208–213. [Google Scholar] [CrossRef]
- Yamanaka, Y.; Takaya, E.; Kurihara, S. Tactile tile detection integrated with ground detection using an RGB-depth sensor. In Proceedings of the ICAART 2020—Proceedings of the 12th International Conference on Agents and Artificial Intelligence, Valletta, Malta, 22–24 February 2020; SciTePress: Rome, Italy, 2020; pp. 750–757. [Google Scholar]
- Ito, Y.; Premachandra, C.; Sumathipala, S.; Premachandra, H.W.H.; Sudantha, B.S. Tactile Paving Detection by Dynamic Thresholding Based on HSV Space Analysis for Developing a Walking Support System. IEEE Access 2021, 9, 20358–20367. [Google Scholar] [CrossRef]
- Niu, L.; Bao, H. Fast Tactile Paving Segmentation Model Based on Reparameterized Structure. In Proceedings of the GAIIS ’24: Proceedings of the 2024 International Conference on Generative Artificial Intelligence and Information Security; Association for Computing Machinery: San Francisco, CA, USA, 2024; pp. 24–28. [Google Scholar] [CrossRef]
- Pembuain, A.; Priyanto, S.; Suparma, L.B. The evaluation of tactile ground surface indicator condition and effectiveness on the sidewalk in Yogyakarta City, Indonesia. IATSS Res. 2020, 44, 1–7. [Google Scholar] [CrossRef]
- Abidi, M.H.; Noor Siddiquee, A.; Alkhalefah, H.; Srivastava, V. A comprehensive review of navigation systems for visually impaired individuals. Heliyon 2024, 10, e31825. [Google Scholar] [CrossRef]
- Sithole, G.; Vosselman, G. Experimental comparison of filter algorithms for bare-Earth extraction from airborne laser scanning point clouds. ISPRS J. Photogramm. Remote Sens. 2004, 59, 85–101. [Google Scholar] [CrossRef]
- OpenStreetMap Contributors. OpenStreetMap. 2025. Available online: https://www.openstreetmap.org (accessed on 5 May 2025).
- Tsiranidou, E.; Brea Portals, A.; Fernández Álvarez, A.; Díaz Vilariño, L. Semantic enrichment of urban space: A point cloud-based framework for road marking analysis. ISPRS Ann. Photogramm. Remote Sens. Spat. Inf. Sci. 2024, X-4/W5-2024, 281–288. [Google Scholar] [CrossRef]
- Tsiranidou, E.; González-Cabaleiro, P.; Fernández, A.; Díaz-Vilariño, L. A framework for road space extraction from point clouds and integration into 3D city models. Int. J. Appl. Earth Obs. Geoinf. 2025, 143, 104803. [Google Scholar] [CrossRef]
- Long, J.; Shelhamer, E.; Darrell, T. Fully convolutional networks for semantic segmentation. In Proceedings of the 2015 IEEE Conference on Computer Vision and Pattern Recognition (CVPR), Boston, MA, USA, 7–12 June 2015; pp. 3431–3440. [Google Scholar] [CrossRef]
- Buslaev, A.; Iglovikov, V.I.; Khvedchenya, E.; Parinov, A.; Druzhinin, M.; Kalinin, A.A. Albumentations: Fast and Flexible Image Augmentations. Information 2020, 11, 125. [Google Scholar] [CrossRef]
- Chen, L.C.; Papandreou, G.; Kokkinos, I.; Murphy, K.; Yuille, A.L. DeepLab: Semantic Image Segmentation with Deep Convolutional Nets, Atrous Convolution, and Fully Connected CRFs. IEEE Trans. Pattern Anal. Mach. Intell. 2018, 40, 834–848. [Google Scholar] [CrossRef] [PubMed]
- He, K.; Zhang, X.; Ren, S.; Sun, J. Deep Residual Learning for Image Recognition. In Proceedings of the 2016 IEEE Conference on Computer Vision and Pattern Recognition (CVPR), Las Vegas, NV, USA, 27–30 June 2016; pp. 770–778. [Google Scholar] [CrossRef]
- Deng, J.; Dong, W.; Socher, R.; Li, L.J.; Li, K.; Fei-Fei, L. ImageNet: A large-scale hierarchical image database. In Proceedings of the 2009 IEEE Conference on Computer Vision and Pattern Recognition, Miami, FL, USA, 20–25 June 2009; pp. 248–255. [Google Scholar] [CrossRef]
- Kingma, D.P.; Ba, J. Adam: A Method for Stochastic Optimization. arXiv 2014, arXiv:1412.6980. [Google Scholar] [CrossRef]
- Li, J.; Zhang, H.; Chen, L.; He, B.; Chen, H. CSNet: A Remote Sensing Image Semantic Segmentation Network Based on Coordinate Attention and Skip Connections. Remote Sens. 2025, 17, 2048. [Google Scholar] [CrossRef]
- Ester, M.; Kriegel, H.P.; Sander, J.; Xu, X. A density-based algorithm for discovering clusters in large spatial databases with noise. In Proceedings of the Knowledge Discovery and Data Mining, Portland, OR, USA, 2–4 August 1996; pp. 226–231. [Google Scholar]
- Edelsbrunner, H.; Kirkpatrick, D.; Seidel, R. On the shape of a set of points in the plane. IEEE Trans. Inf. Theory 1983, 29, 551–559. [Google Scholar] [CrossRef]
- Leica Geosystems AG. Leica Pegasus TRK700 Evo: Mobile Mapping System; Leica Geosystems AG: Heerbrugg, Switzerland, 2024; Available online: https://leica-geosystems.com/products/mobile-mapping-systems/hardware/leica-pegasus-trk-evo (accessed on 10 September 2025).
- Leica Geosystems AG. Leica BLK2GO: Handheld Mobile Laser Scanner; Leica Geosystems AG: Heerbrugg, Switzerland, 2024. Available online: https://shop.leica-geosystems.com/es/es-ES/leica-blk/blk2go/overview (accessed on 10 September 2025).
- Stonex S.r.l. Stonex X70GO: Handheld Mobile Mapping System; Stonex S.r.l.: Milan, Italy, 2024. [Google Scholar]
- Leica Pegasus. OFFICE. 2025. Available online: https://leica-geosystems.com/products/mobile-mapping-systems/software/leica-pegasus-office (accessed on 10 September 2025).
- Paszke, A.; Gross, S.; Massa, F.; Lerer, A.; Bradbury, J.; Chanan, G.; Killeen, T.; Lin, Z.; Gimelshein, N.; Antiga, L.; et al. PyTorch: An Imperative Style, High-Performance Deep Learning Library. In Proceedings of the Advances in Neural Information Processing Systems, Vancouver, BC, Canada, 8–14 December 2019; Volume 32. [Google Scholar]
- TorchVision maintainers and contributors. TorchVision: PyTorch’s Computer Vision Library. GitHub Repository. 2016. Available online: https://github.com/pytorch/vision (accessed on 4 December 2025).
- Dice, L.R. Measures of the Amount of Ecologic Association Between Species. Ecology 1945, 26, 297–302. [Google Scholar] [CrossRef]
- Manning, C.D.; Raghavan, P.; Schütze, H. Introduction to Information Retrieval; Cambridge University Press: New York, NY, USA, 2008. [Google Scholar]
- Open Geospatial Consortium. OGC City Geography Markup Language (CityGML 3.0) Part 1: Conceptual Model Standard; Technical Report OGC 20-010; Open Geospatial Consortium: Wayland, MA, USA, 2021; Available online: http://www.opengis.net/doc/IS/CityGML-1/3.0 (accessed on 4 December 2025).
Disclaimer/Publisher’s Note: The statements, opinions and data contained in all publications are solely those of the individual author(s) and contributor(s) and not of MDPI and/or the editor(s). MDPI and/or the editor(s) disclaim responsibility for any injury to people or property resulting from any ideas, methods, instructions or products referred to in the content. |
© 2025 by the authors. Published by MDPI on behalf of the International Society for Photogrammetry and Remote Sensing. Licensee MDPI, Basel, Switzerland. This article is an open access article distributed under the terms and conditions of the Creative Commons Attribution (CC BY) license (https://creativecommons.org/licenses/by/4.0/).