Article

Spatiotemporal Analysis of Urban Perception Using Multi-Year Street View Images and Deep Learning

1
School of Architecture and Urban Planning, Chongqing University, Chongqing 400044, China
2
School of Architecture, Tianjin University, Tianjin 300072, China
3
College of Landscape Architecture, Zhejiang A&F University, Hangzhou 311300, China
4
Faculty VI—Planning Building Environment, Institute of Architecture, Technische Universität Berlin, 10623 Berlin, Germany
*
Author to whom correspondence should be addressed.
These authors contributed equally to this work.
ISPRS Int. J. Geo-Inf. 2025, 14(10), 390; https://doi.org/10.3390/ijgi14100390 (registering DOI)
Submission received: 8 April 2025 / Revised: 19 July 2025 / Accepted: 31 July 2025 / Published: 8 October 2025

Abstract

Spatial perception is essential for understanding residents’ subjective experiences and well-being. However, effective methods for tracking changes in spatial perception over time and space remain limited. This study proposes a novel approach that leverages historical street view imagery to monitor the evolution of urban spatial perception. Using the central urban area of Shanghai as a case study, we applied machine learning techniques to analyze 67,252 street view images from 2013 and 2019, aiming to quantify the spatiotemporal dynamics of urban perception. The results reveal the following: temporally, the average perception scores in 2019 increased by 4.85% compared to 2013; spatially, for every 1.5 km increase in distance from the city center, perception scores increased by an average of 0.0241; among all sampling points, 65.79% experienced an increase in perception, while 34.21% showed a decrease; and in terms of visual elements, natural features such as trees, vegetation, and roads were positively correlated with perception scores, whereas artificial elements like buildings, the sky, sidewalks, walls, and fences were negatively correlated. The analytical framework developed in this study offers a scalable method for measuring and interpreting changes in urban perception and can be extended to other cities. The findings provide valuable time-sensitive insights for urban planners and policymakers, supporting the development of more livable, efficient, and equitable urban environments.

1. Introduction

In recent decades, the planning and configuration of modern cities have undergone continuous evolution, accompanied by a restructuring of various functional spaces. Consequently, new challenges have arisen regarding the built environment and spatial equity among residents [1]. “Place” is defined as a spatial location endowed with meaning through human experience [2], while individuals’ perception and cognition of such places are, in turn, profoundly shaped by their physical and social attributes [3]. Measuring human perception of place across different time periods facilitates a deeper understanding of the spatiotemporal dynamics of urban development and helps to uncover intra-urban heterogeneity and the impacts of functional transformations.
For a long time, effectively gathering perceptual data on residents’ subjective experiences of urban environments has remained a central concern across multiple research domains [4,5]. Traditional methods—such as interviews [6], paper-based questionnaires, or online surveys [7]—have been the primary tools employed. However, these approaches are typically constrained by specific temporal and spatial contexts, making it difficult to achieve large-scale, longitudinal tracking. As cycles of urban development become increasingly compressed, it is becoming ever more challenging to capture in a timely manner the effects of urban change on residents’ lived experiences. Accordingly, understanding citizens’ perception of urban places at different points in time holds significant value for both researchers and urban policymakers. This study proposes an innovative analytical framework that integrates machine learning models with multi-year street-level imagery, offering a novel methodological approach for the continuous monitoring and interpretation of residents’ perceptions of urban places. In doing so, it contributes both theoretically and methodologically to the study and practice of urban spatial analysis. In the context of large-scale and multi-temporal streetscape imagery data, traditional qualitative methods face limitations in comprehensively and continuously tracking urban spatial changes. Therefore, it is essential to develop a quantitative analytical framework that can be deeply integrated with qualitative research to enable complementary and synergistic insights.
Public perception of the urban built environment is increasingly oriented towards high-quality development, with growing evidence of its significant impact on both physical and mental health, as well as the overall residential experience [7]. Urban streets not only serve as connectors of the physical elements within the built environment but also accommodate the everyday activities and life scenes of residents [8]. Simultaneously, they function as carriers of urban natural spaces, offering venues for social interaction, leisure, and a range of community activities [9]. Street spaces that are perceived as high-quality play a vital role in shaping individual behavioral patterns, the frequency of outdoor engagement, public health outcomes, and the continuity and development of urban cultural identity [10,11,12]. As such, they contribute meaningfully to enhancing urban well-being indices and exert a profound influence on the everyday lives and overall welfare of residents [13]. Moreover, high-quality street environments can foster greater enthusiasm for outdoor activities, thereby promoting improvements in physical fitness and psychological well-being [14]. Accordingly, evaluating urban spatial perception based on the built environment plays a critical role in informing urban planning processes and enhancing the quality of life of city dwellers [15].
Given that the urban built environment constitutes a highly complex system, there is an urgent need for systematic approaches to assess changes in its spatial quality. Traditional studies on spatial perception have primarily relied on indicator systems grounded in sensory dimensions to detect and evaluate human perceptual responses. For instance, such research has typically focused on auditory perception [16,17,18], visual perception [13,19,20], and environment-related psychological stress [7,21]. These studies often depend on expert evaluations or participants’ multisensory assessments of on-site scenarios. While methodologically rigorous, they frequently face challenges including high costs, limited spatial coverage, and difficulties in application at city-wide scales. In recent years, the increasing availability of street-level imagery through platforms such as Google and Baidu Maps has drawn considerable attention to vision-based spatial perception assessment. Street view imagery offers distinct advantages, including wide spatial coverage, fine-grained spatial sampling, and a perspective closely aligned with that of pedestrians. These characteristics present new opportunities for the automated evaluation of urban spatial quality [22]. Furthermore, the richness of street-level imagery, combined with rapid advances in computer vision technologies [23], has laid a theoretical foundation for the digital modelling of urban spatial characteristics. Researchers have increasingly employed street view imagery in tasks such as image classification [24], semantic segmentation [25], and object detection [26], leading to the development of large-scale spatial perception datasets. In summary, street view imagery provides a promising avenue—through the lens of visual perception—for large-scale, cost-effective, and efficient assessments of urban spatial experience.
Due to the complex mechanisms underpinning the relationship between visual perception and the urban environment [27,28], significant research gaps remain in this field. Current analyses of urban spatial perception largely remain confined to single temporal snapshots [29], while earlier studies have predominantly concentrated on methodological development [30], paying relatively limited attention to the spatial disparities between intra-urban and peri-urban development. Moreover, although visual elements are often regarded as key explanatory variables in understanding various urban phenomena [31], their temporal dynamics—and how such changes influence perceptions of urban space—are frequently overlooked. To address these research gaps and to uncover the spatiotemporal patterns of change in urban perception, this study proposes the following two research questions: (1) How can urban spatial perception at different temporal cross-sections be calculated using street-level imagery? (2) How do changes in visual elements influence the evolution of urban spatial perception?
The structure of this study is organized as follows. First, it reviews theoretical perspectives on visual perception, the research applications of street-level imagery, and the evolution of historical street view data, in order to identify existing research gaps and ongoing challenges. Second, the data section introduces the crowdsourced perception data and multi-year street view imagery employed in the study, alongside the corresponding preprocessing procedures that underpin the subsequent analysis. The methodology section then elaborates in detail on the computational framework for perception analysis and the underlying modelling mechanisms. The results section presents the key findings systematically, focusing on the spatial distribution and temporal evolution of urban perception, as well as the influence of visual elements on perceptual change. Finally, the study concludes with a discussion structured around four dimensions: empirical insights, scholarly contributions, policy implications, and research limitations.

2. Background and Related Work

2.1. Urban Spatial Perception Measurement Method

In order to measure and characterize urban spatial perception, scholars from various disciplines have proposed a range of methodological approaches. Thompson, for example, designed a series of questionnaires based on the analysis of urban street space characteristics and collected detailed information on perceived spatial quality through face-to-face engagement with volunteers [32]. To this day, survey questionnaires remain one of the most commonly employed methods for assessing street perception. Beyond questionnaires, some studies have inferred perceptual experiences indirectly by observing residents’ behaviors and interactions within street environments [33]. Others, adopting a landscape value framework, have used structured questionnaires to evaluate perceptions of micro-urban places, revealing that overall urban impressions are significantly influenced by the types of landscape value present [34]. In terms of expert-based assessments, Bishop invited professionals from urban planning, architecture, and landscape design to evaluate street perception, offering a more specialized and expert-driven perspective [35]. Similarly, Wang assessed urban spatial perception by collecting human behavioral data—such as the frequency of public space use, duration of stay, and behavioral patterns—to serve as indirect indicators [36]. In research exploring the link between perception and physiological responses, Calder monitored changes in facial expressions to investigate their correlation with subjective perception [37], while Zhang employed physiological indicators such as heart rate and skin conductance to assess perceptual responses within street environments [38]. Overall, while these traditional methods—based on volunteer input or behavioral data—can yield authentic and direct perceptual insights, their applicability at city-wide scales is often constrained by significant labor and time costs.
However, with regard to vision-based research on perceptual information, the construction of multidimensional indicator systems facilitates a comprehensive assessment of urban performance. For example, one study employed immersive virtual reality technology to explore the dynamic effects of transitional zones between built and natural environments on urban residents’ perceptions [39]. In another study, which utilized deep learning on panoramic virtual reality images, researchers modelled visual walking perception and quantified as well as visualized its key visual features, demonstrating the applicability of this approach to perceptual studies across various urban forms [40]. Notably, the Place Pulse project developed by the Massachusetts Institute of Technology stands out. This project has built the largest street-level dataset of urban visual perception to date through large-scale volunteer evaluations focused on specific perceptual dimensions [41,42,43,44]. Building on this foundation, an increasing number of researchers have extended the study of urban visual evaluation using the same perceptual indicators [44,45,46]. Thus, conducting urban perception assessments based on the widespread availability of street view imagery has emerged as an efficient and scalable research pathway.

2.2. Street View Imagery in Urban Studies

The use of street-level imagery for visual perception assessment has emerged in recent years as a novel approach within urban studies [47,48]. Offering a pedestrian-oriented perspective on urban space, street view images possess notable advantages such as broad spatial coverage and fine-grained spatial sampling [49], making them widely applicable across studies of urban environments and phenomena at varying spatial scales [50]. In terms of image processing, street view imagery is often analyzed using datasets developed in the autonomous driving domain, due to the similarity in application scenarios—particularly in recognizing built environment elements within street view. For instance, the ADE20K [51] and Cityscapes [52] datasets are extensively used for tasks such as object recognition and semantic segmentation. In urban research, the most commonly analyzed visual elements include greenery, the sky, buildings, roads, and pedestrians. These features not only provide accurate representations of streetscape composition but also serve as valuable indicators for interpreting a wide range of urban spatial phenomena.
Street view imagery has been widely utilized to assess urban greening structure and vegetation levels, enabling the detailed identification of the spatial distribution of trees, shrubs, and herbaceous plants [53,54,55,56,57]. Such analyses provide valuable evidence to inform urban greening strategies and planning decisions [58]. When combined with object detection and other computer vision techniques, street-level imagery can further support the identification of specific plant species and their precise spatial locations, thus enabling the fine-grained management of urban green infrastructure [59,60,61,62]. In the analysis of street geometry, street view imagery has also been employed to extract urban “street canyon” morphologies [63]. Its application in architectural research is similarly extensive, encompassing tasks such as building height estimation [64], seismic vulnerability assessment, construction era approximation [65], and the evaluation of historic building quality [66]. Furthermore, street view imagery has proven valuable for measuring sky-related features. It has been applied to calculate sky view factor [67], assess the solar reflectivity of building façades [68], and estimate solar radiation levels [69,70,71]. In addition to environmental and architectural studies, street-level imagery has increasingly been integrated into research on economic and transport phenomena, as well as multi-source data fusion. For example, it has been used to infer neighborhood-level socioeconomic conditions [72,73], evaluate traffic conditions [74,75], and support integrated analysis with other data types [76].
In urban perception research, street view imagery serves not only to reflect the objective conditions of urban spaces but also to interpret residents’ subjective experiences. Existing studies have utilized street-level imagery to construct perceptual indicators for evaluating street walkability [77,78,79]. In the realm of safety perception, researchers have developed crime risk assessment frameworks based on street view imagery, supporting urban policymakers in optimizing resource allocation and formulating targeted interventions. Moreover, studies have revealed strong associations between residents’ perceptions of mental well-being and the built environment [12,80,81,82]. Some findings even suggest that obesity rates may correlate with environmental characteristics visible in street-level imagery [83]. However, it is important to note that most existing research on urban perception relies on street imagery drawn from mixed time periods, often overlooking the temporal attributes of the images. This leads to the insufficient consideration of the temporal sensitivity of urban perception. Addressing this gap represents one of the key innovations and contributions of the present study.

2.3. Time Series Street View Research

Recent studies have explored a range of urban phenomena and their impacts on residents’ perceptions [84,85]. However, as cities represent dynamic and continuously evolving systems, important questions remain insufficiently addressed—particularly concerning how changes in visual elements influence the broader transformation of urban form, and how the interrelationships between such changes can be effectively identified.
Although the temporal distribution of street-level imagery is constrained by the data collection frequency of mapping service providers, the existing datasets remain adequate to support the objectives of this study. By integrating conventional visual perception methodologies with the temporal availability of street view imagery at consistent spatial locations, this research undertakes a spatiotemporal investigation of urban perception over an extended time span.
Previous studies on urban street perception have made significant strides beyond the limitations of traditional questionnaire-based methods. However, few have approached the topic from the perspective of multi-year street view data to examine changes in perceived street quality over time. Multi-year street imagery offers valuable insights into the historical evolution of urban street quality perception. This not only aids researchers in understanding long-term development trends and patterns but also provides robust evidence to inform urban planning and policymaking [66]. By comparing street view imagery from different years, researchers can visually observe dynamic changes in functional layout [43], green coverage [86], and seasonal variation [87]. Such comparisons reveal key features of perceptual change in street quality throughout the urban development process, as well as the primary factors driving urban transformation. Moreover, multi-year street view data can be employed to evaluate the impact of urban policies. For instance, changes in perceived street quality before and after policy implementation can be analyzed to assess policy effectiveness and sustainability, thereby offering a scientific basis for future policy refinement [88]. These data can also support analyses of urban gentrification dynamics [89]. In addition, multi-year imagery facilitates the identification of spatial disparities in street quality across different urban areas and the tracking of their temporal evolution. This enables urban planning and management authorities to pinpoint underperforming or high-performing areas and develop more targeted interventions, ultimately contributing to more sustainable and equitable urban development.

3. Study Area and Data Sources

This section provides a detailed overview of the two primary data sources utilized in the study and clarifies their respective roles in predicting human perception and assessing changes in the urban core. First, the study employs six categories of urban perception ratings from the MIT Place Pulse dataset as training samples. These are used to develop and train machine learning models capable of learning the perceptual features embedded in the urban environment as experienced by humans. The dataset includes the following perceptual dimensions: safety, beautiful, depressing, lively, wealthy, and boring. Second, the study incorporates multi-year street view imagery, which is fed into the trained models to predict perception scores of urban spaces across different time points. This enables the analysis of spatiotemporal trends in urban perception and facilitates a deeper understanding of the evolving quality of city spaces.

3.1. Study Area

This study focuses on the central urban area of Shanghai located within the Outer Ring Road, encompassing approximately 664 square kilometers and home to a resident population of around 11 million. Characterized by a high population density and a high level of urbanization, the area exhibits the typical features of a major metropolitan center, making it both representative and valuable for urban research (Figure 1) [90]. As a megacity situated along China’s southeastern coast, Shanghai functions not only as the country’s economic and financial hub but also as a key transportation node and a highly internationalized city, rich in cultural assets and open to global exchange. According to the Seventh National Population Census, Shanghai’s total population is approximately 24.87 million, with over half residing in the central urban area, which serves as the focal point for the city’s economic, commercial, and cultural activities [91]. The study area within the Outer Ring Road encompasses a diverse range of street types, from high-rise financial districts to traditional residential neighborhoods with a distinct architectural character, reflecting a highly heterogeneous urban spatial structure.

3.2. MIT Place Pulse Dataset

The Place Pulse 2.0 dataset was developed in 2013 by the Massachusetts Institute of Technology (MIT) Media Lab [92]. This project collected public evaluations of urban street view via an online platform designed to capture subjective perceptions of cities. The platform randomly presented two street view images from the same city and invited volunteers to compare them based on one of six perceptual dimensions: safety, beautiful, depressing, lively, wealthy, and boring. Participants were asked to answer the question “Which place feels more [dimension]?” by selecting one of three options: the left image, the right image, or both equally, thereby expressing their judgement. This pairwise comparison approach enabled the large-scale collection of human perceptual data in a structured format. Figure 2 illustrates the user interface of the online platform.
The Place Pulse 2.0 dataset comprises 110,988 street view images collected via the Google Maps platform between 2007 and 2012. These images span 56 cities across 28 countries on six continents (Table 1). For each city, images were obtained through dense random spatial sampling, with accompanying metadata that include geographic coordinates and camera heading information. As of October 2016, a total of 81,630 online participants had completed 1,169,078 pairwise comparisons [93]. These participants represented 162 countries, both developed and developing, reflecting the dataset’s global diversity. To assess potential bias and consistency within the data, the research team conducted statistical significance tests on the correlation between perceptual responses and participants’ demographic profiles. The results indicated no significant perceptual differences across demographic groups, suggesting the absence of systematic bias. In addition, the consistency of perceptual ratings was validated through tests of score repeatability and transitivity, confirming the dataset’s robustness in capturing subjective perception. This study employs the full set of street view images and corresponding perception comparisons from the Place Pulse 2.0 dataset as the core training data for machine learning model development. The complete dataset, along with background information on the Place Pulse project and related research outputs, is publicly accessible at the following URL: https://centerforcollectivelearning.org/urbanperception (accessed on 1 August 2025).

3.3. Historical Street View Data of Shanghai

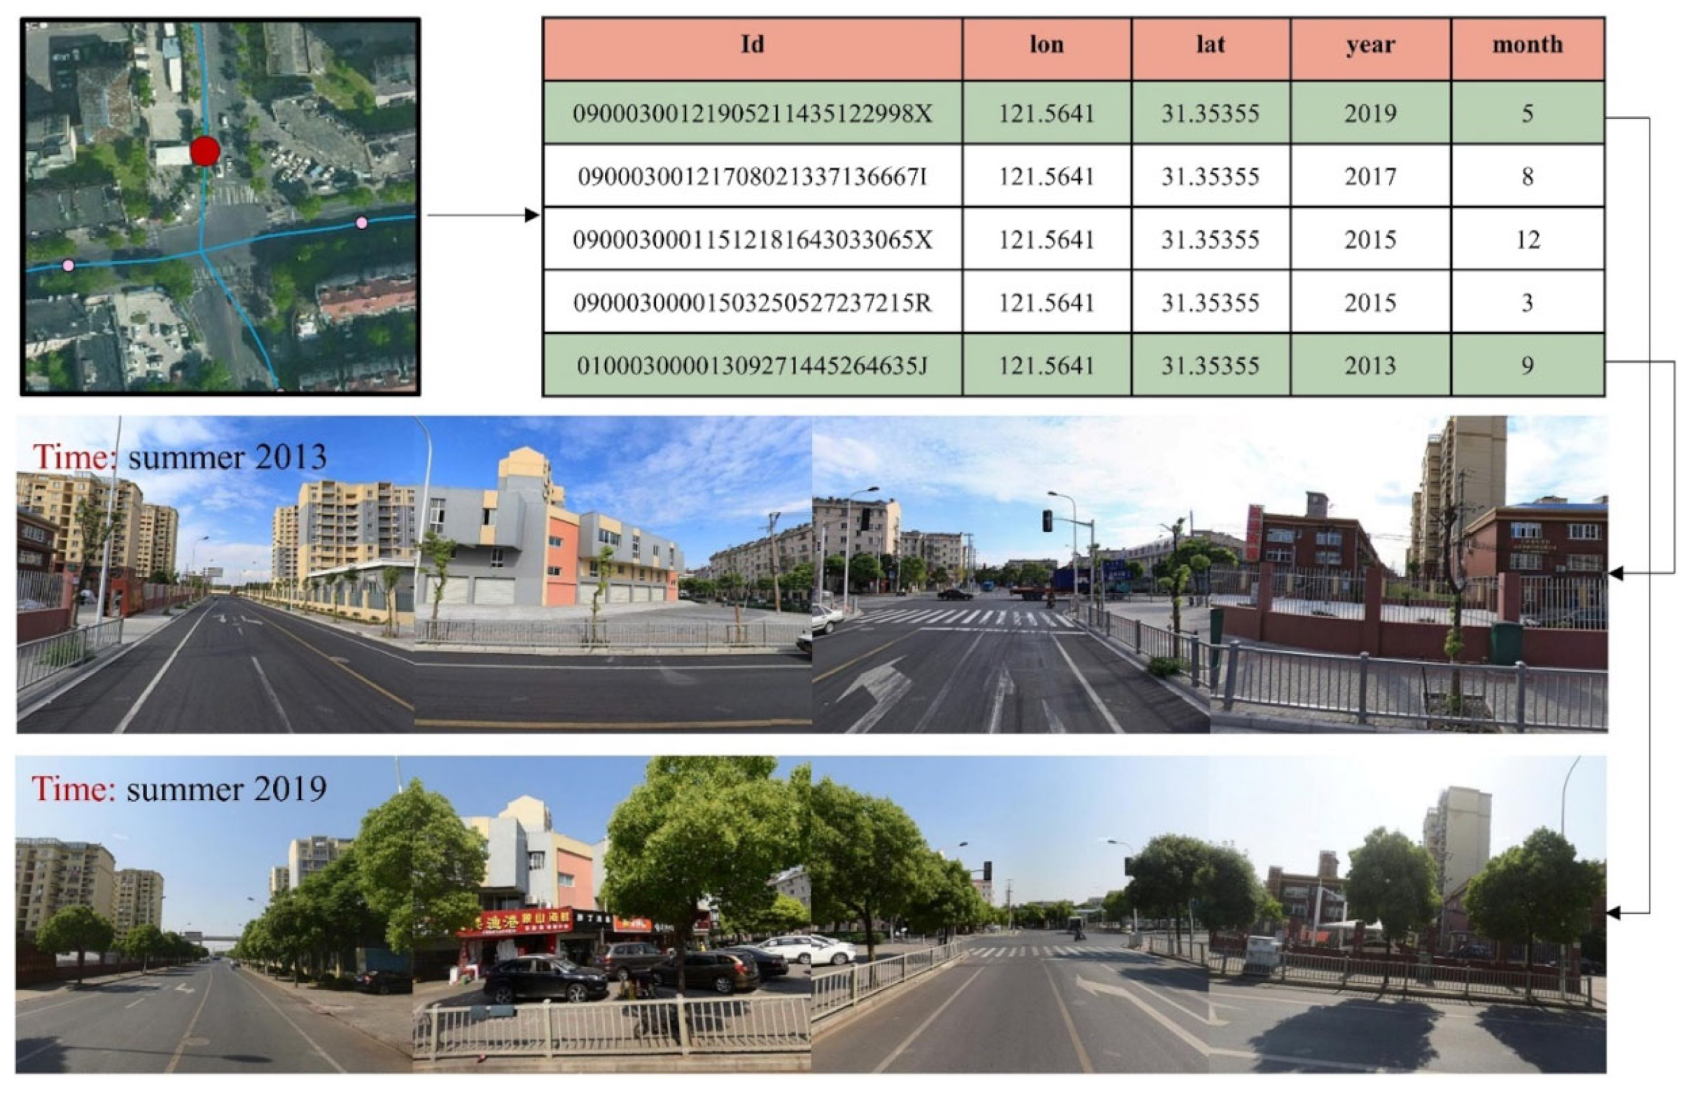
To analyze changes in human perception of urban areas, this study collected street view imagery from two different years within the central urban area of Shanghai. The images were obtained through an automated script developed to retrieve data from the Baidu Maps platform (https://map.baidu.com (accessed on 1 August 2025)) [69] and were integrated with road network data downloaded from OpenStreetMap. A total of 71,546 street view sampling points were generated along the road network at 50-m intervals. Each sampling point includes imagery from multiple years, resulting in a dataset comprising 214,377 street view records. To ensure the temporal validity and comparability of the data, two filtering criteria were applied to the sampling points: (1) Only points with street view imagery available for both 2013 and 2019 were retained, allowing for the analysis of perceptual changes between fixed time periods; and (2) The acquisition time of streetscape images is constrained by the availability of map service providers and cannot cover all seasons throughout the year. Considering the significant perceptual differences between lush summer vegetation and leafless winter landscapes, this study limits the image collection period to May through October—when vegetation remains largely intact—in order to minimize the impact of seasonal factors on perception outcomes.
After filtering, a total of 33,626 valid sampling points were retained for each of the two selected years. The total number of images was 67,252, from which the corresponding street view images were requested. The image acquisition parameters were configured as follows: each image has a resolution of 600 × 480 pixels. The camera was initially oriented due north and then rotated at 90-degree intervals to capture four directional views at each sampling point. Each image has a horizontal field of view of 90 degrees, offering a comprehensive visual representation of the surrounding street view (see Figure 3).

4. Methodology

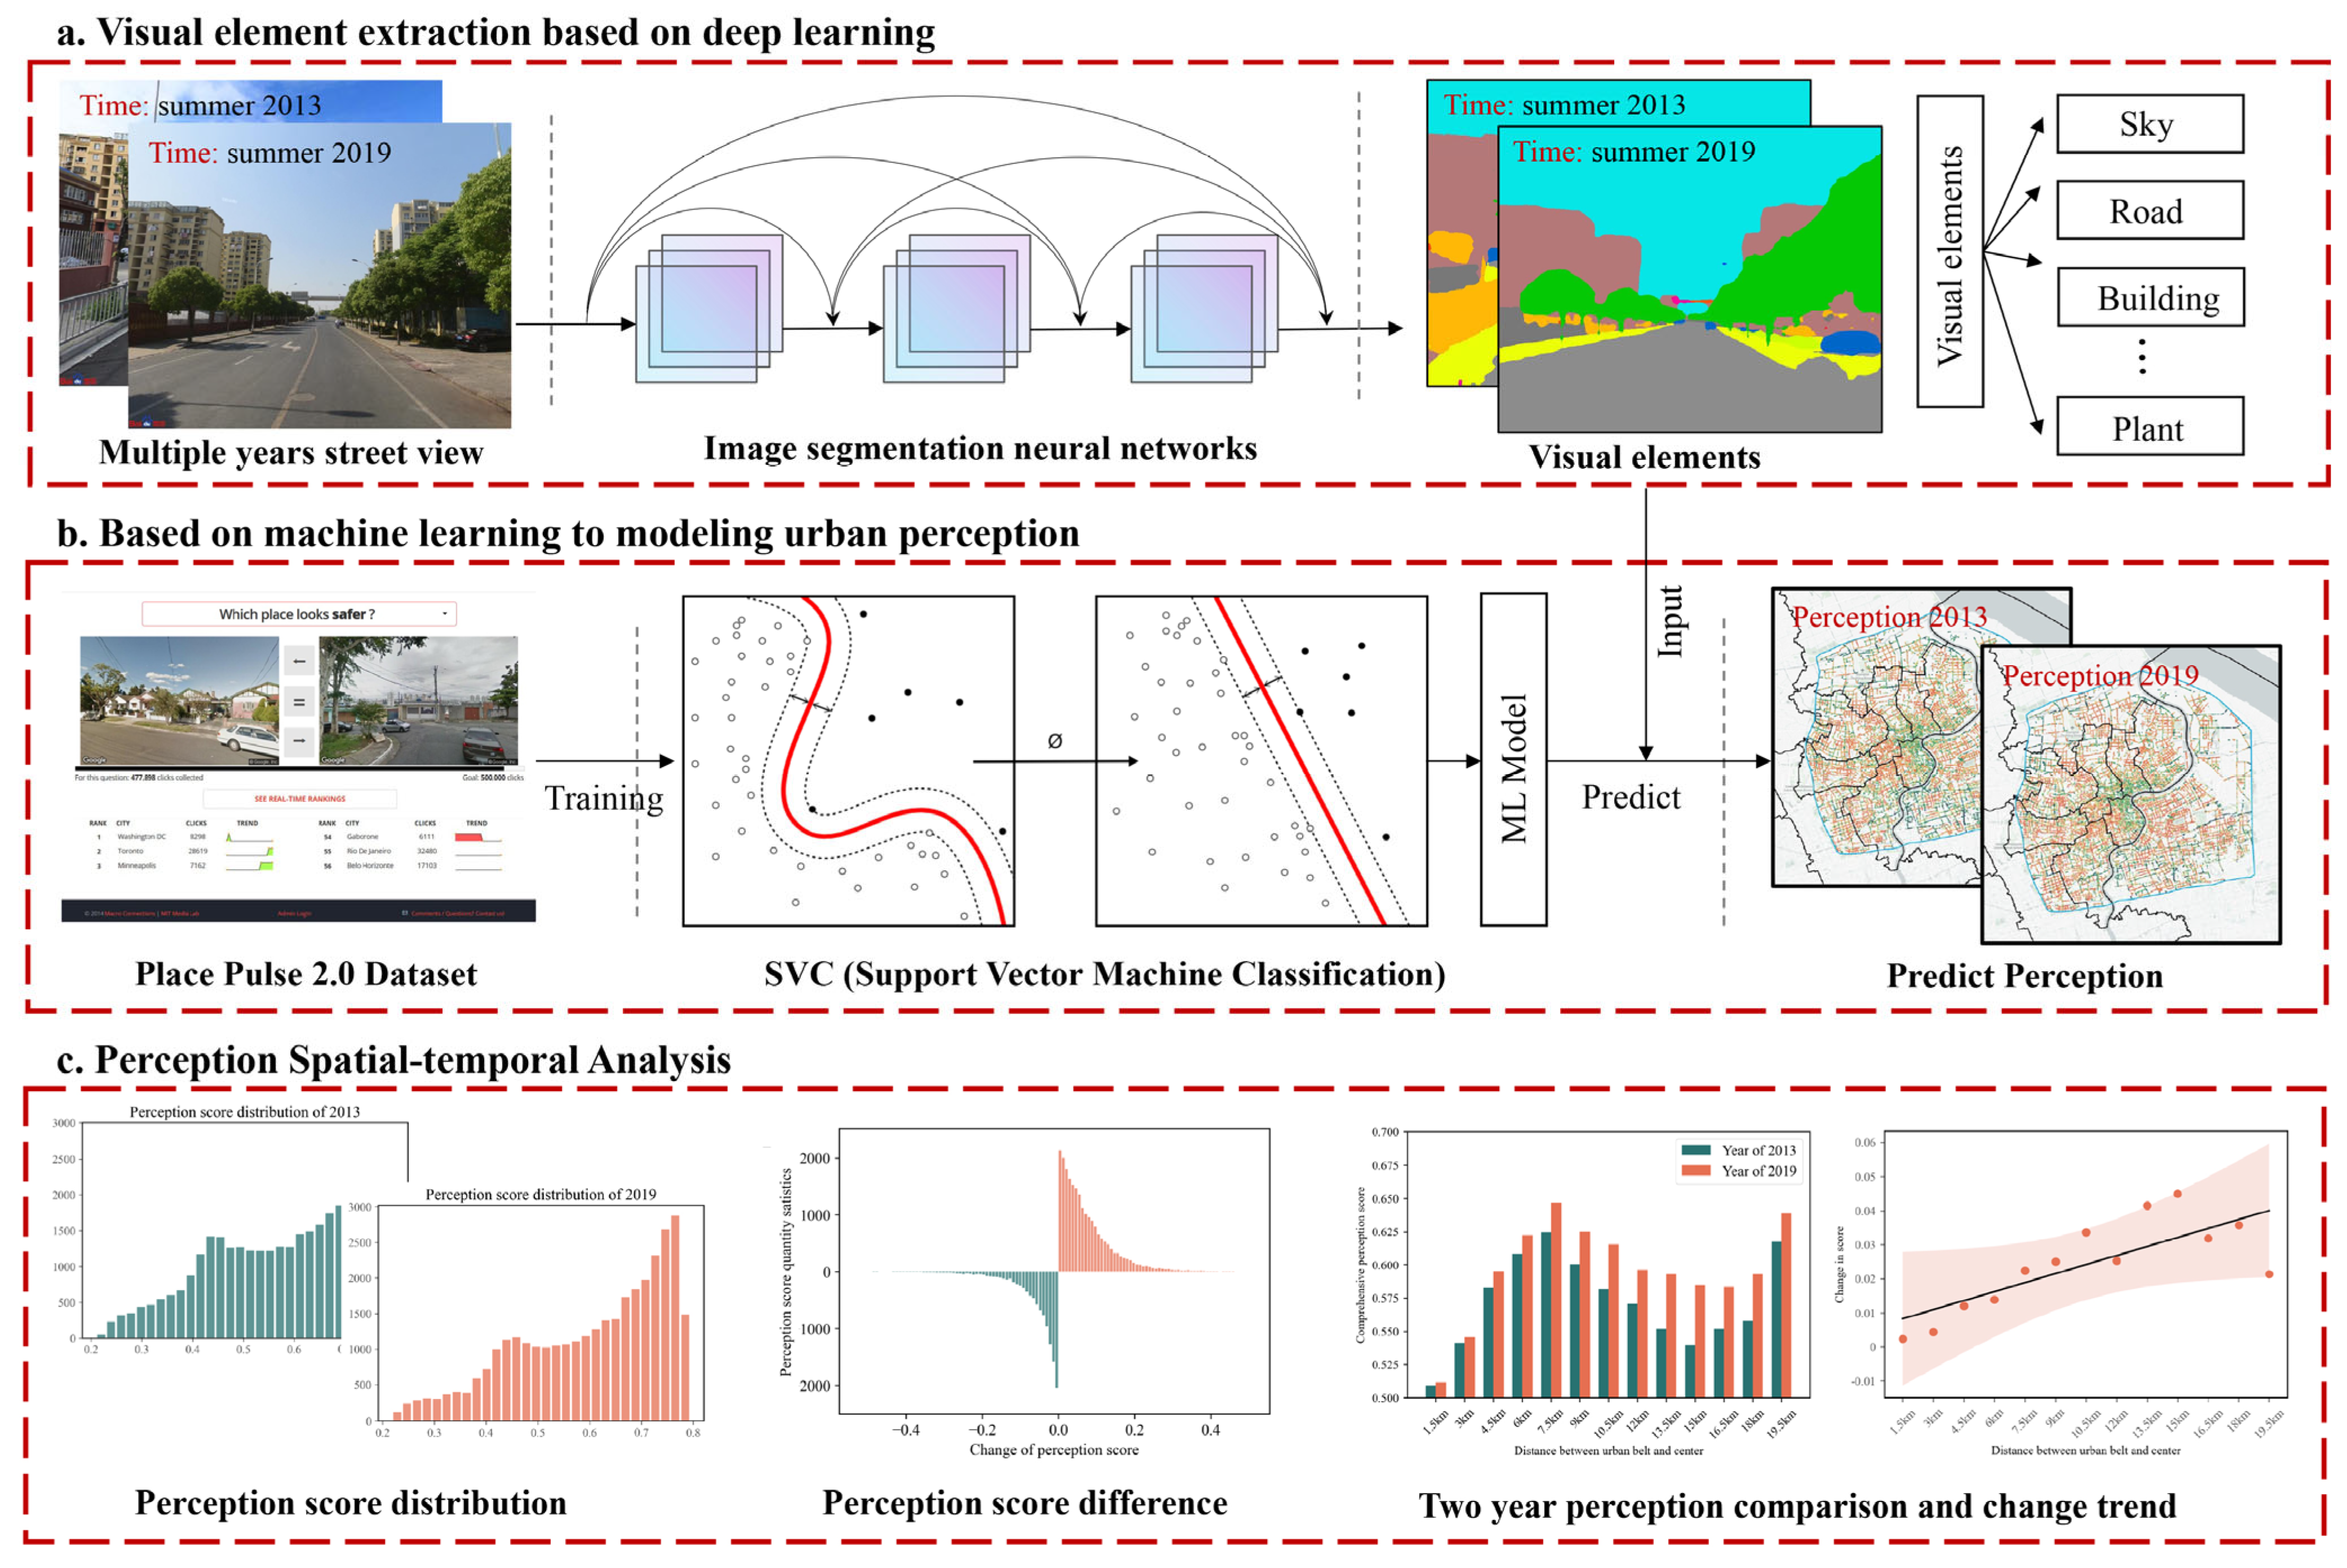
Although deep learning methods have achieved remarkable progress in urban perception prediction, they often entail high computational costs and suffer from limited interpretability. In contrast, traditional machine learning algorithms excel at handling complex, multidimensional datasets, delivering rapid and accurate predictions at a comparatively lower cost [93,94]. Before detailing the specific methods, this study first outlines the overall research framework (see Figure 4). A deep learning model was trained using street view images from the Place Pulse 2.0 dataset. Subsequently, street view imagery from the study area, collected across multiple years, was input into the trained model to estimate corresponding urban perception scores. Finally, through the application of geospatial analysis techniques, the study systematically investigates the spatiotemporal distribution of changes in urban perception and further explores the underlying influence mechanisms of visual elements on these perceptual dynamics.

4.1. Visual Element Extraction Based on Deep Learning

Semantic scene parsing is one of the core techniques in scene understanding, aiming to identify and segment target instances within a natural image. Given an input image, the model predicts a class label for each pixel [95]. In this study, semantic segmentation was applied to detect semantic objects within the scenes. By calculating the number of pixels in each segmentation mask, the proportion of area occupied by each visual element within the image was derived. To implement semantic segmentation, a model based on the ResNet-50 architecture was used. This model was pre-trained and achieved a mean accuracy of 80.13% [51]. The training process employed the ADE20K dataset, which contains annotations for 150 object categories commonly found in everyday environments, including sky, roads, vehicles, and vegetation. This rich dataset provided a robust foundation for exploring the correlation between visual elements and residents’ perception of urban environments.
The proportion of visual elements extracted from the street view images was used as feature vectors for model training. Urban perception labels were binarized as either “1” (strong perception) or “−1” (weak perception). Based on these inputs, machine learning models were constructed to predict six categories of urban perception: safety, beautiful, depressing, lively, wealthy, and boring. In addition, to identify the visual elements driving changes in urban perception over time, it was also necessary to calculate the degree of change in the overall composition of visual elements across the street view images. This provided a quantitative basis for analyzing the relationship between shifts in visual features and variations in perceived urban quality.

4.2. MIT Place Pulse Dataset Preprocessing to Obtain a Single Scene Perception Score

This study draws upon and improves an algorithm proposed in a previous related work [96]. In the Place Pulse 2.0 dataset, urban perception outcomes are obtained through pairwise comparisons of images. Although existing research has developed models that can be trained directly on pairwise comparison data [93], in practical applications, it is often more desirable to obtain absolute perception ratings for individual street view images, rather than merely assessing relative comparisons between image pairs. Accordingly, this study seeks to transform pairwise comparison data into single-image perception scores, thereby enabling broader applicability in urban perception prediction and supporting the continuous monitoring of perceptual changes over time and space.
To achieve this objective, the study approximates the perceptual strength of image i in a specific urban perception dimension by counting the number of times it is selected over other images in pairwise comparisons. In this approach, the more frequently an image is chosen, the stronger its perceived quality is assumed to be in that dimension. Similarly, some studies have introduced Microsoft’s TrueSkill algorithm to estimate single-image perception scores [97]. This method iteratively updates each image’s initial perception score by training a comparison-based model. However, TrueSkill comes with relatively high computational complexity—its processing load increases linearly with the number of images—posing significant challenges when applied to large-scale street view datasets. Therefore, this study adopts a simplified yet effective frequency-based approximation method to ensure scalability and computational efficiency while maintaining reasonable accuracy in perception estimation.
Therefore, to train the model to learn urban perception features from the dataset while maintaining reasonable computational efficiency, the study first defines the positive rate (P) and negative rate (N) of image i under a specific urban perception dimension, as shown in Equations (1) and (2):
P i = p i p i + e i + n i
N i = n i p i + e i + n i
where p i represents the number of times image i was selected in comparisons; n i represents the number of times it was not selected; and e i represents the number of times it was judged to be equal in perception strength to another image. Based on these variables, the perceptual strength score ( Q i ) of image i under the given perception dimension is defined as shown in Equation (3). Here, the constants k 1 and k 2 represent the weights for the number of times image i was selected and not selected, respectively, and are used to balance the influence of positive and negative rates. Finally, following established practices in the field of visual evaluation [98] and to facilitate subsequent statistical analysis, the perceptual scores are rescaled to a range of 0 to 10. The adopted linear transformation involves adding 1 to the original score and then multiplying the result by 10/3.
Q i = 10 3 P i + 1 p i k 1 = 1 p i P k 1 1 n i k 2 = 1 n k 2 N k 2 + 1

4.3. Using Machine Learning to Model Urban Perception

This study employs a machine learning model to predict urban perception scores. Initially, the Q-value perceptual scores are divided into positive and negative samples, while samples falling within the intermediate range are excluded in order to minimize the influence of data noise. Positive and negative samples are labelled as “1” and “−1”, respectively. For each specific urban perception dimension v, the mean µv and standard deviation σv are calculated based on the Place Pulse 2.0 dataset. To define the boundaries between positive and negative samples, a variable δ is introduced to control the margin bandwidth. According to existing research findings, increasing the value of δ enhances the separability between samples, thereby improving the model’s average accuracy [99]. Consequently, δ is set to 1.2 in this study. As the margin bandwidth increases, the total number of retained samples decreases accordingly. However, the remaining samples exhibit more extreme values in terms of perceptual intensity, which reduces label ambiguity and helps to enhance the predictive performance of the model. For a given perceptual dimension v, the label y i v assigned to image i in the dataset is defined as shown in Equation (4), where Q i v denotes the perceptual score of image i under dimension v.
y i v = 1     i f   Q i v < μ v δ σ v 1           i f   Q i v > μ v + δ σ v
Due to the inherent instability of human subjective judgement in urban perception, machine learning models trained directly on Q-value scores often struggle to produce stable predictions. To address this challenge, this study constructs a binary Support Vector Classification (SVC) model [99] to train on high-dimensional deep features. As a binary classifier, the core principle of SVC is to identify an optimal linear decision boundary in a high-dimensional feature space to effectively separate positive from negative samples. After feature extraction by deep neural networks, the streetscape images yield high-dimensional, dense representations. Support Vector Classification (SVC) is effective in identifying optimal separating hyperplanes in such high-dimensional spaces. Given the limited number of labeled samples per category in this study, SVC demonstrates strong generalization performance in small-sample scenarios and can handle nonlinear relationships through kernel functions. SVC also requires tuning only a small number of key hyperparameters, which can be efficiently optimized via cross-validation, ensuring a stable and reliable training process. Moreover, several prior studies on urban perception using streetscape imagery have successfully employed SVM/SVC models, further validating their effectiveness in such tasks. The model is designed to determine whether the perceptual tendency represented by an input image is positive or negative.
The pre-trained SVC model was applied to the case study area to assess urban perception levels. As SVC is a binary classifier, it outputs either −1 or 1. To obtain a continuous measure of urban perception, the study utilizes the positive confidence score—i.e., the probability that a sample belongs to the positive class—as the perception score for each image. Four commonly used classification metrics (accuracy, precision, recall, and F1 score) were selected as evaluation criteria [100] (see Table 2). Since an independent model was trained for each perception category, the mean evaluation scores across all categories were calculated: accuracy was approximately 0.6523, precision was around 0.6579, recall was approximately 0.6523, and the F1 score was 0.6483. Overall, the model demonstrated satisfactory predictive performance across all dimensions of urban perception, highlighting its reliability as a tool for urban perception prediction.
To calculate the average urban perception score, it is first necessary to categorize and integrate the six perceptual dimensions included in the Place Pulse 2.0 dataset. Although Equation (3) provides the perceptual score of a single dimension at a given street view point, a comprehensive measure requires the consolidation of all six dimensions. Following the approach proposed in previous research [36], the six perception types are grouped into positive and negative urban perceptions. The positive perception dimensions include Safety, Beautiful, Lively, and Wealthy, while the negative perception dimensions include Boring and Depressing. The scores for each category are aggregated separately. To ensure consistency in the directionality of the scores, negative perception values are reversed using the transformation 1 − Q, so that higher values uniformly indicate more positive perceptions. The overall urban perception score for an image is then computed by combining the adjusted scores from both groups. In Equation (5), Q y e a r i represents the overall urban perception score of image i for a given year. Specifically,   Q s a f e t y i is the safety perception score, Q l i v e l y i   is the lively perception score, Q b e a u t i f u l i is the beautiful perception score, Q w e a l t h y i is the wealthy perception score, Q d e p r e s s i is the depressing perception score, and Q b o r i n g i is the boring perception score. By aggregating and normalizing these individual scores, the study derives a unified indicator for evaluating the perceived quality of urban environments over time.
Q y e a r i = Q s a f e t y i + Q l i v e l y i + Q b e a u t i f u l i + Q w e a l t h y i + ( 1 Q d e p r e s s i ) + ( 1 Q b o r i n g i )
To assess the temporal trends in urban perception across different years, this study applies the aforementioned methodology to calculate the average urban perception scores for two time points: 2013 and 2019. Subsequently, in order to analyze the changes over time, the difference in perception scores for each street view point between the two years is computed. In Equation (6), Q 2013 i represents the average urban perception score of image i in 2013, Q 2019 i represents the corresponding score in 2019, and Q c h a n g e i denotes the magnitude of change in urban perception for image i between the two years. This approach enables a systematic comparison of urban perception evolution at a fine-grained spatial level over time.
Q c h a n g e i = Q 2019 i Q 2013 i

5. Results

This section presents a multi-dimensional analysis of the research findings through a series of thematic sections. First, from the perspective of the overall urban scale, the predicted average urban perception scores for Shanghai in 2013 and 2019 are presented and compared to examine inter-annual differences in perception levels. Next, the temporal dimension is addressed by statistically analyzing the trends in urban perception change over time. This is followed by an investigation of the spatial dimension, focusing on the geographical distribution patterns of perception changes across the city. Finally, the section explores the visual elements influencing changes in urban perception, examining their correlations and potential impact on perceptual dynamics.

5.1. Average Urban Perception Prediction Results

This study developed a predictive model simulating human urban perception based on a Support Vector Classifier (SVC) and employed semantic segmentation techniques to extract the proportional composition of visual elements within urban street spaces from street view imagery. These visual features were then used to predict residents’ perception scores. The model outputs a predicted probability score for each urban space in a specific perceptual dimension, with values ranging between 0 and 1. Perceptual predictions were conducted for street view images of Shanghai in 2013 and 2019 across six perception dimensions: safety, lively, boring, wealthy, depressing, and beautiful. Based on these results, an average urban perception score was calculated and visualized according to the spatial distribution of the sampling points (Figure 5a,b). A consistent 0.1-point interval was adopted for classification and rendering to ensure comparability across maps.
From a spatial perspective, the most significant improvements in urban perception are observed on the eastern side of the Huangpu River, particularly within Pudong New Area. In contrast, the western historic districts—such as Huangpu and Xuhui—still exhibit extensive areas with low perception scores. Despite six years of urban development, the overall perceptual quality in these older districts has shown no marked improvement. By comparison, the northern peripheral areas, including Baoshan and Jiading, display a steady upward trend in perception scores. Figure 5c,d presents histograms of perception scores for individual street view points in 2013 and 2019, respectively. Overall, the scores in both years exceed the average threshold of 0.5, with the distribution in 2019 clearly higher than that in 2013. Notably, the scores are densely concentrated in the 0.4–0.5 and 0.7–0.8 intervals for both years, yet the frequency in the 0.7–0.8 range is significantly greater in 2019, indicating an increase in high-perception areas across the city. The boxplot in Figure 5e further illustrates the comparative distribution characteristics of urban perception across the two years. The average perception score rose from 0.574 in 2013 to 0.602 in 2019. While the interquartile ranges remain relatively consistent, suggesting no significant change in the overall dispersion of scores, the median, as well as the upper and lower quartiles, all shift upward in 2019. This reflects a general improvement in the city’s perception level. Additionally, the minimum outlier value also shows a slight increase, implying that even the lowest-scoring areas experienced perceptual enhancement, pointing to a more positive and inclusive trajectory in the development of urban spatial perception.

5.2. Spatial and Temporal Changes in Street View Elements and Average Urban Perception

Table 3 lists the eight most prominent visual elements with the highest mean proportions in the image segmentation results. These components are considered to have a substantial impact on the spatial distribution of urban street perception. It can be observed that some visual elements increased in proportion over time, while others declined. Specifically, the average proportion of roads rose from 0.225 in 2013 to 0.233 in 2019, and the proportion of buildings also showed a slight increase, from 0.184 to 0.192. Meanwhile, the sky exhibited a modest upward trend, with its mean proportion increasing from 0.173 to 0.177. Notably, the proportion of vegetation decreased over the same period, falling from 0.259 in 2013 to 0.222 in 2019. In contrast, sidewalk coverage saw a slight rise, increasing from 0.060 to 0.068. The proportions of walls and fences remained relatively stable, staying at approximately 0.023 and 0.014, respectively. Overall, the average urban perception score in 2019 was higher than that in 2013, suggesting that these changes in visual composition may be closely linked to improvements in perceived urban quality.
Based on the above changes in visual elements, the following conclusion can be drawn: the improvement in urban perception is likely driven primarily by enhancements to roads, buildings, and sidewalk environments. These elements play a crucial role in residents’ daily mobility and urban experience, directly influencing pedestrian accessibility, spatial comfort, and the overall image of the city. Therefore, in future urban planning and development, continuous attention should be paid to the optimization of these visual components. By improving infrastructure quality, enhancing walkability, and refining the spatial configuration of the urban environment, cities can further elevate residents’ quality of life and overall satisfaction.

5.3. Recognition Results of Spatiotemporal Changes in Urban Perception

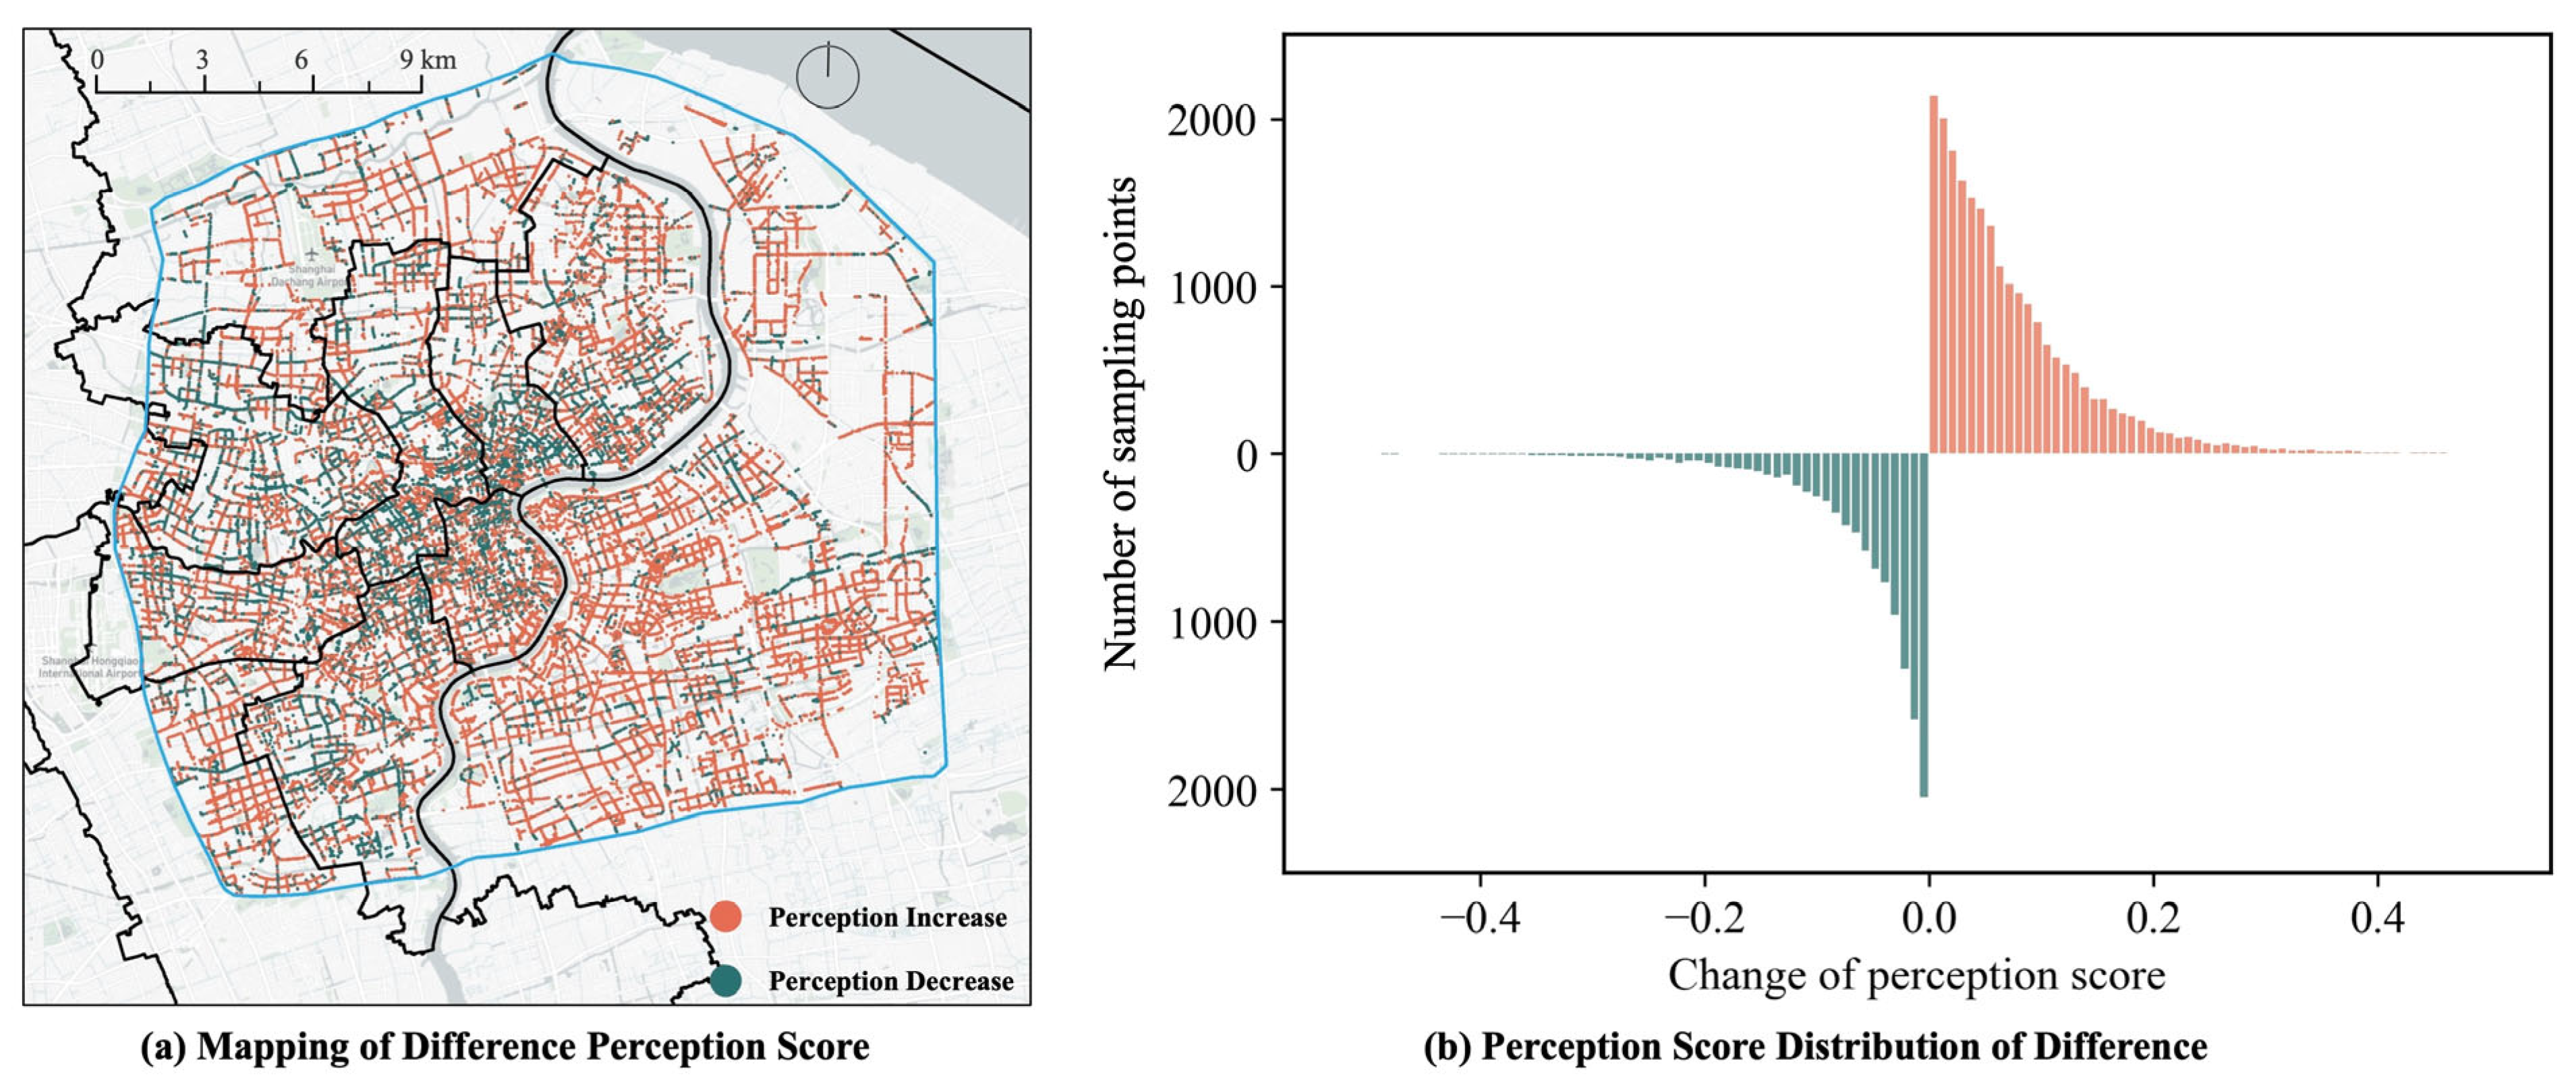
This study calculated the spatial distribution of urban perception scores for the years 2013 and 2019 and subsequently computed the difference in perception scores at each street view sampling point based on Equation (5). In theory, the range of perception score changes spans from −1 to 1; however, such extreme shifts are rare in real-world urban environments. Therefore, for visualization purposes, the score difference range was constrained to [−0.5, 0.5].
In Figure 6a, contrasting colors are used to distinguish areas of perceptual improvement and decline, allowing for a clear representation of their spatial distribution. The results show that, on average, urban perception improved by approximately 4.85% in 2019 compared to 2013. Among the 33,626 sampling points, 22,123 points (representing 65.79%) experienced an increase in perception scores, while 11,503 points (34.21%) recorded a decline. Spatially, outer urban areas exhibited more significant improvements in perception—particularly Baoshan District, Pudong New Area, and especially the southern part of Pudong near the Huangpu River. In contrast, central urban districts such as Putuo, Changning, and Xuhui showed a trend of declining perception. This may be attributed to the earlier development and ageing infrastructure in these districts, where the urban image and residential perception may not have improved in tandem with newer urban developments.
Figure 6b presents the distribution of perception score differences across all sampling points. The results indicate that, while the overall distribution approximates a normal distribution, it exhibits high kurtosis and a slight left skew, meaning that values are concentrated around the mean, yet a proportion of extreme changes still exists. To enhance the visual contrast, the histogram bars representing areas with declining perception scores are inverted and highlighted using cool tones. As shown, the decline in perception scores is primarily concentrated within the [−0.1, 0] interval, whereas perception score improvement is most commonly observed within the [0, 0.2] range. Overall, although some areas experienced a decrease in perception scores, both the proportional distribution and the directional trend suggest a general upward shift in urban perception scores across the city. This reflects the impact of Shanghai’s accelerated economic development and urban construction in recent years, which has contributed to a sustained enhancement of the overall urban environment.

5.4. The Geographical Distribution of Urban Spatial Perception Enhancement

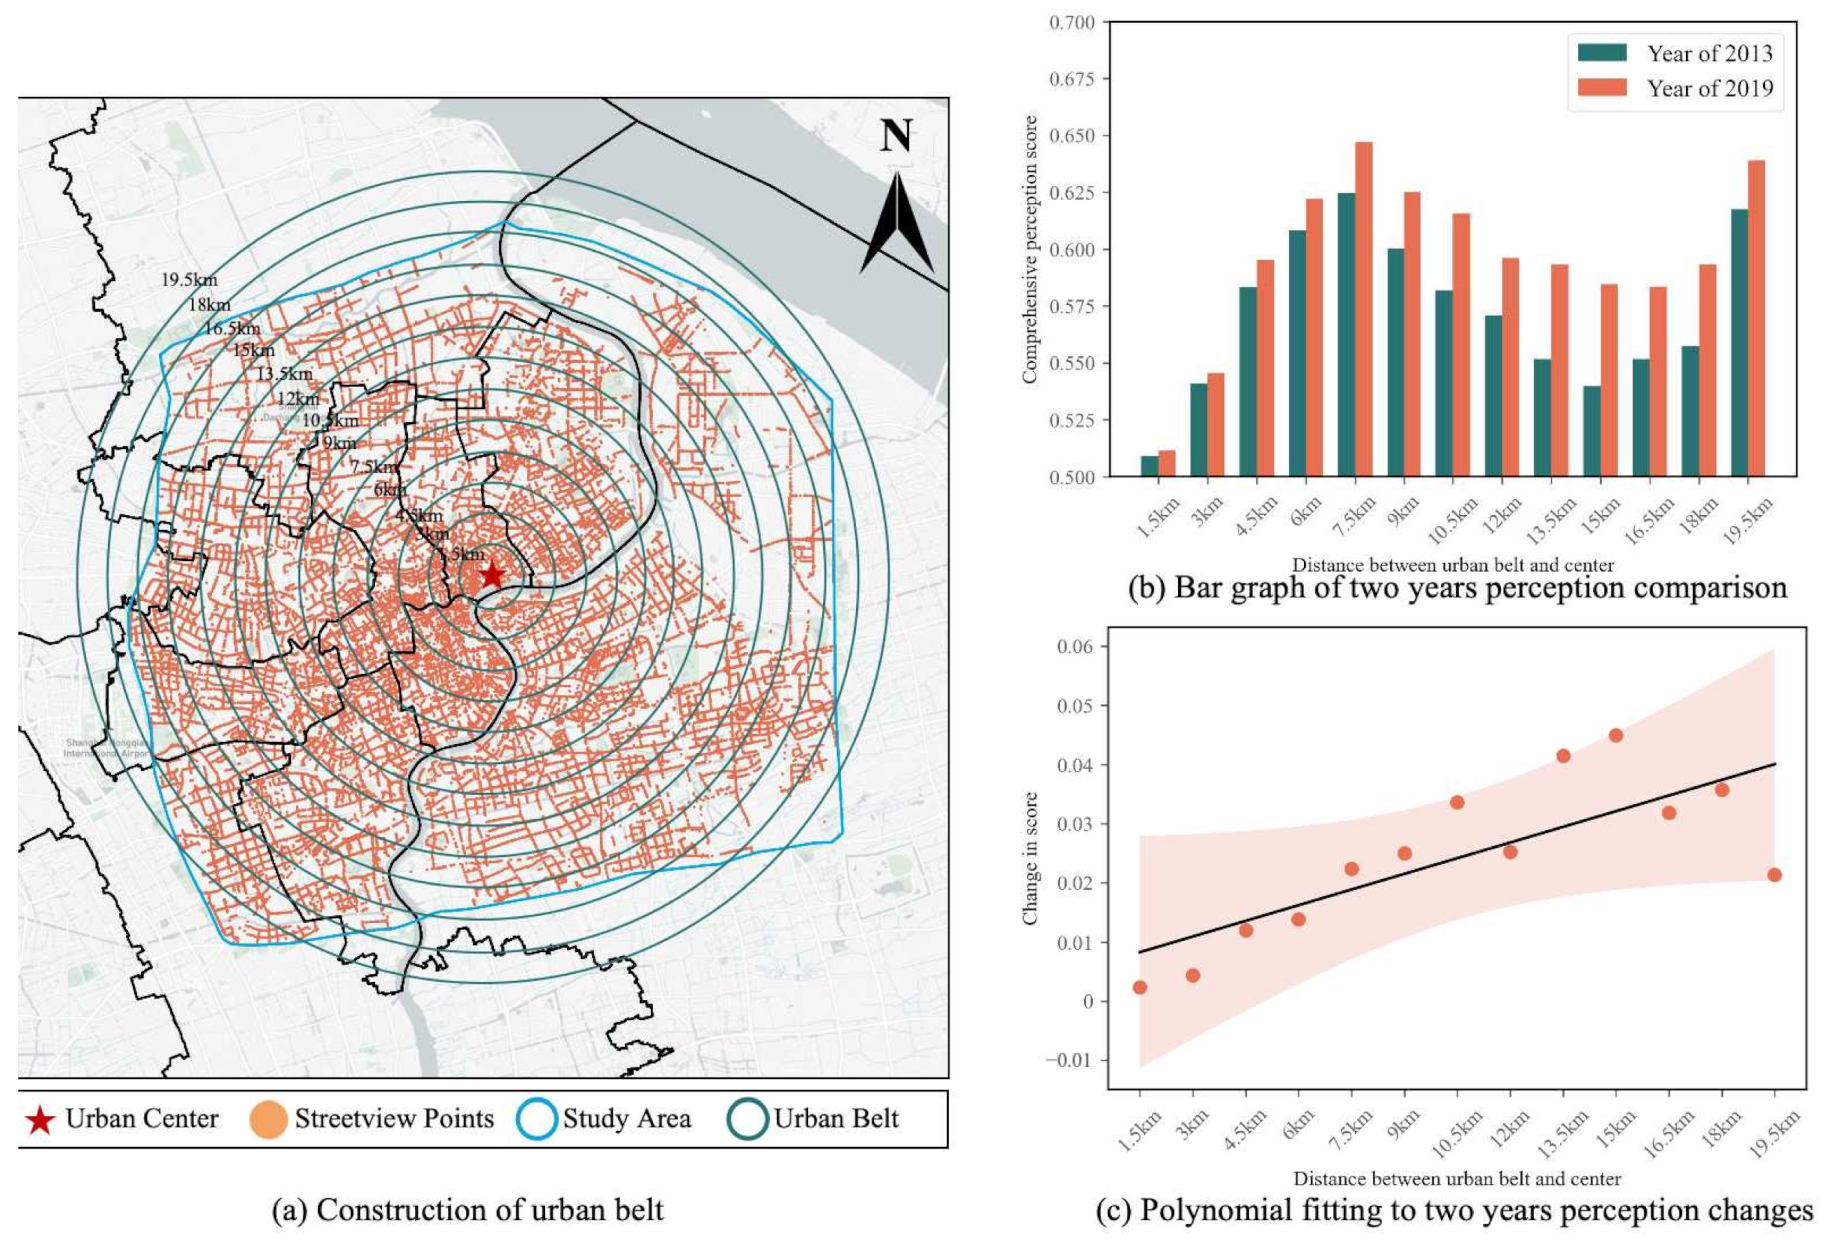
To further analyze the spatial distribution characteristics of urban perception improvement, this study constructed a series of 13 concentric ring zones centered on the geometric center of all street view sampling points, using a 1.5 km radius as the unit increment. The innermost ring has a radius of 1.5 km, with each subsequent ring expanding by an additional 1.5 km. For each ring zone, the perception score differences were aggregated and averaged to explore the variation in spatial perception across the urban structure from the inner city to the periphery. Figure 7a illustrates the spatial layout of the concentric rings, covering the vast majority of street view samples.
Figure 7b compares the average urban perception scores within each ring for the years 2013 and 2019. The results show that the perception scores in all 13 rings were higher in 2019 than in 2013, indicating a consistent pattern of improvement across both inner and outer city areas. In terms of trend, the average perception score increases by approximately 0.024 for every 1.5 km of distance from the city center. However, the overall pattern fluctuates (“rise–decline–rise”), reflecting the spatial allocation of urban development resources over the past six years: midtown areas (roughly corresponding to middle rings) received the most intensive investment, followed by outer districts, with inner-city areas seeing comparatively less enhancement.
Figure 7c further illustrates the specific trend of perception improvement from the city center outward. The X-axis represents the distance from the urban center, while the Y-axis indicates the change in perception scores between 2013 and 2019. A fitted curve with confidence intervals was plotted based on observed data. The results show that in the outermost three rings, the rate of improvement begins to plateau, although the overall slope of the fitted curve is 0.265, suggesting a positive correlation between the degree of perception improvement and distance from the city center. As the overall focus of urban development gradually shifts outward, improvements in perceptual quality in peripheral areas are driven by a combination of multiple factors. First, the continuous enhancement of infrastructure networks—including improved road connectivity, the extension of public transportation, and the development of pedestrian and cycling systems—has significantly increased spatial accessibility and visual coherence. As a result, elements such as road surfaces and roadside facilities appear more orderly and consistent in streetscape imagery. Second, large-scale urban renewal and landscape improvement projects have been launched in non-central suburban areas, where initiatives such as neighborhood revitalization, façade renovation, and pocket park greening have collectively enhanced the overall aesthetics of building frontages and street interfaces. Third, both market forces and residential demand have contributed to these improvements. Expectations of land value appreciation and rising property prices have attracted increased investment in commercial development and public amenities, thereby promoting the upgrading of storefront façades and open spaces along streets. Finally, ongoing efforts to improve the ecological environment—such as the gradual deployment of micro green spaces and ecological corridors—have enhanced visual greenery and environmental quality, thereby increasing both visual comfort and the overall urban appearance. Together, these factors interact and reinforce one another, forming the underlying mechanism behind the significant improvements in streetscape perception observed in peripheral urban areas.

5.5. Correlation Analyses on Differences in Visual Elements and Their Effect on Perception

In this study, we examined the disparities among various visual elements—including trees, roads, buildings, the sky, sidewalks, vegetation, walls, and fences—to elucidate their impact on human perception. To achieve a comprehensive understanding of how these differences affect perceptual outcomes, a range of statistical analyses were employed.
Firstly, Pearson correlation analysis (see Table 4) was utilized to assess the associations among the different visual elements. As a method designed to quantify the strength of linear relationships between two variables, Pearson correlation analysis is well suited for evaluating the interrelationships among continuous variables. The results from this analysis enabled the identification of significant correlations between specific visual elements. Secondly, with respect to model evaluation, several key statistical indicators were scrutinized, including non-standardized coefficients, standardized coefficients, t-values, PVIF (variance inflation factor), R2 (coefficient of determination), adjusted R2, and the standard error of the F ratio. The non-standardized coefficients indicate the absolute effect of each independent variable on the dependent variable, while the standardized coefficients facilitate the comparison of the relative importance of the independent variables. t-values were employed to assess the statistical significance of each coefficient. Moreover, PVIF was used to detect potential multicollinearity issues within the model, with higher PVIF values signaling more severe multicollinearity. The measures of R2 and adjusted R2 provide insights into the model’s explanatory power regarding total variance, with the adjusted R2 offering a refined evaluation of model fit. Lastly, the standard error of the F ratio was applied to test the overall significance of the model. Collectively, these analyses offer a rigorous statistical foundation for understanding the influence of visual elements on urban perception, while also ensuring robust model performance evaluation.
Based on the above analysis, the model yielded an R2 value of 0.812, with the adjusted R2 also standing at 0.812, indicating that the model is capable of explaining 81.2% of the variance in perceptual differences. Furthermore, the F-statistic was 18,110.035, with a p-value less than 0.0001, suggesting an exceptionally high level of model significance well below the 1% threshold, and reflecting a strong overall model fit. Among the various visual elements, the differences in trees, roads, and vegetation were found to be positively correlated with changes in perception scores—implying that increases in these elements contribute to an enhanced perceptual experience. In contrast, differences in buildings, the sky, sidewalks, walls, and fences were negatively correlated with perception change, indicating that their increase may have a dampening effect on perception. Specifically, the change in tree coverage had the most significant influence on perception change, with a standardized coefficient of 0.571 and a t-value of 113.341, both statistically significant at the 1% level. Additionally, all other variables—including roads, vegetation, buildings, the sky, sidewalks, walls, and fences—also demonstrated statistically significant relationships with perception change. These findings point to two primary mechanisms through which visual elements may influence the enhancement of urban perception: (1) The positive effect of natural elements: Increases in trees, roads (as green-lined corridors), and vegetation contribute to greater environmental comfort and aesthetic appeal, thereby improving perception scores. (2) The potential negative impact of built elements: Increases in components such as buildings, fences, sidewalks, and walls—as well as larger expanses of visible sky (a natural element indicating openness or exposure)—may paradoxically heighten feelings of spatial enclosure or visual oppression, leading to lower perception scores. Therefore, in the context of urban planning and development, achieving an appropriate balance and coordinating between different visual elements are essential for improving residents’ perceptual experiences and enhancing the overall quality of urban environments.

6. Discussion

6.1. Summary of the Research Result

This study conducted a detailed analysis and comparison of the spatial distribution of urban perception in Shanghai at two time points: 2013 and 2019. The results indicate that urban perception has improved to a certain extent over this period. From a temporal perspective, the average urban perception score in 2019 increased by 4.85% compared to 2013. The statistical analysis of the street view sampling points reveals that 34.21% of locations experienced a decline in perception, while 65.79% showed an improvement, suggesting that the majority of urban areas underwent a perceptual enhancement. From a spatial perspective, there appears to be a relationship between perception scores and distance from the city center. Specifically, for every 1.5 km increase in distance from the urban core, the average perception score rose by 0.0241. This finding highlights significant regional variation in perception change, which may be influenced by factors such as urban functional layout, green coverage, and infrastructure development. These insights underscore the importance of considering both temporal dynamics and spatial heterogeneity in urban perception, with implications for more targeted and equitable urban planning strategies.
The statistical analysis reveals that changes in urban perception scores follow an approximately normal distribution. The decline in perception scores is primarily concentrated within the interval [−0.1, 0], while improvements are mainly observed in the [0, 0.2] range. Although some areas experienced a decrease in perception, the proportion of areas with improved perception is notably higher, indicating a general upward trend in urban perception across the city. This pattern reflects the rapid advancement of Shanghai’s economy and infrastructure, along with significant improvements in the urban environment. From a spatial perspective, perception improvements demonstrate a high level of consistency across both central and peripheral areas. The observed trends in perception change also shed light on the strategic focus of urban development: government investment has tended to prioritize central areas and outer districts, with inner-city areas receiving relatively less recent attention. This pattern aligns with Shanghai’s historical development trajectory—in which the inner city is already highly modernized, and urban expansion is progressively shifting towards peripheral zones. Accordingly, future urban policy should strive for a balanced allocation of resources across the inner city, central zones, and outer districts to ensure cohesive and inclusive urban development. In addition, the correlation analysis identified meaningful relationships between changes in visual elements and changes in perception. The findings indicate the following: (1) Natural elements—such as trees, roads, and vegetation—are positively correlated with perception change, enhancing comfort and aesthetic quality, and thereby improving perceived spatial experience. (2) Built elements—such as buildings, sidewalks, walls, and fences—are negatively correlated with perception change, potentially increasing feelings of crowding or visual oppression and thus reducing urban livability. Additionally, larger expanses of visible sky, while a natural element, serve here as a proxy for exposed or unbuffered space and similarly are associated with these negative shifts. In summary, the balanced optimization of natural and artificial elements within the urban fabric, alongside a coordinated development strategy across different urban zones, will be instrumental in enhancing residents’ perceptual experiences and improving their overall quality of life.

6.2. The Scientific Contribution of the Practical Approach

By assigning perception scores to street view imagery from different years, this study explores the evolving trends of spatial perception throughout the process of urban development. This empirical approach not only reflects the pace and scale of urban transformation but also offers a novel perspective for examining the impacts of urban planning, infrastructure investment, and environmental improvement. As such, the study provides valuable data support for research in urban science and offers a scientific basis for informing future urban planning and development strategies.
Furthermore, this study integrates perception scoring with Geographic Information Systems (GIS) to achieve the spatial visualization of perception change. This visual approach enables the clear presentation of the geographical distribution and temporal evolution of urban perception, allowing researchers and policymakers to better understand the dynamic patterns of urban spatial experience. In doing so, it provides valuable support for the development of more targeted urban improvement strategies. Compared with traditional survey-based methods, the approach proposed in this study offers distinct advantages. Conventional research often relies on public rating systems to assess the visual appeal of urban areas [39]. However, such methods are typically constrained by sample size, subjective bias, and the difficulty of conducting large-scale, long-term monitoring. In contrast, this study adopts an automated analysis of large volumes of street view imagery, offering a faster, more efficient, and cost-effective alternative for urban perception assessment. Moreover, the method enables the precise capture of temporal changes in spatial perception—an advancement that traditional techniques struggle to achieve.
Another key finding of this study is the significant correlation between greening, road width, and urban spatial perception. By analyzing the changing proportions of natural and artificial elements in imagery, it was found that increased greenery and improved road conditions are both strongly associated with enhanced perception scores. This aligns with previous research indicating that urban greenery has a substantial positive impact on residents’ well-being [56]. However, this study goes a step further by quantifying this relationship and demonstrating the specific trends of perception change over time using longitudinal data, thus providing a more empirically grounded reference for the optimization of urban environments.

6.3. Policy Recommendations Based on Urban Perception

This study reveals significant disparities in spatial perception levels across different urban areas, particularly highlighting the uneven distribution between inner-city and outer-city zones. In light of these findings, urban planning authorities should take into account the geographical distribution of perception levels as a key reference for formulating more targeted and systematic policies. Such an approach would support the overall enhancement of urban spatial quality and contribute to the promotion of spatial equity within the city.

6.3.1. Strengthening Perception-Oriented Policy Incentives

Urban planning policies should explicitly incorporate residents’ spatial perception into broader urban development goals. Policymakers are encouraged to promote the integration of green spaces and natural elements into new development projects by offering targeted incentives to developers and architects. For example, tax deductions, fast-track construction permits, and other policy tools can be leveraged to advance the development of green buildings and eco-friendly communities, thereby enhancing both urban ecological benefits and residents’ spatial experience and psychological well-being.

6.3.2. Integrating Natural Elements into Urban Design

The inclusion of natural elements should extend beyond parks and designated green areas to become embedded in infrastructure and everyday public spaces. Examples include the installation of vegetation buffers along sidewalks to improve pedestrian comfort, the adoption of eco-sensitive neighborhood layouts to support microclimate regulation, and the development of green public transport corridors and cycling lanes to enhance mobility experiences. These interventions not only serve environmental functions but also significantly enhance positive spatial perception and residents’ sense of belonging.

6.3.3. Advancing Spatial Justice Through Urban Development

This study reveals imbalances in urban perception levels across different districts, particularly with lower perception scores in peripheral areas compared to central zones. To reduce this disparity, efforts must be made to promote balanced development between inner and outer districts. This can be achieved by establishing a spatial perception monitoring mechanism to evaluate changes over time. The resulting data should be used as a key reference in urban renewal and construction decision-making, thereby creating a feedback loop between policy formulation and residents’ lived experiences.

6.3.4. Establishing an Urban Ecological Corridor Network

Planning and constructing green and blue ecological corridors that traverse different parts of the city can provide not only recreational and health-related benefits but also serve as the structural backbone of the urban ecosystem, supporting the equitable distribution of natural resources. These corridors help to mitigate localized deficits in perception quality and narrow perceptual disparities between urban areas, ultimately improving the overall environmental perception and resident satisfaction.

6.3.5. Diversifying Land Use and Promoting Functional Integration

The study finds that higher perception scores in central urban areas are closely associated with their high-density residential and commercial land use patterns. Therefore, optimization of land use structure should be pursued to promote the integration of ecological, social, and economic functions. For instance, introducing green spaces into commercial districts, or enhancing cultural and public service infrastructure in residential areas, can simultaneously improve perception scores and balance the trade-off between economic efficiency and ecological quality. This approach fosters the development of a more resilient and perception-friendly urban space.

6.4. Limitations and Future Works

Despite offering valuable insights, this study presents several limitations related to data sampling, influencing factors, and model interpretability. Firstly, the street view imagery utilized in this research was captured at specific time points, which may not fully reflect the actual changes in urban space over the study period. Given the dynamic nature of urban environments, relying on data from a limited number of temporal snapshots may introduce bias. Future research could address this issue by incorporating higher-frequency street view data, such as annual or quarterly updates, to capture short-term spatial dynamics more precisely. Secondly, while this study focuses primarily on the impact of visual elements on urban spatial perception, previous research has demonstrated that other sensory dimensions—such as sound—also significantly influence spatial experience. Future work could adopt multimodal data analysis methods, integrating diverse sensory inputs (e.g., acoustic sensors, noise levels, and environmental monitoring data) to provide a more comprehensive assessment of urban spatial perception. Finally, in this study, we trained the urban perception model using the MIT Place Pulse 2.0 dataset. However, this dataset does not include streetscape imagery from major cities in mainland China (such as Shanghai); it only covers Hong Kong and Macau. This may introduce perceptual biases due to differences in cultural context, socioeconomic conditions, and urban morphology. To address this issue, future work should incorporate streetscape imagery from Shanghai and construct perception labels through crowdsourced annotation. Alternatively, domain adaptation and transfer learning techniques—such as sample reweighting, feature alignment, or adversarial training—could be applied to fine-tune the model and enhance its generalization to the Shanghai context. Otherwise, the model’s current predictions may not accurately reflect local residents’ true perceptions, thereby limiting the applicability and reliability of the research conclusions in the urban environments of mainland China.
The methods and findings of this study provide a practical foundation for urban planners and policymakers to better understand and improve urban spatial perception, particularly by increasing green coverage and optimizing architectural layout, ultimately enhancing residents’ quality of life and the livability of urban environments. Given the generalizability of the proposed analytical framework, its application is not limited to Shanghai and can be extended to other cities or regions for comparative modelling and analysis. Future research may further explore how urban planning strategies influence spatial perception, especially in the context of rapid urbanization, and whether different types of cities exhibit convergent or divergent patterns of perceptual change. In conclusion, this study not only advances our understanding of the dynamic evolution of urban spatial perception, but also offers practical and evidence-based guidance for promoting sustainable urban development and enhancing resident well-being.

7. Conclusions

Urban spatial perception represents the immediate impression residents form of their living environment and plays a crucial role in urban planning and public well-being. However, previous studies have predominantly focused on single-time snapshots or citywide static analyses, which have a limited capacity to systematically capture the dynamic evolution of spatial perception over time. To address this research gap, the present study develops a novel analytical framework based on historical street view imagery, designed to measure the spatiotemporal dynamics of urban perception. Using central Shanghai as a case study, we conducted an empirical analysis to validate the framework. The findings indicate a 4.85% increase in overall spatial perception from 2013 to 2019. Notably, for every 1.5 km increase in distance from the city center, the perception score increased by 0.0241. Of all sampled street view points, 34.21% showed a decline in perception, while 65.79% exhibited an improvement. In terms of visual influence, the study found that an increase in natural elements was positively correlated with perception scores, while an increase in artificial elements tended to have a negative correlation.
This research contributes several methodological innovations and theoretical insights: (1) Time-Series Analysis Framework: Unlike traditional static approaches, this study introduces a dynamic measurement framework that combines machine learning with multi-year street view imagery, allowing for a systematic exploration of the temporal and spatial evolution of urban perception; (2) Multi-Level Perception Analysis: By integrating visual element decomposition with urban development analysis, the study not only investigates the impact of natural and artificial elements on perception but also quantifies perceptual change across different spatial scales. This provides a more structured framework for understanding urban perception; (3) Scalable and Transferable Framework: The proposed methodology is highly generalizable and adaptable to diverse urban contexts. It offers a reproducible and scalable analytical path for spatial perception studies worldwide, facilitating cross-regional comparisons and advancing global discourse on sustainable urban development.
This study holds significant practical value for urban planning and policymaking. On the one hand, it underscores the importance of integrating green spaces and natural elements into the built environment, highlighting the role of ecological design in enhancing subjective urban experience. On the other hand, it demonstrates the potential of historical street view imagery as a data source for monitoring urban development. By tracking perceptual changes over time through model-based comparisons, urban managers can evaluate the real-world impact of planning policies and infrastructure investments. Furthermore, the study offers data-driven support for strategic urban development. It identifies which spatial features most strongly influence perception and well-being, providing a valuable reference for planners seeking to balance aesthetic value, sustainability, and social equity in future urban design.

Author Contributions

Conceptualization, Lei Wang, Xin Han and Wen Zhong; methodology, Wen Zhong and Lei Wang; software, Wen Zhong; validation, Lei Wang, Xin Han and Wen Zhong; formal analysis, Wen Zhong and Lei Wang; investigation, Wen Zhong; resources, Lei Wang and Zhe Gao; data curation, Wen Zhong; writing—original draft preparation, Wen Zhong, Lei Wang and Xin Han; writing—review and editing, Wen Zhong; visualization, Lei Wang; supervision, Lei Wang and Zhe Gao; project administration, Lei Wang and Zhe Gao; funding acquisition, Zhe Gao. All authors have read and agreed to the published version of the manuscript.

Funding

This research received no external funding.

Data Availability Statement

For the replication of our research results and the dissemination of this innovative approach, all source data and the processing code used in the study can be found at: https://github.com/LandscapeWL/SHAPClab_UrbanPerception_SpatiotemporalChanges (accessed on 1 August 2025); https://github.com/CSAILVision/semantic-segmentation-pytorch (accessed on 1 August 2025).

Conflicts of Interest

The authors declare no conflicts of interest.

References

  1. Salesses, P.; Schechtner, K.; Hidalgo, C.A. The Collaborative Image of The City: Mapping the Inequality of Urban Perception. PLoS ONE 2013, 8, e68400. [Google Scholar] [CrossRef]
  2. Tuan, Y. Space and Place: The Perspective of Experience; University of Minnesota Press: Minneapolis, MN, USA, 1977. [Google Scholar]
  3. Goodchild, M.F. Formalizing Place in Geographic Information Systems. In Communities, Neighborhoods, and Health: Expanding the Boundaries of Place; Burton, L.M., Matthews, S.A., Leung, M., Kemp, S.P., Takeuchi, D.T., Eds.; Springer: New York, NY, USA, 2011; pp. 21–33. ISBN 978-1-4419-7482-2. [Google Scholar]
  4. Naik, N.; Philipoom, J.; Raskar, R.; Hidalgo, C. Streetscore—Predicting the Perceived Safety of One Million Streetscapes. In Proceedings of the 2014 IEEE Conference on Computer Vision and Pattern Recognition Workshops, Columbus, OH, USA, 23–28 June 2014; IEEE: New York, NY, USA, 2014; pp. 793–799. [Google Scholar]
  5. Ruggeri, D.; Harvey, C.; Bosselmann, P. Perceiving the Livable City: Cross-Cultural Lessons on Virtual and Field Experiences of Urban Environments. J. Am. Plan. Assoc. 2018, 84, 250–262. [Google Scholar] [CrossRef]
  6. Montello, D.R.; Goodchild, M.F.; Gottsegen, J.; Fohl, P. Where’s Downtown? Behavioral Methods for Determining Referents of Vague Spatial Queries. In Spatial Vagueness, Uncertainty, Granularity; Psychology Press: London, UK, 2003; ISBN 978-0-203-76457-2. [Google Scholar]
  7. Han, X.; Wang, L.; Seo, S.H.; He, J.; Jung, T. Measuring Perceived Psychological Stress in Urban Built Environments Using Google Street View and Deep Learning. Front. Public Health 2022, 10, 891736. [Google Scholar] [CrossRef] [PubMed]
  8. Sallis, J.F.; Glanz, K. The Role of Built Environments in Physical Activity, Eating, and Obesity in Childhood. Future Child. 2006, 16, 89–108. [Google Scholar] [CrossRef] [PubMed]
  9. Zakariya, K.; Harun, N.Z.; Mansor, M. Place Meaning of the Historic Square as Tourism Attraction and Community Leisure Space. Procedia-Soc. Behav. Sci. 2015, 202, 477–486. [Google Scholar] [CrossRef]
  10. Yoshimura, Y.; He, S.; Hack, G.; Nagakura, T.; Ratti, C. Quantifying Memories: Mapping Urban Perception. Mob. Netw. Appl. 2020, 25, 1275–1286. [Google Scholar] [CrossRef]
  11. Wei, W.; Deng, Y.; Huang, L.; Chen, S.; Li, F.; Xu, L. Environment-Deterministic Pedestrian Behavior? New Insights from Surveillance Video Evidence. Cities 2022, 125, 103638. [Google Scholar] [CrossRef]
  12. Han, X.; Wang, L.; He, J.; Jung, T. Restorative Perception of Urban Streets: Interpretation Using Deep Learning and MGWR Models. Front. Public Health 2023, 11, 1141630. [Google Scholar] [CrossRef]
  13. Ma, X.; Ma, C.; Wu, C.; Xi, Y.; Yang, R.; Peng, N.; Zhang, C.; Ren, F. Measuring Human Perceptions of Streetscapes to Better Inform Urban Renewal: A Perspective of Scene Semantic Parsing. Cities 2021, 110, 103086. [Google Scholar] [CrossRef]
  14. Ye, Y.; Richards, D.; Lu, Y.; Song, X.; Zhuang, Y.; Zeng, W.; Zhong, T. Measuring Daily Accessed Street Greenery: A Human-Scale Approach for Informing Better Urban Planning Practices. Landsc. Urban Plan. 2019, 191, 103434. [Google Scholar] [CrossRef]
  15. Kaplan, S. The Restorative Benefits of Nature: Toward an Integrative Framework. J. Environ. Psychol. 1995, 15, 169–182. [Google Scholar] [CrossRef]
  16. Van Renterghem, T.; Botteldooren, D. View on Outdoor Vegetation Reduces Noise Annoyance for Dwellers near Busy Roads. Landsc. Urban Plan. 2016, 148, 203–215. [Google Scholar] [CrossRef]
  17. Taghipour, A.; Sievers, T.; Eggenschwiler, K. Acoustic Comfort in Virtual Inner Yards with Various Building Facades. Int. J. Environ. Res. Public Health 2019, 16, 249. [Google Scholar] [CrossRef] [PubMed]
  18. Verma, D.; Jana, A.; Ramamritham, K. Predicting Human Perception of the Urban Environment in a Spatiotemporal Urban Setting Using Locally Acquired Street View Images and Audio Clips. Build. Environ. 2020, 186, 107340. [Google Scholar] [CrossRef]
  19. Ramírez, T.; Hurtubia, R.; Lobel, H.; Rossetti, T. Measuring Heterogeneous Perception of Urban Space with Massive Data and Machine Learning: An Application to Safety. Landsc. Urban Plan. 2021, 208, 104002. [Google Scholar] [CrossRef]
  20. Wang, R.; Ren, S.; Zhang, J.; Yao, Y.; Wang, Y.; Guan, Q. A Comparison of Two Deep-Learning-Based Urban Perception Models: Which One Is Better? Comput. Urban Sci. 2021, 1, 3. [Google Scholar] [CrossRef]
  21. Cai, M.; Xiang, L.; Ng, E. How Does the Visual Environment Influence Pedestrian Physiological Stress? Evidence from High-Density Cities Using Ambulatory Technology and Spatial Machine Learning. Sustain. Cities Soc. 2023, 96, 104695. [Google Scholar] [CrossRef]
  22. Biljecki, F.; Ito, K. Street View Imagery in Urban Analytics and GIS: A Review. Landsc. Urban Plan. 2021, 215, 104217. [Google Scholar] [CrossRef]
  23. Marasinghe, R.; Yigitcanlar, T.; Mayere, S.; Washington, T.; Limb, M. Computer Vision Applications for Urban Planning: A Systematic Review of Opportunities and Constraints. Sustain. Cities Soc. 2023, 100, 105047. [Google Scholar] [CrossRef]
  24. Zhang, F.; Zhang, D.; Liu, Y.; Lin, H. Representing Place Locales Using Scene Elements. Comput. Environ. Urban Syst. 2018, 71, 153–164. [Google Scholar] [CrossRef]
  25. Larkin, A.; Gu, X.; Chen, L.; Hystad, P. Predicting Perceptions of the Built Environment Using GIS, Satellite and Street View Image Approaches. Landsc. Urban Plan. 2021, 216, 104257. [Google Scholar] [CrossRef] [PubMed]
  26. Chen, L.; Lu, Y.; Ye, Y.; Xiao, Y.; Yang, L. Examining the Association between the Built Environment and Pedestrian Volume Using Street View Images. Cities 2022, 127, 103734. [Google Scholar] [CrossRef]
  27. Dai, L.; Zheng, C.; Dong, Z.; Yao, Y.; Wang, R.; Zhang, X.; Ren, S.; Zhang, J.; Song, X.; Guan, Q. Analyzing the Correlation between Visual Space and Residents’ Psychology in Wuhan, China Using Street-View Images and Deep-Learning Technique. City Environ. Interact. 2021, 11, 100069. [Google Scholar] [CrossRef]
  28. Jeon, J.Y.; Jo, H.I.; Lee, K. Psycho-Physiological Restoration with Audio-Visual Interactions through Virtual Reality Simulations of Soundscape and Landscape Experiences in Urban, Waterfront, and Green Environments. Sustain. Cities Soc. 2023, 99, 104929. [Google Scholar] [CrossRef]
  29. He, J.; Zhang, J.; Yao, Y.; Li, X. Extracting Human Perceptions from Street View Images for Better Assessing Urban Renewal Potential. Cities 2023, 134, 104189. [Google Scholar] [CrossRef]
  30. Wei, J.; Yue, W.; Li, M.; Gao, J. Mapping Human Perception of Urban Landscape from Street-View Images: A Deep-Learning Approach. Int. J. Appl. Earth Obs. Geoinf. 2022, 112, 102886. [Google Scholar] [CrossRef]
  31. Wang, Z.; Ito, K.; Biljecki, F. Assessing the Equity and Evolution of Urban Visual Perceptual Quality with Time Series Street View Imagery. Cities 2024, 145, 104704. [Google Scholar] [CrossRef]
  32. Thompson, C.W. Urban Open Space in the 21st Century. Landsc. Urban Plan. 2002, 60, 59–72. [Google Scholar] [CrossRef]
  33. Caughy, M.O.; O’Campo, P.J.; Patterson, J. A Brief Observational Measure for Urban Neighborhoods. Health Place 2001, 7, 225–236. [Google Scholar] [CrossRef]
  34. Inoue, T.; Manabe, R.; Murayama, A.; Koizumi, H. Landscape Value in Urban Neighborhoods: A Pilot Analysis Using Street-Level Images. Landsc. Urban Plan. 2022, 221, 104357. [Google Scholar] [CrossRef]
  35. Bishop, I.D.; Hulse, D.W. Prediction of Scenic Beauty Using Mapped Data and Geographic Information Systems. Landsc. Urban Plan. 1994, 30, 59–70. [Google Scholar] [CrossRef]
  36. Wang, L.; Han, X.; He, J.; Jung, T. Measuring Residents’ Perceptions of City Streets to Inform Better Street Planning through Deep Learning and Space Syntax. ISPRS J. Photogramm. Remote Sens. 2022, 190, 215–230. [Google Scholar] [CrossRef]
  37. Calder, A.J.; Young, A.W.; Keane, J.; Dean, M. Configural Information in Facial Expression Perception. J. Exp. Psychol. Hum. Percept. Perform. 2000, 26, 527–551. [Google Scholar] [CrossRef] [PubMed]
  38. Zhang, Z.; Zhuo, K.; Wei, W.; Li, F.; Yin, J.; Xu, L. Emotional Responses to the Visual Patterns of Urban Streets: Evidence from Physiological and Subjective Indicators. Int. J. Environ. Res. Public Health 2021, 18, 9677. [Google Scholar] [CrossRef] [PubMed]
  39. Chen, D.; Yin, J.; Yu, C.-P.; Sun, S.; Gabel, C.; Spengler, J.D. Physiological and Psychological Responses to Transitions between Urban Built and Natural Environments Using the Cave Automated Virtual Environment. Landsc. Urban Plan. 2024, 241, 104919. [Google Scholar] [CrossRef]
  40. Li, Y.; Yabuki, N.; Fukuda, T. Measuring Visual Walkability Perception Using Panoramic Street View Images, Virtual Reality, and Deep Learning. Sustain. Cities Soc. 2022, 86, 104140. [Google Scholar] [CrossRef]
  41. Ordonez, V.; Berg, T.L. Learning High-Level Judgments of Urban Perception. In Proceedings of the Computer Vision—ECCV 2014, Zurich, Switzerland, 6–12 September 2014; Springer International Publishing: Cham, Switzerland, 2014; Volume 8694, pp. 494–510. [Google Scholar]
  42. Naik, N.; Raskar, R.; Hidalgo, C.A. Cities Are Physical Too: Using Computer Vision to Measure the Quality and Impact of Urban Appearance. Am. Econ. Rev. 2016, 106, 128–132. [Google Scholar] [CrossRef]
  43. Naik, N.; Kominers, S.D.; Raskar, R.; Glaeser, E.L.; Hidalgo, C.A. Computer Vision Uncovers Predictors of Physical Urban Change. Proc. Natl. Acad. Sci. USA 2017, 114, 7571–7576. [Google Scholar] [CrossRef]
  44. Zhang, F.; Zu, J.; Hu, M.; Zhu, D.; Kang, Y.; Gao, S.; Zhang, Y.; Huang, Z. Uncovering Inconspicuous Places Using Social Media Check-Ins and Street View Images. Comput. Environ. Urban Syst. 2020, 81, 101478. [Google Scholar] [CrossRef]
  45. Liu, Y.; Chen, M.; Wang, M.; Huang, J.; Thomas, F.; Rahimi, K.; Mamouei, M. An Interpretable Machine Learning Framework for Measuring Urban Perceptions from Panoramic Street View Images. iScience 2023, 26, 106132. [Google Scholar] [CrossRef]
  46. Zhang, F.; Fan, Z.; Kang, Y.; Hu, Y.; Ratti, C. “Perception Bias”: Deciphering a Mismatch between Urban Crime and Perception of Safety. Landsc. Urban Plan. 2021, 207, 104003. [Google Scholar] [CrossRef]
  47. Fan, Z.; Zhang, F.; Loo, B.P.Y.; Ratti, C. Urban Visual Intelligence: Uncovering Hidden City Profiles with Street View Images. Proc. Natl. Acad. Sci. USA 2023, 120, e2220417120. [Google Scholar] [CrossRef] [PubMed]
  48. Zhang, F.; Salazar-Miranda, A.; Duarte, F.; Vale, L.; Hack, G.; Chen, M.; Liu, Y.; Batty, M.; Ratti, C. Urban Visual Intelligence: Studying Cities with Artificial Intelligence and Street-Level Imagery. Ann. Am. Assoc. Geogr. 2024, 114, 876–897. [Google Scholar] [CrossRef]
  49. Hou, Y.; Biljecki, F. A Comprehensive Framework for Evaluating the Quality of Street View Imagery. Int. J. Appl. Earth Obs. Geoinf. 2022, 115, 103094. [Google Scholar] [CrossRef]
  50. Kang, Y.; Zhang, F.; Gao, S.; Lin, H.; Liu, Y. A Review of Urban Physical Environment Sensing Using Street View Imagery in Public Health Studies. Ann. GIS 2020, 26, 261–275. [Google Scholar] [CrossRef]
  51. Zhou, B.; Zhao, H.; Puig, X.; Xiao, T.; Fidler, S.; Barriuso, A.; Torralba, A. Semantic Understanding of Scenes through the ADE20K Dataset. Int. J. Comput. Vis. 2018, 127, 302–321. [Google Scholar] [CrossRef]
  52. Cordts, M.; Omran, M.; Ramos, S.; Rehfeld, T.; Enzweiler, M.; Benenson, R.; Franke, U.; Roth, S.; Schiele, B. The Cityscapes Dataset for Semantic Urban Scene Understanding. In Proceedings of the 2016 IEEE Conference on Computer Vision and Pattern Recognition (CVPR), Las Vegas, NV, USA, 27–30 June 2016; IEEE: Las Vegas, NV, USA, 2016; pp. 3213–3223. [Google Scholar]
  53. Lin, J.; Wang, Q.; Li, X. Socioeconomic and Spatial Inequalities of Street Tree Abundance, Species Diversity, and Size Structure in New York City. Landsc. Urban Plan. 2021, 206, 103992. [Google Scholar] [CrossRef]
  54. Sun, Y.; Wang, X.; Zhu, J.; Chen, L.; Jia, Y.; Lawrence, J.M.; Jiang, L.; Xie, X.; Wu, J. Using Machine Learning to Examine Street Green Space Types at a High Spatial Resolution: Application in Los Angeles County on Socioeconomic Disparities in Exposure. Sci. Total Environ. 2021, 787, 147653. [Google Scholar] [CrossRef]
  55. Xiao, C.; Shi, Q.; Gu, C.-J. Assessing the Spatial Distribution Pattern of Street Greenery and Its Relationship with Socioeconomic Status and the Built Environment in Shanghai, China. Land 2021, 10, 871. [Google Scholar] [CrossRef]
  56. He, D.; Miao, J.; Lu, Y.; Song, Y.; Chen, L.; Liu, Y. Urban Greenery Mitigates the Negative Effect of Urban Density on Older Adults’ Life Satisfaction: Evidence from Shanghai, China. Cities 2022, 124, 103607. [Google Scholar] [CrossRef]
  57. Zhang, L.; Wang, L.; Wu, J.; Li, P.; Dong, J.; Wang, T. Decoding Urban Green Spaces: Deep Learning and Google Street View Measure Greening Structures. Urban For. Urban Green. 2023, 87, 128028. [Google Scholar] [CrossRef]
  58. Zhu, H.; Nan, X.; Yang, F.; Bao, Z. Utilizing the Green View Index to Improve the Urban Street Greenery Index System: A Statistical Study Using Road Patterns and Vegetation Structures as Entry Points. Landsc. Urban Plan. 2023, 237, 104780. [Google Scholar] [CrossRef]
  59. Krylov, V.A.; Kenny, E.; Dahyot, R. Automatic Discovery and Geotagging of Objects from Street View Imagery. Remote Sens. 2018, 10, 661. [Google Scholar] [CrossRef]
  60. Lumnitz, S.; Devisscher, T.; Mayaud, J.R.; Radic, V.; Coops, N.C.; Griess, V.C. Mapping Trees along Urban Street Networks with Deep Learning and Street-Level Imagery. ISPRS J. Photogramm. Remote Sens. 2021, 175, 144–157. [Google Scholar] [CrossRef]
  61. Velasquez-Camacho, L.; Etxegarai, M.; de-Miguel, S. Implementing Deep Learning Algorithms for Urban Tree Detection and Geolocation with High-Resolution Aerial, Satellite, and Ground-Level Images. Comput. Environ. Urban Syst. 2023, 105, 102025. [Google Scholar] [CrossRef]
  62. Liu, D.; Jiang, Y.; Wang, R.; Lu, Y. Establishing a Citywide Street Tree Inventory with Street View Images and Computer Vision Techniques. Comput. Environ. Urban Syst. 2023, 100, 101924. [Google Scholar] [CrossRef]
  63. Hu, C.-B.; Zhang, F.; Gong, F.-Y.; Ratti, C.; Li, X. Classification and Mapping of Urban Canyon Geometry Using Google Street View Images and Deep Multitask Learning. Build. Environ. 2020, 167, 106424. [Google Scholar] [CrossRef]
  64. Yan, Y.; Huang, B. Estimation of Building Height Using a Single Street View Image via Deep Neural Networks. ISPRS J. Photogramm. Remote Sens. 2022, 192, 83–98. [Google Scholar] [CrossRef]
  65. Sun, M.; Zhang, F.; Duarte, F.; Ratti, C. Understanding Architecture Age and Style through Deep Learning. Cities 2022, 128, 103787. [Google Scholar] [CrossRef]
  66. Tang, J.; Long, Y. Measuring Visual Quality of Street Space and Its Temporal Variation: Methodology and Its Application in the Hutong Area in Beijing. Landsc. Urban Plan. 2019, 191, 103436. [Google Scholar] [CrossRef]
  67. Xia, Y.; Yabuki, N.; Fukuda, T. Sky View Factor Estimation from Street View Images Based on Semantic Segmentation. Urban Clim. 2021, 40, 100999. [Google Scholar] [CrossRef]
  68. Zhu, H.; Gu, Z. A Method of Estimating the Spatiotemporal Distribution of Reflected Sunlight from Glass Curtain Walls in High-Rise Business Districts Using Street-View Panoramas. Sustain. Cities Soc. 2022, 79, 103671. [Google Scholar] [CrossRef]
  69. Li, X.; Ratti, C.; Seiferling, I. Quantifying the Shade Provision of Street Trees in Urban Landscape: A Case Study in Boston, USA, Using Google Street View. Landsc. Urban Plan. 2018, 169, 81–91. [Google Scholar] [CrossRef]
  70. Liu, Z. Towards Feasibility of Photovoltaic Road for Urban Traffic-Solar Energy Estimation Using Street View Image. J. Clean. Prod. 2019, 228, 303–318. [Google Scholar] [CrossRef]
  71. Deng, M.; Yang, W.; Chen, C.; Wu, Z.; Liu, Y.; Xiang, C. Street-Level Solar Radiation Mapping and Patterns Profiling Using Baidu Street View Images. Sustain. Cities Soc. 2021, 75, 103289. [Google Scholar] [CrossRef]
  72. Kim, S.; Woo, A. Streetscape and Business Survival: Examining the Impact of Walkable Environments on the Survival of Restaurant Businesses in Commercial Areas Based on Street View Images. J. Transp. Geogr. 2022, 105, 103480. [Google Scholar] [CrossRef]
  73. Liu, Y.; Liu, Y. Detecting the City-Scale Spatial Pattern of the Urban Informal Sector by Using the Street View Images: A Street Vendor Massive Investigation Case. Cities 2022, 131, 103959. [Google Scholar] [CrossRef]
  74. Campbell, A.; Both, A.; Sun, Q. (Chayn) Detecting and Mapping Traffic Signs from Google Street View Images Using Deep Learning and GIS. Comput. Environ. Urban Syst. 2019, 77, 101350. [Google Scholar] [CrossRef]
  75. Guan, F.; Fang, Z.; Zhang, X.; Zhong, H.; Zhang, J.; Huang, H. Using Street-View Panoramas to Model the Decision-Making Complexity of Road Intersections Based on the Passing Branches during Navigation. Comput. Environ. Urban Syst. 2023, 103, 101975. [Google Scholar] [CrossRef]
  76. Xing, Z.; Yang, S.; Zan, X.; Dong, X.; Yao, Y.; Liu, Z.; Zhang, X. Flood Vulnerability Assessment of Urban Buildings Based on Integrating High-Resolution Remote Sensing and Street View Images. Sustain. Cities Soc. 2023, 92, 104467. [Google Scholar] [CrossRef]
  77. Ki, D.; Chen, Z.; Lee, S.; Lieu, S. A Novel Walkability Index Using Google Street View and Deep Learning. Sustain. Cities Soc. 2023, 99, 104896. [Google Scholar] [CrossRef]
  78. Liu, J.; Ettema, D.; Helbich, M. Street View Environments Are Associated with the Walking Duration of Pedestrians: The Case of Amsterdam, the Netherlands. Landsc. Urban Plan. 2023, 235, 104752. [Google Scholar] [CrossRef]
  79. Rui, J. Measuring Streetscape Perceptions from Driveways and Sidewalks to Inform Pedestrian-Oriented Street Renewal in Düsseldorf. Cities 2023, 141, 104472. [Google Scholar] [CrossRef]
  80. Helbich, M.; Yao, Y.; Liu, Y.; Zhang, J.; Liu, P.; Wang, R. Using Deep Learning to Examine Street View Green and Blue Spaces and Their Associations with Geriatric Depression in Beijing, China. Environ. Int. 2019, 126, 107–117. [Google Scholar] [CrossRef]
  81. Akpınar, A. How Perceived Sensory Dimensions of Urban Green Spaces Are Associated with Teenagers’ Perceived Restoration, Stress, and Mental Health? Landsc. Urban Plan. 2021, 214, 104185. [Google Scholar] [CrossRef]
  82. Yao, Y.; Yin, H.; Xu, C.; Chen, D.; Shao, L.; Guan, Q.; Wang, R. Assessing Myocardial Infarction Severity from the Urban Environment Perspective in Wuhan, China. J. Environ. Manag. 2022, 317, 115438. [Google Scholar] [CrossRef]
  83. Kim, J.-I.; Yu, C.-Y.; Woo, A. The Impacts of Visual Street Environments on Obesity: The Mediating Role of Walking Behaviors. J. Transp. Geogr. 2023, 109, 103593. [Google Scholar] [CrossRef]
  84. Zhang, Y.; Zhang, F.; Chen, N. Migratable Urban Street Scene Sensing Method Based on Vision Language Pre-Trained Model. Int. J. Appl. Earth Obs. Geoinf. 2022, 113, 102989. [Google Scholar] [CrossRef]
  85. Zeng, Q.; Gong, Z.; Wu, S.; Zhuang, C.; Li, S. Measuring Cyclists’ Subjective Perceptions of the Street Riding Environment Using K-Means SMOTE-RF Model and Street View Imagery. Int. J. Appl. Earth Obs. Geoinf. 2024, 128, 103739. [Google Scholar] [CrossRef]
  86. Yu, X.; Her, Y.; Huo, W.; Chen, G.; Qi, W. Spatio-Temporal Monitoring of Urban Street-Side Vegetation Greenery Using Baidu Street View Images. Urban For. Urban Green. 2022, 73, 127617. [Google Scholar] [CrossRef]
  87. Han, Y.; Zhong, T.; Yeh, A.G.O.; Zhong, X.; Chen, M.; Lü, G. Mapping Seasonal Changes of Street Greenery Using Multi-Temporal Street-View Images. Sustain. Cities Soc. 2023, 92, 104498. [Google Scholar] [CrossRef]
  88. Li, X. Examining the Spatial Distribution and Temporal Change of the Green View Index in New York City Using Google Street View Images and Deep Learning. Environ. Plan. B Urban Anal. City Sci. 2021, 48, 2039–2054. [Google Scholar] [CrossRef]
  89. Thackway, W.; Ng, M.; Lee, C.-L.; Pettit, C. Implementing a Deep-Learning Model Using Google Street View to Combine Social and Physical Indicators of Gentrification. Comput. Environ. Urban Syst. 2023, 102, 101970. [Google Scholar] [CrossRef]
  90. Shanghai Municipal Bureau of Planning and Natural Resources. Shanghai Master Plan (2017–2035). Shanghai, China. 2018. Available online: https://ghzyj.sh.gov.cn/gtztgh/20230920/9799aa7eeed84b8aa318983474f9eccf.html (accessed on 18 July 2025).
  91. Shanghai Municipal Bureau of Statistics. The Seventh National Population Census of Shanghai. Shanghai, China. 2021. Available online: https://tjj.sh.gov.cn/7renpu/index.html (accessed on 18 July 2025).
  92. Dubey, A.; Naik, N.; Parikh, D.; Raskar, R.; Hidalgo, C.A. Deep Learning the City: Quantifying Urban Perception at a Global Scale. In Computer Vision—ECCV 2016; Leibe, B., Matas, J., Sebe, N., Welling, M., Eds.; Lecture Notes in Computer Science; Springer International Publishing: Cham, Switzerland, 2016; Volume 9905, pp. 196–212. ISBN 978-3-319-46447-3. [Google Scholar]
  93. Donnelly, J.; Daneshkhah, A.; Abolfathi, S. Physics-Informed Neural Networks as Surrogate Models of Hydrodynamic Simulators. Sci. Total Environ. 2024, 912, 168814. [Google Scholar] [CrossRef] [PubMed]
  94. Donnelly, J.; Daneshkhah, A.; Abolfathi, S. Forecasting Global Climate Drivers Using Gaussian Processes and Convolutional Autoencoders. Eng. Appl. Artif. Intell. 2024, 128, 107536. [Google Scholar] [CrossRef]
  95. Zhou, B.; Zhao, H.; Puig, X.; Fidler, S.; Barriuso, A.; Torralba, A. Scene Parsing Through ADE20K Dataset. In Proceedings of the 2017 IEEE Conference on Computer Vision and Pattern Recognition (CVPR), Honolulu, HI, USA, 21–26 July 2017; pp. 633–641. [Google Scholar]
  96. Zhang, F.; Zhou, B.; Liu, L.; Liu, Y.; Fung, H.H.; Lin, H.; Ratti, C. Measuring Human Perceptions of a Large-Scale Urban Region Using Machine Learning. Landsc. Urban Plan. 2018, 180, 148–160. [Google Scholar] [CrossRef]
  97. Schölkopf, B.; Platt, J.; Hofmann, T. TrueSkill: A Bayesian Skill Rating System; MIT Press: Boston, MA, USA, 2007; pp. 569–576. [Google Scholar]
  98. Nasar, J.L. The Evaluative Image of the City. J. Am. Plan. Assoc. 1990, 56, 41–53. [Google Scholar] [CrossRef]
  99. Joachims, T. Text Categorization with Support Vector Machines: Learning with Many Relevant Features. In Proceedings of the Machine Learning: ECML-98, Chemnitz, Germany, 21–23 April 1998; Nédellec, C., Rouveirol, C., Eds.; Springer: Berlin/Heidelberg, Germany, 1998; pp. 137–142. [Google Scholar]
  100. Yeganeh-Bakhtiary, A.; EyvazOghli, H.; Shabakhty, N.; Abolfathi, S. Machine Learning Prediction of Wave Characteristics: Comparison between Semi-Empirical Approaches and DT Model. Ocean Eng. 2023, 286, 115583. [Google Scholar] [CrossRef]
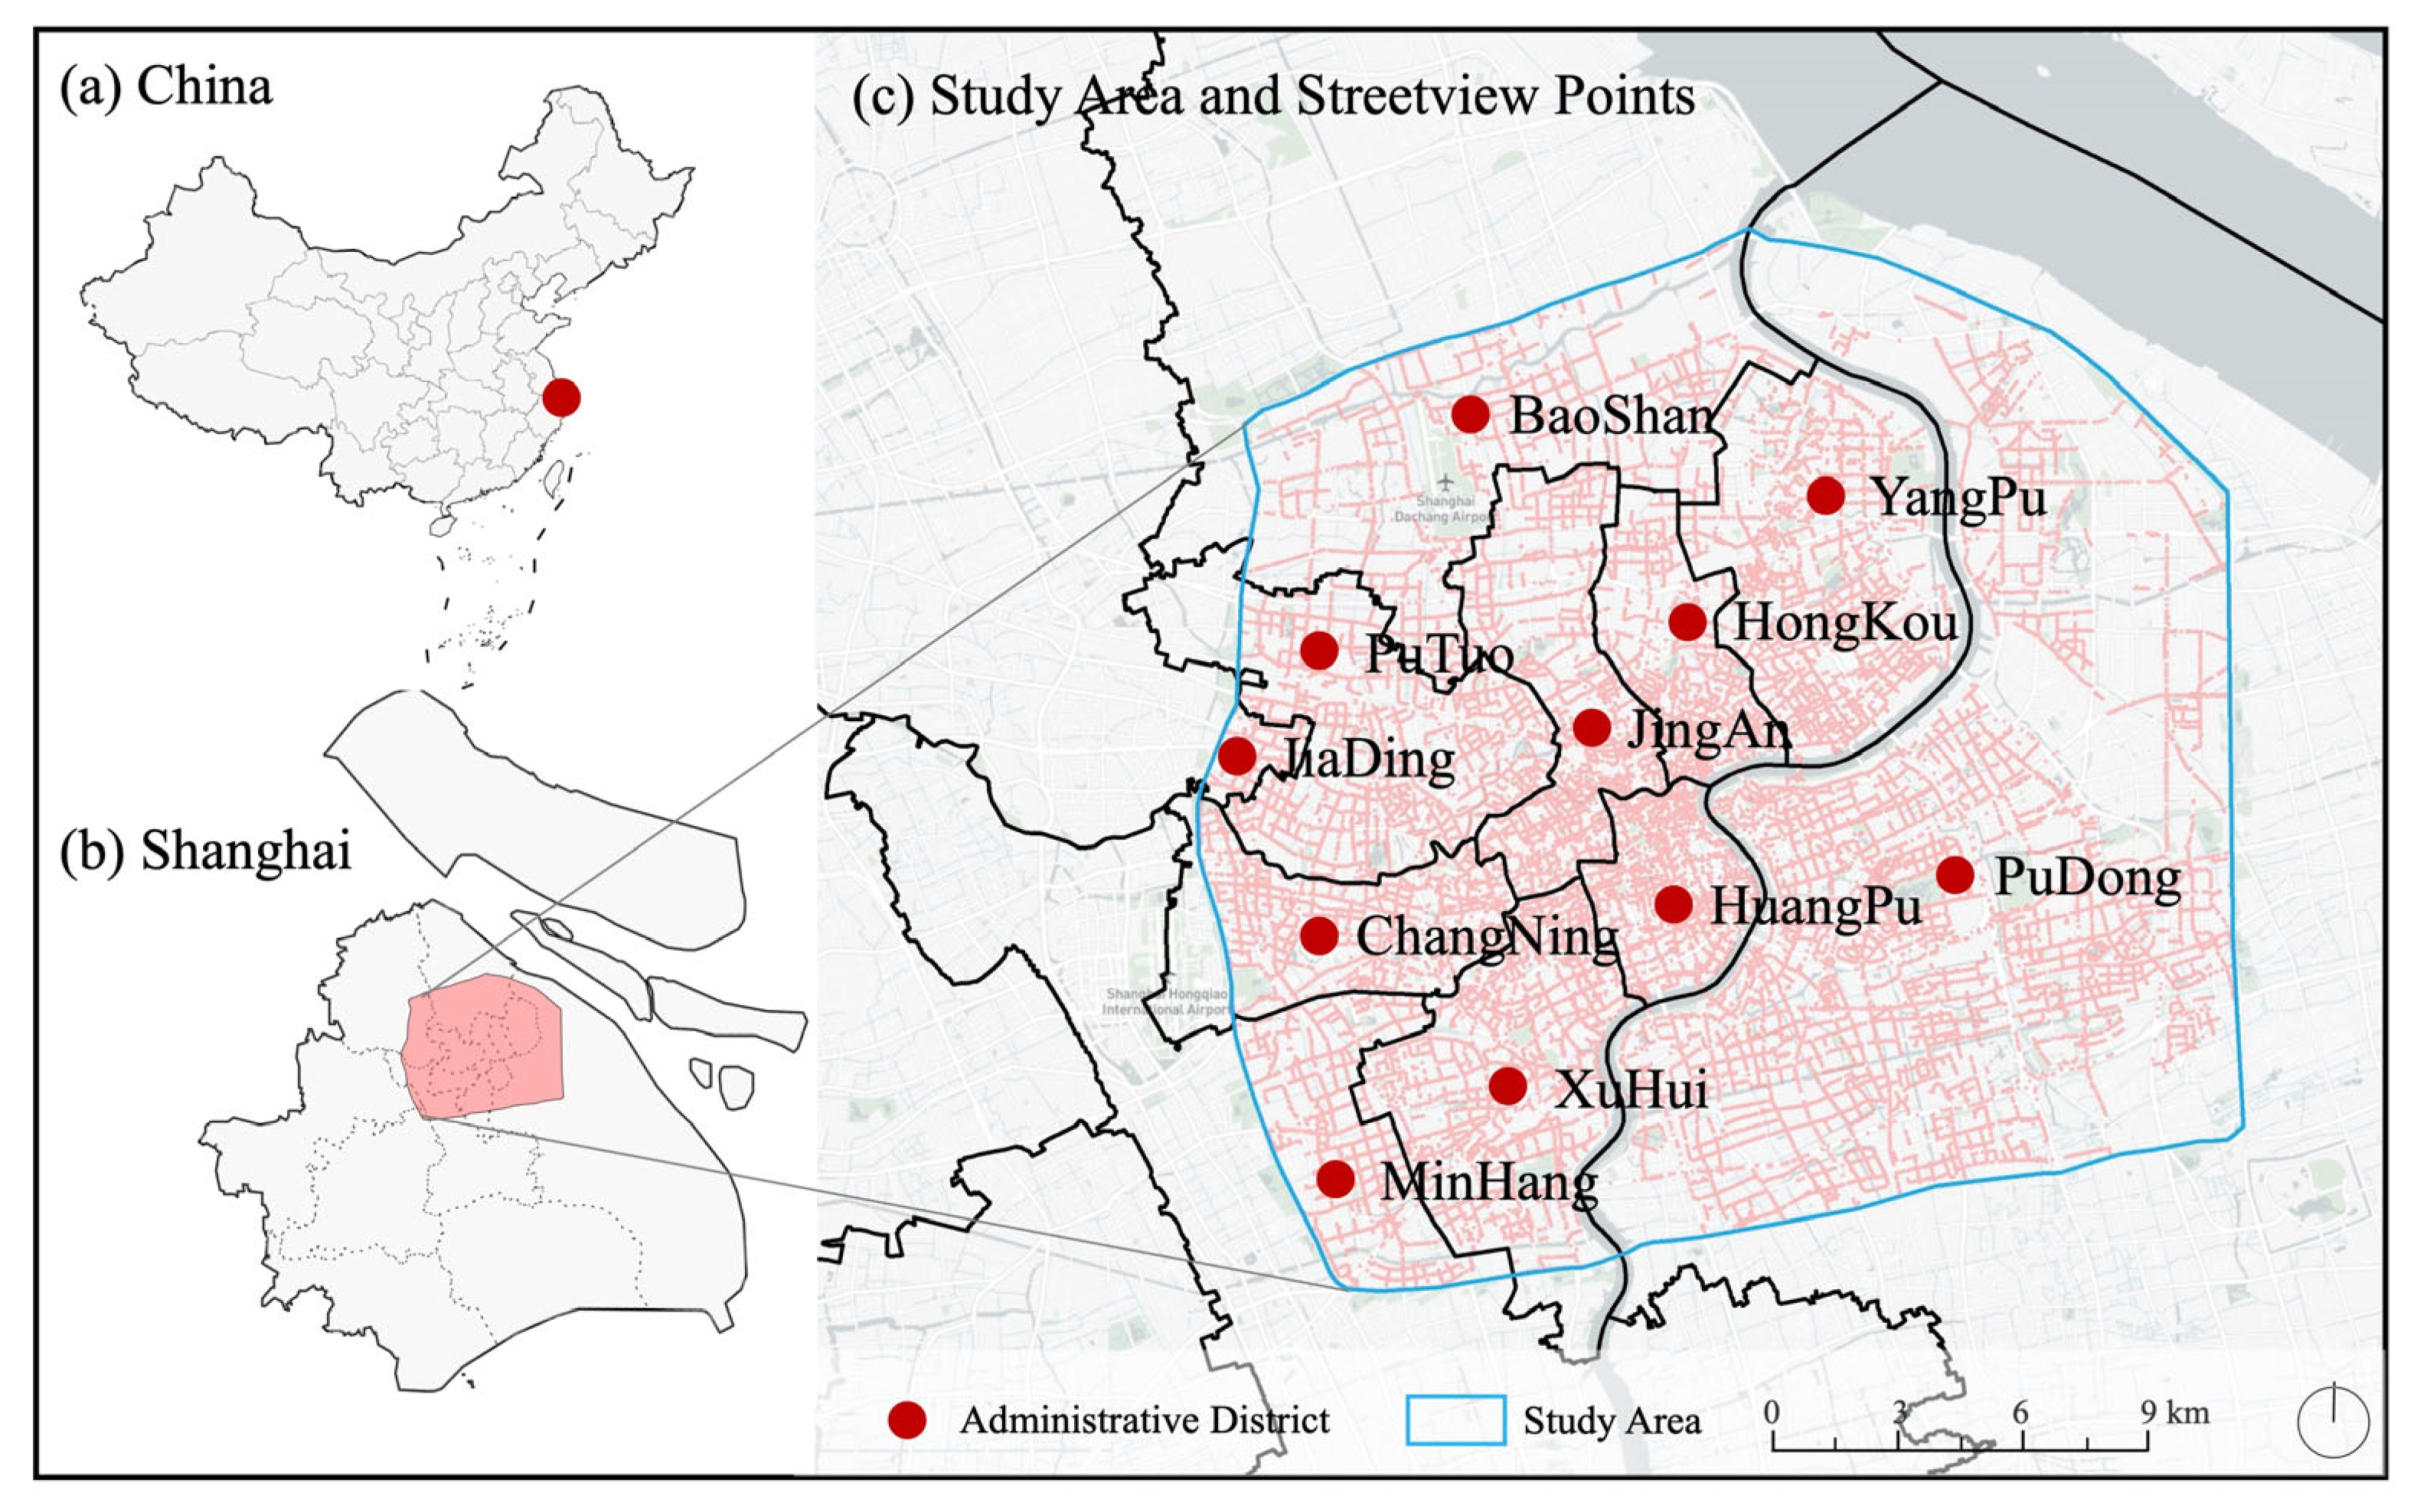
Figure 1. Study area. (a) Map of China; (b) Map of Shanghai; (c) Study area and street view points.
Ijgi 14 00390 g001
Figure 2. MIT Place Pulse 2.0 data collection platform interface (https://www.media.mit.edu/projects/place-pulse-1/overview/ (accessed on 1 August 2025)). The volunteers were asked to choose one of two images to reflect their perception of them.
Ijgi 14 00390 g002
Figure 3. Collection and seasonal filtering of historical street view.
Ijgi 14 00390 g003
Figure 4. Overall research design. Our research consists of three main parts: (a) Image segmentation and visual element extraction; (b) SVC model training and perception prediction; (c) Perception spatial-temporal analysis.
Ijgi 14 00390 g004
Figure 5. Mapping the human comprehensive perception scores of Shanghai using 6 perceptual indicators. (a) Comprehensive perception scores in 2013; (b) Comprehensive perception scores in 2019; (c) Perception score distribution in 2013; (d) Perception score distribution in 2019; (e) Boxplot of two perception scores.
Ijgi 14 00390 g005
Figure 6. Mapping the human perception changes of Shanghai using two years of comprehensive perception scores. (a) The spatial distribution of perception score increase and perception score decrease; (b) The statistical distribution of perception score increase and perception score decrease.
Ijgi 14 00390 g006
Figure 7. Mapping the statistical perception changes of concentric circles from the urban center of Shanghai. Taking the shape center of the study area as the midpoint, 13 concentric rings with an incremental radius of 1.5km were drawn. For each concentric circle area, the perception scores of the images are summarized and averaged. (a) Construction of urban belt; (b) Bar graph of two years of perception scores; (c) A graph showing the trend of perceptual changes with distance.
Ijgi 14 00390 g007
Table 1. MIT Place Pulse 2.0 dataset’s statistics on geographical distribution.
ContinentNumber of CitiesNumber of Images
Asia711,342
Africa35069
Australia26082
Europe2238,636
North America1533,691
South America716,168
Total56110,988
Table 2. Evaluation of machine learning models for urban perception.
PerceptionAccuracyPrecisionRecallF1 Score
Safety0.67830.68470.67830.6737
Lively0.67770.67840.67770.6777
Beautiful0.72390.73420.72390.7186
Wealthy0.62370.62950.62370.6191
Depress0.61900.62790.61900.6115
Boring0.59120.59240.59120.5889
Table 3. Top 8 visual elements identified following segmentation of the Baidu street view images.
NumberVisual
Elements
2013
Mean
2019
Mean
2013
Max
2019
Max
2013
Min
2019
Min
2013
S.D.
2019
S.D.
1Road0.2330.2250.4580.4311.74E-066.94E-060.0830.069
2Plant0.2220.2590.7920.8018.68E-078.68E-070.1280.139
4Building0.1920.1840.8790.8385.21E-068.68E-070.1290.134
5Sky0.1770.1730.5480.5848.68E-073.47E-060.1070.109
6Sidewalk0.0680.0600.3680.3468.68E-078.68E-070.0540.044
7Wall0.0230.0230.6760.8788.67E-078.68E-070.0440.046
8Fence0.0120.0140.3020.3538.68E-078.68E-070.0200.023
Table 4. The linear regression analysis results of the differences in visual elements and perceived differences (n = 33,626).
Non-Standardized
Coefficient
Standardized
Coefficient
BStand ErrorBetatp
(Constant)0.0030-10.1990.000 ***
Differ Tree0.6590.0060.571113.3410.000 ***
Differ Road0.1260.0040.08630.2360.000 ***
Differ Building−0.0870.006−0.068−15.2190.000 ***
Differ Sky−0.6520.006−0.423−108.1360.000 ***
Differ Sidewalk−0.0330.005−0.017−6.2410.000 ***
Differ Plant0.0610.0080.0197.6560.000 ***
Differ Wall−0.2560.007−0.103−36.0580.000 ***
Differ Fence−0.070.009−0.019−7.4850.000 ***
Dependent variable: difference score; Model fit: R2 = 0.812; Adjusted R2 = 0.812; F (8, 33,617) = 18,110.035, p < 0.001; *** p < 0.001.
Disclaimer/Publisher’s Note: The statements, opinions and data contained in all publications are solely those of the individual author(s) and contributor(s) and not of MDPI and/or the editor(s). MDPI and/or the editor(s) disclaim responsibility for any injury to people or property resulting from any ideas, methods, instructions or products referred to in the content.