Abstract
Understanding the space-time dynamics of human activities is essential in studying human security issues such as climate change impacts, pandemic spreading, or urban sustainability. Geotagged social media posts provide an open and space-time continuous data source with user locations which is convenient for studying human movement. However, the reliability of Chinese geotagged social media data for representing human mobility remains unclear. This study compares human movement data derived from the posts of Sina Weibo, one of the largest social media software in China, and that of Baidu Qianxi, a high-resolution human movement dataset from ‘Baidu Map’, a popular location-based service in China with 1.3 billion users. Correlation analysis was conducted from multiple dimensions of time periods (weekly and monthly), geographic scales (cities and provinces), and flow directions (inflow and outflow), and a case study on COVID-19 transmission was further explored with such data. The result shows that Sina Weibo data can reveal similar patterns as that of Baidu Qianxi, and that the correlation is higher at the provincial level than at the city level and higher at the monthly scale than at the weekly scale. The study also revealed spatial variations in the degree of similarity between the two sources. Findings from this study reveal the values and properties and spatiotemporal heterogeneity of human mobility data extracted from Weibo tweets, providing a reference for the proper use of social media posts as the data sources for human mobility studies.
1. Introduction
Capturing the space-time dynamics of human activities is essential for understanding human security issues, such as climate change impacts, pandemic spreading, or urban sustainability [1,2,3,4]. Along with the vigorous development of big data in daily life, real time data such as mobile phone signaling data, GPS data, and location-based services are regarded as the main source for tracing human mobility [5]. Wherein, open geo-tagged social media data has become an important and popular source of spatial analysis, providing spatiotemporal dynamics of user activities [6]. Results of such studies may be largely affected by the quality of the data. Thus, the reliability of geo-tagged social media data has received increasing attention.
Studies have pointed out that human mobility patterns derived from social media data have an obvious bias compared with the real world and may be limited by the characteristics of social media users and their tweets-posting behaviors such as gender [7], posting habits [8,9], and various user ratios in different geographic locations [10]. For instance, tweets posted by residents and travelers may differ [11,12]. More importantly, the geotags may be different from the real location of the user [13].
In China, Sina Weibo, one of the largest social media software in China (regarded as the Chinese version of Twitter) had 573 million daily active users and 248 million daily active users by the end of third quarter of 2021. According to its official report in 2021 [14], Weibo users are mainly the generation born in the 1990s and 2000s, accounting for nearly 80% of the total and thereby revealing a younger trend. However, the reliability of geotagged Weibo tweets for representing human mobility in China remains unclear.
A potential comparable data for human mobility in China is Baidu Qianxi data [15], which is derived from the location-based service (LBS) of Baidu Map. Baidu Map is is the most popular online map service application in China with a total of 1.3 billion users. Baidu Qianxi maps use location information of Baidu Map users for calculation, analysis, and visualization of aggregated human flow among cities. As “Qianxi” in Chinese means migration, Baidu Qianxi data was originally intended to portray the large-scale population flow during the Spring Festival, the most important traditional holiday in China.
Weibo tweets have been utilized with their geographic and semantic information, wherein the text has been widely used in analyzing public opinion [16], user behavior [17], subjective wellbeing [18], climate change [19], and hazard management [20]. The geotags have been used as an important open data for identifying land use [21], urban function area [22,23], urban spatial structure [24], and delimitating urban boundaries [25]. Recent studies also extract human mobility information based on geotags to analyze regional spatial networks [26] and evaluate spatial segregation patterns [27]. Baidu Qianxi data has been widely used in identifying the structure of urban agglomerations [28], predicting pandemic spreading [29,30], and evaluating disaster impacts [31].
As the two most popular open datasets in China, Baidu Qianxi and Weibo tweets play important roles in contemporary study on human mobility, but both have shortcomings. The former is of high resolution, albeit only open during particular period, while the latter may be grasped continuously but shows sparsity in quantity. Thus, one way to assessing the reliability of human flow data derived from Weibo tweets is to compare it with that of Baidu Qianxi during its available periods. A case study on COVID-19 transmission in Wuhan could be further explored, as the inter-regional human mobility pattern is verified to have played a critical role in the pandemic spread [32,33].
Based on geotagged Weibo tweets and Baidu Qianxi during 1 February 2021 to 30 June 2021, this study evaluated the reliability of human mobility data generated by Weibo tweets in different scales of time and geography and explored the correlation between human mobility and COVID-19 spreading in early 2020. This research reveals the values, properties, and spatiotemporal heterogeneity of human mobility data extracted from Weibo, which will be beneficial to future research using open social media data as sources of human movement information.
2. Materials and Methods
2.1. Data Preprocessing
2.1.1. Inter-Regional Flows of Baidu Qianxi Map
Baidu Qianxi data has been released and available only during the period of Chinese Spring Festival, describing the daily migration dynamics across the whole country. To assist in monitoring COVID-19 risk by tracing human flow during the pandemic, Baidu Qianxi released continuous daily inter-regional flows data, which can be categorized as inflow and outflow between cities and provinces. The original map reports the inter-regional flows for every geographic unit by two kinds of data, namely the total flows which has been scaled proportionally according to the real population and the portions of the flow between each geographic unit and others. Such data should be reprocessed back to origin-destination (OD) lists (Figure 1). In the flow matrix, only data of the top 100 cities in term of flow are shown. There is little difference between the OD lists of inflow and that of outflow at the city level.
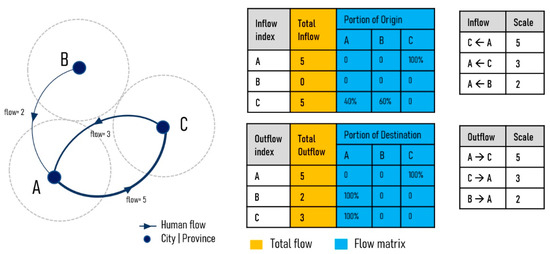
Figure 1.
Data structure of Baidu Qianxi map.
As Baidu Qianxi map did not provide continuous time series data in 2019 and 2020, therefore five-month data from 1 February to 30 June of 2021 were selected for comparison. The data were scraped by a Python program and further processed as OD lists, wherein, there are 5,165,364 records for inflow, 5,159,156 records for outflow at the city level, and 142,761 records for both inflow and outflow at the province level.
The daily OD lists were further aggregated into weekly and monthly data for comparison with Weibo tweets data. Figure 2 shows aggravated intercity human mobility in the first week and month.
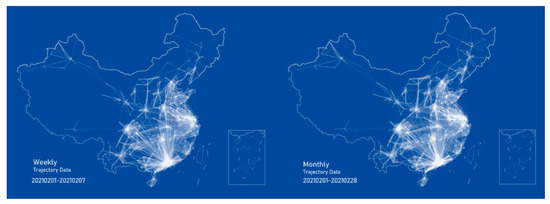
Figure 2.
Weekly and monthly inter-city flows from Baidu Qianxi. The widths of lines reflect the counts of flows between cities, while both the monthly and weekly data were proportionally scaled for visual clarity.
2.1.2. Inter-Regional Flows Based on Geo-Tagged Weibo Tweets Data
The geo-tagged Weibo tweets data during 1 February and 30 June 2021 was stored and processed on a high-performance computing platform [34]. The records contain information of unique user ID and location coordinates, and were further processed through three steps: (1) transforming the original coordinates of Weibo tweets to the coordinates of cities and provinces by spatial join; (2) aggregating continuous movement within the same region as one record; and (3) constructing an OD network based on user movement between regions (Figure 3). During initial data exploration, nondirectional and directional networks have both been compared; the former builds connections between all recorded locations of one user while the latter only build connections by time sequence. As subsequent results show that the directional network has a higher correlation to Baidu Qianxi data, the directional network was adopted for further analysis.
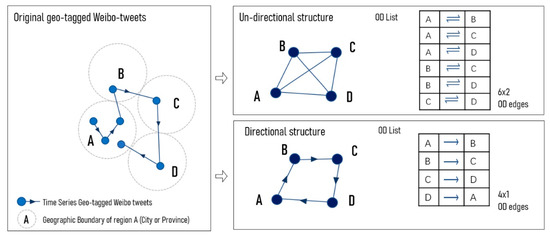
Figure 3.
Illustration of OD flows generated by geo-tagged Weibo Tweets.
The data in April 2021 were aggregated as a sample to test the completeness of geographic coverage by the OD matrix in different time spans at provincial and city levels (Table 1). The result shows that Baidu has much better coverage than Weibo in terms of OD matrix locations. There are 33 geographic units at the provincial level and 369 geographic units at the city level. The ideal complete records including all cities and provinces should be 20,313,600 (368 × 368 × 150) and 153,600 (32 × 32 × 150), respectively.

Table 1.
Statistical summary of locational completeness of all OD matrixes.
Since Weibo data is too sparse at the daily scale, we decided to conduct further analysis on weekly and monthly aggregation only. Figure 4 shows the weekly and monthly human mobility between cities based on geo-tagged Weibo tweet data. Compared with Figure 3, it is obvious that monthly flow data by Weibo tweets is sparser than that by Baidu’s.
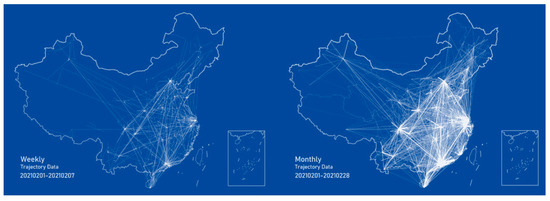
Figure 4.
Inter-city trajectory of geotagged Weibo users by weekly and monthly aggregation.
2.1.3. COVID-19 and Geographic Boundary Data
The COVID-19 infection data in China was acquired from the open database of Harvard Dataverse, which is further processed for the cumulative infection data from 24 January to 30 April 2020 (https://dataverse.harvard.edu/dataverse/cdl_dataverse, accessed on 18 October 2021) [35]. The dataset provides administrative boundary at city level in China as well.
2.2. Methods
As a most commonly used correlation coefficient, the Pearson correlation coefficient is utilized to evaluate the similarity between the inter-regional human mobility data from Weibo and Baidu Qixian data, whose value ranges between −1 and 1. The larger the absolute value, the stronger the correlation.
The correlation analysis was conducted from multiple dimensions of time periods (weekly and monthly), geographic scales (cities and provinces), and flow directions (inflow and outflow) (Figure 5). Flow counts between cities were ranked to generate a ranking order variable, which took each city as the core and ranked them by the number of its connected cities in reverse order.
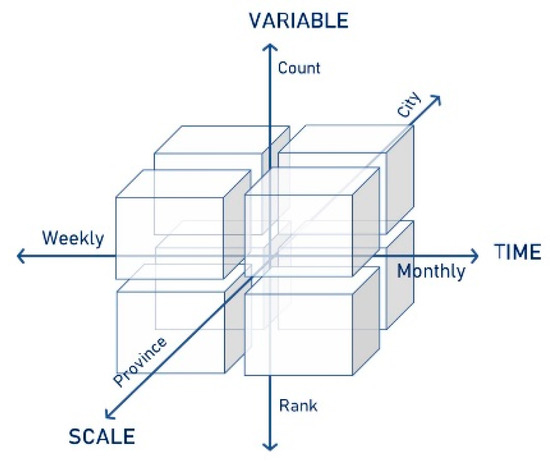
Figure 5.
Multiple dimensions of correlation analysis.
3. Results
3.1. Preliminary Statistical Description
The minimum of cross-regional user population recorded by Weibo data is 1, the maximum of weekly flow is 36, and the monthly flow is 364 (Table 2). Compared with the total population, the human mobility data generated by Weibo data represent a tiny fraction of the total data.
Table 2.
Statistical description of human mobility data of Baidu and Weibo.
The total inflow and outflow of each province were normalized for comparison on maps (Figure 6). On the maps based on Baidu data, there are obvious clusters along China’s east coast (especially in the Beijing-Tianjin-Hebei agglomeration and the Yangtze River Delta region), and Sichuan Province is more highlighted compared with other cities in west China. Although the importance of Sichuan was also visible on the map of Weibo data, only several provinces with higher flows were shown in the east, such as Beijing, Guangzhou, Shanghai, Jiangsu, and Zhejiang. Such a difference indicates that a large number of human movements in Shandong, Anhui, and Hunan provinces have not been reflected by Weibo data. This is likely due to the fact that the ratio of Weibo users to total population in these provinces is relatively low.
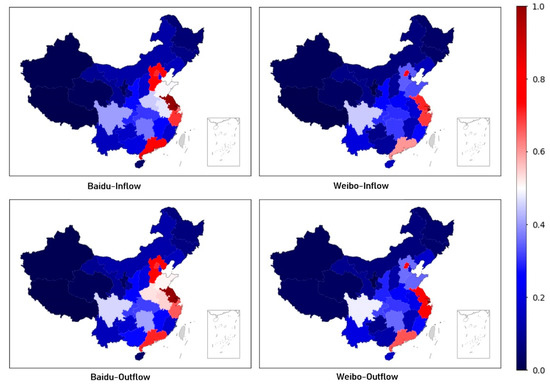
Figure 6.
Normalized aggregated flow by Baidu Qianxi and Weibo tweets.
3.2. Multi-Dimenstional Correlation Test
3.2.1. Spatial Heterogeneity in Correlation
- (1)
- Province level
The correlation result for each province showed that outflow and inflow correlation coefficients were close (Table 3). In terms of monthly data, the average value of correlation coefficient on flow count is 0.75–0.77, slightly higher than that of flow rank (0.75). For weekly data, the average value of correlation coefficient on flow count is 0.55, and that of flow rank is 0.50–0.51. However, based on the minimum coefficients, ranking data is more correlated than flow count, and outflow data show a higher correlation than inflow data.
Table 3.
Statistical description of correlation coefficients of all provinces.
The difference of coefficients was further visualized spatially (Figure 7). Obviously, the correlation of monthly data is higher than weekly data. In terms of monthly flow data, most provinces have a high correlation (except for Xinjiang, which has a low correlation). In terms of flow rank, the correlation of Xinjiang has been greatly improved (although the coefficients of Xinjiang, Tibet, and Qinghai in the west are relatively low).
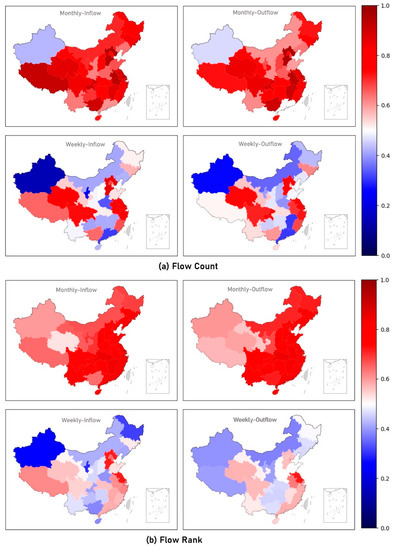
Figure 7.
Correlation at province level based on flow count and rank.
As for the weekly data, the spatial distribution of correlation presents a pattern of a “sandwich”, wherein both the eastern provinces and western provinces are higher while the central and northern provinces are relatively low.
- (2)
- City level
Compared to provincial data, the correlation at the city level is generally lower (Table 4). Among them, the mean correlation coefficients of monthly flow count and rank are 0.72–0.73 and 0.61, respectively, and the average weekly correlation coefficients are 0.48–0.50 and 0.47, respectively. Likewise, the correlation of the flow count is still higher than the rank data, and the correlations of inflow and outflow are similar, except that there is a slight difference in the weekly correlation. Such may be caused by the extreme sparsity in weekly aggregated Weibo data.
Table 4.
Statistical description of correlation coefficients of all Cities.
Figure 8 shows the spatial distribution of correlation differences at the city level. It shows that the monthly aggregated data of flow count is more correlated than flow rank. However, in some cities in the west and north of China, the ranking data is more correlated.
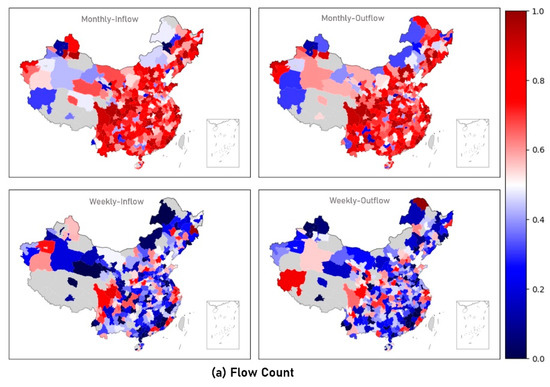
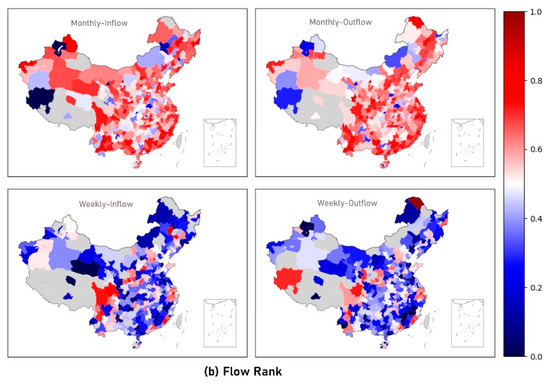
Figure 8.
Correlation at province level on flow count and rank.
Compared with monthly data, the weekly data shows lower correlation, which is only significant in a few cities such as Beijing, Shanghai, Guangzhou, Chongqing, Hangzhou, Wuhan, etc., which are the national or regional centers with more human mobility.
The relationship between the correlation and the OD records for each city was explored through scatter plots (Figure 9). The result shows that the correlation will increase with the growth of records number, while the fitted line implies an inverted U-shaped curve, meaning that more data could lead to a relative lower correlation.
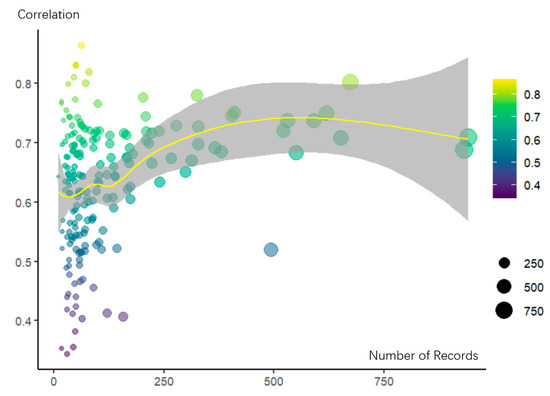
Figure 9.
Scatter plot on correlation between Weibo and Baidu and OD records of all cities.
3.2.2. Temporal Heterogeneity in Correlation
Similar to correlation coefficients increasing with higher level spatial aggregation, correlation coefficients also increased with higher time-based aggregation. This is likely due to the increased data amount. The coefficients of monthly data are higher than that of weekly data (Table 5). The count data and rank data show similar coefficient values at the monthly scale and different values at the weekly scale.
Table 5.
Statistical description of correlation coefficients of all provinces.
Figure 10 shows the time varying correlation in terms of province and city, monthly and weekly, and count and rank, which revealed a changing trend over time. Noticeably, the obvious nadirs and peaks on the curves could be related to two special time points (i.e., Spring Festive on 12 February and Labor Day on 1 May). As for the Spring Festival, a large number of migrant workers will return to their hometowns before the lunar new year and return to work after the holiday. Labor Day is another important recess for Chinese families, which usually include excursions or short trips to nearby tourism destinations.
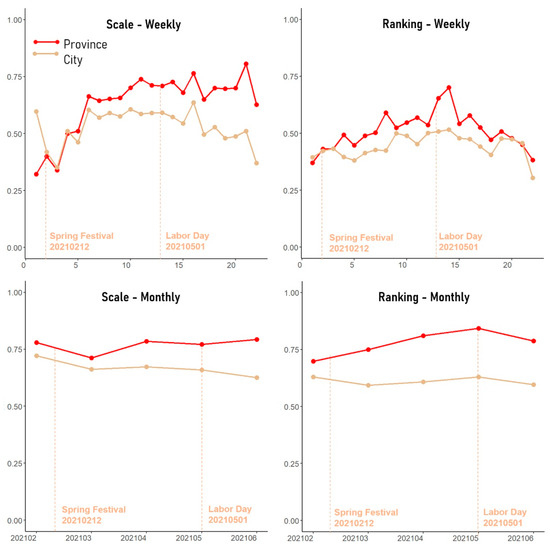
Figure 10.
Human mobility data correlation between Baidu Qianxi and Weibo tweets over time.
The result shows that the correlation declines during the Spring Festival, rises to the peak at the May 1st period, and then slightly declines. These changes may be explained by user behaviors on Weibo tweets during these two specific holidays. During the Spring Festival, as people are more likely to stay with family, fewer people would choose Weibo to record all of their activities. On the contrary, as the five-days recess in 2021 Labor Day was also called “Golden Week” for tourism, most families will take short trips around, and travelers are more willing to share their travel experiences via Weibo, their travel trajectories could be recorded by Weibo, which lead to the highest correlation in the whole period.
3.3. Case Study on COVID-19 Spread
A further comparison about the impact of human mobility on the early stage of COVID-19 transmission in Wuhan was conducted. Figure 11 plots the cumulative number of infections in all cities in Hubei Province from 24 January to 30 April 2020, wherein, besides Wuhan, Xiaogan and Huanggang have the largest number of infections, while Enshi and Qianjiang have the least.
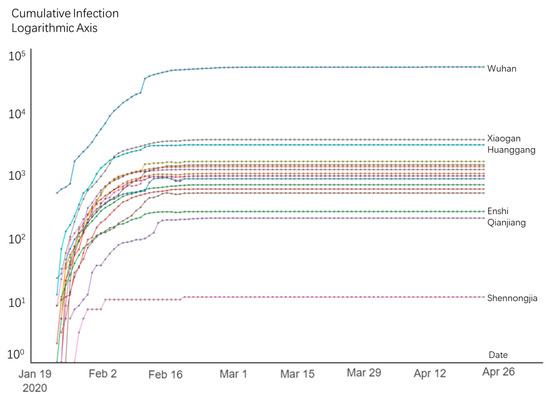
Figure 11.
Cumulative Infection of COVID-19 in Hubei Province, China.
Figure 12 shows the total inflow and outflow in Wuhan from 1 January to 30 April based on human mobility data generated by Baidu Qianxi and geotagged Weibo tweets. The two types of data show similar trend in terms of inflow and outflow. When the lockdown of Wuhan started on 23 January 2020, the flow of people dropped sharply. In the following two months, human mobility basically stagnated and only began to slowly rise in April. The correlation results show that both Baidu and Weibo data have a correlation of 0.98 on inflow and 0.94 on outflow. An interesting observation is that the human mobility data by Weibo fluctuated more than Baidu during the lockdown period, which may be related to that some users used different location tags other than where they posted the tweets, expressing the expectation for normal life after the pandemic was controlled.
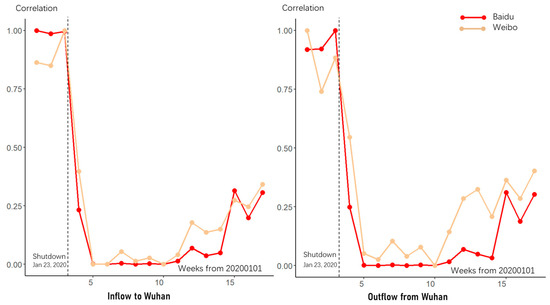
Figure 12.
Total inflow and outflow of Wuhan from 1 January to 30 April.
The correlation between the population outflows from Wuhan and the total number of infected persons in cities across the country and across Hubei province on 30 April 2020 was explored based on normalized values (Figure 13).
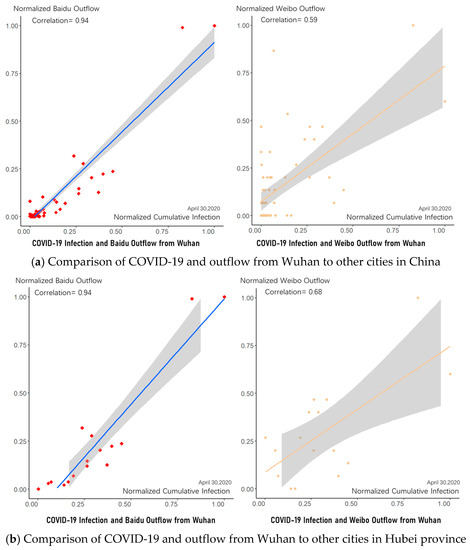
Figure 13.
Comparison of COVID-19 infection and outflow from Wuhan.
For all cities across the country, the correlation of Baidu data and Weibo data is 0.94 and 0.62, respectively, while the correlation between Weibo and Baidu is 0.70. For cities in Hubei Province, the correlation of Weibo data index rose to 0.68, and the correlation between Weibo and Baidu was lift to 0.81 as well (Table 6). The correlation coefficients of flow count are generally higher than flow ranking. The results show that although the human mobility data of Weibo data is less correlated with infection data than Baidu, it can also capture the impact of human mobility on the epidemic spread, reflecting the usefulness of Weibo data on providing spatial dynamic information.
Table 6.
Correlation coefficients between human mobility and COVID-19 infection.
4. Discussion
The purpose of this study is to evaluate the reliability of inflow and outflow data generated by Weibo tweets on different spatiotemporal scales compared with Baidu Qianxi data and to compare the correlation with the case study of COVID-19 transmission. The results verify that Weibo data can represent the inter-regional mobility, which is consist with most literature on Twitter dataset [36,37], in addition, the comparative results of COVID-19 further show its applicability to the exploration of epidemic spread sex. However, it is also noteworthy that there exists obvious spatiotemporal heterogeneity in the correlation, ranging from 0.459 to 0.758 on a different spatial scale.
In terms of spatial scale differences, the correlation of provincial aggregate data is higher than data at the city level, which is consist with previous studies [7,38]. While it is believed that there is a difference between north and south and east and west in China [10], our research further indicates a potential “sandwich” pattern, suggesting that the middle of China is the region with the lowest correlation. This may be related to the denser population and smaller number of Weibo users in this area. Previous studies suggested that the correlation could be improved with more records of human flow [39]. However, the result of this study shows an inverted U-shaped curve between the correlation and the number of records, which indicates that a smaller amount of data could also lead to a higher correlation. From the perspective of flow rank, overall its correlation is lower than that of flow count. However, in some areas it will be higher than flow count, implying that the rank of distances to destinations may play a more important role than the physical distance [40].
In terms of the time dimension, the correlation coefficients of monthly data are relatively stable, but that of the weekly data changes significantly over time, which is consistent with previous studies [41]. The population movement during the Spring Festival and May Day were found to have a great impact on correlation between the two sources, indicating different Weibo posting behaviors during travelling and other movement under different occasions [11]. It also verified the importance of time series modeling in this filed [8].
Based on the case study of the epidemic, we found that both Baidu and Weibo data can reflect the correlation between population movement and epidemic transmission. It shows that Baidu data is more correlated to COVID transmission than Weibo data, which explains why most COVID-19 related studies are based on the data of Baidu Qianxi [31,42]. A related study based on the integration of spatial and semantic information in Weibo data provided higher correlation than the coefficients in this paper [43]. Such a gap implies that the supplement of semantic information may enhance geotagged Weibo tweet’s ability to capture the characteristics of human mobility.
In summary, this study revealed that geotagged Weibo data is representative of human mobility, which is consistent with recent research [43]. However, our research raises the issue of multi-dimensional heterogeneity which would be explored in the future with relevant learnings and other related models [44].
5. Conclusions
This study evaluated the reliability of human mobility data generated by Weibo tweets based on different dimensions of time, space, and flow directions. This evaluation provides reference to the usage of other open social media data sources, such as geotagged Twitter data, which has a broader coverage though not in China. Weibo and Twitter combined provides a continuous open social media data stream of global coverage. When used properly, they present tremendous potential for other studies such as identifying spatial structures, monitoring and controlling epidemic transmissions, et al. For modeling methodologies considered, matching learning models of GNN and LSTM may be applied in future studies.
Limitations of this study includes the following. First, the observed temporal heterogeneity is limited by the available Baidu Qianxi data of only five months. Second, this study only explored the correlation with Baidu Qianxi as a proxy to reliability, rather than field recordings of actual human movement.
Author Contributions
Conceptualization, Lingbo Liu, Shuming Bao and Weihe Wendy Guan; methodology, Hanchen Yu, Lingbo Liu and Xiaokang Fu; data curation, Ru Wang, Lingbo Liu and Hongqiang Liu; writing—original draft preparation, Lingbo Liu; writing—review and editing, Shuming Bao and Weihe Wendy Guan; supervision, Weihe Wendy Guan. All authors have read and agreed to the published version of the manuscript.
Funding
This work is partially sponsored by NSF award number 1841403, the China Data Institute, and the Future Data Lab.
Institutional Review Board Statement
Not applicable.
Informed Consent Statement
Not applicable.
Data Availability Statement
The Weibo Mobility index dataset from 2018-1 to 2021-7 generated by the methods in this article is published at the Harvard Dataverse (https://dataverse.harvard.edu/dataverse/weibomobilityindex, accessed on 15 February 2022).
Conflicts of Interest
The authors declare no conflict of interest.
References
- Belyi, A.; Bojic, I.; Sobolevsky, S.; Sitko, I.; Hawelka, B.; Rudikova, L.; Kurbatski, A.; Ratti, C. Global multi-layer network of human mobility. Int. J. Geogr. Inf. Sci. 2017, 31, 1381–1402. [Google Scholar] [CrossRef] [PubMed]
- Chen, B.Y.; Wang, Y.; Wang, D.; Li, Q.; Lam, W.H.K.; Shaw, S.-L. Understanding the Impacts of Human Mobility on Accessibility Using Massive Mobile Phone Tracking Data. Ann. Am. Assoc. Geogr. 2018, 108, 1115–1133. [Google Scholar] [CrossRef]
- Zhen, F.; Qin, X.; Ye, X.; Sun, H.; Luosang, Z. Analyzing urban development patterns based on the flow analysis method. Cities 2019, 86, 178–197. [Google Scholar] [CrossRef]
- Derudder, B.; Taylor, P.J. Central flow theory: Comparative connectivities in the world-city network. Reg. Stud. 2018, 52, 1029–1040. [Google Scholar] [CrossRef]
- Zhao, K.; Tarkoma, S.; Liu, S.; Vo, H. Urban human mobility data mining: An overview. In Proceedings of the 2016 IEEE International Conference on Big Data (Big Data), Washington, DC, USA, 5–8 December 2016; pp. 1911–1920. [Google Scholar]
- Wang, Y.; Taylor, J.E. Coupling sentiment and human mobility in natural disasters: A Twitter-based study of the 2014 South Napa Earthquake. Nat. Hazards 2018, 92, 907–925. [Google Scholar] [CrossRef]
- Rizwan, M.; Wan, W.; Cervantes, O.; Gwiazdzinski, L. Using Location-Based Social Media Data to Observe Check-In Behavior and Gender Difference: Bringing Weibo Data into Play. ISPRS Int. J. Geo-Inf. 2018, 7, 196. [Google Scholar] [CrossRef] [Green Version]
- Xia, T.; Yang, K.; Wan, W.; Feng, X.; Yu, X. Delineating Urban Functional Areas with Sina Weibo Check-in Data: A Matching Time Series Distance Based LST-SVM Multi-classifier Method. J. Comput. 2019, 30, 13. [Google Scholar]
- Huang, Q.; Wong, D.W.S. Modeling and Visualizing Regular Human Mobility Patterns with Uncertainty: An Example Using Twitter Data. Ann. Assoc. Am. Geogr. 2015, 105, 1179–1197. [Google Scholar] [CrossRef]
- Liu, X.; Derudder, B.; Wang, M. Polycentric urban development in China: A multi-scale analysis. Environ. Plan. B Urban Anal. City Sci. 2017, 45, 953–972. [Google Scholar] [CrossRef]
- Ghermandi, A.; Sinclair, M. Passive crowdsourcing of social media in environmental research: A systematic map. Glob. Environ. Change 2019, 55, 36–47. [Google Scholar] [CrossRef]
- Su, X.; Spierings, B.; Dijst, M.; Tong, Z. Analysing trends in the spatio-temporal behaviour patterns of mainland Chinese tourists and residents in Hong Kong based on Weibo data. Curr. Issues Tour. 2020, 23, 1542–1558. [Google Scholar] [CrossRef]
- Stock, K. Mining location from social media: A systematic review. Comput. Environ. Urban Syst. 2018, 71, 209–240. [Google Scholar] [CrossRef]
- CENTER, S.W.D. Weibo User Development Report 2020. Available online: https://data.weibo.com/report/reportDetail?id=456 (accessed on 8 January 2021).
- Baidu. Baidu Qianxi. Available online: https://qianxi.baidu.com/ (accessed on 8 January 2021).
- Fisman, R.; Lin, H.; Sun, C.; Wang, Y.; Zhao, D. What motivates non-democratic leadership: Evidence from COVID-19 reopenings in China. J. Public Econ. 2021, 196, 104389. [Google Scholar] [CrossRef]
- Jiang, Y.; Deng, S.; Li, H.; Liu, Y. Predicting user personality with social interactions in Weibo. Aslib J. Inf. Manag. 2021, 73, 839–864. [Google Scholar] [CrossRef]
- Wang, Y.; Wu, P.; Liu, X.; Li, S.; Zhu, T.; Zhao, N. Subjective Well-Being of Chinese Sina Weibo Users in Residential Lockdown During the COVID-19 Pandemic: Machine Learning Analysis. J. Med. Internet Res. 2020, 22, e24775. [Google Scholar] [CrossRef] [PubMed]
- Tandoc, E.C.; Eng, N. Climate Change Communication on Facebook, Twitter, Sina Weibo, and Other Social Media Platforms; Oxford University Press: Oxford, UK, 2017. [Google Scholar] [CrossRef]
- Wu, K.; Wu, J.; Ding, W.; Tang, R. Extracting disaster information based on Sina Weibo in China: A case study of the 2019 Typhoon Lekima. Int. J. Disaster Risk Reduct. 2021, 60, 102304. [Google Scholar] [CrossRef]
- Miao, R.; Wang, Y.; Li, S. Analyzing Urban Spatial Patterns and Functional Zones Using Sina Weibo POI Data: A Case Study of Beijing. Sustainability 2021, 13, 647. [Google Scholar] [CrossRef]
- Ye, C.; Zhang, F.; Mu, L.; Gao, Y.; Liu, Y. Urban function recognition by integrating social media and street-level imagery. Environ. Plan. B Urban Anal. City Sci. 2020, 48, 1430–1444. [Google Scholar] [CrossRef]
- Hu, Q.; Bai, G.; Wang, S.; Ai, M. Extraction and monitoring approach of dynamic urban commercial area using check-in data from Weibo. Sustain. Cities Soc. 2019, 45, 508–521. [Google Scholar] [CrossRef]
- Cai, J.; Huang, B.; Song, Y. Using multi-source geospatial big data to identify the structure of polycentric cities. Remote Sens. Environ. 2017, 202, 210–221. [Google Scholar] [CrossRef]
- Zhen, F.; Cao, Y.; Qin, X.; Wang, B. Delineation of an urban agglomeration boundary based on Sina Weibo microblog ‘check-in’ data: A case study of the Yangtze River Delta. Cities 2017, 60, 180–191. [Google Scholar] [CrossRef]
- Zhang, W.; Derudder, B.; Wang, J.; Shen, W.; Witlox, F. Using Location-Based Social Media to Chart the Patterns of People Moving between Cities: The Case of Weibo-Users in the Yangtze River Delta. J. Urban Technol. 2016, 23, 91–111. [Google Scholar] [CrossRef]
- Qiao, M.; Wang, Y.; Wu, S.; Fu, X.; Gu, Y.; Dou, M. A realistic and multilevel measurement of citywide spatial patterns of economic segregation based on human activities. Cities 2021, 110, 103067. [Google Scholar] [CrossRef]
- Wang, F.; Guo, M.; Guo, X.; Niu, F. Research on the Hierarchical Spatial Structure of the Urban Agglomeration of the Yellow River Ji-Shaped Bend. Complexity 2021, 2021, 2293524. [Google Scholar] [CrossRef]
- Wei, S.; Wang, L. Examining the population flow network in China and its implications for epidemic control based on Baidu migration data. Humanit. Soc. Sci. Commun. 2020, 7, 145. [Google Scholar] [CrossRef]
- Lu, D.; Xiao, W.; Xu, G.; Ha, L.; Yang, D. Spatiotemporal patterns and influencing factors of human migration networks in China during COVID-19. Geogr. Sustain. 2021, 2, 264–274. [Google Scholar] [CrossRef]
- Chen, Z.; Gong, Z.; Yang, S.; Ma, Q.; Kan, C. Impact of extreme weather events on urban human flow: A perspective from location-based service data. Comput. Environ. Urban Syst. 2020, 83, 101520. [Google Scholar] [CrossRef]
- Liu, L.; Hu, T.; Bao, S.; Wu, H.; Peng, Z.; Wang, R. The Spatiotemporal Interaction Effect of COVID-19 Transmission in the United States. ISPRS Int. J. Geo-Inf. 2021, 10, 387. [Google Scholar] [CrossRef]
- Peng, Z.; Wang, R.; Liu, L.; Wu, H. Exploring Urban Spatial Features of COVID-19 Transmission in Wuhan Based on Social Media Data. ISPRS Int. J. Geo-Inf. 2020, 9, 402. [Google Scholar] [CrossRef]
- Chai, Y. Weibo User Historical Geotagged Posts Dataset, 6th ed.; Harvard Dataverse: Cambridge, MA, USA, 2021. [Google Scholar] [CrossRef]
- Hu, T.; Guan, W.W.; Zhu, X.; Shao, Y.; Liu, L.; Du, J.; Liu, H.; Zhou, H.; Wang, J.; She, B.; et al. Building an Open Resources Repository for COVID-19 Research. Data Inf. Manag. 2020, 4, 130–147. [Google Scholar]
- Jurdak, R.; Zhao, K.; Liu, J.; AbouJaoude, M.; Cameron, M.; Newth, D. Understanding Human Mobility from Twitter. PLoS ONE 2015, 10, e0131469. [Google Scholar] [CrossRef]
- Spyratos, S.; Vespe, M.; Natale, F.; Weber, I.; Zagheni, E.; Rango, M. Quantifying international human mobility patterns using Facebook Network data. PLoS ONE 2019, 14, e0224134. [Google Scholar] [CrossRef] [Green Version]
- Yan, X.-Y.; Wang, W.-X.; Gao, Z.-Y.; Lai, Y.-C. Universal model of individual and population mobility on diverse spatial scales. Nat. Commun. 2017, 8, 1639. [Google Scholar] [CrossRef] [PubMed] [Green Version]
- Cui, Y.; Xie, X.; Liu, Y. Social media and mobility landscape: Uncovering spatial patterns of urban human mobility with multi source data. Front. Environ. Sci. Eng. 2018, 12, 7. [Google Scholar] [CrossRef] [Green Version]
- Noulas, A.; Scellato, S.; Lambiotte, R.; Pontil, M.; Mascolo, C. A Tale of Many Cities: Universal Patterns in Human Urban Mobility. PLoS ONE 2012, 7, e37027. [Google Scholar] [CrossRef]
- Sekara, V.; Stopczynski, A.; Lehmann, S. Fundamental structures of dynamic social networks. Proc. Natl. Acad. Sci. USA 2016, 113, 9977. [Google Scholar] [CrossRef] [PubMed] [Green Version]
- Bai, L.; Lu, H.; Hu, H.; Smith, M.K.; Harripersaud, K.; Lipkova, V.; Wen, Y.; Guo, X.; Peng, W.; Liu, C.; et al. Evaluation of work resumption strategies after COVID-19 reopening in the Chinese city of Shenzhen: A mathematical modeling study. Public Health 2021, 193, 17–22. [Google Scholar] [CrossRef]
- Ye, X.; Li, S.; Peng, Q. Measuring interaction among cities in China: A geographical awareness approach with social media data. Cities 2021, 109, 103041. [Google Scholar] [CrossRef]
- Terroso-Sáenz, F.; Muñoz, A. Nation-wide human mobility prediction based on graph neural networks. Appl. Intell. 2021, 1–17. [Google Scholar] [CrossRef]
Publisher’s Note: MDPI stays neutral with regard to jurisdictional claims in published maps and institutional affiliations. |
© 2022 by the authors. Licensee MDPI, Basel, Switzerland. This article is an open access article distributed under the terms and conditions of the Creative Commons Attribution (CC BY) license (https://creativecommons.org/licenses/by/4.0/).