Abstract
Data obtained through Volunteered Geographical Information (VGI) have gradually been used to monitor and support planning mainly in urban contexts. Regarding recreational activities in peri-urban green and natural areas, VGI has been used to map, measure use intensity, profile users, and evaluate their preferences and motivations. Given their extensive use, it is now worthwhile to assess the value of VGI data to (1) compare recreational uses, profile users and map recreational activities in different contexts (metropolitan vs. rural areas), and (2) evaluate outdoor and adventure tourist products such as Grand Routes (GR). Data from former GPSies (AllTrails nowadays), one of the most popular web-share services, were used to assess recreational uses in Lisbon Metropolitan Area (LMA) and southwest Portugal (SWPT). A set of 22,031 tracks of “on foot” and “on wheels” activities, submitted by 3297 national and foreign users, covering 12 years, was analysed within a GIS modelling environment. Results indicate that, although there are many more submissions in the LMA, the influence of foreigners in the SWPT is higher (11% vs. 19%). The existing GR in SWPT concentrates the foreign use for hiking (71% of foreign vs. 28% of national users), demonstrating its attractiveness. For the favourite activity in both areas—Mountain biking—results show a higher spatial dispersion, yet part of the activity in SWPT still conforms to the GR (16% of foreign and 20% of national use). This study proves other applications for VGI, showing its usefulness for assessing recreational uses in both metropolitan and rural areas. Spatial knowledge about recreational uses is a valuable tool to evaluate and monitor such activities, and to know what users like to do, and where, and is also useful information when designing recreational products considering their tourist potential, thus adding value to these offers.
1. Introduction
In recent decades, outdoor recreation and leisure activities have dramatically increased in green and natural areas, contributing to people’s quality of life, sense of place, and physical wellbeing [1,2,3,4,5]. Numerous indicators have shown the increase in the use of the territory as the favourite scenario for the practice of outdoor activities, whether they are carried out by the residents, the local population, or tourists. In this context, tracking people’s movements can provide useful information for improved sustainable management of outdoor activities [6]. Simultaneously, the emergence of high-speed internet and affordable mobile data, smartphones, and social media has changed the way people express their leisure habits, producing a myriad of new data on outdoor uses, behaviours, and preferences.
Outdoor mobility is currently a good source of user-generated geo-located information, known as Volunteered Geographical Information (VGI). VGI is a phenomenon first identified by Goodchild in 2007 that describes information with geographic content provided voluntarily by individuals [7]. VGI is closely connected with the availability of GPS enabled mobile devices and mobile data, at a relatively low cost, which allows people to interact directly and immediately with large communities that share common interests, namely through social media and web-share services. Therefore, thanks to these technological advances, mapping people’s behaviour during leisure time is now easier, making it possible to identify patterns of different activities across geographical and time dimensions.
Applications and web-share services such as GPSies (AllTrails nowadays), Wikiloc, Garmin Adventures, and Strava, among others, produce millions of tracks and track points of recreational activities made available to their public, either open or shared only among friends. Along with geotag data (i.e., lat/long coordinates), users also share secondary information about specific locations (e.g., type of terrain, level of difficulty, points of interest, etc.). Routes can then be downloaded, thus motivating followers to explore new destinations. However, this increased use of the land can produce negative (ecological) and positive (economic) impacts. Soil erosion and compaction, loss of biomass and biodiversity can occur within situations of intensive or informal/illegal use [8,9]. On the other hand, within well-structured recreational or tourism regions, significant economic benefits can be generated [10,11].
VGI data and Geographic Information Systems (GIS) analysis can be used to support land management policies in these territories, promoting local development while still meeting users’ expectations. Assessing how people use and perceive the territory through social media content is a novel way of studying these activities, allowing the identification of what attracts people, estimating trends, and using that information to help land managers provide better recreational spaces.
Although VGI relies on volunteer-generated data, it does not mean that it is of low quality. Many authors have studied the quality of citizen derived data for mapping [12,13,14,15,16,17,18,19], concluding that VGI is becoming a reliable source to validate and improve relevant spatial information [20]. In fact, while some sites require no expertise (e.g., disaster mapping sites like GEOCAN), others apply different levels of quality control (e.g., OpenStreetMap includes peer review). Furthermore, data quality is an issue when there are few instances, but with the advance of the era of big data, this becomes a less relevant constraint [15,21].
The mapping of leisure activities in natural and protected areas through VGI is increasing. Traditionally, this mapping process was produced through surveys or automatic counters, which could be costly, time-consuming, limited in coverage, and difficult to replicate regularly. With the popularization of social media and the huge amount of data provided through VGI, data collection in situ can now be complemented with VGI [6,19,22,23]. Although spread across several platforms according to trends, popularity, and users’ preferences, VGI has proved to be a good indicator to map most popular activities such as cycling [24,25], mountain biking [26,27], running, and walking [28,29]. VGI was also used to model spatial interactions between different users [6], to profile users according to difficulty criteria (distance, accumulate altimetry) or level of activity and efficiency of submitted tracks [30,31], and preferred landscapes from geotagged photos or tweets [32,33,34,35]. Other applications of VGI include testing management models using public participation GIS (PPGIS) mapping [36,37,38], supporting smart mobility planning [39,40,41] and tourist activities [42], examining the spatial variation of the socio-economic and land-use factors associated with bike activity [43] or modelling population distribution [44,45,46]. Other studies compare recreational uses in protected areas in two different countries [47] or the contents of distinct popular sharing sites for the same area [28,48,49], showing the broad amplitude of these datasets besides the bias and uproar inherent to volunteer data. Profiling users can include, among other things, their preferences, countries of origin [50], or seasonal routine [51,52]. A recent study also explored the use of VGI from web-share services to look back in time [53], showing that datasets collected today can also reflect past changes in trail use. This fact demonstrates its usefulness as historical datasets, which are particularly difficult to access in recreational ecological studies.
However, the use of these data has been limited mainly to the geographic analysis within the studied areas, and other important aspects for the management of recreational uses have been less explored [53]. An example is a comparison of outdoor activities in different contexts (e.g., urban vs. rural areas), exploring users’ displacement, or the evaluation of tourist products such as Grand Routes. These generally cover long distances within low-density regions and are difficult to evaluate, which is crucial, especially when designing new routes.
Given the high volume of data, as well as their application and importance—either to map use, profile users or perform temporal analysis—can VGI on recreational activities be used to produce more information? Can VGI serve to compare different territories or to evaluate structured tourist products such as Grand Routes (GR)? Based on this expectation, the aim of this work is: (1) to evaluate the relevance of VGI to monitor and compare recreational activities in a broader territorial context (metropolitan vs. rural); (2) to profile users according to their provenience; (3) to assess recreational spatial patterns from VGI data; and (4) to estimate the attractiveness of outdoor and adventure offers, such as Grand Routes, regarding recreational activities, thus assessing if VGI is a valid data source to evaluate and monitor these products. Furthermore, and since these data sources are traditionally used only at the local level, we intend to test their applicability at a regional level and see if they can be used to support policies for the development of tourist activities.
In the following sections, we first describe the two study areas that represent a metropolitan and a rural territory (Section 2.1), the geographic dataset compiled from VGI (Section 2.2), and the methodological design (Section 2.3). The results of the proposed methodology are presented (Section 3) and discussed (Section 4). The final section (Section 5) presents some concluding remarks about the usefulness of VGI for evaluating recreational activities in distinct territorial contexts, pointing out further research topics.
2. Materials and Methods
2.1. Study Areas
Two study areas were selected to evaluate the utility of VGI from recreational activities—the Lisbon Metropolitan Area (LMA), and the Southwest region of Portugal, which includes the Atlantic coastline of Alentejo and the Costa Vicentina in Algarve (SWPT) and the Grand Route Rota Vicentina (Figure 1). Booth areas are similar in extent—LMA is 3002 km2 and SWPT is 3699 km2—but very different regarding all other socio-economic indicators.
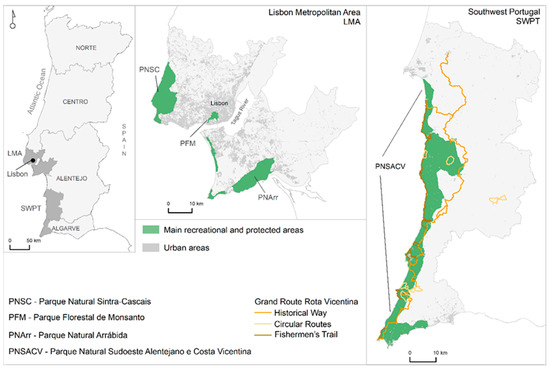
Figure 1.
The study areas in Portugal and the existing Grand Route—Rota Vicentina.
LMA is centred in the city of Lisbon, the capital of Portugal, which has 2,821,732 inhabitants [54]. It is divided into two different contexts, with the northern bank of Tagus River being more densely occupied compared to the southern bank. The Lisbon region has become one of the most desired destinations for short city breaks and represents 30% of the 20.7 M guests in the country in 2017, attracting 35% of the total foreign guests [55]. It holds two natural parks (Sintra-Cascais Natural Park—PNSC—and Arrábida Natural Park—PNArr) along with a large urban park (Monsanto Forest Park—PFM) and several green areas, with evidence of intense use regarding recreational activities [26]. Although there is a high demand for outdoor recreation, from both tourists and residents, there is no structured offering regarding recreational activities such as hiking and cycling routes that could work as a local or regional brand, such as in SWPT.
SWPT is a rural territory with few and small urban centres, and low population density, totalling 112,244 inhabitants [54]. Compared to LMA, regarding tourism indicators, the entire area of Alentejo (31,605 km2) holds 1 M guests (i.e., 5% of the total demand of Portugal in 2017 [56]. Tourism in SWPT still has a strong seasonal effect, unlike LMA. This study area includes the Southwest Alentejo and Costa Vicentina Natural Park (PNSACV), with a high diversity of landscapes, from elevated cliffs to pocket beaches, large agricultural areas and small urban centres that are popular destinations during the summer season. Like in other low-density regions, SWPT has less recreational use compared to LMA. However, it is crossed by a Grand Route known as Rota Vicentina, totalling approximately 450 km. This tourist product comprises the Historical Way (230 km of mainly rural trails inland designed for hikers and mountain bikers), the Fishermen’s Trail (125 km that follow traditional paths used by locals to access small beaches and fishing spots along the coastline, designed for hikers with only a small section suitable for Mountain biking) and, more recently, several Circular Routes.
2.2. Conceptual Framework
VGI about outdoor activities constitutes a unique data source for evaluating different territories and, through GIS analysis, to profile users and their preferences regarding recreational uses. Based on this premise, recreational volunteer data collected from a web-share service were used to profile users, including their preferences and spatial behaviour. The dataset was used: (1) to evaluate outdoor activities in two distinct territories, (2) to profile users regarding their provenience, (3) to map recreational use, and (4) to evaluate the attractiveness of an outdoor and adventure product like a Grand Route in a rural area. Six recreational activities are investigated: Hiking, Running, Walking, Cycling, Mountain biking and Racing bike. The proposed conceptual framework of this paper is presented in Figure 2.
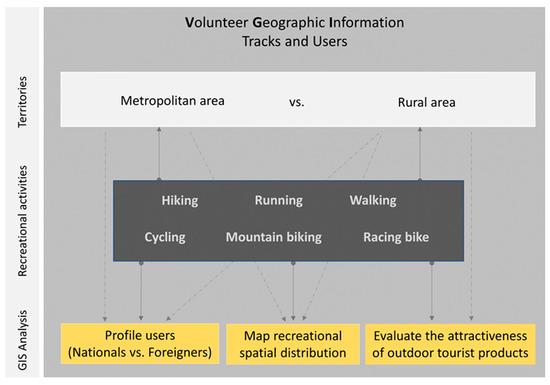
Figure 2.
Conceptual framework to evaluate recreational activities of a metropolitan and a rural area using VGI. Solid lines represent direct analysis and dashed lines represent secondary approaches produced from the dataset.
2.3. Geographical Data Collection
Data collection was performed in the former GPSies (presently Altrails), one of the oldest free web-share services (online since 2006), with recognized popularity among recreational users. The information submitted is free and easily accessible to anyone. Activities are grouped into six categories, of which “on foot” and “on wheel” activities represent 75% of the total submitted kilometres by users.
To use GPSies as a valid data source for this study, it was assumed that tracks submitted represent an indication of the spatial use of each activity and that there is a positive correlation between tracks existence and real use, as verified by [24,57] using Strava and manual and automated counting data.
A search was applied to virtually obtain all tracks submitted as suitable for Hiking, Walking, Running (“on foot”) and Cycling (i.e., Cyclotourism), Mountain biking and Racing bike (“on wheels”). For each activity, and study area, following a methodology proposed by [26], all available tracks (submitted from September 2006 to April 2018), were systematically downloaded in gpx and kml format.
All data were structured in a Geographical Information System (GIS). The datasets for each activity/study area were generated from both data formats:
- Gpx files were used to extract vector data and kml files (having information such as track name, username, track length and suitable activity) were used to retrieve metadata to populate the attributes table.
- Information regarding the submission date for each track, country of origin/residence for all identified users, and favourite activity was also retrieved from the web service and added to the final dataset.
- Although track length could be obtained from the primary data, it was re-calculated within a GIS environment to ensure the best accuracy of this indicator.
- To guarantee minimal disturbance among the volunteer data used in this study, only routes indicated as suitable for one activity, and with an identified user, were selected for the final datasets.
To comply with privacy issues, username served only as a primary key identifier and no other connections or relations were made.
Along with the VGI dataset, we also used the location of the Grand Route to test its usage by GPSies users. Rota Vicentina tracks in gpx format were retrieved from the official website (pt.rotavicentina.com accessed on 1 September 2018) and later converted to shapefiles.
2.4. Data Analyses
Following the framework identified in Figure 2, four analyses were conducted:
- Comparing outdoor activities in metropolitan vs. rural areas
- Each track submission date was used to produce a temporal evaluation of recreational uses in each study area.
- Profiling recreational users
- Users were profiled based on their provenience (nationals vs. foreigners) and preferences considering the two study areas. For each activity a track length analysis was performed to explore data average, homogeneity, and dispersion, all considered an indication of practitioners’ preferences. To avoid misinterpretations due to extreme values, either due to GPS or user errors, this analysis was only performed with the length of the track under Percentile 95, as proposed by [53].
- Mapping recreational spatial distribution.
- To map the recreational use, the spatial information associated with each dataset was analysed within a GIS environment. Line density [58] was applied to calculate the magnitude per unit area from each dataset that was within a 100 m radius around each 25 m cell grid. The result was a raster image where one can identify the favourites and most popular places for each activity, i.e., hot spots, and their general spatial distribution.
- Evaluating the attractiveness of outdoor and adventure products.
To evaluate the attractiveness of a tourist product, the GR Rota Vicentina, in SWPT, was selected. A compliance analysis was performed in a raster format by overlaying each dataset to a 100 m cell grid resulting in a file where each cell unit stands for the number of tracks that crossed it, following [27]. This resolution produced accurate results, and at the same time was large enough to accommodate positional errors that commonly go up to 10~30 m with handheld GPS and assisted GPS smartphones.
This process made it possible to assign a score value for each activity obtained by weighting the number of cells used per the number of tracks that cross it (Equation (1)). The methodology scored each activity independently from the others since it acknowledged the cells used by each activity as being part of the available recreational network for that activity in the study area.
where: i = number of tracks that crossed each cell; N = number of cells.
The same overlay was applied to Rota Vicentina to allow the same geographical reference. The compliance was then measured by subtracting the cells of Rota Vicentina from the original raster of each activity. The new score value was then compared with the original one, showing the GR attractiveness for each activity (Equation (2)). This was applied to the entire dataset as well as for both national and foreign users.
This proposed approach for testing the GR attractiveness is an adaptation of [27], which is often used to analyse spatial distribution of VGI tracks (data lines) [6,59]. Kernel density tools were not used at this stage as one needed a method that could measure the weight of the GR.
3. Results
3.1. Outdoor Activities in Metropolitan vs. Rural Areas
The dataset collected from GPSies (presently Altrails), for both study areas, included a total of 22,031 tracks submitted by 3297 identified users (Table 1), corresponding to a total of 1,578,017 Km.

Table 1.
The number of tracks and users retrieved from the two study areas on GPSies. * The total number of users does not reflect the sum of users for each activity since some users have submitted tracks for more than one of the six studied activities.
LMA has 19,217 tracks submitted by 2842 users (86% of the total users in the dataset). “On wheels” activities have more submissions than “on foot”. Activity ranking for the capital region is led by Mountain biking with 9407 tracks and closes with Walking, which has 693 tracks.
For SWPT the total number of tracks gathered was 2814, submitted by 798 different users (14% of the total users in the dataset). Among all activities, Mountain biking keeps first place regarding tracks submissions and Running falls to the last position.
Seasonality of tracks submission along the year shows different patterns when comparing national with foreign users (Figure 3). National users in LMA presented a more regular behaviour regarding tracks submission, reaching values from 1329, in August, to 1750, in January. For foreign users, submission peaks occur during spring and autumn (i.e., March to May and September to November). For the SWPT region, there are three submission peaks for both nationals and foreign users (late spring, mid summer, and early autumn).
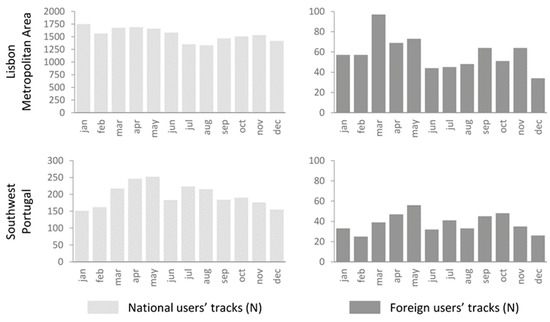
Figure 3.
Seasonality of tracks submitted by nationals and foreigners in GPSies, in Lisbon Metropolitan Area and Southwest Portugal.
3.2. Profiling Recreational Users
Regarding users’ nationalities, it was found that 87% are nationals, while 13% are foreigners. Table 2 summarizes the differences among study areas and activities according to users’ nationality. National users in LMA represent 89% of the total users of this region, and Mountain biking is their favourite activity. The proportion of foreign users for each activity ranges between 3% for Mountain biking and 18% for Cycling. For SWPT, the percentage of national users drops to 79%, and Mountain biking keeps first place regarding the number of practitioners. The percentage of foreign users increases in all activities, ranging from 6% in Mountain biking to 51% in Hiking.
Table 2.
The number of national and foreign users retrieved from the two study areas on GPSies. * The total number of users does not reflect the sum of users for each activity since some users have submitted tracks for more than one of the six studied activities.
Based on the tracks’ lengths, which were recalculated within the GIS project, each activity shows similar patterns for both study areas (Figure 4). Cycling and Racing bike show the higher length dispersion followed by Mountain biking. Detailed information is presented in Figure A1 and Figure A2 (Appendix A). “On foot” activities have also similar behaviours although Hiking in SWPT has larger dispersion and higher average length when compared to LMA. Running in SWPT has a higher average length, which falls outside of the 3rd quartile, contrary to what happens to all other activities in both study areas (Table 3).
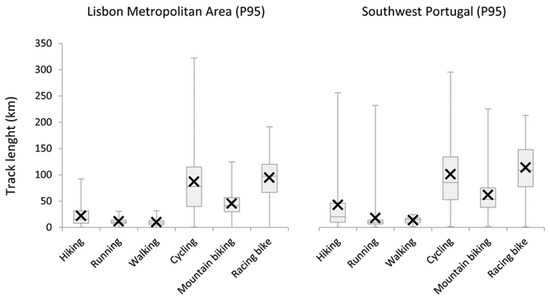
Figure 4.
Track length box plots for each activity, for percentile 95, within the study areas. Bars represent the second and third quartile and X stands for mean distances.
Table 3.
Descriptive statistics for the track length were retrieved from the two study areas on GPSies. * refers to the number of tracks, and all the other statistics refer to distance measured in Km.
An overview of users’ engagement by activities is presented in Table 4. Despite Mountain biking being the activity with more tracks and users in both study areas, looking at the average tracks per user regarding the total number of tracks that these identified users have submitted to GPSies, it does not stand out. Cycling and Racing bike are the activities that have more tracks per user, reaching an average of 50 and 40 tracks, respectively. Within this indicator, Mountain biking is in line with “on foot” activities being slightly below the total average of tracks submitted per user. Users that stated as a favourite activity one of the other 26 options available represent only 1.6% of the total users of this dataset and have submitted merely 1.1% of total tracks. Users that chose not to state their favourite activity in their page profile submitted on average only seven tracks per user.
Table 4.
Users’ engagement by activities in GPSies.
3.3. Mapping Recreational Spatial Distribution
The spatial distribution of all activities in the two study areas is presented in Figure 5 and Figure 6. In both study areas, distinct spatial patterns are shown in all activities. “On wheels” activities spread across each territory, whereas “on foot” activities showed a more concentrated pattern.
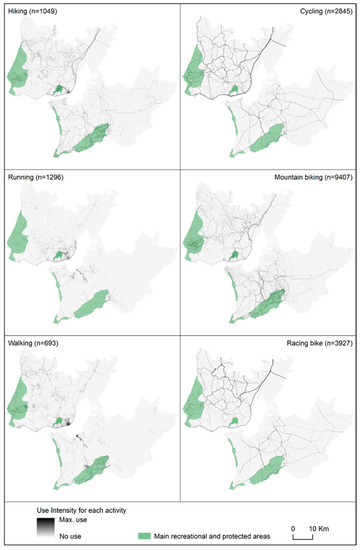
Figure 5.
Use intensity, produced from line density analysis of “on foot” and “on wheels” recreational activities within LMA.
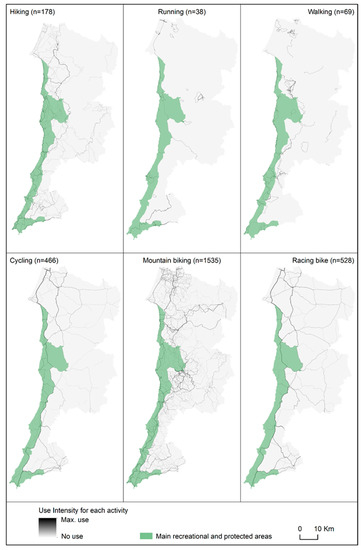
Figure 6.
Use intensity, produced from line density analysis of “on foot” and “on wheels” recreational activities within SWPT.
On LMA, Hiking and Mountain biking occur on off-road trails and paths and concentrate more on green areas such as the two natural parks (Sintra-Cascais and Arrábida Natural Parks) and the city’s major urban park (Monsanto Forest Park). Running occurs along the main urban “axes” and Walking is concentrated mainly within historical city centres, as can be seen in Lisbon and Sintra on the northern side of LMA, and within the heart of Arrábida Natural Park on the south side of this study area. Racing bike is concentrated more on main road “axes” while Cycling, although spreading all around LMA, does not use off-road, like with Mountain biking. Among all activities, the one that resembles the main road network the most, disregarding the regions’ highways, is Cycling.
Within SWPT, Hiking and Mountain biking still use more trails and off-roads than all other activities, with the second reaching virtually all study area roads, paths, and trails. Walking and Running, with fewer submissions, seem nevertheless to follow the coastal line, with the first one occurring also near the main urban centres as in LMA. Contrary to what happens with Cycling and Racing bike in LMA, in SWPT Cycling concentrates more on the coast and Racing bike spreads also to the inland of the study area, following the main road “axes” of the region.
3.4. Evaluating the Attractiveness of Outdoor and Adventure Products
Results of the compliance analysis between recreational activities and the GR Rota Vicentina, in the SWPT, are presented in Table 5 and Figure 7. As already depicted in Figure 6, Hiking and Walking have greater adherence to GR Rota Vicentina, with values of 45% and 51%, respectively, when the entire activity dataset for SWPT is used. These scores drop to lower values for “on wheels” activities, although it still reaches 19% for Mountain biking. Running tracks are too few to corroborate the compliance result.
Table 5.
Conformity of activities in the SWPT with the Grand Route Rota Vicentina measured by score use (number of pixels weighted by the number of tracks that crosses each spatial unit).
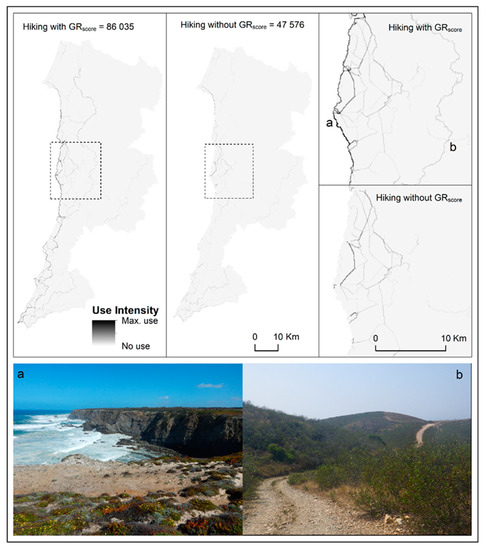
Figure 7.
Track compliance with Grand Routes in SWPT. Details are presented for the most popular segments of Rota Vicentina: (a) Fisherman’s trail “Almograve » Zambujeira do Mar”; (b) Historical way “Odemira » S. Teotónio”.
Compliance results on the use of GR when comparing national vs. foreign users of GPSies in SWPT show higher scores for foreigners within all activities, reaching 71% on Hiking and 52% on Walking. The two exceptions are Mountain biking and Running, which hold the highest and lowest numbers of tracks in the dataset, respectively.
4. Discussion
4.1. VGI to Evaluate Recreational Uses in Different Contexts
As expected, the number of tracks submitted in LMA is much higher than in SWPT (19,217 vs. 2814). This fact is explained by the demographic context: the residents in the rural area represent only 4% of the total number of residents in the metropolitan area. Nevertheless, the number of tracks retrieved for SWPT is 15% of those of the Lisbon area. There are two possible explanations for this fact: SWPT users could be more committed to using GPSies, and/or what could be a more reasonable explanation—this region is a tourism destination for both nationals and foreigners.
Mountain biking is the most representative activity in both study areas, with 50% (10,942) of the tracks gathered from GPSies, followed by other cyclists; “On foot” activities are much less represented, with only 15% of tracks. These differences between “on wheels” and “on foot” can be explained by the fact that GPSies was one of the first popular applications among mountain bikers in Portugal, replacing the blogs and discussion forums that were previously used to share and discuss common interests. The popularity of GPSies was also due to its availability in the form of a Web GIS platform, with editing tools and high-resolution imagery, which favoured the positive spread by word-of-mouth within a community of highly engaged bikers. Mountain biking was also, at the same time, one of the recreational activities with the greatest expression and popularity, following trends of healthy lifestyles common to other outdoor activities within the “return to nature” trends [60,61,62].
Hiking and Walking are also popular activities, but making regular records of progress achievements, including real-time stats, average speed, distance, or total climb, is less relevant compared to cyclists. Therefore, sharing tracks was not as common as with more sporty activities. Smartwatches and fitness trackers have changed this situation over the last few years. Regarding Running and Trail running, two more recent phenomena in Portugal [63], keeping personal records is mandatory, but platforms such as Strava (launched in 2009) are more popular.
As expected, most GPSies users are nationals. However, the percentage of foreigners in the SWPT almost doubles the number of users in the Lisbon region (21% vs. 11%). Although Lisbon is recognized as a more touristic destination, the absence of a proper tourist product organized around outdoor activities leads to less use among foreign visitors. On the contrary, the presence of a GR, which can take up to 2 weeks to complete over its long-distance, attracts a higher percentage of recreational tourists to SWPT. These results are in line with those presented in [50], which found that 38% of “on foot” GPSies users for Madeira Island (the third Portuguese tourist destination) were also foreigners.
Track length for each activity confirmed that “on wheels” activities cover larger distances on average than “on foot” activities, thus validating these data and data sources. In LMA, average rides for Mountain bikers take half a day, with distances of around 45 km (in line with values found for PNSC and PNArr [25,26,48]. Cyclists and Racing bikers present similar results in terms of distances covered on their rides, but the first group has a higher percentage of long distances compared to all the others. This could be related to the fact that Cyclists spend more time, and ride in a contemplative mood, taking over a day’s ride to cover wider distances. Racing bikers ride half a day like Mountain bikers, but at higher average speeds, which requires better quality asphalt roads.
In SWPT, all activities have higher average lengths, which can be attributed to the fact that this is a tourism destination—i.e., visitors on holidays have more available time for leisure activities. With fewer submissions in SWPT, no major conclusions should be drawn for Walking and Running. Nevertheless, one can assess that Walking is mainly carried out by residents—in comparison with all other activities, both in LMA and also in SWPT.
Previous recreational studies in tempered regions, such as Portugal, have shown that outdoor activities follow yearly patterns with two peaks [27,51], with higher uses during the spring and autumn seasons. This pattern was verified among Mountain bikers in PNArr using automatic counters [27] and among Geocachers also in PNArr [64]. This happens to foreigners’ tracks submitted in both study areas, but with national submissions, it is less evident in LMA. The reason for this might rely on the fact that national users (mainly from “on wheels” activities) are more motivated, gadget engaged, and more regular practitioners. For SWPT, a third peak occurs in July and August, confirming that this study area is a summer destination.
The spatial distribution of each activity in LMA and SWPT, presented in Figure 5 and Figure 6, validates once more these web-share services as data sources for recreational uses. Mountain biking, designed to be used mainly off-road, makes full use of dirt trails and paths. Being practised mainly by residents, the main pavement streets of both study areas are still used, but only to get to final destinations. This can be seen in LMA, where PFM, PNSC, and PNArr concentrate higher use for this activity. For Cyclists, while they concentrate more on asphalted roads, “off-road” paths are also used, as can be seen in SWPT, along some tourist coastline trails of Rota Vicentina. In order to cover larger distances on good asphalt roads, Racing bikers tend to avoid urban centres, with a similar behaviour between big urban centres and rural areas.
Regarding the three “on foot” activities, they also have distinct objectives and occur in different contexts. Hiking usually occurs in natural environments and natural trails, while Walking occurs more in urban contexts. Hiking, as with other outdoor activities, promotes nature contact and a sense of well-being [65,66]. Walking has recently become a way of overcoming a sedentary lifestyle and those who walk for fitness do it regularly. Consequently, walkers walk near home, from urban areas to suburbs, city parks or roads. A detail that can produce a high impact on data analysis is the definition of hiking and walking in Portuguese, since both words can be used as synonyms. It is common to say that a visit on foot to a natural area is a walk, while in other languages this would be considered a hike. This can explain why Walking occurs in PNArr, in LMA.
As expressed, runners and trail runners are keener to use other App or services. Although the number of running tracks retrieved from GPSies is almost 1300 in LMA, the authors foresee that the spatial distribution of the activity is underrepresented in both study areas. As can be seen in the Strava heat map [67], running occurs within urban areas, while “on wheels” spreads outside these areas. Considering the low number of GPSies users that state that running is their favourite activity, it is natural to conclude that the spatial distribution of running in these datasets does not represent the most committed practitioners.
4.2. Assessing the Attractiveness of Outdoor and Adventure Products
Several authors have pointed out that recreational activities generally occur around users’ residence areas or regions, according to the territorial potential and social trends [32,63,68,69]. All results of this study support these findings and provide a valid indication to explain the higher proportion of foreigners that use the GR (71% for hikers), compared with nationals. Although Rota Vicentina trails are still available for local users, linear routes (as it happens with most Rota Vicentina sections) are less attractive for residents. For a local user, to hike a linear section of 18 km (up to 4 walking hours) requires the availability to get back (either time and fitness or a lift back). Tourists, on the other hand, have more available time and the aim is to hike longer distances. GRs are mainly designed to attract visitors and tourists, and it is not uncommon for guest houses or local operators to organize services of carrying luggage or providing food and snacks along the trails. Such services are not generally used by locals. Nevertheless, there is a strong adherence to the Rota Vicentina territory, i.e., the coastal area that goes from the Historical way up to the coastline, for all activities.
As in other studies [33], even with small datasets, as is the case of Hiking and Walking in SWPT, relevant information can still be retrieved from VGI data to support monitoring actions, land management policies and decision making, even in areas with sparse data coverage. In this study, from the 178 tracks submitted by hikers in SWPT, it was possible to observe where hiking occurs in the region, thus providing important information about this recreational activity. With larger datasets, other details can be depicted, as was demonstrated in LMA.
Despite the limitations of this type of analysis inherent to the very nature of VGI, it can be concluded that properly structured recreational products (such as the Rota Vicentina) contribute to the tourist attractiveness of peripheral territories, promoting local development and creating alternatives to the seasonality of classic tourist products such as Sun and Beach.
5. Conclusions
This study aimed to test the potential of VGI data regarding recreational activities in urban and rural areas and evaluate the attractiveness of outdoor and adventure offers such as Grand Routes. The results show that it is possible to do this with volunteer data uploaded by users to web-share services, outdoor/sports apps, and social media. These data sets are always a sample of a larger population. As with other digital and social media apps and platforms, VGI follows fashions and trends [19] and sometimes can be biased depending on different motivations or behaviours. Nevertheless, this virtual expression of outdoor recreational use is extremely large, both concerning intensive sports (e.g., trail running) and soft leisure activities (e.g., light hiking). On the other hand, visitor surveys involving interviews with users on site have demonstrated the wide use of these apps for recreational outdoor activities [50,59] and other studies also show a positive correlation between tracks and actual users [19,24,57]. Therefore, it is reasonable to assume that these data sources are a reliable representation of the spatial use of outdoor activities.
Services like GPSies (presently Altrails) or Strava, among many others, are part of the current lifestyle, enabling popular activities such as Hiking, Running, Trail Running, Walking, Cycling, Mountain biking and Racing bike, to be monitored in different contexts. The findings show that recreational activities in a metropolitan area and a rural coastal area have similarities and variances that can be explained by territorial context, users’ profiles, and activity characteristics.
In both regions, “on foot” activities tend to happen close to users’ residences (main urban areas), while trails and roads used in all studied activities occur in the same pavements and road types. Differences are generally related to the tracks’ length, being slightly longer in SWPT (the rural coastal area) compared to LMA. This may be because the southern study area is a tourist destination for both national and foreign visitors, usually with more available time for outdoor activities. The seasonality of submission of tracks to GPSies (i.e., recreational activities) supports this hypothesis.
VGI collected for this study had Mountain biking as the most representative activity, as in other studies that used this data source in Portugal [6,26,27,68]. Looking into users’ engagement and the percentage of foreigners found in this dataset, it is expected that Cycling and Racing bike stand out within this web-share service. GPSies (presently Altrails) is a service that was created to share “tracks for vagabonds”, a mood more suitable for cyclists and long-distance hikers.
The methodology proved to be adequate, namely the use of line-density analysis which was quite efficient at regional levels and with the amount of data used (with a total of 22,031 tracks submitted by 3297 identified users, corresponding to 1,578,017 km). Furthermore, while heatmaps (such as Strava heatmap) are very useful tools to identify patterns of use, they present a “smooth” observation of the territory, and local/or fewer common uses are left out of the map. Moreover, heatmaps are based on track points, losing all vector attributes of the tracks and disregarding users’ profiles. For example, many track points can indicate places where people walk/ride slower and not more users. Also, activities are grouped into few categories (riding, run, on water, winter activities), losing the richness of the original data. The approach proposed by the authors goes a step forward and takes into consideration all public dimensions when analysing recreational activities.
VGI data proved to be a valid contribution to monitor and evaluate recreational uses within the territory, being able to produce good indicators to support land management policies and decision making. Given that the data is 100% volunteer, the limitations of these analyses should be acknowledged. VGI does not replace surveys, field counts and other traditional methods. Nevertheless, it can and should be used as a complementary data source [41,70,71,72] due to its large volume, fast processing—raw data from recreational uses is already in geospatial format—and having the advantage of being provided by those directly involved in these activities. Spatial knowledge about recreational activities could be a valuable tool to evaluate and monitor such activities giving important clues on where to collect surveys or install counters, for example. Knowing what the users like to do could also be used to design recreational products considering their tourist potential—adding value to these outdoor and adventure products.
Regarding future work on recreational activities and VGI, there are still dimensions of these datasets that can be further explored. For example, mobility of recreational users, with special attention to privacy issues, could be investigated with free access data from platforms where users identify themselves, and tracks or POIs are freely available. Nowadays, most popular apps make data available through API. However, some apps, not only due to privacy issues but also due to their business model, only release processed data, limiting this type of analysis.
Nevertheless, in the modern world, it is fair to acknowledge that VGI from recreational activities can provide a virtual expression of the territories.
Author Contributions
Conceptualization, Teresa Santos and Ricardo Nogueira Mendes; Data curation, Teresa Santos and Ricardo Nogueira Mendes; Formal analysis, Teresa Santos and Ricardo Nogueira Mendes; Funding acquisition, Rui Pedro Julião and Carlos Pereira da Silva; Investigation, Ricardo Nogueira Mendes; Methodology, Teresa Santos and Ricardo Nogueira Mendes; Software, Carlos Pereira da Silva; Supervision, Estela I. Farías-Torbidoni and Carlos Pereira da Silva; Validation, Teresa Santos and Estela I. Farías-Torbidoni; Visualization, Ricardo Nogueira Mendes; Writing—original draft, Teresa Santos and Ricardo Nogueira Mendes; Writing—review & editing, Estela I. Farías-Torbidoni and Rui Pedro Julião. All authors have read and agreed to the published version of the manuscript.
Funding
This work was financed by national funds through FCT-Foundation for Science and Technology, I.P., within the scope of the project “UIDB/04647/2020” of CICS.NOVA-Centro Interdisciplinar de Ciências Sociais da Universidade NOVA de Lisboa. The first author was financed by national funds through the FCT, under the Norma Transitória-DL 57/2016/CP1453/CT0004. The work was also supported by the National Institute of Physical Education of Catalonia (INEFC).
Institutional Review Board Statement
Not applicable.
Informed Consent Statement
Not applicable.
Conflicts of Interest
The authors declare no conflict of interest.
Appendix A
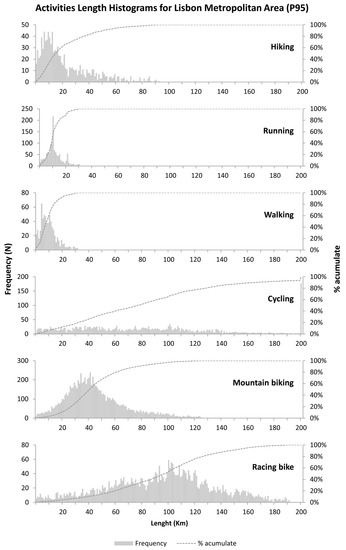
Figure A1.
Histogram of track length of each activity for percentile 95 within the LMA.
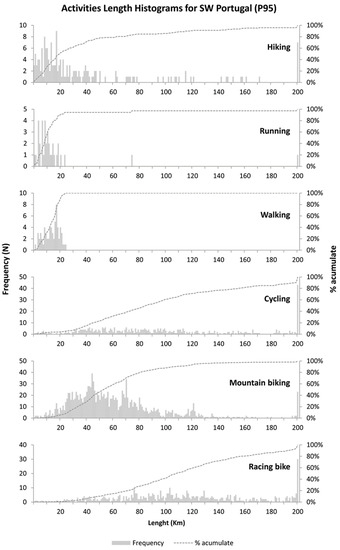
Figure A2.
Histogram of track length of each activity for percentile 95 within the SWPT.
References
- Li, C.-L. Quality of Life: The perspective of urban park recreation in three Asian cities. J. Outdoor Recreat. Tour. 2020, 29, 100260. [Google Scholar] [CrossRef]
- Chu, Y.-T.; Li, D.; Chang, P.-J. Effects of urban park quality, environmental perception, and leisure activity on well-being among the older population. Int. J. Environ. Res. Public Health 2021, 18, 11402. [Google Scholar] [CrossRef] [PubMed]
- Fagerholm, N.; Torralba, M.; Moreno, G.; Girardello, M.; Herzog, F.; Aviron, S.; Burgess, P.; Crous-Duran, J.; Ferreiro-Domínguez, N.; Graves, A.; et al. Cross-Site Analysis of Perceived Ecosystem Service Benefits in Multifunctional Landscapes. Glob. Environ. Change 2019, 56, 134–147. [Google Scholar] [CrossRef] [Green Version]
- Kondo, M.C.; Fluehr, J.M.; McKeon, T.; Branas, C.C. Urban green space and its impact on human health. Int. J. Environ. Res. Public Health 2018, 15, 445. [Google Scholar] [CrossRef] [Green Version]
- Pietrzyk-Kaszyńska, A.; Czepkiewicz, M.; Kronenberg, J. Eliciting non-monetary values of formal and informal urban green spaces using public participation GIS. Landsc. Urban Plan. 2017, 160, 85–95. [Google Scholar] [CrossRef]
- Santos, T.; Nogueira Mendes, R.; Vasco, A. Recreational activities in urban parks: Spatial interactions among users. J. Outdoor Recreat. Tour. 2016, 15, 1–9. [Google Scholar] [CrossRef]
- Goodchild, M.F. Citizens as Sensors: The world of volunteered geography. GeoJournal 2007, 69, 211–221. [Google Scholar] [CrossRef] [Green Version]
- Barros, A.; Gonnet, J.; Pickering, C. Impacts of informal trails on vegetation and soils in the highest protected area in the southern hemisphere. J. Environ. Manage 2013, 127, 50–60. [Google Scholar] [CrossRef]
- Leung, Y.-F.; Newburger, T.; Jones, M.; Kuhn, B.; Woiderski, B. Developing a monitoring protocol for visitor-created informal trails in Yosemite National Park, USA. Environ. Manag. 2011, 47, 93–106. [Google Scholar] [CrossRef]
- Wood, S.A.; Guerry, A.D.; Silver, J.M.; Lacayo, M. Using social media to quantify nature-based tourism and recreation. Sci. Rep. 2013, 3, 2976. [Google Scholar] [CrossRef]
- Raya, J.M.; Martínez-Garcia, E.; Celma, D. Economic and social yield of investing in hiking tourism: The case of Berguedà, Spain. J. Travel Tour. Mark. 2018, 35, 148–161. [Google Scholar] [CrossRef]
- Flanagin, A.J.; Metzger, M.J. The credibility of volunteered geographic information. GeoJournal 2008, 72, 137–148. [Google Scholar] [CrossRef]
- Fonte, C.C.; Antoniou, V.; Bastin, L.; Estima, J.; Arsanjani, J.J.; Bayas, J.-C.L.; See, L.; Vatseva, R. Assessing VGI Data Quality. Ubiquity Press 2017, 137–163. [Google Scholar] [CrossRef] [Green Version]
- Foody, G.; See, L.; Fritz, S.; Moorthy, I.; Perger, C.; Schill, C.; Boyd, D.; Foody, G.; See, L.; Fritz, S.; et al. Increasing the accuracy of crowdsourced information on land cover via a voting procedure weighted by information inferred from the contributed data. ISPRS Int. J. Geo-Inf. 2018, 7, 80. [Google Scholar] [CrossRef] [Green Version]
- Goodchild, M.F.; Li, L. Assuring the quality of volunteered geographic information. Spat. Stat. 2012, 1, 110–120. [Google Scholar] [CrossRef]
- Haklay, M. How good is volunteered geographical information? A comparative study of OpenStreetMap and ordnance survey datasets. Environ. Plan. B Plan. Des. 2010, 37, 682–703. [Google Scholar] [CrossRef] [Green Version]
- Fan, H.; Zipf, A.; Fu, Q.; Neis, P. Quality assessment for building footprints data on OpenStreetMap. Int. J. Geogr. Inf. Sci. 2014, 28, 700–719. [Google Scholar] [CrossRef]
- Dorn, H.; Törnros, T.; Zipf, A.; Dorn, H.; Törnros, T.; Zipf, A. Quality Evaluation of VGI using authoritative data—A comparison with land use data in southern Germany. ISPRS Int. J. Geo-Inf. 2015, 4, 1657–1671. [Google Scholar] [CrossRef]
- Heikinheimo, V.; Minin, E.D.; Tenkanen, H.; Hausmann, A.; Erkkonen, J.; Toivonen, T. User-Generated geographic information for visitor monitoring in a national park: A comparison of social media data and visitor survey. ISPRS Int. J. Geo-Inf. 2017, 6, 85. [Google Scholar] [CrossRef] [Green Version]
- See, L.; Fritz, S.; Perger, C.; Schill, C.; McCallum, I.; Schepaschenko, D.; Duerauer, M.; Sturn, T.; Karner, M.; Kraxner, F.; et al. Harnessing the power of volunteers, the internet and google earth to collect and validate global spatial information using Geo-Wiki. Technol. Forecast. Soc. Chang. 2015, 98, 324–335. [Google Scholar] [CrossRef] [Green Version]
- Goodchild, M.F.; Glennon, J.A. Crowdsourcing geographic information for disaster response: A research frontier. Int. J. Digit. Earth 2010, 3, 231–241. [Google Scholar] [CrossRef]
- Langley, S.A.; Messina, J.P.; Moore, N. Using meta-quality to assess the utility of volunteered geographic information for science. Int. J. Health Geogr. 2017, 16, 1–11. [Google Scholar] [CrossRef] [PubMed] [Green Version]
- Minghini, M.; Antoniou, V.; Fonte, C.C.; Estima, J.; Olteanu-Raimond, A.-M.; See, L.; Laakso, M.; Skopeliti, A.; Mooney, P.; Arsanjani, J.J.; et al. The Relevance of Protocols for VGI Collection; Ubiquity Press: London, UK, 2017. [Google Scholar] [CrossRef] [Green Version]
- Jestico, B.; Nelson, T.; Winters, M. Mapping ridership using crowdsourced cycling data. J. Transp. Geogr. 2016, 52, 90–97. [Google Scholar] [CrossRef] [Green Version]
- McArthur, D.P.; Hong, J. Visualising where commuting cyclists travel using crowdsourced data. J. Transp. Geogr. 2019, 74, 233–241. [Google Scholar] [CrossRef]
- Nogueira Mendes, R.; Dias, P.; Pereira da Silva, C. Profiling MTB Users’ Preferences within Protected Areas through Webshare Services. In Proceedings of the 7th International Conference on Monitoring and Management of Visitors in Recreational and Protected Areas, Local Community Outdoor Recreat, Tallinn, Estonia, 20–23 August 2014; pp. 166–168. [Google Scholar]
- Nogueira Mendes, R.M.; Silva, A.; Grilo, C.; Rosalino, L.M.; da Silva, C.P. MTB Monitoring in Arrábida Natural Park, Portugal. In Proceedings of the 6th International Conference on Monitoring and Management of Visitors in Recreational and Protected Areas, Stockholm, Sweden, 21–24 August 2012; pp. 32–33. [Google Scholar]
- Norman, P.; Pickering, C.M. Using volunteered geographic information to assess park visitation: Comparing three on-line platforms. Appl. Geogr. 2017, 89, 163–172. [Google Scholar] [CrossRef]
- Hochmair, H.H.; Bardin, E.; Ahmouda, A. Estimating bicycle trip volume for miami-dade county from strava tracking data. J. Transp. Geogr. 2019, 75, 58–69. [Google Scholar] [CrossRef]
- Àvila Callau, A.; Pérez-Albert, Y.; Serrano Giné, D. Quality of GNSS traces from VGI: A data cleaning method based on activity type and user experience. ISPRS Int. J. Geo-Inf. 2020, 9, 727. [Google Scholar] [CrossRef]
- Bizarro, S.; Nogueira Mendes, R.M.; Santos, T.; Julião, R.P. Multicriteria analysis a proposal of revitalization of the ancestral trails of the Serra da Estrela natural park (PNSE). In Proceedings of the 9th International Conference on Monitoring and Management of Visitors in Recreational and Protected Areas, Bordeaux, France, 28–31 August 2018; Dehez, J., Lambert, G., Ginelli, L., hadj Abdallah, K.B., Eds.; Bordeaux Sciences Agro: Bordeaux, France, 2018; pp. 144–146, ISBN 978-2-9551251-1-3. [Google Scholar]
- Paracchini, M.L.; Zulian, G.; Kopperoinen, L.; Maes, J.; Schägner, J.P.; Termansen, M.; Zandersen, M.; Perez-Soba, M.; Scholefield, P.A.; Bidoglio, G. Mapping cultural ecosystem services: A framework to assess the potential for outdoor recreation across the EU. Ecol. Indic. 2014, 45, 371–385. [Google Scholar] [CrossRef] [Green Version]
- Walden-Schreiner, C.; Rossi, S.D.; Barros, A.; Pickering, C.; Leung, Y.-F. Using crowd-sourced photos to assess seasonal patterns of visitor use in mountain-protected areas. Ambio 2018, 47, 781–793. [Google Scholar] [CrossRef]
- Teles da Mota, V.; Pickering, C. Assessing the popularity of urban beaches using metadata from social media images as a rapid tool for coastal management. Ocean. Coast. Manag. 2021, 203, 105519. [Google Scholar] [CrossRef]
- Teles da Mota, V.; Pickering, C. Geography of Discourse about a European Natural Park: Insights from a Multilingual Analysis of Tweets. Soc. Nat. Resour. 2021, 34, 1492–1509. [Google Scholar] [CrossRef]
- Brown, G.; Sanders, S.; Reed, P. Using public participatory mapping to inform general land use planning and zoning. Landsc. Urban Plan. 2018, 177, 64–74. [Google Scholar] [CrossRef]
- Wolf, I.D.; Brown, G.; Wohlfart, T. Applying public participation GIS (PPGIS) to inform and manage visitor conflict along multi-use trails. J. Sustain. Tour. 2018, 26, 470–495. [Google Scholar] [CrossRef]
- Wolf, I.D.; Wohlfart, T.; Brown, G.; Bartolomé Lasa, A. The use of public participation GIS (PPGIS) for park visitor management: A case study of mountain biking. Tour. Manag. 2015, 51, 112–130. [Google Scholar] [CrossRef]
- Selala, M.K.; Musakwa, W. The potential of strava data to contribute in non-motorised transport (Nmt) planning in johannesburg. ISPRS Arch. 2016, XLI-B2, 587–594. [Google Scholar] [CrossRef]
- Sun, Y.; Du, Y.; Wang, Y.; Zhuang, L. Examining associations of environmental characteristics with recreational cycling behaviour by street-level strava data. Int. J. Environ. Res. Public Health 2017, 14, 644. [Google Scholar] [CrossRef] [Green Version]
- Oksanen, J.; Bergman, C.; Sainio, J.; Westerholm, J. Methods for deriving and calibrating privacy-preserving heat maps from mobile sports tracking application data. J. Transp. Geogr. 2015, 48, 135–144. [Google Scholar] [CrossRef] [Green Version]
- Balletto, G.; Milesi, A.; Ladu, M.; Borruso, G. A Dashboard for Supporting slow tourism in green infrastructures. a methodological proposal in Sardinia (Italy). Sustainability 2020, 12, 3579. [Google Scholar] [CrossRef]
- Munira, S.; Sener, I.N. A Geographically weighted regression model to examine the spatial variation of the socioeconomic and land-use factors associated with strava bike activity in Austin, Texas. J. Transp. Geogr. 2020, 88, 102865. [Google Scholar] [CrossRef]
- Aubrecht, C.; Aubrecht, D.Ö.; Ungar, J.; Freire, S.; Steinnocher, K. VGDI–Advancing the concept: Volunteered Geo-Dynamic information and its benefits for population dynamics modeling. Trans. GIS 2017, 21, 253–276. [Google Scholar] [CrossRef]
- Bakillah, M.; Liang, S.; Mobasheri, A.; Arsanjani, J.J.; Zipf, A. Fine-Resolution population mapping using Openstreetmap points-of-interest. Int. J. Geogr. Inf. Sci. 2014, 28, 1940–1963. [Google Scholar] [CrossRef]
- Patel, N.N.; Stevens, F.R.; Huang, Z.; Gaughan, A.E.; Elyazar, I.; Tatem, A.J. Improving large area population mapping using Geotweet densities. Trans. GIS 2017, 21, 317–331. [Google Scholar] [CrossRef] [PubMed]
- Monteiro, L.; da Silva, C.P.; Nogueira Mendes, R.; Vitek, O. Monitorização de Actividades Recreativas Em Áreas Protegidas Com Recurso a Serviços de Partilha On-Line: Estudo Comparativo Entre Portugal e a República Checa. In Proceedings of the X Congresso da Geografia Portuguesa, Lisboa, Portugal, 9–12 September 2015; pp. 615–620. [Google Scholar]
- Campelo, M.B. Caracterização do BTT no Parque Natural de Sintra-Cascais: Um Contributo Para a Revisão da Carta de Desporto de Natureza do PNSC. Master’s Thesis, Lisbon University, Lisbon, Portugal, 2015. [Google Scholar]
- Levin, N.; Lechner, A.M.; Brown, G. An evaluation of crowdsourced information for assessing the visitation and perceived importance of protected areas. Appl. Geogr. 2017, 79, 115–126. [Google Scholar] [CrossRef] [Green Version]
- Roque, B.F.; Nogueira Mendes, R.; Magalhães, M.F.; Pereira da Silva, C. Monitoring walkers and hikers of madeira island through web-share services. In Proceedings of the 9th International Conference on Monitoring and Management of Visitors in Recreational and Protected Areas: Recreation, Place and Local Development, Bordeaux, France, 28–31 August 2018; Dehez, J., Lambert, G., Ginelli, L., hadj Abdallah, K.B., Eds.; Bordeaux Sciences Agro: Bordeaux, France, 2018; pp. 77–79, ISBN 978-2-9551251-1-3. [Google Scholar]
- Santos, T.; Nogueira Mendes, R.M. Exploração de Usos Turísticos Na Área Metropolitana de Lisboa a Partir de Informação Geográfica Voluntária. In Proceedings of the 25th APDR Congress, Lisbon, Portugal, 5–6 July 2018; pp. 511–516. [Google Scholar]
- Ladle, A.; Galpern, P.; Doyle-Baker, P. Measuring the use of green space with urban resource selection functions: An application using smartphone GPS locations. Landsc. Urban Plan. 2018, 179, 107–115. [Google Scholar] [CrossRef]
- Nogueira Mendes, R.; Pereira da Silva, C. Looking back at recreational activities in protected areas using vgi from web-share services. In Proceedings of the 9th International Conference on Monitoring and Management of Visitors in Recreational and Protected Areas (MMV9), Bordeaux, France, 28–31 August 2018; Dehez, J., Lambert, G., Ginelli, L., hadj Abdallah, K.B., Eds.; Bordeaux Sciences Agro: Bordeaux, France, 2018; pp. 140–142, ISBN 978-2-9551251-1-3. [Google Scholar]
- Instituto Nacional de Estatistica, Censos. 2011. Available online: http://censos.ine.pt/xportal/xmain?xpgid=censos2011_apresentacao&xpid=CENSOS (accessed on 8 November 2018).
- Instituto Nacional de Estatística—Estatísticas do Turismo: 2017. Lisboa: INE. 2018. ISSN 0377-2306. ISBN 978-989-25-0447-6. Available online: https://www.ine.pt/xurl/pub/320462327 (accessed on 8 December 2021).
- Turismo de Portugal Estatísticas|Dormidas 2014-2018. Available online: http://travelbi.turismodeportugal.pt/pt-pt/Paginas/PowerBI/dormidas.aspx (accessed on 8 November 2018).
- Boss, D.; Nelson, T.; Winters, M.; Ferster, C.J. Using crowdsourced data to monitor change in spatial patterns of bicycle ridership. J. Transp. Health 2018, 9, 226–233. [Google Scholar] [CrossRef]
- Silverman, B.W. Density Estimation for Statistics and Data Analysis. In Monographs on Statistics and Applied Probability; Chapman & Hall: London, UK, 1986; p. 22. ISBN 0-412-24620-1. [Google Scholar]
- Campelo, M.B.; Nogueira Mendes, R.M. Comparing webshare services to assess mountain bike use in protected areas. J. Outdoor Recreat. Tour. 2016, 15, 82–88. [Google Scholar] [CrossRef]
- Browning, M.H.E.M.; Stern, M.J.; Ardoin, N.M.; Heimlich, J.E. Factors that contribute to community members’ support of local nature centers. Environ. Educ. Res. 2018, 24, 326–342. [Google Scholar] [CrossRef]
- Fromel, K.; Kudlacek, M.; Groffik, D.; Svozil, Z.; Simunek, A.; Garbaciak, W. Promoting healthy lifestyle and well-being in adolescents through outdoor physical activity. Int. J. Environ. Res. Public Health 2017, 14, 533. [Google Scholar] [CrossRef] [PubMed] [Green Version]
- Wheaton, B. Introducing the consumption and representation of lifestyle sports. Sport Soc. 2010, 13, 1057–1081. [Google Scholar] [CrossRef]
- Julião, R.P.; Valente, M.; Nogueira Mendes, R. Issues on trail runners, trail running and recreational and protected areas in Portugal. In Proceedings of the 9th International Conference on Monitoring and Management of Visitors in Recreational and Protected Areas, Bordeaux, France, 28–31 August 2018; Dehez, J., Lambert, G., Ginelli, L., hadj Abdallah, K.B., Eds.; Bordeaux Sciences Agro: Bordeaux, France, 2018; pp. 301–304, ISBN 978-2-9551251-1-3. [Google Scholar]
- Martins, G.F. de, M. Caracterização da Atividade de Geocaching no Parque Natural da Arrábida. Master’s Thesis, Lisbon University, Lisbon, Portugal, 2014. [Google Scholar]
- Bell, S.; Tyrväinen, L.; Sievänen, T.; Pröbstl, U.; Simpson, M. Outdoor recreation and nature tourism: A European perspective. Living Rev. Landsc. Res. 2007, 1, 1–46. [Google Scholar] [CrossRef] [Green Version]
- Sugiyama, T.; Thompson, C.W. Outdoor environments, activity and the well-being of older people: Conceptualising environmental support. Environ. Plan A 2007, 39, 1943–1960. [Google Scholar] [CrossRef]
- Strava Global Heatmap. Available online: https://www.strava.com/heatmap (accessed on 8 November 2018).
- Nogueira Mendes, R.M.; Pereira da Silva, C. Organized Mountain Biking Events within Peri-Urban Protected Areas. How Many Are Too Many? In Proceedings of the 8th International Conference on Monitoring and Management of Visitors in Recreational and Protected Areas, Novi Sad, Serbia, 26–30 September 2016; pp. 166–168. [Google Scholar]
- Chen, C.; Tsai, L.-T.; Lin, C.-F.; Huang, C.-C.; Chang, Y.-T.; Chen, R.-Y.; Lyu, S.-Y. Factors Influencing Interest in Recreational Sports Participation and Its Rural-Urban Disparity. PLoS ONE 2017, 12, e0178052. [Google Scholar] [CrossRef] [PubMed]
- Mooney, P.; Sun, H.; Yan, L. VGI As a Dynamically Updating Data Source in Location-Based Services in Urban Environments. In Proceedings of the 2nd International Workshop on Ubiquitous Crowdsouring, Beijing, China, 18 September 2011; ACM: New York, NY, USA, 2011; pp. 13–16. [Google Scholar]
- Massa, P.; Campagna, M. Integrating Authoritative and Volunteered Geographic Information for Spatial Planning. In European Handbook of Crowdsourced Geographic Information; Ubiquity Press: London, UK, 2016; pp. 401–418. [Google Scholar] [CrossRef] [Green Version]
- Milholland, N.; Pultar, E. The San Francisco Public Art Map Application: Using VGI and Social Media to Complement Institutional Data Sources. In Proceedings of the Proceedings of the 1st ACM SIGSPATIAL International Workshop on MapInteraction, New York, NY, USA, 5 November 2013; ACM: New York, NY, USA, 2013; pp. 48–53. [Google Scholar]
Publisher’s Note: MDPI stays neutral with regard to jurisdictional claims in published maps and institutional affiliations. |
© 2022 by the authors. Licensee MDPI, Basel, Switzerland. This article is an open access article distributed under the terms and conditions of the Creative Commons Attribution (CC BY) license (https://creativecommons.org/licenses/by/4.0/).