Article

Use of a MODIS Satellite-Based Aridity Index to Monitor Drought Conditions in the Pearl River Basin from 2001 to 2021

1
School of Geography and Remote Sensing, Guangzhou University, Guangzhou 510006, China
2
Department of Land, Environment, Agriculture and Forestry, University of Padova, Agripolis, Viale dell’Università 16, 35020 Legnaro, Italy
3
National Institute of Education, Nanyang Technological University, Singapore 637616, Singapore
4
Asian School of the Environment, Nanyang Technological University, Singapore 639798, Singapore
5
Earth Observatory of Singapore, Nanyang Technological University, Singapore 639798, Singapore
6
Rural Non-Point Source Pollution Comprehensive Management Technology Center of Guangdong Province, Guangzhou University, Guangzhou 510006, China
*
Author to whom correspondence should be addressed.
ISPRS Int. J. Geo-Inf. 2022, 11(11), 541; https://doi.org/10.3390/ijgi11110541
Submission received: 29 August 2022 / Revised: 14 October 2022 / Accepted: 25 October 2022 / Published: 28 October 2022
(This article belongs to the Special Issue Geo-Information for Watershed Processes)

Abstract

:
In recent decades, global climate change has made natural hazards increasingly prevalent. Droughts, as a common natural hazard, have been a hot study topic for years. Most studies conducted drought monitoring in arid and semi-arid regions. In humid and sub-humid regions, due to climate change, seasonal droughts and seasonal water shortages were often observed too, but have not been well studied. This study, using a MODIS satellite-based aridity index (SbAI), investigated spatiotemporal changes in drought conditions in the subtropical Pearl River Basin. The study results indicated that the inter-annual SbAI exhibited a significant decreasing trend, illustrating a wetter trend observed in the basin in the past two decades. The decreasing trend in the SbAI was statistically significant in the dry season, but not in the monsoon season. The drought conditions displayed an insignificant expansion in the monsoon season, but exhibited statistically significant shrinking in the dry season. The Pearl River Basin has become wetter over past two decades, probably due to the results of natural impacts and human activities. The areas with increased drought conditions are more likely impacted by human activities such as water withdrawal for irrigation and industrial uses, and fast urbanization and increased impervious surfaces and resultant reduction in water storage capacity. This study provided a valuable reference for drought assessment across the Pearl River Basin.

1. Introduction

Natural hazards are a huge threat to humans and social development. Global warming has increased the likelihood of the occurrence of natural hazards such as droughts, heat waves, wildfires, and floods [1,2]. As one of the most serious natural hazards affecting humans, droughts cause huge casualties and economic losses worldwide every year [3]. For example, more than half of the U.S. states are affected by droughts, leading to an annual economic loss of approximately USD 6–8 billion [4]. However, currently, humans still know very little about droughts and need effective ways to combat droughts. Thus, drought monitoring is an important prerequisite for drought migration.
Previous studies have proposed different drought indices for drought monitoring, most of which are based on the observations from meteorological stations. Such indices include the PDSI (Palmer Drought Severity Index) [5], the SPI (Standard Precipitation Index) [6], and the SPEI (Standardized Precipitation Evapotranspiration Index) [7]. Based on the observations from meteorological stations, ambient drought conditions can be accurately characterized. However, due to the stations’ low density and uneven distribution, it is difficult to achieve large-scale drought monitoring, especially in remote rural areas. Therefore, these indices cannot represent the general trends and changes in drought conditions for large areas. Satellites can provide spatiotemporal images with continuous coverage for large areas, and thus have unique advantages for drought monitoring, especially in remote areas with few meteorological stations. Based on satellite images, many scholars have proposed new drought monitoring indices such as the VCI (Vegetation Condition Index) [8], the TCI (Temperature Condition Index) [8], the SDCI (Scaled Drought Condition Index) [9], the MIDI (Microwave Integrated Drought Index) [10], the OVDI (Optimized Vegetation Drought Index) [11] and the OMDI (Optimized Meteorological Drought Index) [11]. These drought indices can provide better spatial coverage for drought conditions, and also combine multiple bands to build an integrated drought monitoring index to better represent drought conditions.
Therefore, with the development in remote sensing techniques, satellite images have been widely used in drought detection and have made great contributions to drought monitoring at the global, continental and regional scales. Dehghan et al. [12] used the PDSI for drought assessment in Fars Province, Iran. Their results proved the strong correlation between the results simulated from site-based precipitation (R2 > 0.63) and temperature (R2 > 0.95) observations. At a global scale, Trenberth et al., using the PDSI, concluded that increased heating due to global warming may not lead to droughts but it is expected that, when droughts occur, they are likely to occur quicker as well as be more intense [13]. Gidey et al. [14] used the SPI to analyze the temporal and spatial variation of drought in northern Ethiopia, predicting that due to insufficient precipitation, the region will continue to be dry in the future. In facts, the SPI based on historical observations also indicated that the increase in drought frequency, duration, and severity will be significant in Africa, the Mediterranean region, Eastern Asia, and Southern Australia [15]. The SPI can work stably even with the difference of precipitation in different regions. It can also derive various results for different time scales. This is very meaningful for generating diurnal, monthly, seasonal and annual variations of droughts across a large area. On the basis of the SPI, considering evapotranspiration, Hernandez et al. [16] proposed the SPEI and used the metric for drought assessment in southern Texas, USA. The results illustrated that due to the increase in temperature and decrease in precipitation in the future, the region will be much drier. Additionally, based on the SPEI and the SPI, Chiang et al. found that that the presence of anthropogenic forcing has increased the drought frequency, maximum drought duration, and maximum drought intensity experienced in large parts of the Americas, Africa, and Asia [17]. In addition, the VCI is also a new drought monitoring method based on remote sensing technology. Dutta et al. [18] used the VCI to monitor agricultural drought in Rajasthan (India), and compared this with the results derived from the SPI. They found that the VCI and SPI results were consistent. The VCI is also a useful tool for assessing agricultural drought. Zhang et al. [10] proposed the MIDI based on precipitation, soil moisture and surface temperature, and used the index for drought monitoring in northern China. Based on validation with the results of the multi-scale SPI, they concluded that it can be applied well to monitoring of short-term droughts.
As discussed above, most studies conducted drought monitoring in arid and semi-arid regions. In fact, in humid and sub-humid areas, due to the influence of climate change, seasonal droughts were often observed too, and seasonal water shortages also reported from time to time [19,20,21,22,23]. However, few studies have been performed on drought monitoring in humid and sub-humid areas. This context necessitates studies on seasonal droughts or water shortages in humid and sub-humid regions. In addition, in the context of global climate change, drought monitoring is also an important tool to evaluate regional long-term dry and wet changes. It is also an important indicator for regional environmental changes.
The Pearl River Basin (PRB) is a typical humid and sub-humid area, which is an appropriate study area for such aforementioned studies. The PRB is located in the subtropical zone, with a mild and rainy climate. However, in recent years, seasonal water shortages were often reported in the PRB [24,25] but the changes in wet and dry environmental conditions and their long-term changes are still unknown. In this study, using MODIS surface reflectance and surface temperature data, by calculating the metric of the SbAI (Satellite-Based Aridity Index) and comparing it with the precipitation data, the major objectives of this study on the spatiotemporal changes in drought conditions in the PRB are as follows: (1) the inter-annual and monthly variation in the SbAI and the corresponding changes in drought conditions for the period 2001–2021 for the PRB; (2) spatial distribution of droughts across the PRB; (3) spatiotemporal variation in drought conditions in the basin’s representative sub-regions. The study results will improve the understanding of the seasonal drought characteristics and the long-term changes in wet and dry environmental conditions in the PRB. It can provide valuable references for drought prevention and environmental management in the PRB.

2. Materials and Methods

2.1. Study Area

The Pearl River Basin (PRB) is located in southern China (Figure 1a), from 21°31′ N to 26°49′ N and 102°14′ E to 115°53′ E, and administratively covers 6 provinces (Yunnan, Guizhou, Guangxi, Guangdong, Hunan, and Jiangxi) and 2 special administrative regions (Hongkong and Macau).
Controlled by a subtropical climate, the basin, with a size of 442,100 km2, has an annual average temperature from 14 to 22 °C and an average precipitation from 1200 to 2200 mm [26]. Similar to its high northwest and low southeast topography, its precipitation varies widely in spatial and temporal distribution: the precipitation in spatial distribution gradually decreases from west to east. The monsoon season is from April to September, when 70~85% of the annual precipitation occurs.
With its wide span from west to east across the Yunnan–Guizhou Plateau, the mountains in Guangdong and Guangxi provinces, and the Pearl River Delta Plain, we spilt the PRB into 7 sub-regions for detailed analysis (Figure 1b): the headwater region (including the Nanpanjiang River and Beipanjiang River basins) (Area 1); the Hongshui River and Liujiang River basins (Area 2); the Zuojiang River, Youjiang River and Yujiang River basins (Area 3); the Heguijiang River, Qianxunjiang River and Xijiang mainstem river basins (Area 4); the Beijiang River basin (Area 5); the Pearl River Delta (Area 6); the Dongjiang River basin (Area 7).
According to previous studies [27,28,29,30], from the 1960s to 2019, precipitation in the PRB showed a slight increasing trend, with the most pronounced declines occurring in the middle and upper reaches, and an increase in the lower reaches. Inter-annual precipitation in spring and winter gradually increased in volume, and reduced in summer and autumn.
In addition to the changes in precipitation, studies also displayed that land use also experienced a great change in the PRB [31,32]. In the last 30 years, the area of waterbodies and forest land in the PRB has shrunk due to the expansion of urbanization, and there has been a dramatic increase in built-up areas. The decrease in grassland mainly occurred in the western part, which was transformed into forest land. The decrease in cropland was concentrated in the central basin. However, the increase in built-up areas primarily occurred in the southeast, especially in the Pearl River Delta, contributing to approximately 6.3% of the delta area, which was mainly converted from crop land and forest land. Nowadays, the predominant land use in the PRB is forest land, accounting for approximately 67.3% of the basin; followed by crop land (approximately 25.6%) mainly in the western and central PRB. After that is built-up areas (approximately 2.5%) in the southeastern PRB; and grassland (approximately 2.2%) in the western PRB.

2.2. Data

2.2.1. MODIS Satellite Data

Two datasets were used to calculate the SbAI—the surface reflectance dataset and the surface temperature dataset—both of which were provided by MODIS satellite series. Compared with other satellite products, MODIS satellites provide better-quality and longer continuous datasets. Their performance and applicability have been proved in various studies. However, due to the low spatial resolution, MODIS products can only be used in large-scale regions.
The MODIS reflectance product is the most common data used for albedo production. It has two datasets—MOD09GA and MYD09GA—corresponding to products generated from the Terra and Aqua satellites, respectively. In this study, the MOD09GA reflectance dataset produced by the Terra satellite was used. The MOD09GA product has a temporal resolution of 1 day, a spatial resolution of 1 km, and a reflectance spatial resolution of 500 m. The 500 m reflectance dataset also provided reflectance for Bands 1–7, data quality, data extent, observation number, and 250 m scanning information. The 1 km datasets provided descriptive information including observation frequency, data quality, sensor azimuth and zenith, solar altitude and azimuth, and orbit information. The reflectance of 7 bands from the 500 m datasets and the solar zenith from the 1 km dataset were used for data preprocessing and analysis. To reduce the error, we firstly made a cloud removal operation for the MOD09GA dataset. The dataset was retrieved from the Google Earth Engine (GEE) image library (https://developers.google.com/earth-engine/datasets/catalog/MODIS_006_MOD09GA, accessed on 24 June 2022) for image processing and analysis on the GEE platform using JavaScript.
The surface temperature dataset was acquired from the MOD11A1 dataset produced by the Terra satellite. A global daily average surface temperature production framework was established by the coupling of the annual temperature cycle (ATC) model and the diurnal temperature cycle (DTC) model. Then, the global 1 km average daily surface temperature product was generated based on the framework. The MOD11A1 dataset has a temporal resolution of 1 day and a spatial resolution of 1 km. To reduce the error, we also only used good-quality pixels in the MOD11A1 dataset. The dataset was acquired on the GEE platform (https://developers.google.com/earth-engine/datasets/catalog/MODIS_006_MOD11A1, accessed on 24 June 2022). Additionally, it was also processed on the GEE platform using JavaScript.

2.2.2. Precipitation Data

Precipitation data were used to verify the analysis results of the SbAI. The Tropical Rainfall Measuring Mission (TRMM) and the Global Precipitation Measurement mission (GPM) are global typical representatives of high-precision historical precipitation data. The TRMM satellite provided precipitation data with a temporal resolution of 3 h and a spatial resolution of 0.25° in the latitude range of 50° S–50° N in the period 1997–2015. Since 2014, the National Aeronautics and Space Administration (NASA) and the Japan Aerospace Exploration Agency (JAXA) began to provide the Global Precipitation Measurement mission (GPM) dataset. As a continuation of the TRMM, the GPM provides higher-precision precipitation data with a temporal resolution of 0.5 h and a spatial resolution of 0.1°, using multiple sensors, multiple satellites, and multiple algorithms combined with satellite networks and rain gauge inversion. The most used precipitation dataset in this study was the GPM dataset. This dataset has a monthly dataset on the GEE platform, which was acquired and processed on the GEE platform (https://developers.google.com/earth-engine/datasets/catalog/NASA_GPM_L3_IMERG_MONTHLY_V06, accessed on 24 June 2022).

2.2.3. Other Datasets

To support the results of this study, we also obtained the 2001–2020 Water Resources Bulletin for the PRB from the Pearl River Water Resources Commission (PRWRC) (http://www.pearlwater.gov.cn/zwgkcs/lygb/szygb/, accessed on 28 August 2022). The statistical results of the annual precipitation in the PRB were compared with the GPM precipitation data, and the overall trend obtained in this study was verified. Most of these datasets came from the government’s official reports. Thus, the data quality can be guaranteed, meaning that they were able to support the relevant analysis in this study. The land use data were obtained from the 30 m annual land cover datasets in China from 1990 to 2021 (https://zenodo.org/record/5816591#.Yvj5-3ZBxPY, accessed on 14 May 2022). DEM data came from the Geospatial Data Cloud (http://www.gscloud.cn, accessed on 14 May 2022). These datasets were mainly used to investigate the causes for changes in drought conditions.

2.3. Methods

2.3.1. The Satellite-Based Aridity Index (SbAI)

The SbAI [33] is the ratio of the land surface temperature (LST) difference between day and night to the absorbed solar radiation. The physical meaning of the SbAI is the opposite of heat capacity determined by land surface wetness, which can be derived as follows:
S b A I = Δ T s R s
where
Δ T s = L S T d a y L S T n i g h t
R s = ( 1 r ) S 0 cos θ c
where r in Formula 3 can be computed as:
r = 0.160 r 1 + 0.291 r 2 + 0.243 r 3 + 0.116 r 4 + 0.112 r 5 + 0.081 r 7
Δ T s is the LST difference between the day and night values, and R s is the absorbed solar radiation, calculated from the broadband albedo r , the solar constant S 0 (1367 W·m−2) and the solar zenith angle at the Sun’s apex θ c , where r is obtained from the experimental formula [34]. For dry surfaces, the SbAI is larger because of its larger heat capacity, resulting in a larger Δ T s , and vice versa.

2.3.2. Trend Analysis

The Mann–Kendall (M–K) test [35] was used to analyze the significance of the SbAI’s changing trends. The M–K test is a non-parametric method, and it does not require the samples to follow a random distribution. The test’s results are not affected by missing data and a few outliers, giving it strong applicability. The test steps are as follows:
S = j = 1 n 1 i = j + 1 n s g n ( x i x j )
where x i and x j are observations:
s g n ( x i x j ) = { 1   x i x j < 0   0   x i x j = 0   1   x i x j > 0
The calculation of the variance Var(S) is as follows:
V a r ( S ) = n ( n 1 ) ( 2 n + 5 ) 18
Z and p are obtained by the following equations:
Z = { S 1 V a r ( s )   S < 0 0   S = 0 S + 1 V a r ( s )   S > 0
p = 2 ( 1 c d f ( | Z | ) )
For Z , if | Z | ≥ 1.96, there is a significant change at the confidence level of 0.05.
Theil Sen Median slope estimation [36] was used to calculate the intensity of the trend, which is calculated by Equation (10).
T S S l o p e = m e d i a n ( x j x i j i )
The Pettitt test [37] was used to detect the abrupt change year, and the test steps are as follows:
U t , N = U t 1 , N + J = 1 N s g n ( x t x j ) f o r   t = 2 , 3 , , N
where x t and x j are observations, and U t , N indicates whether two sample sets are from the same population.
The test statistics K ( t ) and p are given as follows:
K ( t ) = m a x | U t , N |
p = 2 e 6 ( K N ) 2 N 3 + N 2 f o r   t = 2 , 3 , , N

3. Results

3.1. Temporal Trends of the SbAI

To quantify the temporal trends of drought conditions in the PRB during the period 2001–2021, this study calculated the monthly SbAI (Figure 2a–l) and the yearly SbAI (Figure 2m) on the basis of daily MOD09GA and daily MOD11A1 products. According to seasonal division in China [38], this study assumed that spring is March, April, and May; summer is June, July, and August; autumn is September, October, and November; winter is December, January, and February. According to the precipitation in different months in the PRB [27,39], this study defined the monsoon season in the PRB as from May to October, and the dry season as the remaining months. The seasonal SbAI, the monsoon seasonal SbAI, and the dry seasonal SbAI were derived from the monthly SbAI.

3.1.1. Annual Trends of the SbAI

As shown in Figure 2 and Table 1, the SbAI significantly decreased (p < 0.01) during the period 2001–2021, with a decreasing trend of −0.624/yr, indicating that the PRB is becoming wetter. From 2001 to 2021, the maximum, minimum, and mean SbAI was 104.983 in 2006, 90.428 in 2016, and 97.41, respectively; there are 13 years with an SbAI higher than the multi-year average, and 9 years with an SbAI lower than the multi-year average, mostly occurring after 2010, indicating that the PRB became wetter mainly after 2010. In the past 20 years, North China, even arid and semi-arid Northwest China, and the Qinghai–Tibet Plateau also became wetter [40,41,42], revealing an increasingly humid trend in most parts of China.

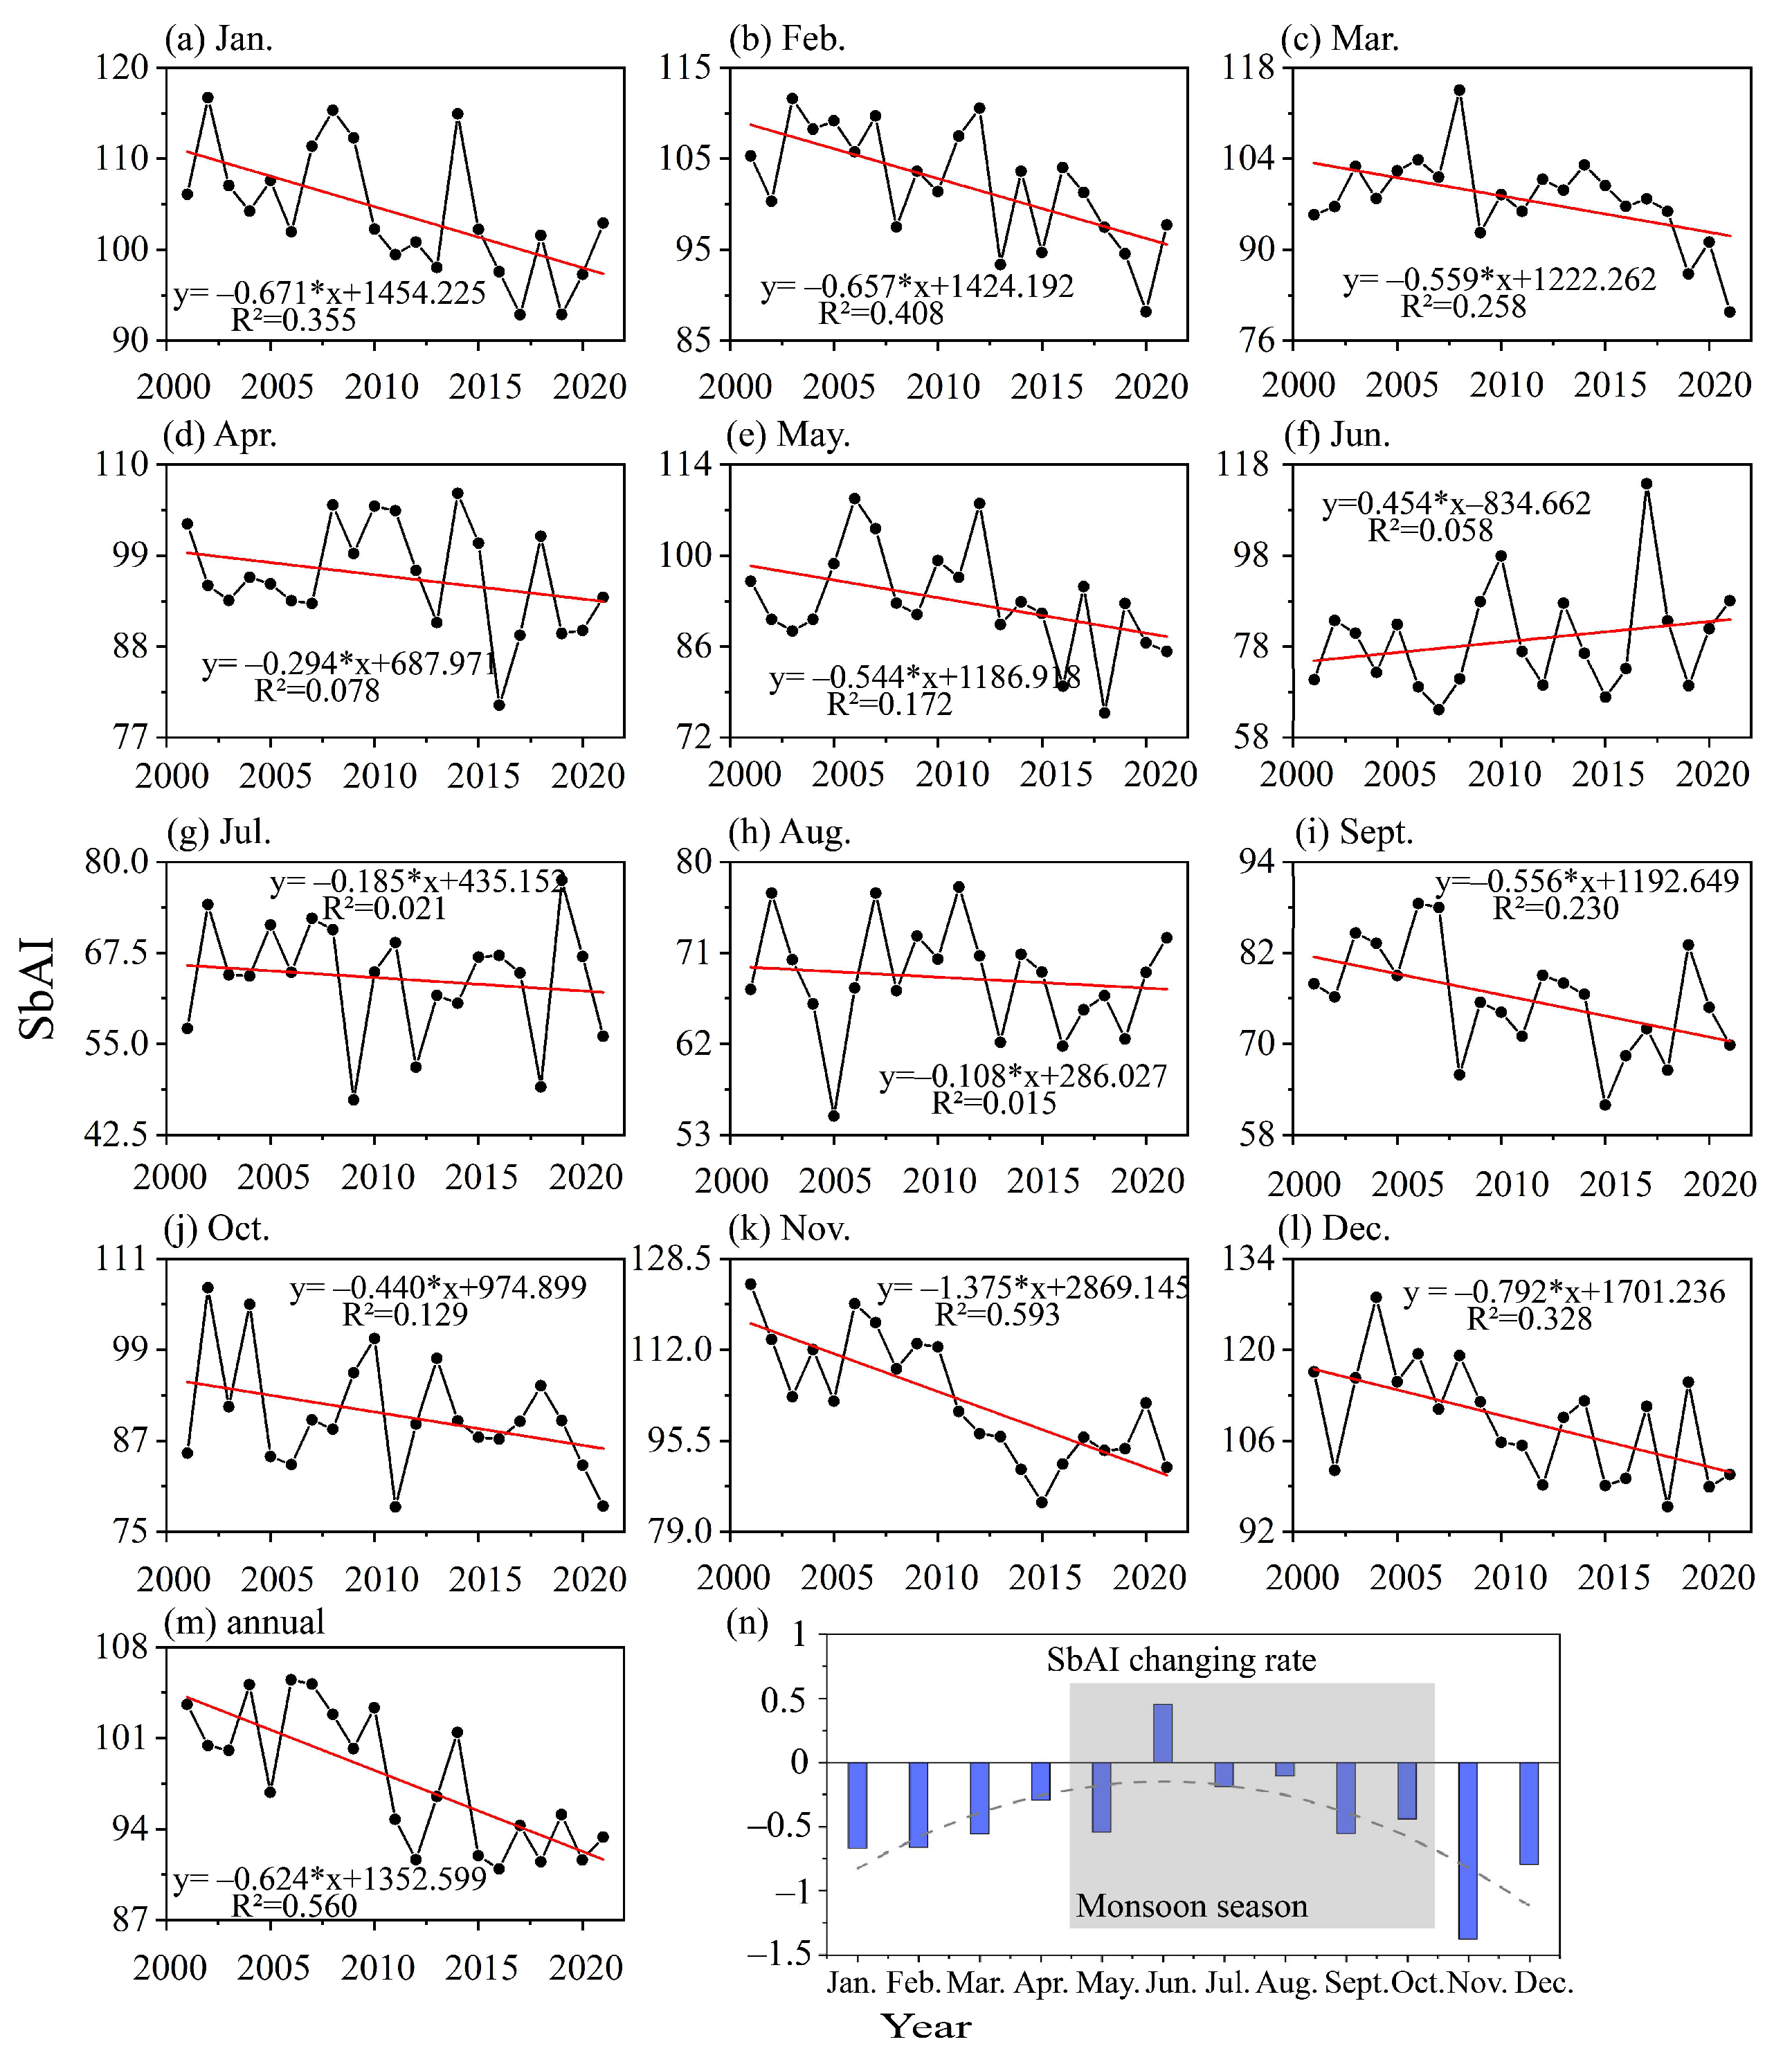
3.1.2. Monthly Trends of the SbAI

Collectively, during the period 2001–2021, except for June, the SbAI showed a decreasing trend in all other months, but the downward trends were more significant in the dry season. The fastest decrease in the SbAI was observed in November, with a rate of −1.375/yr. The slowest decrease in the SbAI was in August, with a rate of −0.108/yr. However, June was the only month with an increase in the SbAI, although without statistical significance. According to previous studies [27,28,29,30], from the 1960s to 2019, precipitation in the Pearl River Basin showed a slight increasing trend, with an increase in the lower reaches, and the most pronounced declines in the middle and upper reaches. Inter-annual precipitation in spring and winter showed a gradual increase, and displayed a reduction in summer and autumn. This revealed that the changes in the SbAI in the PRB are consistent with the trends of precipitation changes.

3.1.3. Drought Events Detected by SbAI

We used the monthly SbAI time series from 2001 to 2021 for monthly drought analysis (Table 2). The Water Resources Bulletin for the PRB from the PRWRC shows that drought occurs almost every year in the PRB in the monsoon season, so we chose the median SbAI in the monsoon season over 21 years to calculate a threshold. Then, the threshold was used to analyze the drought duration, drought severity, and drought intensity. Most of the droughts occurred in November, December, January and February. Drought duration is generally 2–5 months. Although some places experienced droughts for a long time, they are small in size and are primarily located in the upper reaches of the Pearl River, thus the consequences were not typical.

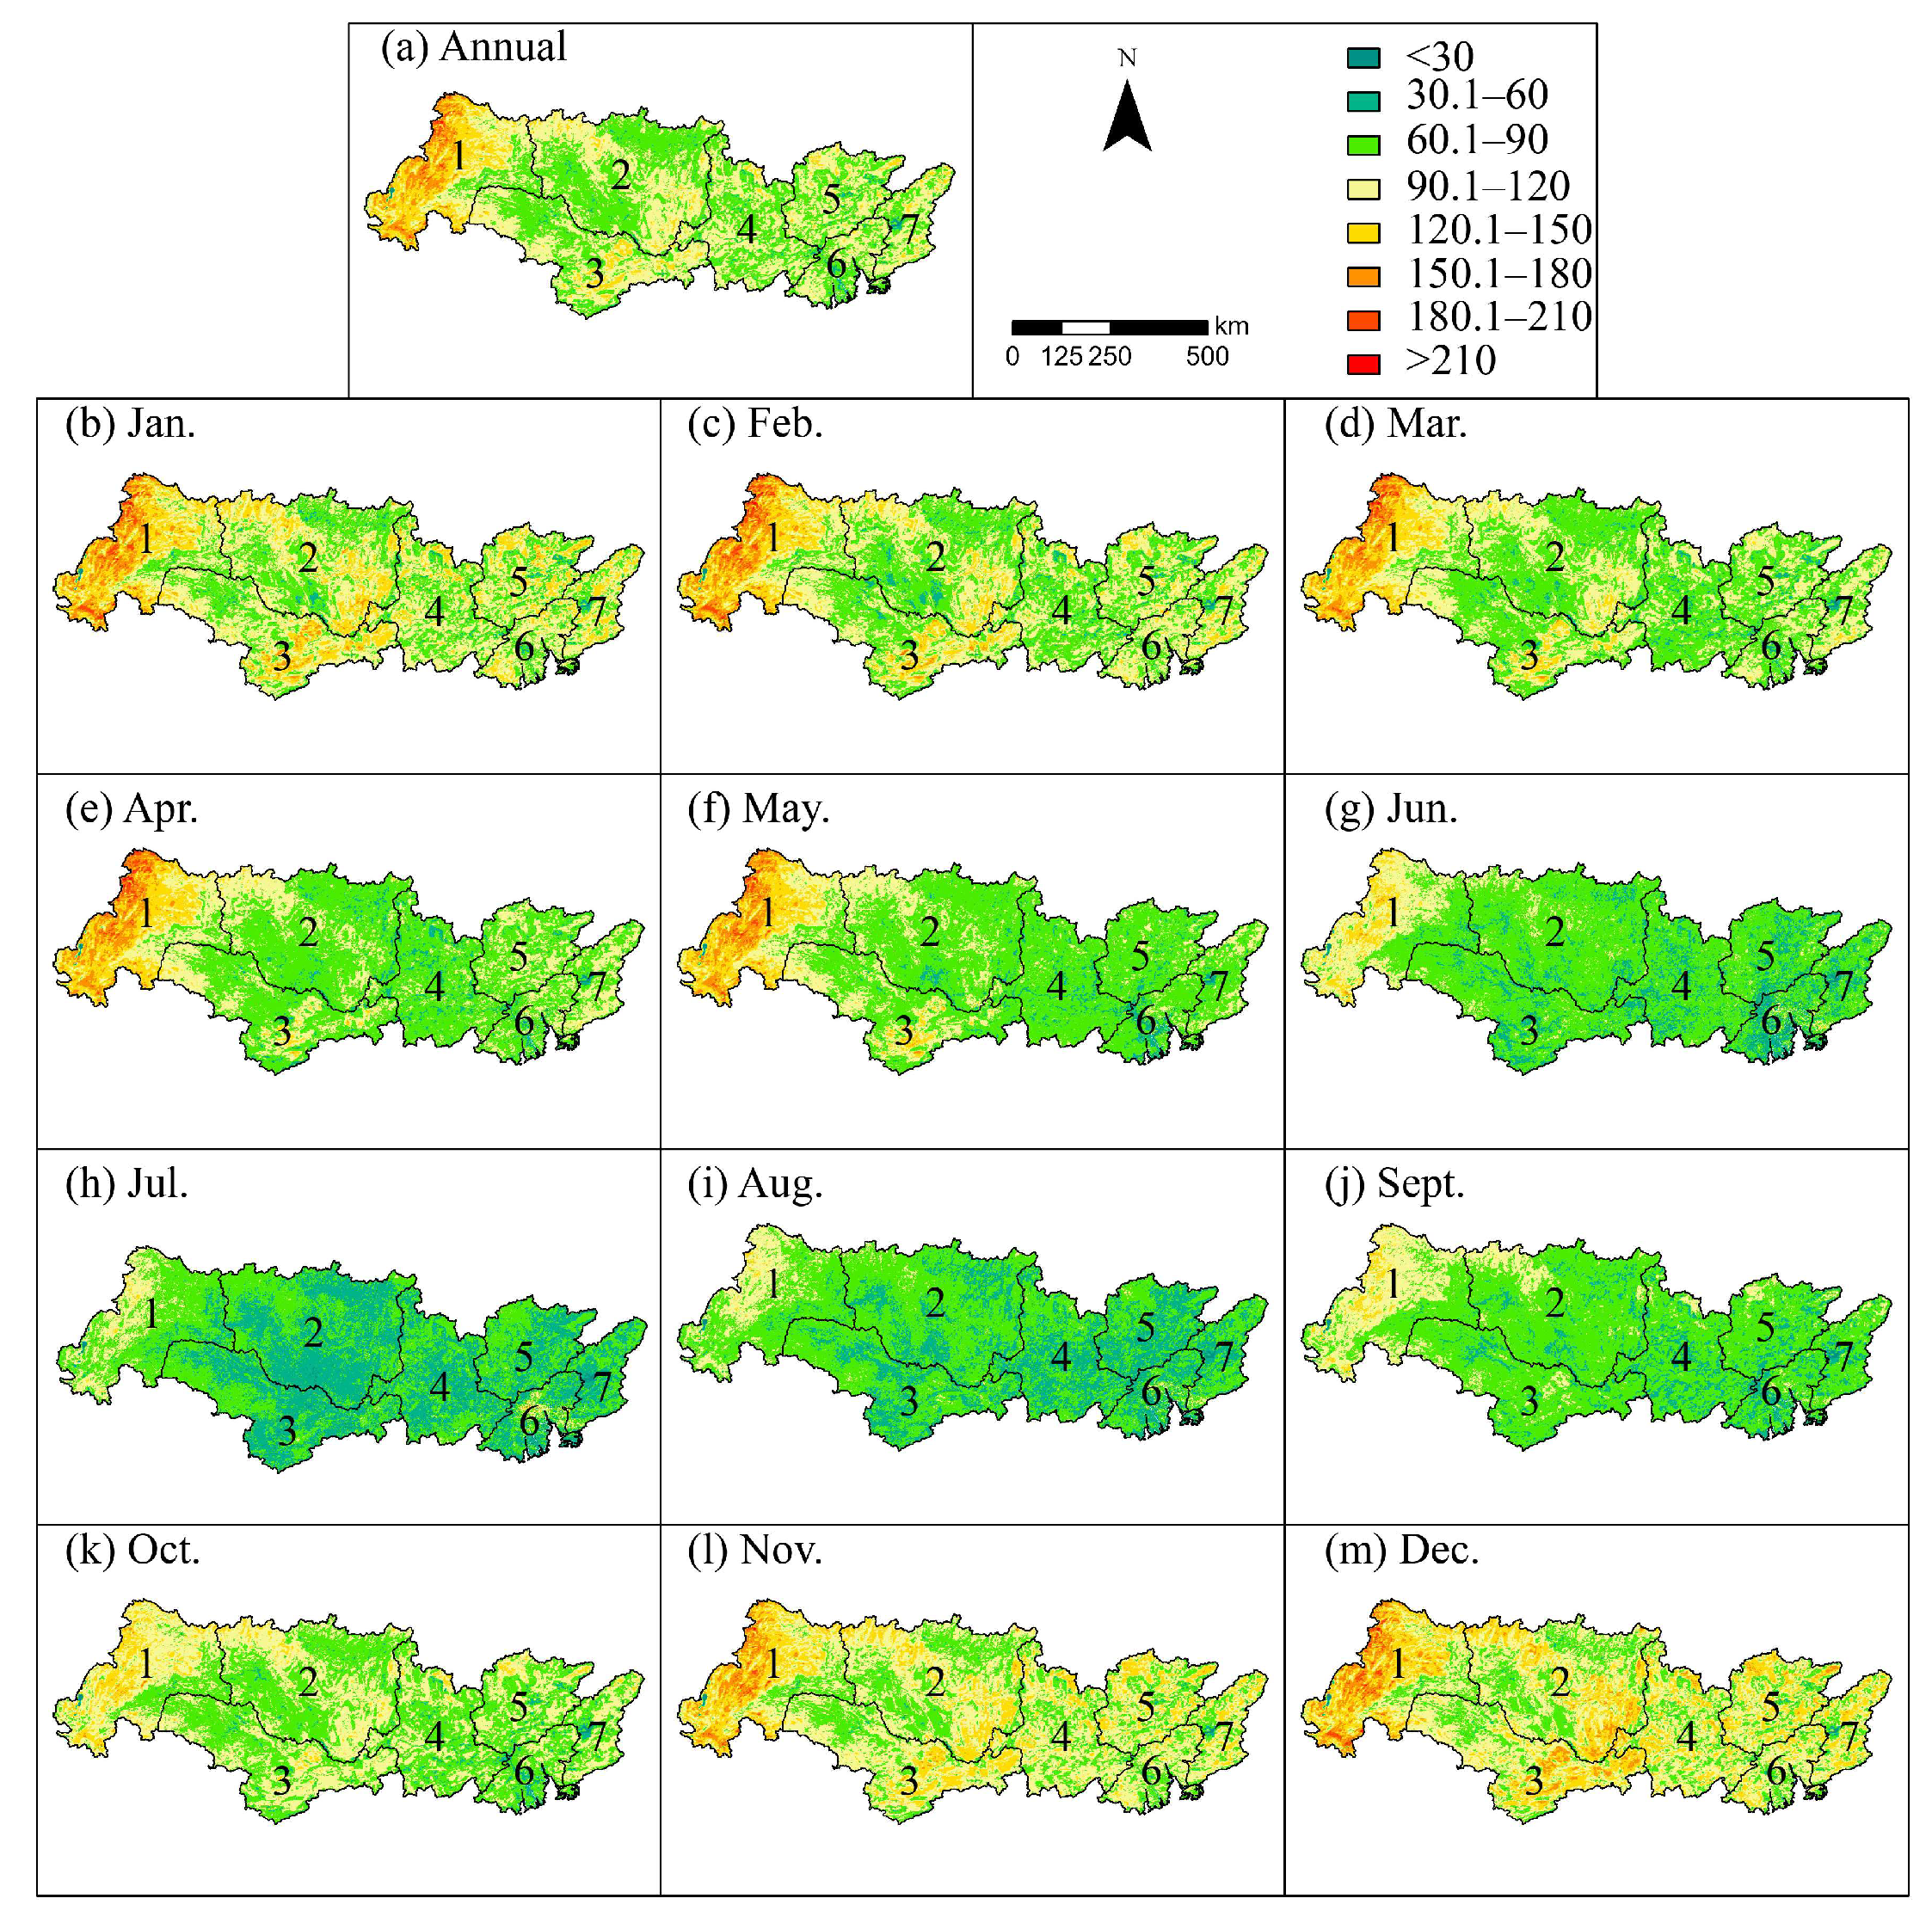
3.2. Spatial Patterns of the SbAI

To quantify the spatial patterns of the SbAI in the PRB during the period 2001–2021, we calculated the monthly and annual SbAI at the pixel scale. As shown in Figure 3a, the west part of Area 1, the headwater region of the PRB, was the driest region in the PRB. The southeast part of Area 2 and the east part of Area 3 were relatively dry regions in the PRB. Collectively, the monthly and annual SbAI exhibited similar spatial patterns, showing that Areas 1–3 were relatively dry regions in the PRB. Obviously, the SbAI in the dry season was higher than that in the monsoon season, indicating that the dry season is much drier than the monsoon season in the PRB due to low precipitation in the dry season, which has the potential to cause seasonal water shortages in the PRB.
From June to September, almost all of the PRB was humid, with the SbAI mostly lower than 90. Even in the relatively dry region of Area 1, the overall SbAI was also lower than 120, indicating that the region also experienced relative humidity. Areas 4–7 experienced high humidity in the monsoon season. In the dry season, for instance in December, parts of wettest region (Areas 4–7) in the PRB became dry, with the SbAI ranging from 120 to 180. From March to June, the switch from the dry season to the monsoon season, the wet area significantly expanded in the PRB. In July and August, when the peak SbAI occurs (Figure 3 and Figure 4), the overall SbAI across the entire PRB is lower than 90; the SbAI for areas 1–7 was similar, and all areas were in the wet stage.

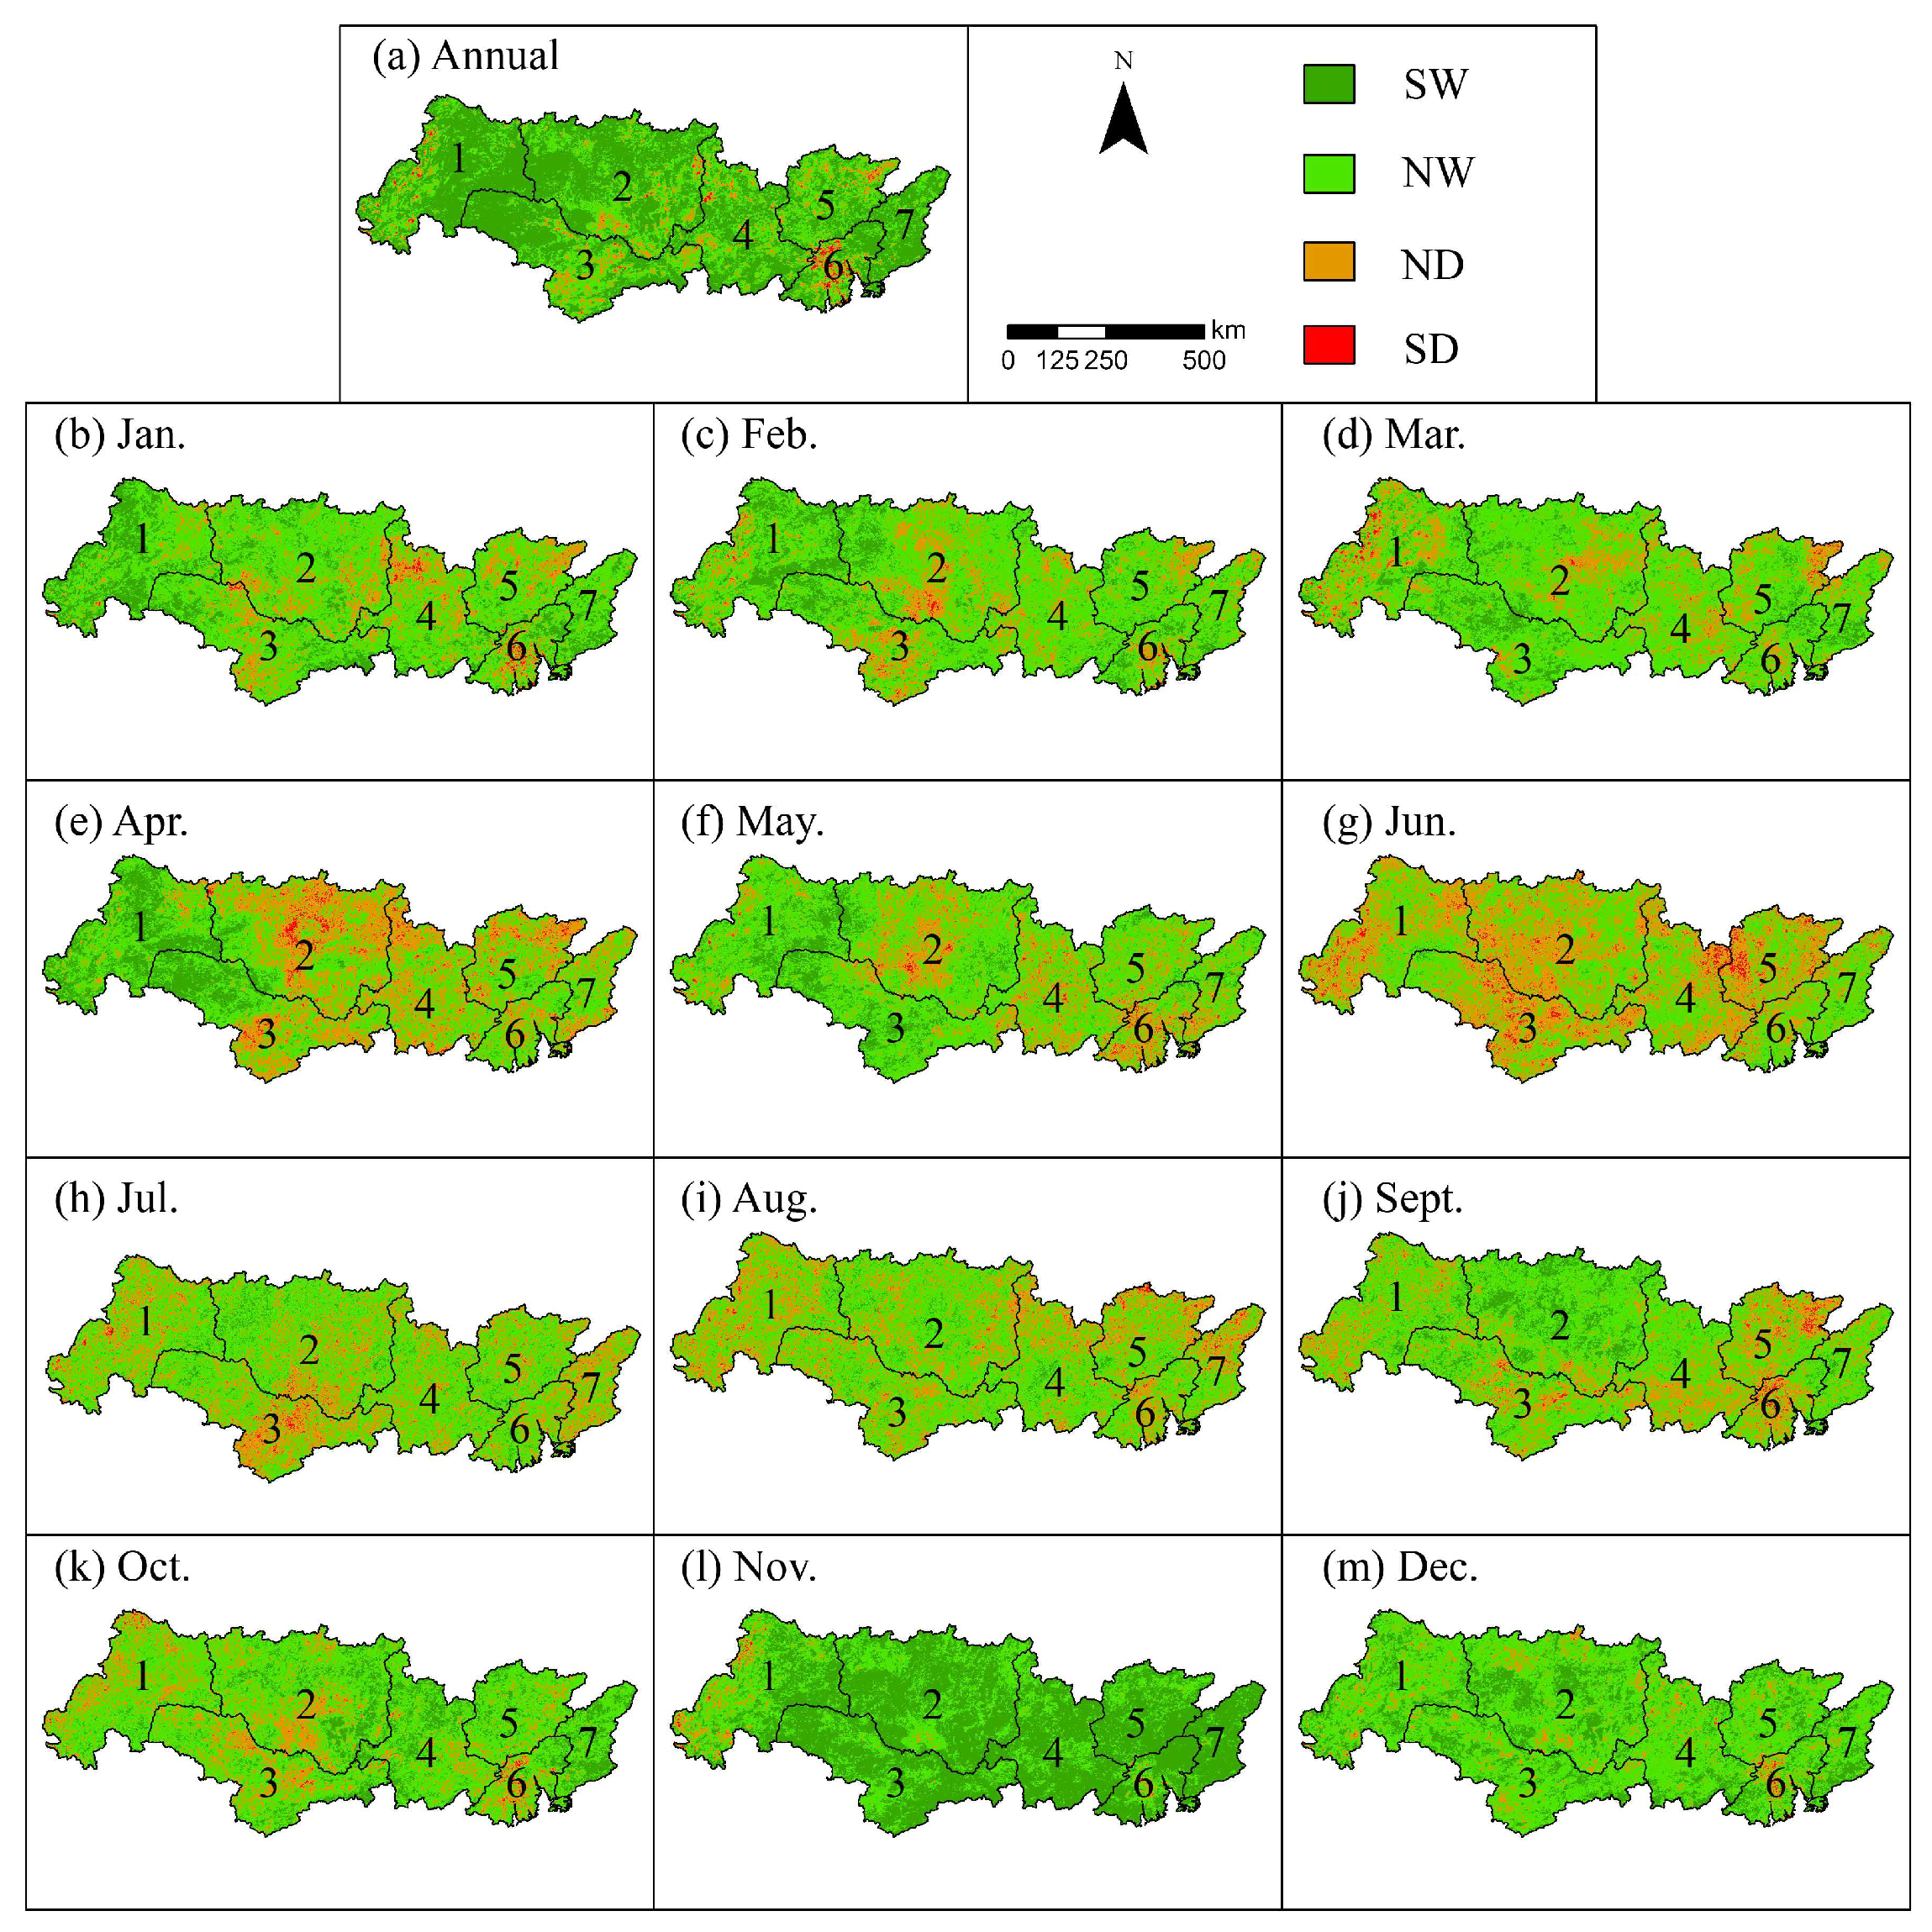
3.3. The M–K Test for the Spatiotemporal Trends of the SbAI

Figure 5 shows the significance level of SbAI trends assessed using the Mann–Kendall test. As shown in Figure 5a, at the annual scale, areas that were statistically significantly drier were mainly distributed in the central area of Area 6 and some small patches in Areas 1–3. At the monthly scale (Figure 5b–m), the drier trend gradually weakened from the center to the east and west directions. For April to September, many areas became drier, especially in Areas 2–5. Areas with a wetter trend were mostly in Areas 1 and 7 in east and west PRB, respectively. The fastest trend of becoming drier occurred in June, while the fastest change in becoming wetter occurred in November.
In accordance with Figure 6, excluding June, areas with a wetter trend were predominant in the PRB. However, one interesting result should be highlighted: as shown in Figure 3, Area 6 is among the wettest areas in the PRB, but a large part of Area 6 tended to be drier according to the M–K test. Conversely, as one of the driest regions in the PRB, Area 1 has become wetter according to the M–K test.
On the basis of Figure 5b–m with Figure 6, in the dry season, wetter areas were predominant in the PRB, especially in November (almost the driest month according to Figure 4), as the SbAI significantly decreased in almost the entire PRB in the dry season. However, in the monsoon season, areas with a drier trend were much larger than drier areas in the dry season. Therefore, despite high precipitation in the monsoon season, the drier areas that occurred in the monsoon season were much larger than those that occurred in the dry season. In summary, for the temporal trends of the SbAI in the PRB, the PRB became wetter at the inter-annual scale, but the wetter trends in the dry season were more significant than the drier trend in the monsoon season.

3.4. Temporal Trends of the SbAI in the Representative Regions of Areas 1 and 6

Area 1 is the remote headwater region of the PRB, with a natural environment, relatively less precipitation, and less impact from anthropogenic activities. Area 6 is the most economically developed region and under most impact from anthropogenic activities, with relatively higher precipitation and the highest and densest population. Thus, Areas 1 and 6 can be regarded as representatives of the most natural region and the most urbanized region in the PRB. As mentioned in Section 3.2, as the driest region in the PRB, Area 1 was becoming wetter. Conversely, as one of the wettest regions in the PRB, Area 6 was becoming drier. Thus, Areas 1 and 6 can be regarded as representative regions for the further analysis of the trends of drought conditions in the PRB.

3.4.1. Temporal Trends of the SbAI in Areas 1 and 6

As shown in Table 1, trends of the SbAI in Area 1 showed similar patterns to that of the entire PRB—a significantly wetter trend in the dry season, and an overall insignificantly drier trend in the monsoon season (except for June). According to Table 3, in Area 1, at the monthly scale, the SbAI decreased fastest in May, with a decreasing rate of −1.10/yr; the SbAI decreased at the slowest rate in August, with a decreasing rate of only −0.07/yr. The SbAI in Area 1 increased only in June, at a rate of 0.38/yr. The mean SbAI in Area 1 in the dry season was obviously higher than that in the monsoon season. From January to December, the SbAI firstly decreased and then increased, with a maximum value of 131.59 in February, and a minimum value of 81.33 in July.
In Area 6, at the monthly and annual scales, the SbAI had a decreasing trend, with a significant decrease in the dry season, in which the fastest decrease of −1.56/yr was observed in November. An insignificant decrease was observed in the monsoon season, with a slowest rate of −0.02/yr in June. From January to December, similar to the monthly pattern in Area 1, the SbAI in Area 6 also firstly decreased and then increased, with a maximum value of 98.97 in December and a minimum value of 19.92 in July.

3.4.2. Monthly Fluctuations of the SbAI in Areas 1 and 6

According to Figure 3, at all the time scales, the west part of Area 1 is much drier than the east part due to lower precipitation in the west. With the switch from the dry season to the monsoon season, the difference in the SbAI between western and eastern Area 1 shrunk. As shown in Figure 7, the drier part of Area 1 rapidly decreased in proportion after May. However, the proportion of drier areas in Area 1 is still much higher than across the entire PRB, as the absolute precipitation in Area 1 is still relatively low in the PRB [28].
According to Figure 8, at the monthly and annual scales, wetter areas were predominant in Area 1, indicating that Area 1 has become wetter in the past 20 years. Excluding November, the proportion of NW areas are in Area 1 was higher than that of SD, ND and SW areas (Figure 8). In November, the proportion of SW areas was greatest Area 1. In May, however, the proportion of ND areas was greatest in Area 1. Collectively, in Area 1, the wetter trend in the dry season was more significant than the drier trend in the monsoon season, showing an overall inter-annual wetter trend in Area 1.
In Figure 3, Area 6 is generally humid. In the dry season, from November to April, from the center Area 6 outward, the SbAI gradually increased. After the switch from the dry season to the monsoon season, the SbAI difference in different parts of Area 6 rapidly narrowed. As shown in Figure 9, similar to the entire PRB, the proportion of drier areas decreased after April.
According to Figure 10, in addition to June, most parts of Area 6 exhibited a wetter trend at the monthly and annual scales. At the annual scale, more than 70% of Area 6 significantly became wetter. However, in June, in the monsoon season, more than 50% of Area 6 became drier. The ratio is much higher than that in other sub-regions. Collectively, in Area 6, the proportion of wetter areas in the dry season was slightly larger than that of drier parts in the monsoon season. It should be pointed out that, Area 6 is among the areas with the highest precipitation in the PRB; however, it had a higher proportion of drier areas in the monsoon season. The possible causes were that Area 6 experienced more significant impacts from human activities (i.e., fast industrialization and urbanization), resulting in a decrease in water storage capacity and aggravating drought conditions.

4. Discussion

4.1. Accuracy Assessemnt

The SbAI was initially proposed by Kimura and was first used to determine surface dryness in Northeast Asia [33]. Later, it was also used to determine land drought and land degradation levels [43,44]. Using the SbAI to classify land drought levels was more accurate than using a traditional drought index. The SbAI was also used to monitor drought in Mongolia from 2001 to 2013 [45]. The results showed that the SbAI was able to accurately identify drought using satellite images. The SPI is sometimes more promising than the SBAI. However, the SPI relies heavily on observation data from meteorological stations. The SPI may not be ideal for areas with few meteorological stations. In the PRB (with a basin size of 440,000 km2), there are only approximately 80 meteorological stations available (many county-level stations do not release their data publicly), especially in the upper reaches of the Pearl River which have fewer stations. This is why we used the SBAI for this study.
Some studies have evaluated the accuracy of GPM data in the Pearl River Basin [46]. The assessments displayed that the accuracy of GPM data is satisfactory in the Pearl River Basin. This study also made a simple verification of the GPM data through a comparison with the precipitation data collected by the Pearl River Water Conservancy Commission (PRWCC). As shown in Figure 11, the GPM data and the precipitation data of the PRWCC show great correlation (R2 is greater than 0.9) across the entire basin and the seven sub-regions. Therefore, we can verify our results using the drought trends obtained from the GPM data.
We checked the accuracy of the SbAI using GPM data and the results are shown in Figure 12. In this validation step, we compare the monthly GPM data from 2001 to 2019 and the mean SbAI value for the entire Pearl River Basin and its seven sub-regions. Figure 12 shows the relationship between the two tends consistent. Across the entire Pearl River Basin and seven sub-regions, R2 values are all greater than 0.3; half of the R2 values are even greater than 0.4. The maximum R2 value is 0.563, and the minimum R2 value is 0.310. Figure 12 shows that the SbAI and the GPM displayed a significant negative correlation. The increase in rainfall can weaken the drought condition, thereby reducing the SbAI, and vice versa. This trend is pronounced in all of the seven sub-regions. However, it should be pointed out that GPM data and the SbAI data are not be completely consistent, because the GPM data are the result of natural climate change, but the surface drought condition monitored by the SbAI is the combined result of human activities and natural climate change. Therefore, Figure 12 shows that the SbAI is directly affected by natural rainfall, but, at the same time, is not completely regulated by natural rainfall. This shows the incomplete consistency of the two. Therefore, the two trends are inconsistent in some sub-regions, mainly because these areas are disturbed by human activities. For example, humans can increase water storage capacity by afforestation, thereby reducing the drought conditions. Conversely, humans can also increase the impervious area through rapid urbanization, resulting in a decrease in water storage capacity and aggravating drought conditions.

4.2. Comparisons with Previous Studies

Studies have shown that most of the arid and semi-arid regions in the world are becoming drier, such as the west of America and the Middle East region [47,48,49]. Other areas, for example the northwest and southwest regions of China, are becoming wetter [50,51]. Compared with most arid and semi-arid regions, the PRB has a wetter trend, and drought in arid and semi-arid regions mainly occurs in summer, while drought in the PRB mainly occurs in winter and spring.
He et al. [52] found that the NDVI in the Pearl River Basin showed a fluctuating increasing trend (p < 0.01); 81.44% of the Pearl River Basin showed an increase in vegetation coverage, mainly in the upper and middle reaches of the Pearl River Basin. The areas with medium and low vegetation coverage are mainly located in the Pearl River Delta. Our results are in good agreement with those of He et al. (Figure 13). In this study, the SbAI in the Pearl River Basin showed a significant downward trend (p < 0.05). The SbAI decreased in most areas of the Pearl River Basin. Areas with an SbAI are mainly distributed in the Pearl River Delta. The study by He et al. [52] only analyzed the annual NDVI data for the years before 2015. We obtained NDVI data for recent years and performed a correlation analysis with the SbAI. The results are still consistent.
In addition, Zhang et al. [39] found that the Pearl River Basin has become drier in the monsoon season and wetter in the dry season. Areas with relatively low rainfall are distributed in the western part of the basin, while humid areas with high rainfall are distributed in the southeastern part of the basin. The results of this study show that, in the monsoon season, the basin became drier (the area with severer drought condition became larger), while in the dry season, the basin became wetter (the area with a wetter condition became larger). These conclusions are similar to Zhang’s findings.
Our results indicated that the Pearl River Basin presents a wetter trend over the past two decades. As discussed in Section 4.1, the wetter trend presented by the SbAI is affected by natural precipitation and human activities. For example, human activities can change land use, among which afforestation and the resulting water storage capacity are paramount [53]. In the Pearl River Delta, due to fast urbanization, a large number of cultivated land and forests have been transformed into impervious areas. Studies [54] have shown that the cultivated land, forests and waters in the Pearl River Delta decreased by 15.64%, 2.9% and 7.45%, respectively, from 2000 to 2015, while the impervious surface increased by 42.1%, of which the transfer ratios of the above three land use types are 23.09%, 11.29% and 7.04%, respectively. The studies by Zhang et al. and Chen et al. have shown [55,56] that the Pearl River Delta is a high-risk area for decreasing water storage capacity. In this study, the Pearl River Delta region was reported to gradually be drier. This drought is not due to a reduction in natural rainfall, but rather a reduction in water storage capacity caused by human activities.

4.3. Implications for Sustainable River Basin Management

In August 2022, as we wrote this paper, the world was experiencing the worst droughts in recent decades. The droughts across the Northern Hemisphere—expanding from the USA to Europe and China—are further adding pressure to global large river ecosystems already under stress. In recent years, climate change has caused droughts to occur more frequently [57,58]. Based on the SbAI and satellite images, this study analyzed the spatiotemporal changes in drought conditions over the past 20 years, providing a valuable reference drought assessment across the Pearl River Basin. Our research results also provide consultative information for watershed management, such as agricultural irrigation, water resource management, and urbanization. Based on our findings, the headwaters of the Pearl River have become wetter and may sustain more vegetation and agricultural activities. Crops planted in the dry season should be prioritized. However, most areas of the Pearl River Basin have displayed a slight trend towards becoming drier in the monsoon season, which may be related to the rise in monsoon temperatures caused by climate change [38]. In the monsoon season, natural vegetation and human activities have a high demand for water resources. A more scientific management of water resources is therefore required. Our study also indicates that that uncontrolled human activities such as excessive water withdrawal for irrigation and industrial use and fast urbanization to increase impervious surfaces and reduce water storage capacity can worsen drought conditions. In the Pearl River Delta region, with rapid urbanization and industrialization, more scientific management for urban development and more appropriate allocation of water resources are required for sustainable development.

5. Conclusions

In this study, we calculated the daily SbAI for the whole Pearl River Basin for the period 2001–2021 using MODIS surface reflectance and surface temperature data, and further derived the annual and monthly SbAI. We investigated the spatiotemporal changes in drought conditions in the Pearl River Basin. Based on the study results, we obtained the following findings:
(1)
The inter-annual SbAI in the Pearl River Basin exhibited a significant downward trend. The decreasing trend in the SbAI was statistically significant in the dry season, and the monsoon season also showed a decreasing except for an insignificant increase in June.
(2)
In the dry season, areas with droughts are mainly located in sub-regions of Areas 1, 2, and 3; as the flood season arrives, the basin receives more water and gradually becomes humid, and the total area with droughts decreases rapidly.
(3)
In the past 20 years, most parts of the Pearl River Basin have become wetter. However, the drought conditions illustrated an insignificant increase in the monsoon season, corresponding to a more statistically significant shrinking in the dry season.
(4)
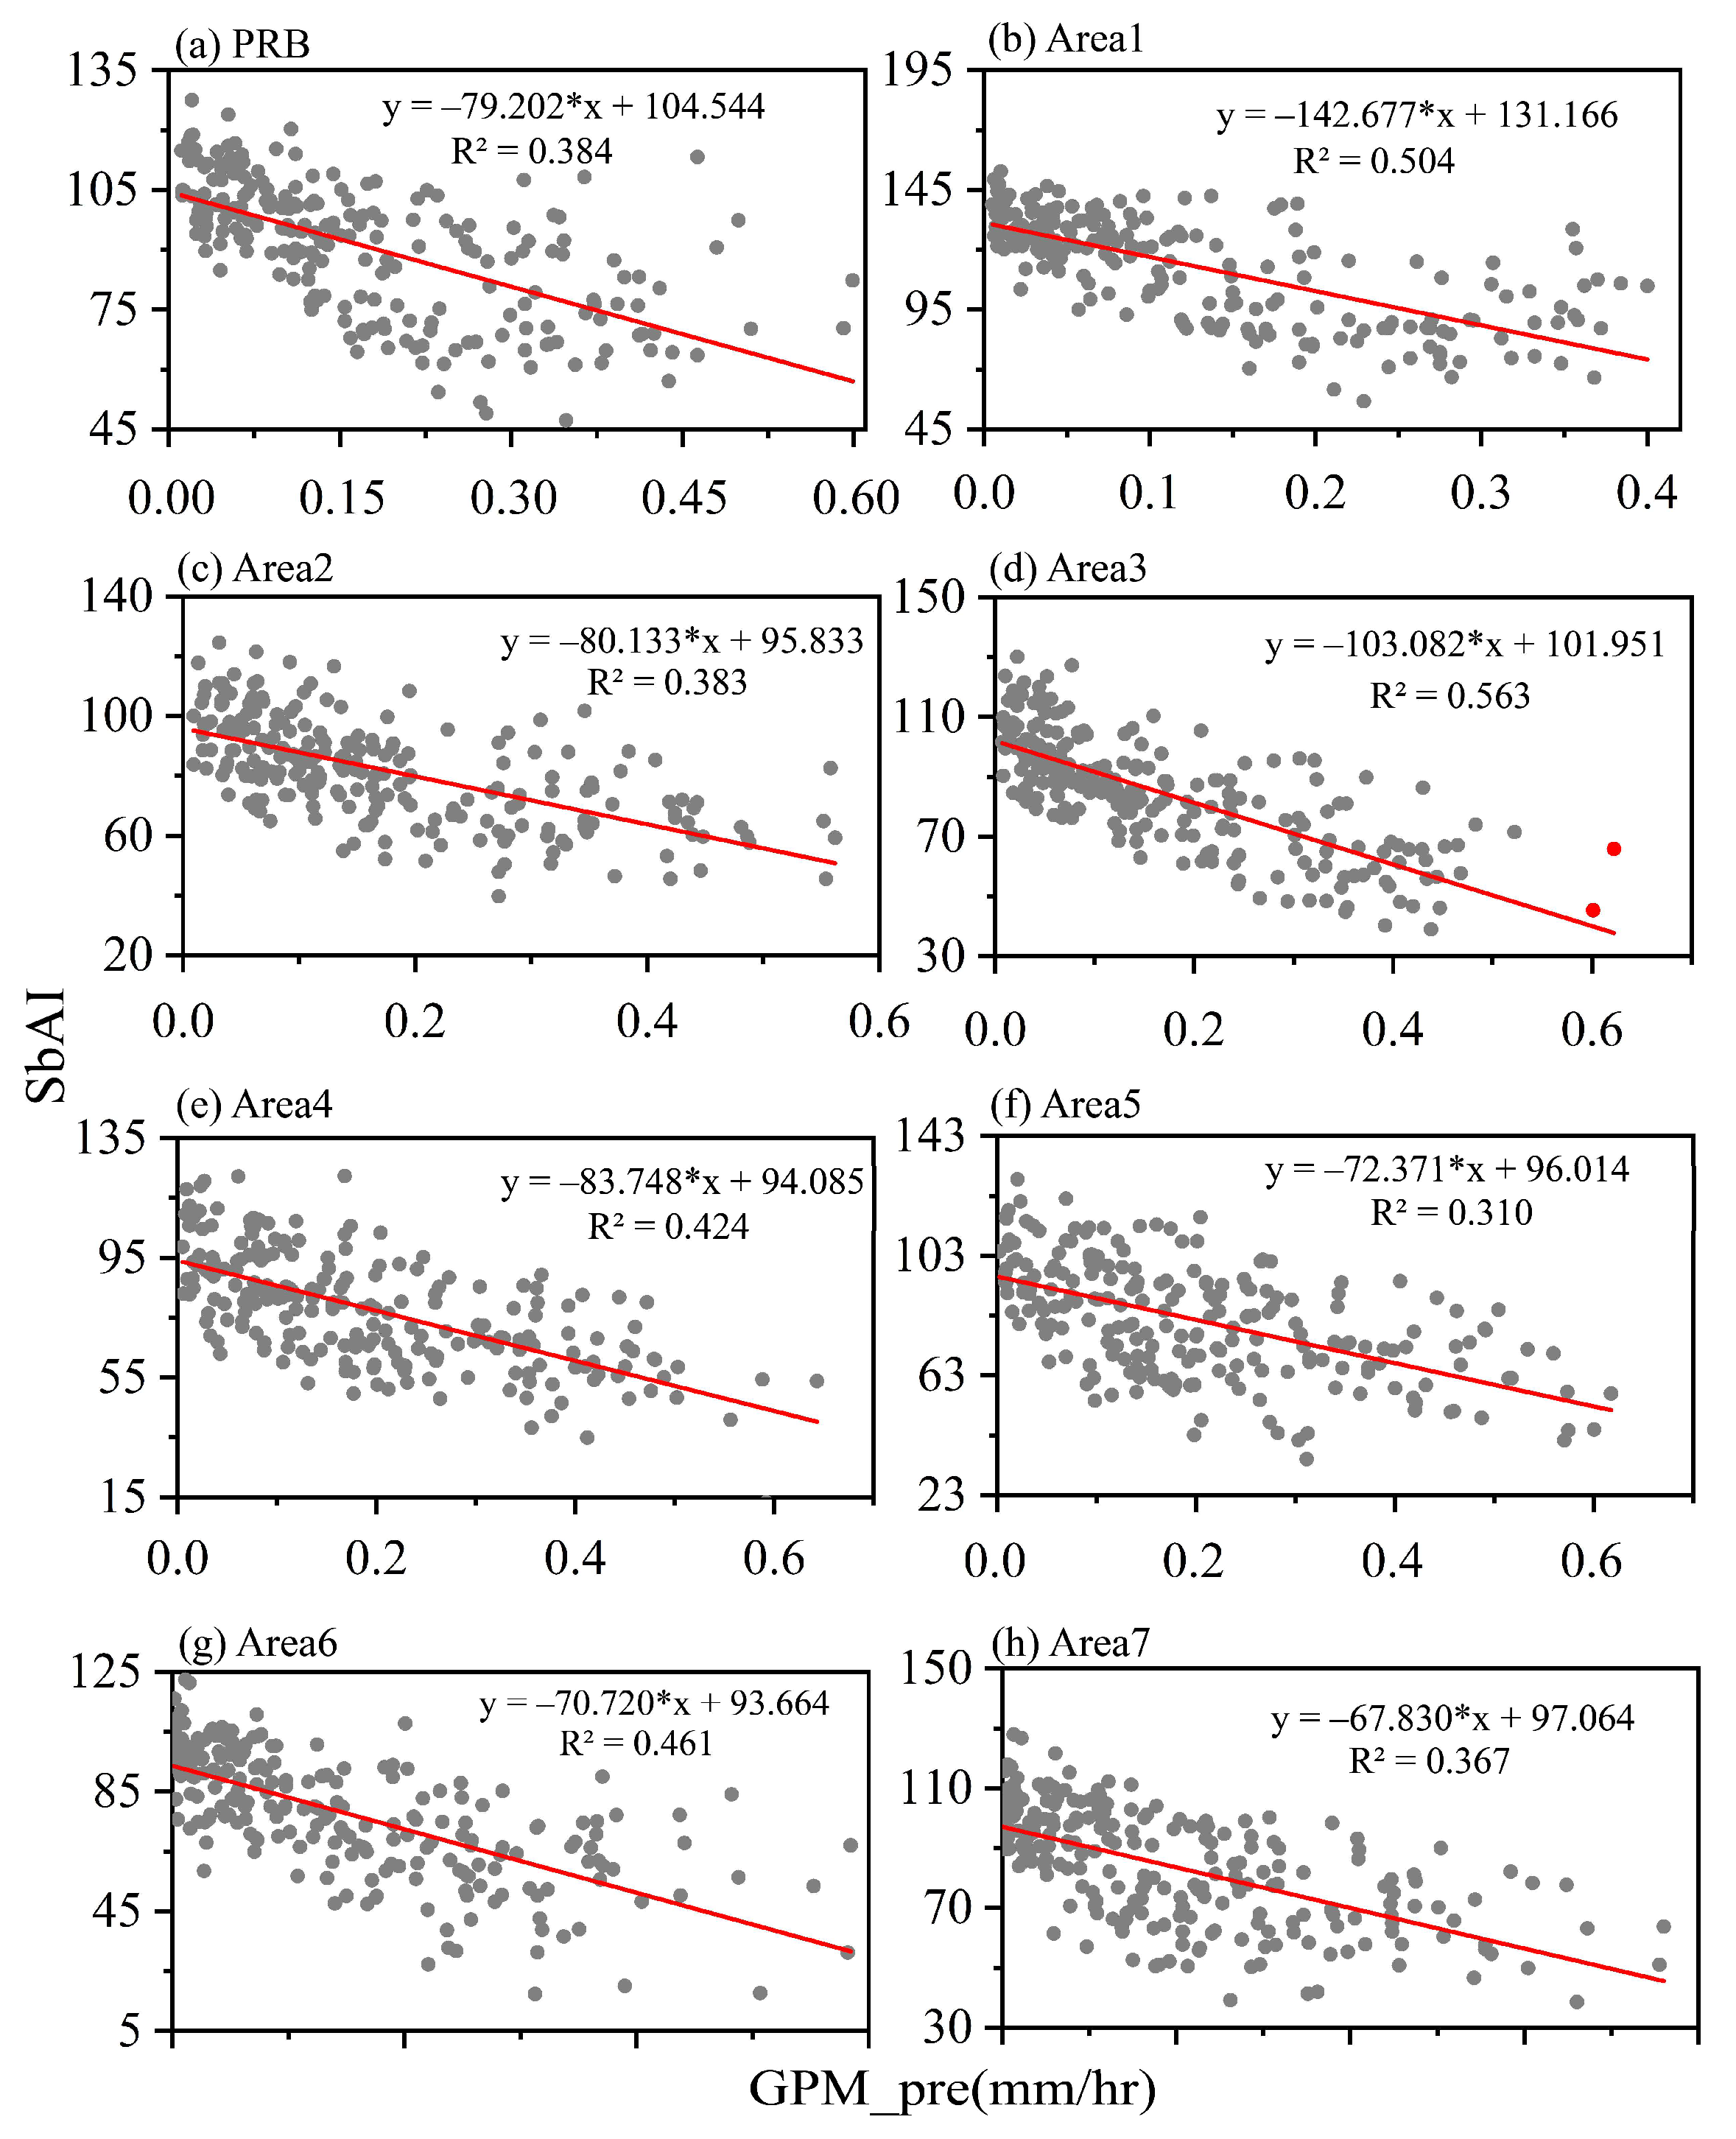
Overall, the Pearl River Basin has become wetter over the past two decades, which may be the result of natural and human factors (i.e., increased precipitation and vegetation coverage); areas with increased drought conditions were likely impacted by human activities such as water withdrawal for irrigation and industrial uses, fast urbanization and increased impervious surfaces and the resulting reduction in water storage capacity.

Author Contributions

Conceptualization, Kunlong Niu and Xiankun Yang; formal analysis, Kunlong Niu and Xiankun Yang; data curation, Kunlong Niu; writing—original draft preparation, Kunlong Niu; writing—review and editing, Xiankun Yang, Junliang Qiu, Edward Park, Shirong Cai, Wenxin Zhang and Xiaolin Mu; supervision, Xiankun Yang. All authors have read and agreed to the published version of the manuscript.

Funding

The National Natural Science Foundation of China (Grant No.: 41871017) and the Natural Science Foundation of Guangdong Province (Grant No.: 2021A1515011533) funded this research.

Data Availability Statement

The data presented in this study are available on request from the corresponding author.

Acknowledgments

The authors are very grateful to the NASA for providing the MODIS products. Thanks also to the NASA and the JAXA for providing the GPM precipitation dataset.

Conflicts of Interest

The authors declare no conflict of interest.

References

  1. West, H.; Quinn, N.; Horswell, M. Remote sensing for drought monitoring & impact assessment: Progress, past challenges and future opportunities. Remote Sens. Environ. 2019, 232, 111291. [Google Scholar]
  2. Tabari, H. Climate change impact on flood and extreme precipitation increases with water availability. Sci. Rep. 2020, 10, 13768. [Google Scholar] [CrossRef] [PubMed]
  3. Cook, B.I.; Mankin, J.S.; Anchukaitis, K.J. Climate change and drought: From past to future. Curr. Clim. Chang. Rep. 2018, 4, 164–179. [Google Scholar] [CrossRef]
  4. Wilhite, D.A. Drought as a natural hazard: Concepts and definitions. In Drought: A Global Assessment; University of Nebraska-Lincoln: Lincoln, NE, USA, 2000. [Google Scholar]
  5. Palmer, W.C. Meteorological Drought; US Department of Commerce, Weather Bureau: Washington, DC, USA, 1965; Volume 30. [Google Scholar]
  6. McKee, T.B.; Doesken, N.J.; Kleist, J. The relationship of drought frequency and duration to time scales. In Proceedings of the 8th Conference on Applied Climatology, Anaheim, CA, USA, 17–22 January 1993; pp. 179–183. [Google Scholar]
  7. Vicente-Serrano, S.M.; Beguería, S.; López-Moreno, J.I. A multiscalar drought index sensitive to global warming: The standardized precipitation evapotranspiration index. J. Clim. 2010, 23, 1696–1718. [Google Scholar] [CrossRef] [Green Version]
  8. Kogan, F.N. Application of vegetation index and brightness temperature for drought detection. Adv. Space Res. 1995, 15, 91–100. [Google Scholar] [CrossRef]
  9. Rhee, J.; Im, J.; Carbone, G.J. Monitoring agricultural drought for arid and humid regions using multi-sensor remote sensing data. Remote Sens. Environ. 2010, 114, 2875–2887. [Google Scholar] [CrossRef]
  10. Zhang, A.; Jia, G. Monitoring meteorological drought in semiarid regions using multi-sensor microwave remote sensing data. Remote Sens. Environ. 2013, 134, 12–23. [Google Scholar] [CrossRef]
  11. Fayne, A. Current Environment of the Offshore Voluntary Disclosure Initiative (OVDI) Opt-out and Civil Exam Cases. J. Tax Pract. Proced. 2013, 15, 21. [Google Scholar]
  12. Dehghan, S.; Salehnia, N.; Sayari, N.; Bakhtiari, B. Prediction of meteorological drought in arid and semi-arid regions using PDSI and SDSM: A case study in Fars Province, Iran. J. Arid Land 2020, 12, 318–330. [Google Scholar] [CrossRef]
  13. Trenberth, K.E.; Dai, A.; Van Der Schrier, G.; Jones, P.D.; Barichivich, J.; Briffa, K.R.; Sheffield, J. Global warming and changes in drought. Nat. Clim. Chang. 2014, 4, 17–22. [Google Scholar] [CrossRef]
  14. Gidey, E.; Dikinya, O.; Sebego, R.; Segosebe, E.; Zenebe, A. Modeling the spatio-temporal meteorological drought characteristics using the standardized precipitation index (SPI) in raya and its environs, northern Ethiopia. Earth Syst. Environ. 2018, 2, 281–292. [Google Scholar] [CrossRef]
  15. Spinoni, J.; Naumann, G.; Carrao, H.; Barbosa, P.; Vogt, J. World drought frequency, duration, and severity for 1951–2010. Int. J. Climatol. 2014, 34, 2792–2804. [Google Scholar] [CrossRef]
  16. Hernandez, E.A.; Uddameri, V. Standardized precipitation evaporation index (SPEI)-based drought assessment in semi-arid south Texas. Environ. Earth Sci. 2014, 71, 2491–2501. [Google Scholar] [CrossRef]
  17. Chiang, F.; Mazdiyasni, O.; AghaKouchak, A. Evidence of anthropogenic impacts on global drought frequency, duration, and intensity. Nat. Commun. 2021, 12, 2754. [Google Scholar] [CrossRef]
  18. Dutta, D.; Kundu, A.; Patel, N.; Saha, S.; Siddiqui, A. Assessment of agricultural drought in Rajasthan (India) using remote sensing derived Vegetation Condition Index (VCI) and Standardized Precipitation Index (SPI). Egypt. J. Remote Sens. Space Sci. 2015, 18, 53–63. [Google Scholar] [CrossRef] [Green Version]
  19. Huang, W.; Yang, X.; Li, M.; Zhang, X.; Wang, M.; Dai, S.; Ma, J. Evolution characteristics of seasonal drought in the south of China during the past 58 years based on standardized precipitation index. Trans. Chin. Soc. Agric. Eng. 2010, 26, 50–59. [Google Scholar]
  20. Hänsel, S.; Ustrnul, Z.; Łupikasza, E.; Skalak, P. Assessing seasonal drought variations and trends over Central Europe. Adv. Water Resour. 2019, 127, 53–75. [Google Scholar] [CrossRef]
  21. Dong, Z.; Liu, H.; Baiyinbaoligao; Hu, H.; Khan, M.Y.A.; Wen, J.; Chen, L.; Tian, F. Future projection of seasonal drought characteristics using CMIP6 in the Lancang-Mekong River Basin. J. Hydrol. 2022, 610, 127815. [Google Scholar] [CrossRef]
  22. Jiménez-Muñoz, J.C.; Mattar, C.; Barichivich, J.; Santamaría-Artigas, A.; Takahashi, K.; Malhi, Y.; Sobrino, J.A.; van der Schrier, G. Record-breaking warming and extreme drought in the Amazon rainforest during the course of El Niño 2015–2016. Sci. Rep. 2016, 6, 33130. [Google Scholar] [CrossRef] [Green Version]
  23. Pramudya, Y.; Onishi, T.; Senge, M.; Hiramatsu, K.; Nur, P.M. Evaluation of recent drought conditions by standardized precipitation index and potential evapotranspiration over Indonesia. Paddy Water Environ. 2019, 17, 331–338. [Google Scholar] [CrossRef]
  24. He, Z.; Xu, S.; Xie, X.; Chen, H. Brief introduction of flood and drought disaster prevention in the Pearl River Basin in 2019. China Flood Drought Manag. 2020, 30, 24–26. [Google Scholar] [CrossRef]
  25. Wu, S.; Huang, F. Summary of flood and drought disaster prevention in the Pearl River Basin in 2021. China Flood Drought Manag. 2021, 31, 25–26, 43. [Google Scholar] [CrossRef]
  26. Qiu, J.; Cao, B.; Park, E.; Yang, X.; Zhang, W.; Tarolli, P. Flood monitoring in rural areas of the Pearl River Basin (China) using Sentinel-1 SAR. Remote Sens. 2021, 13, 1384. [Google Scholar] [CrossRef]
  27. Jing, J.-l.; Xu, Y.; Wang, Y.-f.; Dou, S.-q.; Yin, M. Characteristics of multi-scale drought and flood in the Pearl River Basin from 1960 to 2019. Res. Agric. Mod. 2021, 42, 557–569. [Google Scholar] [CrossRef]
  28. Deng, S.; Chen, T.; Yang, N.; Qu, L.; Li, M.; Chen, D. Spatial and temporal distribution of rainfall and drought characteristics across the Pearl River basin. Sci. Total Environ. 2018, 619–620, 28–41. [Google Scholar] [CrossRef]
  29. Zhang, Q.; Singh, V.P.; Peng, J.; Chen, Y.D.; Li, J. Spatial–temporal changes of precipitation structure across the Pearl River basin, China. J. Hydrol. 2012, 440–441, 113–122. [Google Scholar] [CrossRef]
  30. Liu, B.; Chen, J.; Lu, W.; Chen, X.; Lian, Y. Spatiotemporal characteristics of precipitation changes in the Pearl River Basin, China. Theor. Appl. Climatol. 2016, 123, 537–550. [Google Scholar] [CrossRef]
  31. Hu, M.; Li, Z.; Wang, Y.; Jiao, M.; Li, M.; Xia, B. Spatio-temporal changes in ecosystem service value in response to land-use/cover changes in the Pearl River Delta. Resour. Conserv. Recycl. 2019, 149, 106–114. [Google Scholar] [CrossRef]
  32. Zhang, S.-X.; Zhang, J.-M.; Zhang, W.-K.; Zhang, D.-N.; Fu, J.-Y.; Zang, C.-F. Spatiotemporal variability characteristics and driving forces of land use in the Pan-Pearl River Basin, China. J. Appl. Ecol. 2020, 31, 573–580. [Google Scholar]
  33. Kimura, R.; Moriyama, M. Application of a satellite-based aridity index in dust source regions of northeast Asia. J. Arid Environ. 2014, 109, 31–38. [Google Scholar] [CrossRef]
  34. Liang, S. Quantitative Remote Sensing of Land Surfaces; John Wiley & Sons: Hoboken, NJ, USA, 2005. [Google Scholar]
  35. Mann, H.B. Nonparametric tests against trend. Econometrica 1945, 13, 245–259. [Google Scholar] [CrossRef]
  36. Sen, P.K. Estimates of the regression coefficient based on Kendall’s tau. J. Am. Stat. Assoc. 1968, 63, 1379–1389. [Google Scholar] [CrossRef]
  37. Pettit, A. Anon-parametric approach to the change-point detection. Appl. Stat. 1979, 28, 126–135. [Google Scholar] [CrossRef]
  38. Qiu, J.; Yang, X.; Cao, B.; Chen, Z.; Li, Y. Effects of urbanization on regional extreme-temperature changes in China, 1960–2016. Sustainability 2020, 12, 6560. [Google Scholar] [CrossRef]
  39. Zhang, Q.; Xu, C.-Y.; Zhang, Z. Observed changes of drought/wetness episodes in the Pearl River basin, China, using the standardized precipitation index and aridity index. Theor. Appl. Climatol. 2009, 98, 89–99. [Google Scholar] [CrossRef]
  40. Peng, D.; Zhou, T. Why was the arid and semiarid northwest China getting wetter in the recent decades? J. Geophys. Res. Atmos. 2017, 122, 9060–9075. [Google Scholar] [CrossRef]
  41. Liang, C.; Chen, T.; Dolman, H.; Shi, T.; Wei, X.; Xu, J.; Hagan, D.F.T. Drying and wetting trends and vegetation covariations in the drylands of China. Water 2020, 12, 933. [Google Scholar] [CrossRef] [Green Version]
  42. Li, H.; Liu, F.; Zhang, S.; Zhang, C.; Zhang, C.; Ma, W.; Luo, J. Drying–Wetting Changes of Surface Soil Moisture and the Influencing Factors in Permafrost Regions of the Qinghai-Tibet Plateau, China. Remote Sens. 2022, 14, 2915. [Google Scholar] [CrossRef]
  43. Kimura, R.; Moriyama, M. Recent trends of annual aridity indices and classification of arid regions with satellite-based aridity indices. Remote Sens. Earth Syst. Sci. 2019, 2, 88–95. [Google Scholar] [CrossRef]
  44. Kimura, R.; Moriyama, M. Determination by MODIS satellite-based methods of recent global trends in land surface aridity and degradation. J. Agric. Meteorol. 2019, 75, 153–159. [Google Scholar] [CrossRef] [Green Version]
  45. Kimura, R.; Moriyama, M. Use of a modis Satellite-based aridity index to monitor drought conditions in Mongolia from 2001 to 2013. Remote Sens. 2021, 13, 2561. [Google Scholar] [CrossRef]
  46. Xia, X.; Liu, Y.; Jing, W.; Yao, L. Assessment of Four Satellite-Based Precipitation Products Over the Pearl River Basin, China. IEEE Access 2021, 9, 97729–97746. [Google Scholar] [CrossRef]
  47. Kousari, M.; Ekhtesasi, M.; Malekinezhad, H. Investigation of long term drought trend in semi-arid, arid and hyper-arid regions of the world. Desert Manag. 2017, 4, 36–53. [Google Scholar]
  48. Zarei, A.R. Evaluation of drought condition in arid and semi-arid regions, using RDI index. Water Resour. Manag. 2018, 32, 1689–1711. [Google Scholar] [CrossRef]
  49. Mohammed, R.; Scholz, M. Climate variability impact on the spatiotemporal characteristics of drought and Aridityin arid and semi-arid regions. Water Resour. Manag. 2019, 33, 5015–5033. [Google Scholar] [CrossRef]
  50. Dong, B.; Yu, Y.; Pereira, P. Non-growing season drought legacy effects on vegetation growth in southwestern China. Sci. Total Environ. 2022, 846, 157334. [Google Scholar] [CrossRef] [PubMed]
  51. Wei, W.; Zhang, H.; Zhou, J.; Zhou, L.; Xie, B.; Li, C. Drought monitoring in arid and semi-arid region based on multi-satellite datasets in northwest, China. Environ. Sci. Pollut. Res. 2021, 28, 51556–51574. [Google Scholar] [CrossRef] [PubMed]
  52. He, C.; Ma, B.; Jing, J.; Xu, Y.; Dou, S. Spatial-Temporal Variation and Future Changing Trend of NDVI in the Pearl River Basin from 1982 to 2015. In Proceedings of the International Conference on Human Centered Computing, Virtual Event, 14–15 December 2020; pp. 209–219. [Google Scholar]
  53. Liu, Y.; Tian, J.; Liu, R.; Ding, L. Influences of Climate Change and Human Activities on NDVI Changes in China. Remote Sens. 2021, 13, 4326. [Google Scholar] [CrossRef]
  54. Hu, P.; Li, F.; Sun, X.; Liu, Y.; Chen, X.; Hu, D. Assessment of Land-Use/Cover Changes and Its Ecological Effect in Rapidly Urbanized Areas—Taking Pearl River Delta Urban Agglomeration as a Case. Sustainability 2021, 13, 5075. [Google Scholar] [CrossRef]
  55. Zhang, Q.; Xiao, M.; Singh, V.P.; Li, J. Regionalization and spatial changing properties of droughts across the Pearl River basin, China. J. Hydrol. 2012, 472–473, 355–366. [Google Scholar] [CrossRef]
  56. Chen, Y.D.; Zhang, Q.; Xiao, M.; Singh, V.P. Transition probability behaviors of drought events in the Pearl River basin, China. Stoch. Environ. Res. Risk Assess. 2017, 31, 159–170. [Google Scholar] [CrossRef]
  57. Liu, S.; Shi, H.; Niu, J.; Chen, J.; Kuang, X. Assessing future socioeconomic drought events under a changing climate over the Pearl River basin in South China. J. Hydrol. Reg. Stud. 2020, 30, 100700. [Google Scholar] [CrossRef]
  58. Duan, R.; Huang, G.; Li, Y.; Zhou, X.; Ren, J.; Tian, C. Stepwise clustering future meteorological drought projection and multi-level factorial analysis under climate change: A case study of the Pearl River Basin, China. Environ. Res. 2021, 196, 110368. [Google Scholar] [CrossRef] [PubMed]
Figure 1. Geographical configuration of the PRB and its natural characteristics: (a) rough location of the PRB; (b) topographical characteristics of the PRB; (c) land use configuration in the PRB in 2020; (d) distribution of the annual precipitation in the PRB from 2001 to 2019.
Ijgi 11 00541 g001
Figure 2. Annual and monthly changing trends of the SbAI in the PRB: (al) Monthly SbAI trend; (m) Annual SbAI trend; (n) Monthly SbAI changing rate. Note: * represents multiplication sign; Jan, Feb, Mar, etc. is the abbreviation of each month.
Ijgi 11 00541 g002
Figure 3. Annual and monthly spatial patterns of the SbAI in the PRB: (a) Spatial patterns of annual SbAI, 2001–2021; (bm) spatial patterns of the monthly SbAI, 2001–2021. Note: numbers 1–7 represent 7 areas described in Section 2.1; Jan, Feb, Mar, etc. is the abbreviation of each month, respectively.
Ijgi 11 00541 g003
Figure 4. Monthly and annual statistics on the areal proportion of the SbAI in different ranges. Note: Jan, Feb, Mar, etc. is the abbreviation of each month, respectively.Jan etc. is the abbreviation of each month.
Ijgi 11 00541 g004
Figure 5. Monthly and annual trends of the SbAI in the PRB during the period 2001–2021 based on the Mann–Kendall test: (a) Annual trends of the SbAI during the period 2001–2021; (bm) Monthly trends of the SbAI, 2001–2021. Note: numbers 1–7 represent 7 areas described in Section 2.1; Jan, Feb, Mar, etc. is the abbreviation of each month, respectively. (SD: significantly drier trend; ND: not significantly drier trend; NW: not significantly wetter trend; SW: significantly wetter trend).
Ijgi 11 00541 g005
Figure 6. The areal proportion of different trends in the PRB. Note: Jan etc. is the abbreviation of each month. (SD: significantly drier trend; ND: not significantly drier trend; NW: not significantly wetter trend; SW: significantly wetter trend).
Ijgi 11 00541 g006
Figure 7. Areal proportion of parts in different ranges of the SbAI in Area 1. Note: Jan etc. is the abbreviation of each month.
Ijgi 11 00541 g007
Figure 8. The areal proportions for different trends in Area 1. Note: Jan etc. is the abbreviation of each month. (SD: significantly drier trend; ND: not significantly drier trend; NW: not significantly wetter trend; SW: significantly wetter trend).
Ijgi 11 00541 g008
Figure 9. Proportion of areas in different SbAI ranges in Area 6. Note: Jan etc. is the abbreviation of each month.
Ijgi 11 00541 g009
Figure 10. The areal proportion of different trends in Area 6. Note: Jan etc. is the abbreviation of each month. (SD: significantly drier trend; ND: not significantly drier trend; NW: not significantly wetter trend; SW: significantly wetter trend).
Ijgi 11 00541 g010
Figure 11. (a) Correlation analysis between GPM data and precipitation data provided by the PRWCC in PRB; (bh) Correlation analysis between GPM data and precipitation data provided by the PRWCC in Areas 1–7. Note: * represents multiplication sign.
Ijgi 11 00541 g011
Figure 12. (a) Correlation analysis between SbAI and GPM data series in the PRB; (bh) Correlation analysis between SbAI and GPM data series in Areas 1–7. Note: * represents multiplication sign.
Ijgi 11 00541 g012
Figure 13. Comparisons of SbAI and NDVI results: (a) Comparison of temporal trends; (b) Correlation analysis of the two datasets. Note: * represents multiplication sign.
Ijgi 11 00541 g013
Table 1. Trend analysis for the monthly and annual trends of the SbAI in the PRB during the period 2001–2021.
PRBArea 1Area 2Area 3Area 4Area 5Area 6Area 7
zSlopeYearzSlopeYearzSlopeYearzSlopeYearzSlopeYearzSlopeYearzSlopeYearzSlopeYear
Annual−3.29 ***−0.602005−3.35 ***−0.802013−3.23 ***−0.702010−2.75 ***−0.652003−2.51 **−0.472010−2.45 **−0.422007−2.14 **−0.422010−3.47 ***−0.762007
January−2.81 ***−0.692010−2.45 **−0.942014−1.06−0.502014−1.24−0.592015−0.27−0.152014−0.09−0.042015−1.54−0.412009−1.66 **−0.822015
February−2.75 ***−0.692017−2.26 ***−0.722014−1.18−0.542008−1.54−0.372013−1.72 *−0.672005−0.94−0.242013−2.02 **−0.792004−1.66 *−0.582012
March−1.96 **−0.452008−1.12−0.422010−0.94−0.602008−2.26 **−1.172008−0.15−0.092006−0.39−0.302011−1.66 *−0.672007−2.08 **−0.762005
April−1.06−0.302009−3.11 ***−1.0820130.000.002015−1.72 *−0.4920100.270.2620060.630.262017−0.94−0.5020080.330.122017
May−1.66 *−0.512011−2.14 **−1.232012−1.60−0.782008−3.35 ***−1.262012−0.88−0.462013−1.78 *−1.042011−1.42−0.632013−2.14 **−0.972013
June0.750.3420080.690.1720170.330.3420120.090.1020120.270.1520090.820.652010−0.63−0.442006−0.39−0.222010
July−0.51−0.292008−1.12−0.452008−1.54−0.382011−0.45−0.212006−1.90 *−0.762016−1.06−0.482008−1.36−0.942016−0.51−0.132008
August−0.57−0.112012−0.21−0.122018−0.45−0.142012−1.00−0.342012−0.33−0.0920170.750.232005−1.00−0.4320080.090.022019
September−2.08 **−0.572007−1.90 *−0.742005−2.08 **−0.942007−1.00−0.382007−0.75−0.2620070.330.072007−0.03−0.032007−1.66 *−0.492006
October−1.30−0.342011−0.39−0.422006−0.94−0.3520110.00−0.012005−2.02 **−0.662015−1.66 *−0.572008−1.12−0.402018−2.26 **−0.882015
November−3.77 ***−1.352011−2.81 ***−0.872011−3.05 ***−1.402010−2.87 ***−1.472010−2.87 ***−1.632010−3.17 ***−1.482012−4.14 ***−1.652008−4.14 ***−1.722010
December−2.81 ***−0.882011−2.51 **−0.692009−2.51 **−0.942009−1.90 *−0.982014−1.78 *−0.702014−2.26 **−0.732008−1.90 *−0.542017−2.02 **−0.892014
Note: trends were calculated by the M–K test (z), the magnitude by the Sen test (slope), and the starting trend by the Pettitt test (year); *** means significance with p < 0.01; ** means significance with p < 0.05; * means significance with p < 0.1.
Table 2. Drought events detected by the SbAI.
Start YearStart MonthEnd YearEnd MonthDurationSeverityIntensity
20011200122211.42105.71
200111200213356.69118.9
200210200336642.96107.16
200311200424431.15107.79
200410200536662.99110.5
200511200635528.28105.66
200611200735560.9112.18
200711200813342.58114.19
20083200842219.19109.59
200811200924443.07110.77
200911201024428.2107.05
2010112010122217.74108.87
201111201224416.95104.24
201312201445536.69107.34
201412201512213.85106.92
201712201812212.31106.16
Table 3. Monthly mean SbAI and changing rates for Area 1 and Area 6, 2001–2021.
AnnualJanuaryFebruaryMarchAprilMayJuneJulyAugustSeptemberOctoberNovemberDecember
Area 1mean124.30130.21131.59127.53130.67128.1999.1381.3384.1192.87105.62122.58128.33
slope−0.77−0.93−0.69−0.33−0.96−1.100.38−0.46−0.07−0.75−0.20−0.88−0.83
Area 6mean87.8696.7794.4085.3680.6567.0555.2749.9258.1164.5778.2293.8898.97
slope−0.40−0.51−0.79−0.77−0.43−0.75−0.02−0.69−0.44−0.14−0.45−1.56−0.60
Publisher’s Note: MDPI stays neutral with regard to jurisdictional claims in published maps and institutional affiliations.

