Abstract
Tourism is playing an important role in the economic development of the Qinghai-Tibet Plateau (QTP). To better develop tourism in this region, the spatial heterogeneity of influencing factors on tourism needs to be studied. Using the spatial distribution of tourism potential from social media data, this paper analyzes the influencing factors of tourism on the QTP from the perspective of spatial heterogeneity. We extract microblogs related to travel topics connected to the QTP in 2017 from Sina Weibo to capture tourism potential. Then, factors considered from six aspects (tourism resources, amenities, transportation, geography, population, and the economy) are selected, and a geographic detector (Geodetector) is employed to detect the explanatory power of these factors for tourism potential. The results indicate different influential tourism factors in Qinghai and Tibet. In Qinghai, the main factors are hotels, tourist attractions, and road network density, and the explanatory power of the factors mainly comes from eastern and western Qinghai. In Tibet, the main factors are road network density, regional GDP (Gross Domestic Product), and urban land. It is suggested that tourism in the central region of Qinghai can be improved by enhancing the publicity and utilization of tourism resources, and Tibet should enhance tourism resource utilization and improve tourism amenities and infrastructure.
1. Introduction
The Qinghai-Tibet Plateau (QTP) located in East Asia is the highest plateau in China and in the world. It has rich natural plateau landscapes, unique Tibetan cultural landscapes, and is known as “the last pure land of mankind”. The special geographical conditions and unique natural and cultural landscapes attract a large number of tourists from home and abroad, creating a “special tourism industry” in the Qinghai-Tibet region. Due to the implementation of China’s reform and opening-up policy, tourism on the QTP began to develop rapidly in 2000. Since the opening of the Qinghai-Tibet Railway connecting inland China and Lhasa in 2006, the number of tourists has increased rapidly. Tourism has become an important part of QTP economic development and ecological protection that cannot be ignored [1].
In the broad region of the QTP, there are various landscapes, multiple nations, and diverse religions that form a variety of tourism resources. This causes regional differences in tourism activities and the imbalanced development of tourism on the QTP. Knowing the main impact factors in different regions may provide important guidance for the development of tourism on the QTP. Researchers have tried to study many aspects of the tourism industry on the QTP. The author of [2] analyzed the effect of the Qinghai-Tibet Railway on promoting the tourism industry of the QTP from the perspective of tourists. Wang et al. [3] employed panel data to analyze the interaction between the tourism economy and the ecological environment in the Qinghai-Tibet region. Furthermore, the influencing factors of tourism income on the QTP were explored with statistical analysis methods, such as gray correlation and principal component analysis [4,5,6]. The factors affecting tourism have different spatial distributions, so the study of determining factors should take spatial variations into consideration. However, most researchers have studied tourism on the QTP without considering spatial differences because usually, tourism statistic data lack spatial distribution.
Recently, with the development of technology, many new data types beyond statistical data, such as positioning data, social media data, and travel blogs, are being continuously collected. These user-generated data are georeferenced and can be used to predict the spatial distribution of tourists. For example, Shen [7] analyzed the spatial-temporal behavior of tourists by using metadata of georeferenced photos posted by tourists; Xu et al. [8] analyzed trends of human activity in the off-season and peak tourism season on the QTP with Tencent positioning data. With these georeferenced data, the study of geographical strata of tourism factors has become possible.
In this paper, we first extracted the spatial distribution of tourism hot spots on the QTP from Sina microblogs (Weibo), a social media platform, and then analyzed the factors influencing the tourism hot spot distribution with the Geodetector model. Geodetector is a statistical method that not only detects spatial stratified heterogeneity but also reveals the driving factors behind it [9]. In addition, a geographical phenomenon is often determined by the interactions of multiple factors. Geodetector employs a measurement, which is the power of determinant to effectively identify the relative importance of each factor and the interactive relations of multiple factors, i.e., are factors independent or interactive, do the interactive relations reduce or enhance the effects, and are the interactive relations linear or nonlinear. For these reasons, the Geodetector model was adopted to analyze the influencing factors of tourism on the QTP. The remainder of the paper is organized as follows. Section 2 reviews the data and impact factors typically used in tourism studies. Section 3 explains the study area and data. Section 4 describes the methodologies and the framework. Section 5 presents the analytical results and discussion. Section 6 draws the conclusions and summarizes the main contributions of this study.
2. Related Works
2.1. Tourism Data
To understand the causes and impacts of regional tourism activities, many researchers try to use different data and methods to conduct comprehensive measurements and analyses from the perspective of different influencing factors.
Before analyzing the different factors influencing tourism activities, it is first necessary to measure tourism activities in different regions. Researchers do this using various data types. First, most studies use traditional tourism data, including questionnaire surveys [2,10,11], quantitative statistics from the statistics department [12,13], etc. However, these data are expensive and time-consuming, and there is a gap between the data collection time and the analysis time [14], and they cannot be used to refine the travel behavior of tourists within the region [15].
With the continuous development of positioning technology, “digital footprints” are widely collected and used to measure human tourism activities [14,16,17], for example, geotagged photographs [18], georeferenced social texts such as Twitter in English or Weibo in Chinese [19], travel diaries [20], and mobile devices [21]. Through these digital footprints, we can deeply understand the behavior characteristics and preferences of tourists and clarify the tourist distribution rules. Researchers have also performed a comparative analysis of several commonly used digital footprints [22]. Most of the existing research on tourism focuses on reading tourists’ social preferences for tourism destinations by using social media data with geographic locations [23,24], identifying tourism hotspots [25,26], mining data of tourist attractions [27], and analyzing the spatial distribution pattern of tourism microblogs [28,29,30]. For example, geotagged Flickr photos were used to explore the relations between destinations with the network analysis method [26] and identify tourism intensification in cities with fractal analysis [30]. Compared with statistical data, digital footprints are conducive to highlighting the heterogeneity of tourism activities in different geographic regions. However, digital footprints have not been fully adopted in the study of tourism impact factors.
2.2. Tourism Impact Factor Analysis
From the perspective of the impact factors of tourism activities, most researchers consider the impact of external environmental factors such as the natural environment, socioeconomic conditions, tourism amenities, and other external environmental factors on the development of tourism in different regions [31,32,33,34,35,36,37,38]. As the driving force of tourism development, tourism resources are the primary consideration when studying the distribution of tourism activities. The location and quantity of tourist attractions to some extent represent the potential of local tourism development [36]. Amenities also play an important role in increasing the attractiveness of tourist attractions and thus should not be neglected; among these, hotels are the most representative service facilities [39]. Studies also found close relations between peer-to-peer accommodation and tourism [40]. Convenient transportation is also a necessary condition for the development of tourism, as it is only possible to develop tourism if the area is accessible [41,42]. Researchers have also found that tourism activities are affected by the local economic level and population [28,29,43]. In addition, the geographic area has been found to have a significant influence on tourism, such as land use type [44]. Encalada et al. studied the relations between tourism clusters and urban land-use types and found that some land-use types can be explanatory factors to tourism, such as public monuments, leisure dorks, and accommodation [24].
Researchers have adopted various methods to measure the impact of each of these factors on local tourism activities. For traditional tourism statistics, researchers use the ANP model [35], statistical analysis [32], stepwise regression and clustering [45], and other means for analysis. For digital footprint data, researchers use the exponential random graph model [46] and complex network index [20] to measure the importance of factors. These methods detect the influential factors across the whole region but do not consider the spatial variation of factors. Wang et al. [9] argued that the determinants of a phenomenon have distinct spatial distributions across geographical units, so an adequate study of determinants should investigate geographical variation. He stratified the determinants of the geographical phenomenon and proposed a geographical detector model, Geodetector, based on spatial variation analysis of the geographical strata for accessing influential factors of geographical phenomena, i.e., the variance within a stratum is smaller than the variance between strata.
3. Study Area and Materials
3.1. Study Area
The Qinghai-Tibet Plateau lies between 26°–39° N latitude and 73°–104° E longitude. Compared with other regions in China, it has special natural conditions and a unique cultural environment, containing important natural and cultural tourism resources. In terms of natural conditions, the QTP has an average elevation of above 4000 m, making it the highest plateau in the world. The air on the plateau is thin, and the atmosphere is dry and clean, with high radiation, low temperature, and low rainfall. There are many natural landscapes on the plateau, such as mountains and lakes, and most of these have religious significance. Restricted by natural conditions, the QTP is sparsely populated, with a population density of approximately four people per square kilometer. The local ethnic minorities are mainly Tibetans, so they have a unique cultural system and living habits based on Tibetan Buddhism and the Bon religion. Because of the long-term inconvenience of access by road, these unique cultures and customs are well preserved. With the development of society and the improvement of people’s living standards, the travel conditions in the Qinghai-Tibet area have been greatly improved, providing favorable conditions for the better development of tourism.
Qinghai Province and the Tibet Autonomous Region are the two provincial-level administrative areas on the QTP and occupy the majority of the plateau, accounting for 73.46% of the area. Due to data availability, this study uses these two administrative areas (Qinghai and Tibet) as the study area, as they can effectively represent and measure the development of tourism on the Qinghai-Tibet Plateau (Figure 1). Since these two administrative areas are different in both physical geographical environment and socio-economical condition, we identify and analyze the tourism factors in Qinghai and Tibet separately.

Figure 1.
Study area and spatial distribution of tourism microblogs in 2017.
3.2. Data
3.2.1. Tourism Data (Weibo)
The tourism resources on the QTP have great development potential within China’s domestic tourism market, as according to official statistics, 99% of current tourists in the Qinghai-Tibet area are mainly from areas within China. Sina Weibo, as China’s largest social network platform, can be used to analyze the distribution of tourism due to its ability to provide the best portraits of domestic Chinese tourists. We crawled all tourists’ Weibo postings located on the QTP in 2017 for analysis. Each Weibo has attributes such as ID, coordinates, release date, place of residence, and text expression.
To illustrate that Weibos can represent people’s travel behavior, we conducted a correlation analysis between the total number of visitors and tourism-related Weibos (see Section 4.2 for the extraction of tourism-related Weibos) in 2017 on a city-level scale, and the Pearson correlation showed a significant positive correlation (r = 0.716, p < 0.01), which means we can use tourism microblogs as a proxy of people’s travel behavior. In addition, due to the obvious differences between seasons in the Qinghai-Tibet region, and because the tourism industry has obvious seasonal characteristics, we divide the annual tourism microblogs by season to analyze the changes in tourism potential in different seasons. To use the Geodetector model to compare the relationship between the distribution of tourism and that of other various factors, for point-shaped microblog data, we use the 20-km grid as the research scale and count the number of microblogs in each grid acting as a response variable on a relatively fine scale.
3.2.2. Influential Factors
When determining the factors that affect the development of tourism in Qinghai and Tibet, the study considers the general influencing factors of tourism development and the particularity of tourism development in the Qinghai-Tibet area. According to previous studies, tourism resources, amenities, transportation, geography, population, and economy are the most considered factors influencing tourism. Therefore, we choose these factors in this study. Tourism resources and amenities are POIs (points of interest) crawled through the Amap API. There are 3460 POIs representing tourist attractions and 10,426 POIs representing hotels (including peer-to-peer accommodations) in Qinghai and Tibet. For transportation factors, road network density and distance to airports were considered. The road network is downloaded from OpenStreetMap (including railways and highways), and its density is calculated (unit: km/km2). The distance to the airport is represented by the 100, 200, 300, 400, 600 km buffers around the airport. For geographic factors, we consider land use type as the factors, specifically, the area proportion of each land use type. We choose urban land, rural land, forest, wetland, desert, grassland, and glacier in this study but not the urban land types from the literature [24] since we study the QTP on a large scale. In addition, due to the high altitude of the QTP, health issues, such as altitude sickness, need to be considered. Therefore, a digital elevation model is also used to capture the factor of altitude in this study. The land use data are obtained from ESA CCI-LC (European Space Agency Climate Change Initiative Land Cover), and the DEM model is obtained from 90-m resolution SRTM data. For population and economic factors, population density, population urbanization rate, and regional GDP (Gross Domestic Product) were chosen as influential factors for analysis on the county scale. The data relating to population comes from the sixth nationwide population census and the data related to the economy comes from the 2015 County Economic Statistics Yearbook. Table 1 describes all the data used.

Table 1.
Data description.
Summarizing the above factors, we selected a total of 6 categories (tourism resources, amenities, transportation, geography, population, and economy) and 15 factors to analyze the potential of tourism on the QTP, among which tourist resources, amenities, transportation, and altitude are direct factors that will directly affect tourists’ decision-making, whereas land use types, economy, and population are factors that may have a potential influence on tourists’ activities, as shown in Figure 2. The maps of influential factors are displayed in Figure 3.
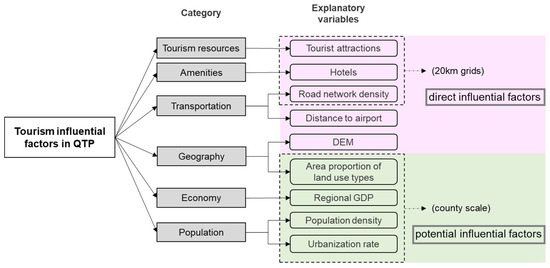
Figure 2.
Classification of influential factors.
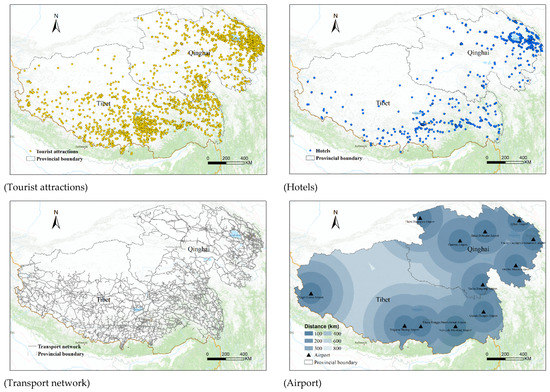
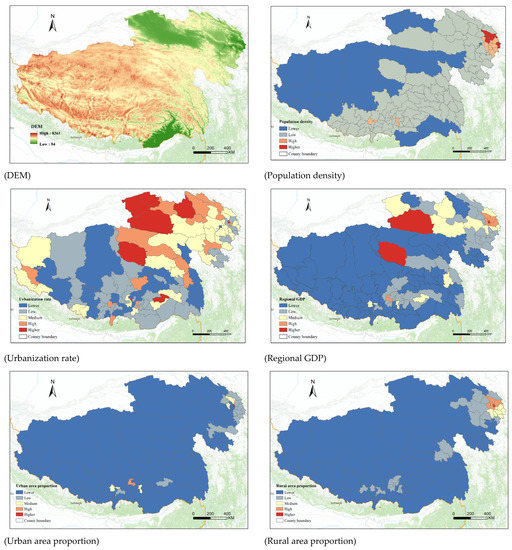
Figure 3.
Map of influential factors.
4. Research Framework and Methodology
4.1. Research Framework
The study process has three steps (Figure 4). First, we extracted tourism microblogs from Sina Weibo using a fine-tuned ERNIE model as the response variable Y. Second, the geographic detector (Geodetector) uses 15 explanatory variables X and response variable Y to calculate the explanatory power of each individual factor and the interaction of the factors with tourism. Finally, the regional and seasonal changes in the distribution of tourism microblogs and the main explanatory factors of the changes were analyzed according to the calculation results, and the main factors affecting tourism in different areas of the QTP were identified.
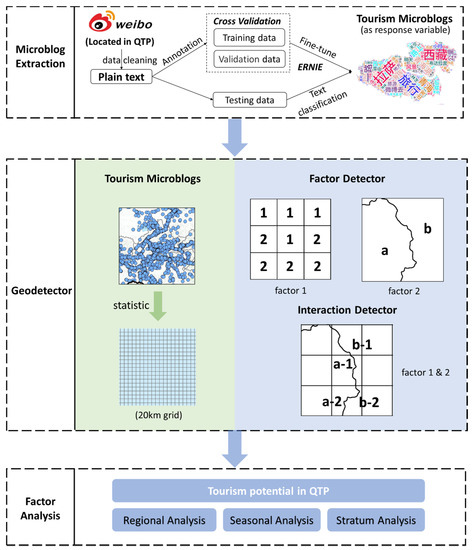
Figure 4.
Research framework and workflow.
4.2. Tourism Microblog Extraction
ERNIE1.0 [47], a pre-training language model in the field of natural language processing proposed by Baidu, is used in this study to extract tourism microblogs. The ERNIE model is a deep learning method for constructing language expression. The model architecture uses a bidirectional multilayer transformer as the encoder, which uses the self-attention mechanism to capture the context of each word. Compared to BERT [48], ERNIE uses entity-level and phrase-level masking strategies to enhance the semantic expression and construct the semantics of short texts such as microblogs. This model effectively improves the accuracy of text classification by overcoming semantic discontinuities in natural languages.
To improve the accuracy of text classification and select tourism microblogs, it is first necessary to clean up the microblogs, remove emoticons, @ tags, html tags, single-word microblogs, etc. Then, we randomly selected 1200 microblogs in Tibet for topic tagging as the training set to fine-tune the model. Referring to the hot topic tags of Sina Weibo, 39 topics were obtained in the tagging process. Due to the limited labeled dataset, in the fine-tuning stage for the pre-training model, a tenfold cross-validation method was adopted to select the fine-tuning model with the highest accuracy for subsequent text classification. After 50 epochs of training, the loss function basically converged, and the model accuracy rate reached its peak, at approximately 78%. The fine-tuned model was used to classify Weibo microblogs, and finally, a total of 126,906 microblogs with tourism topics were extracted. To analyze the seasonal change in tourism influencing factors, tourism microblogs were divided into datasets for spring (March, April, May), summer (June, July, August), autumn (September, October, November), and winter (January, February, December). The results of the microblog division are shown in Table 2.
Table 2.
Number of tourism microblogs by location and season.
4.3. Factor and Interaction Detector
This study used Geodetector to examine the relative importance effects of the 15 influential factors and their interactions on tourism hot spot distributions. The basic concept behind Geodetector is based on the hypothesis that if an explanatory variable has effects on a response variable, then the two variables should have similar spatial distributions [9]. Specifically, in a study area divided into multiple subareas, if the sum of the variances of response variable Y in the subregions is less than the total variance of Y in the whole region, there is spatial differentiation; if the spatial distribution of the response variable Y and explanatory variables X tend to be consistent, there is a statistical correlation between the two variables. In this study, we divide each influential factor into category stratification as subareas, and if one factor has a significant leading role in the distribution of microblogs, it should have a spatial distribution similar to that of Y. If the variance of the response variable Y within a factor category stratification is smaller than its variance between strata, it means that there is stratification heterogeneity.
The stratified heterogeneity is specifically measured by the value (Equation (1)). The q value indicates that factor X can explain 100 × of Y. When the value is 0, the sum of variances under factor stratification is consistent with the sum of the variance for the whole area, which means that the factor has no relationship with the response variable Y. When the value of is 1, the sum of variances under the factor stratification is 0, which means that the factor completely controls the spatial distribution of Y.
where represents the stratum in which the explanatory or response variable is stratified, and represent the number of units in stratum and population Y, respectively, and and represent the variance in stratum and population Y, respectively.
In addition, the value can also be used to evaluate the synergy between factors. By comparing with and , it can be determined whether the interaction of factors increases/weakens the explanatory power of X for Y. The interaction description is shown in Table 3.
Table 3.
Interaction between explanatory variables.
Geodetetor calculates strata in regions, so all data were changed to areal type at first. To unify the analysis scale for point and linear data such as tourism microblogs, tourist attractions, hotels, and road networks, a 20 km grid is used as the basic unit to count the number of point elements and the length of line elements. Statistical data, such as regional GDP and urbanization rate, are county-level vector data. Then, we need to stratify the influential factor data. The influential factors are classified into five strata using the natural breakpoints method (Table 4) since the natural breakpoints method classifies the data based on the breaks that exist in the data and thus find the best arrangement of values [49].
Table 4.
Factor stratification.
The study uses the R version of the Geodetector software. The study mainly analyzes the influencing factors that affect tourism potential considering seasons and regions through factor and interaction detection. When performing factor detection, the and in Equation (1) represent the variance of tourism Weibo numbers in stratum of a certain influential factor and in all areal units, respectively. When performing interactive factor detection, the detected factors are intersected firstly, and then interactive q-statistics of influential factors are calculated according to Equation (1).
5. Results and Discussion
5.1. q-Statistics of Influential Factors
Figure 5 lists the q-statistic values of the 15 influential factors in Qinghai and Tibet as calculated within the 20 km grid which shows that the impact factors in Qinghai and Tibet are different.
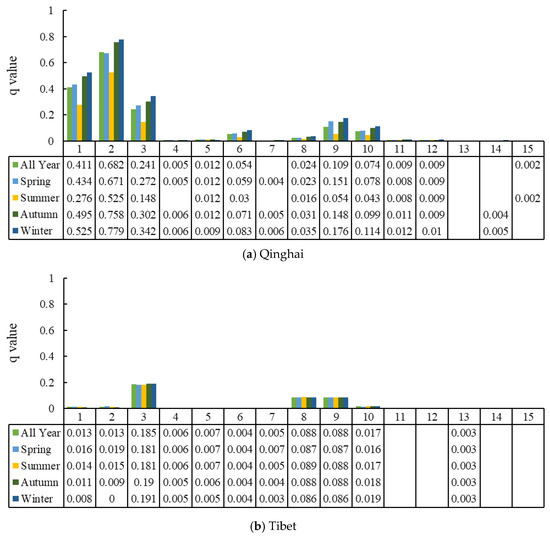
Figure 5.
q-Statistics of influential factors in Qinghai and Tibet (1. tourist attractions; 2. hotels; 3. road network density; 4. distance to airport; 5. altitude; 6. population density; 7. urbanization rate; 8. regional GDP; area proportion: 9. urban, 10. rural, 11. forest, 12. wetland, 13. desert, 14. grassland, 15. glacier; Null: not statistically significant).
5.1.1. q-Statistics of Influential Factors in Qinghai
The explanatory degree of the factors for tourism in Qinghai can be ranked as follows: hotels (0.682) > tourist attractions (0.411) > road network density (0.241) > urban area proportion (0.109) > rural area proportion (0.074) > population density (0.054) > regional GDP (0.024) > altitude (0.012) > forest area proportion (0.009) = wetlands area proportion (0.009) > distance to airport (0.005) > glacier area proportion (0.002). The urbanization rate and other land use types do not show a significant impact on tourism. In Qinghai, hotels, tourist attractions, and road network density, which are direct influential factors, are the most important factors in explaining the distribution of tourism hot spots. This result reflects that most tourism activities have a distribution similar to that of attractions, hotels, and road networks, which means that tourism amenities and infrastructures are well developed and that tourism resources have sufficient attractions for the tourists in Qinghai. In contrast, potential influential factors, such as economy, population, and land use types, have little or even no explanatory power for tourism hot spot distribution.
5.1.2. q-Statistics of Influential Factors in Tibet
For Tibet, the explanatory degree of the factors is ranked as follows: road network density (0.185) > regional GDP (0.088) = urban area proportion (0.088) > rural area proportion (0.017) > tourist attractions (0.013) = hotels (0.013) > altitude (0.007) > distance to airport (0.006) > urbanization rate (0.005) > population density (0.004) > desert area proportion (0.003). Road network density is the most influential factor on tourism hot distribution; however, its explanatory power is relatively low (q = 0.185). The tourism hot spots are mainly distributed along national highways G109, G219, and G318, although, in 2017, a highway network was formed connecting the villages and towns in Tibet. The result indicates that transportation convenience alone cannot bring more tourists. Other tourism facilities, such as hotels, are also important for increasing the attractiveness of tourism resources. Unlike Qinghai, GDP and urban area proportion have stronger explanatory power than tourist attractions and hotels in Tibet, showing that there are more tourism activities in more economically developed areas and that the tourism industry in Tibet is closely related to the economy of local areas, which reflects the dominant role of tourism in Tibet’s economy.
5.1.3. Seasonal Changes of q-Statistics
From the perspective of seasonal change, the lower the temperature is in Qinghai, the stronger the factors’ explanatory power, which implies that people’s activities are limited by cold weather, and the scope of activities is reduced to a fixed range, such as hotels, tourist attractions, and road networks. In Tibet, the seasonal temperature drop does not lead to an increase in the explanatory power of factors except for road network density, which has a small increase in explanatory power. Other factors, such as tourist attractions, hotels, and potential factors, even show a decreased trend in explanatory power. In Tibet, tourism activities are more constrained by the road network in winter.
5.2. Interactive q-Statistics of Influential Factors
Figure 6 lists some of the interaction q-statistic values of the 15 influential factors in Qinghai and Tibet. For all interaction q-statistics for the influential factors, see Table A1 and Table A2 in Appendix A.
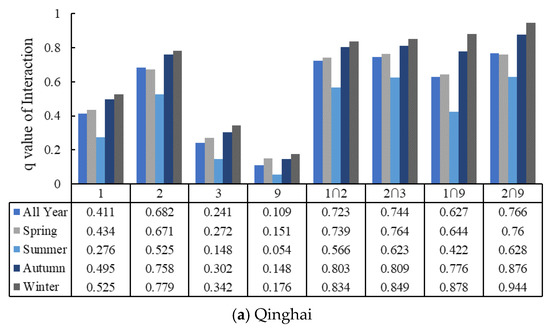
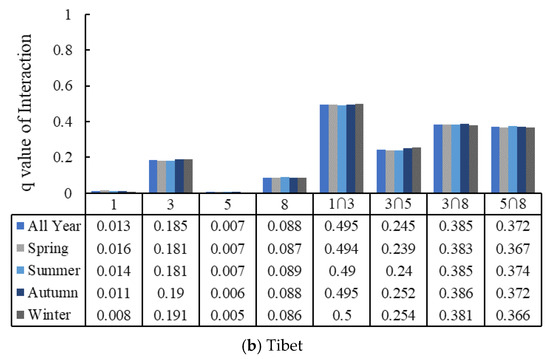
Figure 6.
q-Statistics of influential factor interactions in Qinghai and Tibet (1. tourist attractions; 2. hotels; 3. road network density; 5. altitude; 8. regional GDP; 9. urban area proportion).
5.2.1. Interactive q-Statistics of Influential Factors in Qinghai
Hotels, tourist attractions, and road network density are the three most important factors. The interactions of them show significant binary enhancement. In addition, the interactions between tourist attraction/hotels and potentially influential factors (population, economy, land use type) lead to a significant increase in the explanatory power of the tourist attraction/hotel factor in Qinghai. (Table A1). The explanatory power of hotels increases from 68.2% to 76.6%, reaching the maximum, when interacting with urban area proportion. The interactions of factors indicate that potential factors also have influences on tourism in Qinghai, although they are not the most prominent factors.
5.2.2. Interactive q-Statistics of Influential Factors in Tibet
Road network density is the most important factor in Tibet, having an explanatory power of 18.5%. Its interaction with potential factors, such as urbanization rate, population density, regional GDP, and urban area proportion, can increase the explanatory power to approximately 38%, showing significant nonlinear enhancement. The tourist attractions have extremely low explanatory power in Tibet; however, when interacting with road network density, the interactive q-statistic value reaches 49.5%, which is the strongest interaction in Tibet. In addition, due to the high altitude in Tibet, there is a significant nonlinear enhancement of the explanatory power when the altitude factor interacts with road network density, regional GDP, and urban area proportion (see the results in Appendix A Table A2), which indicates the importance of altitude to tourism activities in high altitude areas.
5.3. The Stratified Influence of Factors
To know how tourism hot spot distribution is affected by each factor, we examined the distribution of Weibos over the five strata of factors with high explanatory power. For comparison, we scaled the average Weibo statistics over each factor to the range of 0–1 in Qinghai and Tibet, respectively (Figure 7).
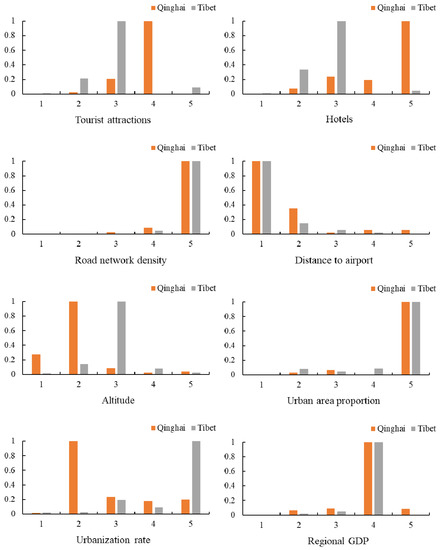
Figure 7.
Normalized distribution of Weibos over five strata of factors.
Figure 7 shows the different influences of factors. Road network density and urban area proportion factors have monotonously increasing influences on tourism hot spot distribution in both Qinghai and Tibet. The higher the road network density or urban area proportion, the hotter the tourism. It indicates that these two factors have a positive influence on tourism. Whereas the distance to the airport has a monotonously decreasing influence on tourism, which also indicates the importance of transportation. The altitude factor exhibits a non-monotonous influence on tourism. As the average altitude of Tibet is higher than that of Qinghai, the greatest number of tourism-related Weibos in Qinghai is at stratum 2 and in Tibet is at stratum 3. On the plateau, the altitude constrains human activities, so there are less tourism activities in extremely high-altitude areas.
Tourist attractions, altitude, urbanization rate, and regional GDP factors have different influences in Qinghai and Tibet. Tourist attractions and hotels have an approximately monotonously increasing influence on tourism hot spot distribution in Qinghai, whereas a non-monotonous influence on tourism hot spot distribution in Tibet. The number of tourism-related Weibos in Tibet reaches the maximum at stratum 3 of the tourist attraction factor and stratum 3 of the hotel factor. The urbanization rate and regional GDP factors have an approximately monotonously increasing influence on tourism hot spot distribution in Tibet, whereas a non-monotonous influence in Qinghai. The number of tourism-related Weibos in Qinghai reaches the maximum at stratum 2 of the urbanization rate and stratum 4 of the regional GDP. Again, the result indicated that tourist attractions and hotels are important determinants for tourism in Qinghai, and potential influential factors, such as urbanization rate and regional GDP, are important determinants for tourism in Tibet.
5.4. Regional Heterogeneity of Factors
To understand the geographical source of the dominant explanatory power of each factor in a region, more detailed factor detection in the region is needed. There are eight prefecture-level cities in Qinghai and seven prefecture-level cities in Tibet. We applied Geodetector to each prefecture-level city separately and analyzed several factors and interactive factors with strong explanatory power for tourism in Qinghai and Tibet (Figure 8, Figure 9, Figure 10 and Figure 11).
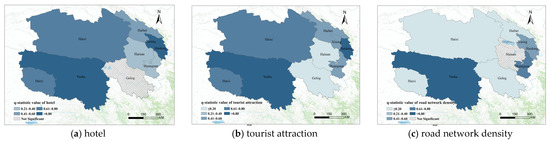
Figure 8.
q-Statistics of factors by city in Qinghai.
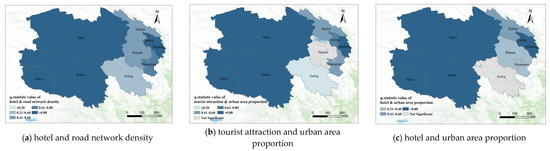
Figure 9.
q-Statistics of factor interceptions by city in Qinghai.
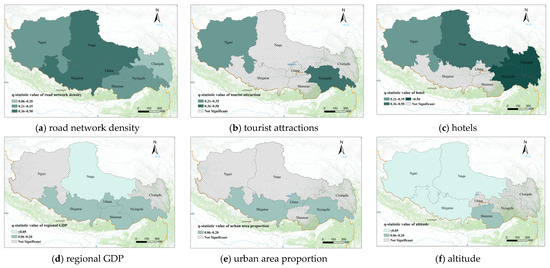
Figure 10.
q-Statistics of factors by city in Tibet.
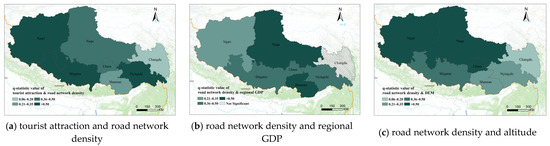
Figure 11.
q-Statistics of factor interactions by city in Tibet.
5.4.1. Factor Explanatory by City in Qinghai
Single factor. Hotels, tourism attractions, and road network density are the three most powerful tourism factors in Qinghai. Figure 8 shows that the explanatory power of these three factors mainly lies in eastern and western Qinghai, namely, Xining (the capital of Qinghai), Haidong, Haibei, Yushu, Huangnan, and Haixi, which indicates that these cities play an important role in the tourism industry of Qinghai. In central areas such as Hainan and Golog, the above three factors have weak explanatory power; that is, tourism resources and amenities are not well developed and can be improved in these cities.
Among cities with strong explanatory power for the above three factors, Yushu and Huangnan are special. Compared with other cities, Yushu has a small number of tourists and less tourism income (Table 5), but the higher explanatory power of hotels, attractions, and road networks shows that the tourism infrastructure in Yushu is well constructed. The most powerful explanatory factor in Huangnan is road network density. Huangnan is the city with the fewest attractions in Qinghai (Table 5), and the most important attraction described in microblogs is the Kambula National Forest Park. Since there is an important highway from Huangnan to Xining, and most tourists arrive at Kambula through this highway, road network density is the most important factor in Huangnan.
Table 5.
Point data statistics of cities in Qinghai and Tibet (2017).
Tourist attractions, hotels, and road network density have week explanatory powers in Hainan and Golog. After analyzing the local microblogs, we found that in Hainan, the microblogs are mostly distributed on the south side of Qinghai Lake and seldom elsewhere, implying that the development of tourism in Hainan is unbalanced. In Golog, there are few attractions and hotels, and the sparse tourism microblogs are mainly distributed near the few tourist attractions, which shows the lower tourism development in Golog.
Interactive factors.Figure 9 shows the factor interaction that has a significant enhancement effect in Qinghai. Compared with the explanatory power of hotels alone, the addition of road network density enhances the explanatory power of tourism in Huangnan, Hainan, Golog, and Haixi, indicating that the road network has significantly promoted local tourism in these cities. The addition of urban area proportion enhances the explanatory power of the tourist attraction/hotel factor in Haixi, once again indicating that better economic conditions and physical environments are more attractive to tourists.
5.4.2. Factor Explanatory by City in Tibet
Single factors. The most powerful factors in Tibet are road network density, regional GDP, and urban area proportion. For the road network density factor (Figure 10a), central Tibet, namely, Lhasa, Naqu, and Shigatse, has q-statistic values greater than 35%. The road network density factor has strong explanatory power and indicates higher road network utilization. The status of Lhasa as the capital of Tibet makes it the most representative city in the region. Most tourists who come to Tibet will choose Lhasa as their first stop, and there are densely distributed tourism microblogs on Lhasa’s road network. In Naqu, many microblogs are distributed along the extremely important Qinghai-Tibet Highway connecting Qinghai and Tibet. In Shigatse, G318 connected to G219 has a high passenger flow, which also means that it is the highway with the most concentrated tourism microblog distribution. This highway starts from Lhasa, runs through Shigatse, and leads directly to the Ngari region in western Tibet. The plateau scenery along the way is spectacular and has become a famous local self-driving tourist route. Most of the tourists on this route choose to go to the famous Mount Everest, Shishapangma, and other large attractions, which indicates that the passenger flow is concentrated, so compared to other scattered and unfamiliar attractions, the road network has become the main explanatory factor. However, the explanatory power of road network density in Ngari, Shannan, Nyingchi, and Changdu is relatively low. In Ngari and Nyingchi, tourism microblogs are scattered from the main roads, and attractions begin to play a role, as shown in Figure 10b. In Nyingchi, Changdu, and Naqu, hotels also begin to show explanatory power (Figure 10c). From the perspective of tourist attractions, hotels, and road networks, Nyingchi is an obvious city with the greatest intention to develop tourism in Tibet, followed by Ngari. These areas have effectively developed and utilized local tourism resources.
In addition to the road network, regional GDP and urban/rural land generally offer more explanatory than the attractions and hotels in Tibet (see Section 4.1). From the perspective of spatial distribution, the explanatory power of potentially influential factors such as regional GDP and urban area proportion for tourism mainly comes from the central and southern parts of Tibet, indicating that in addition to natural attractions, tourists in Tibet also tend to go to large cities with good economic conditions, such as Lhasa and Shigatse (Figure 10d,e).
Interactive factors.Figure 11 displays q-statistic values for the interactive factors between road network density and tourist attractions, regional GDP, altitude by city. The interpretation of tourism in Nyingchi, Ngari, and Shigatse is significantly enhanced by the interactive influence of road network density and attractions (Figure 11a), indicating that Nyingchi, Ngari, and Shigatse have more developed tourism resources and amenities. Regional GDP has also significantly enhanced the explanatory power of road network density for tourism, especially in Shannan and Naqu (Figure 11b). In Shannan, most microblogs distribute near two attractions, YamdrokTso and Yongbulakang, which are in a high-GDP county; this is why regional GDP can significantly enhance the explanatory power for tourism, and this is also the reason that tourist attractions have insignificant explanatory power for tourism in Shannan (Figure 10b). This result indicates that the development of tourism resources in the Shannan area is inadequate and unbalanced.
Tibet has a high altitude that is higher in the northwest and lower in the southeast. In the northwest, the average altitude of Ngari is 4300 m and that of Naqu is 4500 m. The average altitude of Nyingchi in the southeast is 3000 m, and the lowest is altitude is less than 1000 m. Compared with the low altitudes in southeastern Tibet, the high altitude in the west has a stronger effect on tourism (Figure 10f). The factor interaction between road network density and altitude (Figure 11c) also significantly enhances the explanatory power for tourism in high-altitude areas, i.e., Ngari and Naqu. In low-altitude regions such as Nyingchi and Changdu, altitude does not clearly provide explanatory power.
5.5. Discussion
The results show that the influential tourism factors in Qinghai and Tibet are different. In Qinghai, direct influential factors, i.e., hotels, tourist attractions, and road network density, have the strongest explanatory power for tourism hot spot distribution, whereas potential influential factors, such as economy, population, and land use types, have weak explanatory power. In contrast, in Tibet, potential influential factors, i.e., regional GDP, urban area proportion, have stronger explanatory power than tourist attractions and hotels. The results are basically in accordance with previous studies but a little different [4,50,51]. The literature [4] found that hotel and regional GDP are the most important factors on tourism in Qinghai [4]. Generally, regional economics, such as regional GDP, has an important influence on tourism, however, when the spatial heterogeneity of regional GDP is considered in Geodetector, the influence of regional GDP is not very significant. The weak explanatory power of potential factors reflects that the tourism industry in Qinghai is not strongly related to the local economy, which means tourism is not the pillar industry in Qinghai, although it is well developed. Unlike Qinghai, GDP, urban area proportion have stronger explanatory power than tourist attractions and hotels in Tibet, showing that there are more tourism activities in more economically developed areas and that the tourism industry in Tibet is closely related to the economy of local areas, which reflects the dominant role of tourism in Tibet’s economy. Tourism is the pillar industry and has been cultivated as a leading industry in Tibet, and the explanatory power of factors mainly comes from the more developed central Tibet, such as Lhasa and Shigatse.
Hotels are usually another important factor of tourism in many cities [4,50,51], but it is not in Tibet in our study. The low explanatory power of attractions and hotels for tourism suggests that the tourism industry in Tibet can be improved by constructing amenities around tourism resources and enhancing the publicity of tourist attractions. The strong explanatory power of direct factors in Qinghai reflects that tourism amenities and infrastructures are well developed and that tourism resources have sufficient attractions for the tourists in Qinghai. Tourism resource utilization in Qinghai is relatively high. From the perspective of the regional heterogeneity of factors, the high factor explanatory power for tourism in Qinghai comes from the eastern and western areas in the province, and the development and utilization of tourism resources in the central region are insufficient; that is, tourism resources and amenities are not well developed and can be improved in these cities.
Geodetector can not only find important factors but also indicate the interactions among factors. The interactive factor analysis disclosed that although potential factors are not prominent factors for tourism in Qinghai, their interaction with tourist attractions and hotels can improve the explanatory power of factors. Furthermore, the interaction of road network density and potential factors also improve the explanatory power for tourism. The results demonstrate the importance of social and economic development in tourism. Meaning, the development of the economy is a way to promote tourism on the QTP.
6. Conclusions
Using the spatial distribution of tourism hot spots on the QTP extracted from Sina microblogs, this paper analyzed the influencing factors of tourism hot spot distribution on the QTP using the Geodetector model by considering the geographical strata of the factors. Factors related to tourism resources, amenities, transportation, geography, population, and the economy are chosen for analysis. By analyzing the q statistics of the individual factors and how the interaction between factors enhances the results, the factors that are related to tourism in Qinghai and Tibet are identified and analyzed.
In general, areas with a relatively low altitude, better economic conditions, and dense road networks are more developed in tourism. In Qinghai, the main explanatory factors of hotels, tourist attractions, and road network density indicate well-developed and utilized tourism resources, amenities, and infrastructures. In Tibet, the main explanatory factors of road network density, GDP and urban area proportion indicate the important role of tourism in the economy, however, the tourism resources are not fully utilized, and the tourism amenities are not well developed. The results suggest that Qinghai, especially the central region, should continue to strengthen the publicity and utilization of tourism resources, and in Tibet, it is necessary to further publicize and develop tourism resources and amenities around them, especially in Changdu, Naqu, and Shannan, so as to achieve the goal common development in all regions. In summary, by analyzing the distribution of tourists’ microblogs over a period, it is possible to effectively understand the local tourism potential, identify influential factors, and make adjustments to effectively promote local tourism.
Author Contributions
Conceptualization, Lei Hu; formal analysis, Lei Hu; writing—original draft preparation, Lei Hu; writing—review and editing, Lei Hu; supervision, Jun Xu, Chao Bao, and Tao Pei. All authors have read and agreed to the published version of the manuscript.
Funding
This work was supported by the Strategic Priority Research Program of Chinese Academy of Sciences, Pan-Third Pole Environment Study for a Green Silk Road (#XDA20040401); the National Natural Science Foundation of China (#41771477, 42071376, 41525004).
Institutional Review Board Statement
Not applicable.
Informed Consent Statement
Not applicable.
Data Availability Statement
Data sharing not applicable.
Acknowledgments
The authors thank Wei Qi for providing the population and GDP data, and Xianfeng Feng for providing the land use data.
Conflicts of Interest
The author declares no conflict of interest.
Appendix A
Table A1.
q-Statistics of influential factor interactions in Qinghai.
Table A1.
q-Statistics of influential factor interactions in Qinghai.
| Qinghai | Urbanization Rate | Population Density | Distance to Airport | Regional GDP in 2015 | Tourist Attraction | Hotel | Road Net Density | Altitude | Urban Area Proportion | Rural Area Proportion |
|---|---|---|---|---|---|---|---|---|---|---|
| Urbanization rate | 0.004 | |||||||||
| Population density | ** 0.144 | 0.054 | ||||||||
| Distance to airport | ** 0.015 | * 0.057 | 0.005 | |||||||
| Regional GDP in 2015 | ** 0.045 | ** 0.136 | * 0.03 | 0.024 | ||||||
| Tourist attraction | ** 0.476 | * 0.427 | * 0.416 | ** 0.477 | 0.411 | |||||
| Hotel | ** 0.733 | * 0.716 | * 0.687 | ** 0.763 | * 0.723 | 0.682 | ||||
| Road net density | ** 0.334 | ** 0.33 | * 0.246 | ** 0.291 | * 0.505 | * 0.744 | 0.241 | |||
| Altitude | ** 0.033 | ** 0.067 | * 0.016 | * 0.033 | * 0.417 | ** 0.703 | ** 0.257 | 0.012 | ||
| Urban area proportion | ** 0.126 | * 0.136 | * 0.11 | ** 0.135 | ** 0.627 | * 0.766 | ** 0.361 | * 0.12 | 0.109 | |
| Rural area proportion | ** 0.161 | * 0.078 | * 0.078 | ** 0.146 | ** 0.624 | * 0.733 | ** 0.349 | * 0.086 | * 0.161 | 0.074 |
(Note: **: Nonlinear enhancement; *: Binary enhancement).
Table A2.
q-Statistics of influential factor interactions in Tibet.
Table A2.
q-Statistics of influential factor interactions in Tibet.
| Tibet | Urbanization Rate | Population Density | Distance to Airport | Regional GDP in 2015 | Tourist Attraction | Hotel | Road Net Density | Altitude | Urban Area Proportion | Rural Area Proportion |
|---|---|---|---|---|---|---|---|---|---|---|
| Urbanization rate | 0.005 | |||||||||
| Population density | ** 0.017 | 0.004 | ||||||||
| Distance to airport | ** 0.016 | * 0.009 | 0.006 | |||||||
| Regional GDP in 2015 | * 0.09 | * 0.089 | * 0.09 | 0.088 | ||||||
| Tourist attraction | ** 0.045 | ** 0.018 | ** 0.023 | ** 0.146 | 0.013 | |||||
| Hotel | ** 0.023 | ** 0.023 | * 0.017 | * 0.101 | * 0.021 | 0.013 | ||||
| Road net density | ** 0.382 | ** 0.375 | ** 0.248 | ** 0.385 | ** 0.495 | ** 0.228 | 0.185 | |||
| Altitude | ** 0.023 | ** 0.012 | ** 0.019 | ** 0.372 | ** 0.027 | * 0.018 | ** 0.245 | 0.007 | ||
| Urban area proportion | ** 0.129 | * 0.089 | ** 0.105 | * 0.129 | ** 0.203 | ** 0.107 | ** 0.385 | ** 0.373 | 0.088 | |
| Rural area proportion | ** 0.094 | * 0.019 | ** 0.029 | ** 0.127 | ** 0.042 | ** 0.039 | ** 0.246 | ** 0.049 | * 0.089 | 0.017 |
(Note: **: Nonlinear enhancement; *: Binary enhancement).
References
- Zhong, L.S. Tourism Planning Case in Tibetan Plateau; China Travel and Tourism Press: Beijing, China, 2018. [Google Scholar]
- Su, M.M.; Wall, G. The Qinghai–Tibet railway and Tibetan tourism: Travelers’ perspectives. Tour. Manag. 2009, 30, 650–657. [Google Scholar] [CrossRef]
- Wang, Z.; Liang, L.; Chu, X.; Li, J. Examining the coordination effect and interactive stress between tourism economy and eco-environment in the Tibetan Plateau. J. Geo-Inf. Sci. 2019, 21, 1352–1366. [Google Scholar]
- Cao, W. Analysis of the influencing factors of tourism income based on grey correlation—Taking Qinghai province as an example. Bus. Econ. 2011, 33–34, 59. [Google Scholar]
- Qi, M.; Mi, Z. Grey-relation Analysis of Regional Economic System of Tibet Autonomous Region. Oper. Res. Manag. Sci. 2004, 13, 77–81. [Google Scholar]
- Liu, Y. Research on the Characteristic Tourism Development in the Qinghai-Tibet Plateau. Master’s Thesis, Northwest Minzu University, Lanzhou, China, 2009. [Google Scholar]
- Shen, R. Study on the Temporal-Spatial Behavior of Tourists Based on Geotagged Photo Metadata of the Qinghai-Tibet Plateau. Master’s Thesis, Lanzhou Jiaotong University, Lanzhou, China, 2020. [Google Scholar]
- Xu, J.; Xu, Y.; Hu, L.; Wang, Z. Discovering spatio-temporal patterns of human activity on the Qinghai-Tibet Plateau based on crowdsourcing positioning data. Acta Geogr. Sin. 2020, 75, 1406–1417. [Google Scholar]
- Wang, J.F.; Li, X.H.; Christakos, G.; Liao, Y.L.; Zhang, T.; Gu, X.; Zheng, X.Y. Geographical detectors-based health risk assessment and its application in the neural tube defects study of the Heshun Region, China. Int. J. Geogr. Inf. Sci. 2010, 24, 107–127. [Google Scholar] [CrossRef]
- Lewis, C.; D’Alessandro, S. Understanding why: Push-factors that drive rural tourism amongst senior travelers. Tour. Manag. Perspect. 2019, 32, 100574. [Google Scholar] [CrossRef]
- Liu, Y.; Shi, J.; Jian, M. Understanding visitors’ responses to intelligent transportation system in a tourist city with a mixed ranked logit model. J. Adv. Transp. 2017, 2017, 8652053. [Google Scholar] [CrossRef]
- Frechtling, D.C.; Hara, T. State of the world’s tourism statistics and what to do about it. Tour. Econ. 2015, 22, 995–1013. [Google Scholar] [CrossRef]
- Yang, X.; Wang, Q. Exploratory space-time analysis of inbound tourism flows to China cities. Int. J. Tour. Res. 2014, 16, 303–312. [Google Scholar]
- Önder, I.; Koerbitz, W.; Hubmann-Haidvogel, A. Tracing tourists by their digital footprints: The case of Austria. J. Travel Res. 2014, 55, 566–573. [Google Scholar] [CrossRef]
- Volo, S. Tourism statistics, indicators and big data: A perspective article. Tour. Rev. 2019, 75, 304–309. [Google Scholar] [CrossRef]
- Hallo, J.C.; Beeco, J.A.; Goetcheus, C.; McGee, J.; McGehee, N.G.; Norman, W.C. GPS as a method for assessing spatial and temporal use distributions of nature-based tourists. J. Travel Res. 2012, 51, 591–606. [Google Scholar] [CrossRef]
- Li, J.; Xu, L.; Tang, L.; Wang, S.; Li, L. Big data in tourism research: A literature review. Tour. Manag. 2018, 68, 301–323. [Google Scholar] [CrossRef]
- Mou, N.; Yuan, R.; Yang, T.; Zhang, H.; Tang, J.; Makkonen, T. Exploring spatio-temporal changes of city inbound tourism flow: The case of Shanghai, China. Tour. Manag. 2020, 76, 103955. [Google Scholar] [CrossRef]
- Lupton, D. Twitter: Social communication in the digital age. Inf. Commun. Soc. 2014, 17, 644–646. [Google Scholar] [CrossRef]
- Mou, N.; Zheng, Y.; Makkonen, T.; Yang, T.; Tang, J.; Song, Y. Tourists’ digital footprint: The spatial patterns of tourist flows in Qingdao, China. Tour. Manag. 2020, 81, 104151. [Google Scholar] [CrossRef]
- Asakura, Y.; Iryo, T. Analysis of tourist behaviour based on the tracking data collected using a mobile communication instrument. Transp. Res. Part A Policy Pract. 2007, 41, 684–690. [Google Scholar] [CrossRef]
- Salas-Olmedo, M.H.; Moya-Gómez, B.; García-Palomares, J.C.; Gutiérrez, J. Tourists’ digital footprint in cities: Comparing Big Data sources. Tour. Manag. 2018, 66, 13–25. [Google Scholar] [CrossRef] [Green Version]
- Serrano-Estrada, L.; Martí Ciriquián, P.; Nolasco-Cirugeda, A.; Agryzkov, T. Reading the social preferences of tourist destinations through social media data. In Proceedings of the International Conference Virtual City and Territory—11th Congress Virtual City and Territory, Krakow, Poland, 6–8 July 2016. [Google Scholar]
- Encalada, L.; Boavida-Portugal, I.; Cardoso Ferreira, C.; Rocha, J. Identifying tourist places of interest based on digital imprints: Towards a sustainable smart city. Sustainability 2017, 9, 2317. [Google Scholar] [CrossRef] [Green Version]
- Peng, X.; Huang, Z. A novel popular tourist attraction discovering approach based on geo-tagged social media big data. ISPRS Int. J. Geo-Inf. 2017, 6, 216. [Google Scholar] [CrossRef] [Green Version]
- Kádár, B.; Gede, M. Tourism flows in large-scale destination systems. Ann. Tour. Res. 2021, 87, 103113. [Google Scholar] [CrossRef]
- Bassolas, A.; Lenormand, M.; Tugores, A.; Gonçalves, B.; Ramasco, J.J. Touristic site attractiveness seen through Twitter. EPJ Data Sci. 2016, 5, 12. [Google Scholar] [CrossRef] [Green Version]
- He, C.; Muhtar, P.; Zhu, Y.-F.; Xie, X. Spatial pattern and influencing factors of tourism informatization in five provinces of northwest China:a case of tourism sina micro-blogs. J. Inn. Mong. Norm. Univ. Nat. Sci. Ed. 2019, 48, 8–14. [Google Scholar]
- Liu, D.; Hu, J.; Cheng, S.; Chen, J.; Zhang, Q. Spatial Pattern and Influencing Factors of Tourism Micro-blogs in China: A Case of Tourism Sina Micro-blogs. Sci. Geogr. Sin. 2015, 35, 717–724. [Google Scholar]
- Encalada-Abarca, L.; Ferreira, C.C.; Rocha, J. Measuring tourism intensification in urban destinations: An approach based on fractal analysis. J. Travel Res. 2021. [Google Scholar] [CrossRef]
- Arbel, A.; Pizam, A. Some determinants of urban hotel location: The tourists’ inclinations. J. Travel Res. 1977, 15, 18–22. [Google Scholar] [CrossRef]
- Barkauskas, V.; Barkauskienė, K.; Jasinskas, E. Analysis of macro environmental factors influencing the development of rural tourism: Lithuanian case. Procedia-Soc. Behav. Sci. 2015, 213, 167–172. [Google Scholar] [CrossRef] [Green Version]
- Eryiğit, M.; Kotil, E.; Eryiğit, R. Factors affecting international tourism flows to Turkey: A gravity model approach. Tour. Econ. 2010, 16, 585–595. [Google Scholar] [CrossRef]
- Jarvis, D.; Stoeckl, N.; Liu, H.-B. The impact of economic, social and environmental factors on trip satisfaction and the likelihood of visitors returning. Tour. Manag. 2016, 52, 1–18. [Google Scholar] [CrossRef] [Green Version]
- Shuai, M.; Pingping, C. Evaluation and analysis of the factors influencing the choice of travel destinations—A case of Xuzhou. In Proceedings of the 2011 International Conference on E-Business and E-Government (ICEE), Shanghai, China, 6–8 May 2011. [Google Scholar]
- Teye, V. Geographic factors affecting tourism in Zambia. Ann. Tour. Res. 1988, 15, 487–503. [Google Scholar] [CrossRef]
- Var, T.; Mohammad, G.; Icoz, O. Factors affecting international tourism demand for Turkey. Ann. Tour. Res. 1990, 17, 606–610. [Google Scholar] [CrossRef]
- Zadeh Bazargani, R.H.; Kiliç, H. Tourism competitiveness and tourism sector performance: Empirical insights from new data. J. Hosp. Tour. Manag. 2021, 46, 73–82. [Google Scholar] [CrossRef]
- Yeesoontes, W.; Wu, K. Factors Influencing Chinese Tourists to Travel to Thailand. In Proceedings of the International Conference on Education, Business and Management (ICEBM), Bali, Indonesia, 8–9 January 2017. [Google Scholar]
- Gutiérrez, J.; García-Palomares, J.C.; Romanillos, G.; Salas-Olmedo, M.H. The eruption of Airbnb in tourist cities: Comparing spatial patterns of hotels and peer-to-peer accommodation in Barcelona. Tour. Manag. 2017, 62, 278–291. [Google Scholar] [CrossRef] [Green Version]
- Cockerell, N. Factors Affecting Tourism. In Horwath Book of Tourism; Quest, M., Ed.; Palgrave Macmillan UK: London, UK, 1990; pp. 128–135. [Google Scholar] [CrossRef]
- Prideaux, B. Factors affecting bilateral tourism flows. Ann. Tour. Res. 2005, 32, 780–801. [Google Scholar] [CrossRef] [PubMed]
- Ao, R.; Wei, Y. A study on the regional tourism resources and the unbalanced development of the tourism industry in China. J. Financ. Econ. 2006, 32, 32–43. [Google Scholar]
- Batista e Silva, F.; Barranco, R.; Proietti, P.; Pigaiani, C.; Lavalle, C. A new European regional tourism typology based on hotel location patterns and geographical criteria. Ann. Tour. Res. 2020, 89, 103077. [Google Scholar] [CrossRef]
- Huang, H.; Zhong, W.; Lai, Q.; Qiu, Y.; Jiang, H. The spatial distribution, influencing factors, and development path of inbound tourism in China—An empirical analysis of market segments based on travel motivation. Sustainability 2020, 12, 2508. [Google Scholar] [CrossRef] [Green Version]
- Hernández, J.M.; Santana-Jiménez, Y.; González-Martel, C. Factors influencing the co-occurrence of visits to attractions: The case of Madrid, Spain. Tour. Manag. 2021, 83, 104236. [Google Scholar] [CrossRef]
- Sun, Y.; Wang, S.; Li, Y.; Feng, S.; Chen, X.; Zhang, H.; Tian, X.; Zhu, D.; Tian, H.; Wu, H. Ernie: Enhanced representation through knowledge integration. arXiv 2019, arXiv:1904.09223. [Google Scholar]
- Devlin, J.; Chang, M.-W.; Lee, K.; Toutanova, K. Bert: Pre-training of deep bidirectional transformers for language understanding. arXiv 2019, arXiv:1810.04805. [Google Scholar]
- Jenks, G.F. The data model concept in statistical mapping. Int. Yearb. Cartogr. 1967, 7, 186–190. [Google Scholar]
- He, Y. A research of impacting Xinjiang tourism economic factors based on gray correlative analysis. Ecol. Environ. 2012, 160–162, 170. [Google Scholar]
- Meng, X.; Jin, H.; Liu, J. An application of grey correlative analysis in the research of impacting Baoding Tourism economic factors. J. Hebei Univ. Technol. 2009, 38, 98–102. [Google Scholar]
Publisher’s Note: MDPI stays neutral with regard to jurisdictional claims in published maps and institutional affiliations. |
© 2021 by the authors. Licensee MDPI, Basel, Switzerland. This article is an open access article distributed under the terms and conditions of the Creative Commons Attribution (CC BY) license (https://creativecommons.org/licenses/by/4.0/).