Abstract
Typhoon is one of the most destructive natural disasters in the world. Real-time information on the process of typhoon events serves as important reference for disaster emergency. In the era of big data, microblog text has been gradual applied to the prevention, preparation, response, and recovery of disaster management. However, previous studies mostly focused on the acquisition of different disaster information in microblog text, while ignoring the structural integration of this fragmented information, and thus cannot reflect the dynamic process of typhoon events. In this paper, a typhoon event information model (TEIM) considering the multi-granularity and dynamic characteristics of information is constructed from the spatio-temporal perspective. On the basis of extracting the information elements of typhoon events from microblog text, a process-oriented information aggregation method (TEPIA) is proposed to provide an ordered information resource for detecting the evolution process of typhoon events. Based on the case study of typhoon “Lekima” event using Sina Weibo, the results show that the method proposed in this paper can comprehensively detect the information of different objects on any spatio-temporal node during the process of typhoon events, which is beneficial to mining disaster emergencies in small scale from microblog text.
1. Introduction
Typhoon is a tropical cyclone phenomenon occurring in the Northwest Pacific, which has a serious impact on natural ecology, social economy, and human sustainable development [1]. A typhoon event specifically refers to a certain typhoon and a series of activities and consequences caused by it. The complicated evolution process of a typhoon event will bring great uncertainty to disaster emergency response. Therefore, it is necessary to detect the information of the process of typhoon events, including timely collection and sorting of related information resources. It can not only help people understand the development trend of typhoon events, but also provide support for formulating disaster prevention and mitigation measures [2]. Observation data, field investigation and resident interviews are the three widely used methods for obtaining disaster information [3]. The observation data come from automatic stations, meteorological radar, satellite remote sensing, and other sensor equipment. The monitoring results are continuous and mainly used to detect changes in natural geographic features [4,5]. Nevertheless, the results are difficult to reflect the influence of disasters on the social environment. Field investigation and resident interviews can reveal the disaster situation in details, but the timeliness and regional range of obtaining disaster information are limited.
Social media such as Twitter, Facebook, and Sina Weibo have become main platforms for people to create and share information, and they area breaking down the time and space barriers of information dissemination [6,7]. The fields of disaster, geography, and information science have used big data and spatio-temporal analysis methods to analyze the spatial distribution of disaster events and to detect the occurrence and extent of disaster events by mining social media data [8,9,10]. Social media is more sensitive to the social environment and has a strong complementarity to traditional disaster monitoring [11]. In the “Sendai Framework for Disaster Risk Reduction 2015–2030”, adopted by the Third United Nations World Conference on Disaster Risk Reduction (WCDRR), it was noted that disaster monitoring, risk assessment and service capacity should be enhanced through the full use of traditional technologies and modern means, including big data, social media, and the mobile internet [12].
Microblog is one of the most popular social media applications. Microblog text has gradually become a new way to obtain information of typhoon events. In recent years, the main platforms of microblog have begun to raise the word limit for a single microblog. For instance, Twitter has increased the word limit from 140 characters to 280 characters; Sina Weibo even has removed the word limit of 140 characters for the single microblog. However, microblogs are still dominated by short texts, most of which are usually below 140 characters. In addition, the microblog text also has the characteristics of colloquial style, semantic ambiguity, and diversity of information granularity [13]. Thus, the short text characteristics of microblog increase the complexity of obtaining effective information of typhoon events. Information aggregation is a method of screening, organizing, and integrating information resources from disparate sources to help users easily access the information they need [14]. Therefore, faced with the scattered distribution of massive microblog texts, it is necessary to reorder and organize the typhoon event information contained in microblog text through information aggregation.
The information aggregation methods for microblog text mainly include two types: trigger word-based method and knowledge unit-based method. According to the different ways of generating trigger words, it can be further divided into statistics-based methods and topic model-based methods: (1) For the statistical-based method, the weight of words in microblog text is calculated by using the statistical characteristics, such as word frequency, TF-IDF, N-gram, and mutual information [15,16]. Based on weight, single-word or multi-words are selected from each microblog as the representative keywords. The keywords are used as the basis of aggregation [17,18]. This method is easy to understand, but is limited by the accuracy of keyword extraction. (2) The topic model-based method uses the probability distribution of the subject words to represent the topic of the microblog text [19,20], and is becoming more frequently used in flood [21], earthquake [22], hurricane [23], and other disaster events. However, the determination of the number of topics in the model is subjective. When there are many kinds of topics in the microblog text, the interpretability of the subject words is controversial. Although the trigger word-based method is the most common method at present, the information granularity of the aggregated result is crude. Using this method to aggregate information of typhoon events, only the relevant microblog text can be gathered together, which cannot reflect the process characteristics of typhoon events.
The knowledge unit-based method is based on the conceptual model structure of related fields, which decomposes and reorganizes the information at the content level to obtain the aggregated results with a certain knowledge system [24]. Therefore, the foundation of information aggregation of typhoon events based on knowledge unit method is the information modeling of typhoon events. At present, the information modeling of typhoon events can be divided into two types: the static conceptual model and the timeslice snapshot model. For the static conceptual model, it is usually based on the analysis of related concepts in the field of the typhoon, dividing the hierarchical structure by the semantic relations [25,26,27]. Although the static conceptual model has strong generality, it ignores the dynamic characteristics of different stages of typhoon events, and lacks the ability to express the whole life cycle of events. Timeslice snapshot models usually compose time series according to the sequence of information generation time, such as the typhoon track data sets [28,29]. These models usually describe only part of the characteristics of typhoon events (such as wind force, central position, etc.), or only one specific task for typhoon events (such as intensity monitoring, track prediction, etc.). Because of the single granularity of information in the model, it is difficult to express the interaction between different objects in events. In comparison, the knowledge unit-based method is more suitable for information detection of the process of typhoon events, but it still lacks a suitable typhoon event information model considering multi-granularity and dynamic characteristics.
In this paper, an information detection method for the process of typhoon events is proposed, which integrates the typhoon event information contained in the microblog text according to the evolution process from the spatio-temporal perspective. The main innovation of this study is reflected in the following two aspects:
- (1)
- Information modeling of typhoon events, which provides a basic theoretical framework for information integration, is the fundamental scientific problems of this study. An information model of typhoon events (TEIM) is constructed from three levels: object, process, and state. Such framework can promote the transformation from fragmented microblog data to ordered information resources.
- (2)
- An information aggregation method for the process of typhoon events (TEPIA) is proposed. By mode of hierarchical aggregation of “Object-State-Process”, TEPIA reorders and organizes the scattered, multi-granularity, and disordered microblog text fragments, which provides an ordered information basis for detecting the development trend of the process of typhoon events.
The following sections are expanded as follows: Section 2 proposes the information detection method for the process of typhoon events from information modeling, information extraction and information aggregation; Section 3 is the case study of typhoon “Lekima” event; Section 4 discusses the reasonableness and application value of this method; Section 5 presents the conclusions and future work.
2. Methodology
Based on the basic idea of "information modeling–information extraction–information aggregation–case study", the information detection method for the process of typhoon events in microblog text is studied. (1) The components and dynamic characteristics of typhoon events are summarized according to the human cognitive habits. On this basis, a multi-level information model of typhoon events (TEIM) is proposed. (2) The object names and feature information related to typhoon events are extracted from the microblog text. (3) An information aggregation method for the process of typhoon events (TEPIA) is further proposed. In TEPIA, the feature information is aggregated according to the described object. In addition, the different states of the object are aggregated based on the temporal and spatial features. Afterwards, multiple states are associated in time and space to form the event process. (4) A case is studied to analysis the practical value of the proposed method. In the case study, typhoon “Lekima” event, which landed in China in 2019 with the strongest wind, is the example, and the study data is based on Sina Weibo, the microblog platform with the most users in China.
2.1. Multi-Level Information Model of Typhoon Events
The typhoon is a common natural geographical phenomenon. The typhoon event caused by the typhoon is a devastating natural disaster. In addition to the typhoon itself, the typhoon event also involves the surface environment that affects the typhoon, as well as the people and things affected by the typhoon. The interaction between typhoon and related objects constitutes the whole typhoon event, and the result of the interaction is to promote the evolution of typhoon events. The evolution of typhoon events is the summation of all forms of motion in typhoon events, and time and space are the measure of the evolution of typhoon events. The variation tracks of different objects in typhoon events are the basic units of the process of typhoon events. The process needs to be embodied and captured through transitions between states. The state is a static slice in a continuous process under specific spatio-temporal condition [30].
In general, typhoon has a destructive effect on a region, which is a typhoon event. Typhoon landed in Wenling City, Zhejiang Province on 10 August 2019, which is a state of a typhoon event under specific spatio-temporal condition. The life cycle of typhoon from generation to decline, which is the process of a typhoon event. Therefore, the information model of typhoon events is constructed from 3 levels: object, process and state.
2.1.1. Object Level Information Model
Materialism holds that the world is material, and the material world is consisted of objects. Objects are perceptible, independent, and relative static existences. The world is also in motion, and the motional world is consisted of events. Events, unlike static concepts, are perceptible, motion existences. The motion of the world is absolute, and the rest is relative. Motion is absolute while stagnation is relative. Any object can be a constituent of an event, and an object that is not a constituent of an event does not exist. Therefore, objects and events are different units to cognize the real world, and events cannot exist without objects. The object focuses on the composition of the event, while the event contains the reason or theme of the development and change of the object.
According to the basic principles of disaster science, disasters are composed of three categories of objects: pregnant environment, causing factor, and sustaining body. In typhoon events, causing factor mainly refer to cyclone, which is the fundamental factor leading to disaster. In this case, a cyclone is the air vortex of the typhoon itself, which is an object of the typhoon event. To better distinguish the typhoon-triggered event from the typhoon itself, the concepts below use “typhoon event” and “cyclone”, respectively. The sustaining bodies are the objects acted, affected, or destroyed by the cyclone, including people, infrastructure, traffic, social activities, and so on. Pregnant environment is the background condition that influences the causing factors and sustaining bodies.
Pregnant environment, causing factor, and sustaining body have different functions in a disaster. Among them, the causing factor is the sufficient condition. Causing factor determines the categories of disasters, and its risk is also an important factor to evaluate the degree of disaster severity. Therefore, cyclone as a causing factor is the primary object of typhoon events. Other objects are the secondary objects of typhoon events, which either affect cyclone or are affected by cyclone, but do not directly lead to disasters. If Op is the primary object, and Osn is a variety of secondary objects, then typhoon event Et can be represented as
Each object has multiple features, including time (T), space (S), attribute (A), and behavior (B). Objects and their features can be represented as
In the formula, time and space are the preconditions for the existence of objects, and also the basic framework for expressing objects. Attributes are used to express the properties of objects, and behaviors are used to describe the activities and actions of objects. Attributes can be further divided into attribute items and attribute values. An attribute item represents the category of the attribute, and the attribute value is the data or amount that the attribute item has. Behavior can also be divided into behavior items and behavior values. In this paper, the categories of objects in typhoon events are divided into 5 categories and 19 subcategories (Table 1).

Table 1.
Categories of objects and their attributes and behaviors in typhoon events.
2.1.2. State Level Information Model
The objects in typhoon events are always in dynamic change; for instance, the wind scale of cyclone drops from 16 level to 10 level. From the spatio-temporal perspective, objects move and change in time and space. Movement refers to the location deviation. Change refers to the transform of attributes and behaviors. Thus, the state is introduced to express the existence form of objects under certain spatio-temporal condition. Especially, the state focuses on describing the specific location where the object is located, and the spatial features mainly represent the location features. If at time ft and location fl, the object has specific attribute fa and behavior fb, then the state of the object can be represented as
In the different states of the object, the features of the state will also be different. According to the attribute and behavior features, the states of the object can be divided into different types. The type of state is a high generalization of various features of the state. In this paper, the state types of the primary object are shown in Table 2.
Table 2.
Types of states of the primary object in the typhoon event.
Secondary objects can also have different types of states. The mainly types of states of secondary objects are shown in Table 3.
Table 3.
Types of states of the secondary object in the typhoon event.
2.1.3. Process Level Information Model
Process refers to the change of attributes, forms and patterns with time, and directly refers to the life cycle of generation, development, continuous and decline. The process of typhoon events is embodied by the process of multiple objects, which is formed by the connection of different states in the objects in time and space. According to the number of object categories in the process, the process modeling is divided into two steps: (1) state sequence; (2) event process. The state sequence consists of different states of the same object. If Soj is one of the states that make up the state sequence Po, it can be represented as
The state sequence is the basic unit of the event process, then the state sequences of multiple objects are combined to form the whole event process. If Poi is the state sequence for different objects in the event, the process of typhoon events Pe can be represented as
The state sequence reflects the change of the object’s own features, while the event process also needs to reflect the relation among objects. Thus, at different stages of the event process, the objects contained in the event and their state types are different. The association of the state sequence with the event process is shown in Figure 1.
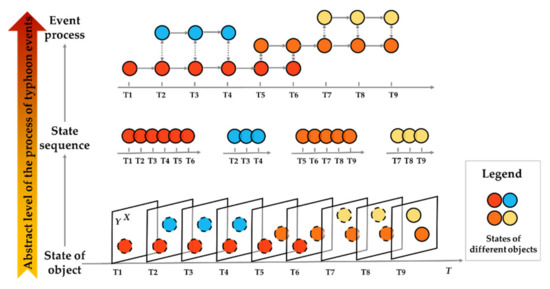
Figure 1.
The state sequences of different objects which constitute the process of typhoon events.
2.1.4. TEIM Framework
Based on the above analysis, the TEIM model including object, state and process is constructed (Figure 2). The object level includes the object categories which constitute the typhoon events and the feature types which can represent the objects. The state level describes the specific attribute and behavior features of different objects under certain spatio-temporal conditions. The process level describes the change of attribute and behavior features in a certain spatio-temporal scope. The multi-level structure not only highlights the features of different objects in the events, but also expresses the evolution process of typhoon events through the state sequence of multiple objects.
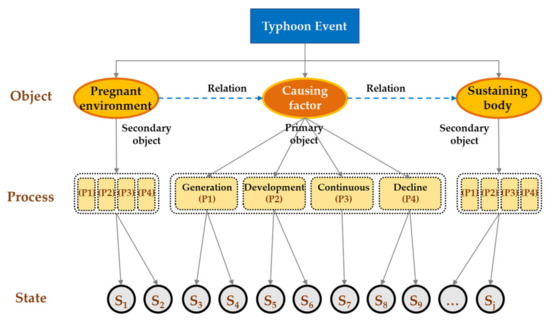
Figure 2.
The framework of the information model of typhoon events.
2.2. Information Extraction of Typhoon Events from Microblog Text
Typhoon event information extraction is the extraction of typhoon event-related object names and various kinds of feature information from microblog text. Based on the existing information extraction methods, and taking into account the non-standard language description characteristics such as abbreviation, alternative names and colloquial style, this paper extracts information of typhoon events from microblog text in Chinese (mandarin).
Different categories of objects have obvious differences in name, attribute and behavior information. For microblog text, the contextual features are sparse and the expression forms are complex. More importantly, there is also a lack of a large-scale annotated corpus. Therefore, machine learning methods based on supervised learning are difficult to be directly transplanted to extract such information. In this paper, a method combining trigger words and syntactic rules is used to extract object name, attribute, and behavior information [31]. After analyzing the lexical characteristics of 5000 typhoon-related Chinese texts on Sina Weibo, the expressions are various, but they basically conform to the basic grammar rules of Chinese [32]. Moreover, different rule patterns are also closely related to specific trigger words. The common patterns of syntactic rules are shown in Table 4.
Table 4.
The patterns of syntactic rules.
Because the language expression of microblog text is colloquial, the manually summarized trigger words is relatively insufficient. In order to expand the scale of trigger words, the word vector model is used to extract the words which are close to the trigger words as the supplement words [33]. Based on trigger words and syntactic rules, the knowledge base for object information extraction and classification is constructed. The knowledge base is oriented to all object categories in Table 1, with some examples shown in Table 5.
Table 5.
The examples of knowledge base structure for object information extraction and classification.
The structure of the knowledge base is divided into four levels, which are explained in the form of codes: (1) The letters of the first level indicate different object categories, e.g., P stands for cyclone object, Sc stands for infrastructure object. (2) The letters of the second level indicate different object subcategories, e.g., Scb stands for urban greening object of infrastructure. (3) The number of the third level indicates the category of collocation between the trigger words, e.g., 1 and 2 stand for two different categories of triggering collocation. (4) The letters of the fourth level (e.g. w1) indicate different groups of trigger words.
Time information is usually described in a general form with clear concepts, and specific grammatical rules can be summarized due to the prominent linguistic features. In this paper, time information is extracted by combining rules with the conditional random field (CRF) model [34]. Location information in microblog text mainly includes place name, address, coordinate, and other forms. The geographical entity identification method may be referred to for the extraction of place name and address information; thus, this paper selects deep belief network (DBN) model for the extraction [35]. Coordinate has a relatively fixed description form, so regular expression is used to define the corresponding logical formula in advance to filter the coordinate information in the microblog text.
Based on extracting information elements of typhoon events, the relation of information elements is recognized according to proximity law. According to the tuple form of Formula (2), the object name and feature information in the same microblog text are filled to form structured object information tuples. In Figure 3, name and feature information are extracted for the three categories of objects: Lekima, train, and people. The information tuples of the primary object “Lekima” are marked as PO, and the other secondary objects are marked as SO. It should be noted that a microblog text usually only describes one aspect of a typhoon event; thus, there can be a lack of attribute (A) or behavior (B) information in the object information tuple.
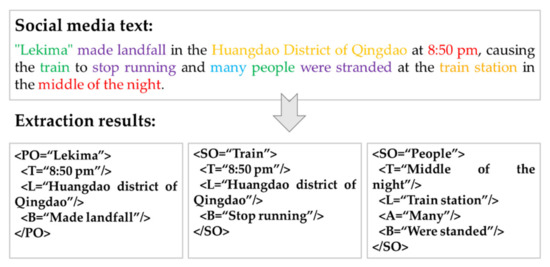
Figure 3.
Examples of information extraction results.
2.3. Information Aggregation for the Process of Typhoon Events
The extracted information of typhoon events has the characteristics of high fragmentation degree, different granularity and disorder, which cannot directly reflect the evolution process of typhoon events. Following the basic framework of TEIM, the information aggregation method for the process of typhoon events (TEPIA) further reintegrates the extracted information from three levels: object, state, and process.
2.3.1. Object Information Aggregation Based on Multi-Feature Similarity
For the extracted object information tuple On, the information is aggregated with the object as the core. The aggregation mechanism includes the following parts:
- (1)
- Aggregation based on object names. Set the object name to be aggregated as N, then determine the similarity simn between the On’s object name and N in turn. If simn ≥ εn, εn is the similarity threshold of the object name, then it indicates that they are the same object and their tuples On can be used as the aggregation results. Word vector similarity method is used to measure the similarity degree of object names. The word vector similarity method uses the Skip-gram model to train the word vector model as the basis; firstly, the object name is mapped to a vector in multi-dimensional space; then, the similarity algorithm is used to judge whether the direction of different vectors is consistent in multi-dimensional space; finally, cosine similarity is used to measure. The setting of the similarity threshold should follow the expert knowledge, or evaluate the suitability of the threshold value through test results. The value of εn in this paper is set as 0.7.For instance, O(typhoon) = < T: 1:45 on 10 August 2019; L: Wenling City, Zhejiang Province; A: force 16 wind; B: landfall > and O(tropical cyclone) = < T: 20:50 on 11 August 2019; L: Qingdao City, Shandong Province; A: wind force 9 level; B: landing > are the object information tuple extracted from the microblog text. When “object name = cyclone “is the aggregated condition, the similarity of the object names “typhoon” and “tropical cyclone” in the information tuple is judged. The similarity of the word vectors of “typhoon” and “tropical cyclone” accords with the threshold range, and their semantics are both to express the cyclone itself. Therefore, O(typhoon) and O(tropical cyclone), two sets of information tuples, are all the aggregation results based on the object names.
- (2)
- Aggregation based on feature types. After aggregating the information tuples based on the object name, the aggregation results include many attribute features and behavior features of the same type, which can further aggregate information on specific features. Based on the aggregation results of object names, set the attribute feature and behavior feature to be aggregated as A and B. For attribute feature aggregation, the word vector similarity method is used to measure the similarity sima between the On’s attribute and A in turn. If sima ≥ εa, εa is the similarity threshold of the attribute, then it indicates that the attribute items are the same and attribute information can be aggregated; otherwise, the attribute items are different attribute types of the same object, and no aggregation of attribute items is performed. The behavior feature is aggregated in the same way, and the value of εa and εb in this paper are set as 0.7.For instance, based on the aforementioned object information tuples of O(typhoon) and O(tropical cyclone), the attribute “wind force” feature information of cyclone object is further aggregated. Both O(typhoon) and O(tropical cyclone) have the attribute item "wind force" that meets the similarity threshold. Therefore, < T: 1: 45 on 10 August 2019; L: Wenling City, Zhejiang Province; A: force 16 wind > and < T: 20: 50 on 11 August 2019; L: Qingdao City, Shandong Province; A: wind force 9 level > are taken as the aggregated results of the object features.
- (3)
- The organization of the results of object information aggregation. In Figure 4b, O(N) is the aggregated object, Al is the attribute item of the aggregated object, als is the specific attribute value, Bn is the behavior item of the aggregated object, bnu is the specific behavior value, and <T,L> is the time and location where the attribute or behavior value generated. Based on the object information aggregation, the original fragments of information are associated with the objects they describe, and the same attribute items and behavior items are merged together. In addition, each attribute item and behavior item contains different feature values under multiple spatio-temporal conditions.
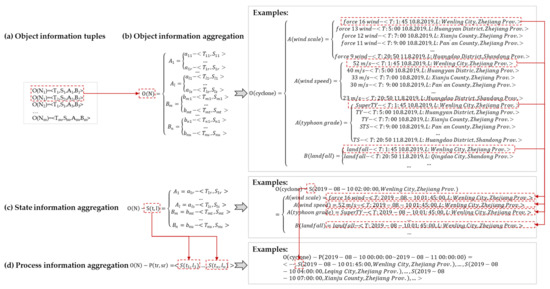 Figure 4. Aggregate result structure and examples. (a) a number of object information tuples extracted from microblog text; (b) the information aggregation results of objects; (c) the information aggregation results of states; (d) the information aggregation results of processes.
2.3.2. State Information Aggregation Based on Spatio-Temporal Features
State information aggregation is based on the result of object information aggregation, and it selects the attribute and behavior information according to the specific spatio-temporal features. The aggregation mechanism includes the following parts:
- (1)
- Unify spatio-temporal datum. For the time datum, the date is set to the Common Era (C.E.), the time is set to Beijing Time, and the spatial datum is set to WGS 84.
- (2)
- Standardize spatio-temporal information. There are many forms to express spatio-temporal features in social media texts, and time and location information should be transformed into standardized forms according to the unified spatio-temporal datum. For time information, reasoning mechanism and transformation rules are set up to transform it into standardized form for different time types and possible description forms [36].
Location information in microblog text usually includes place name, address, and space coordinate. For place name and address, the standardization is essentially the process of matching standard database, which is constructed by the published standard place names and addresses data [37]. Furthermore, the mapping relation between the place name and address and the space coordinate can be established by geocoding and reverse geocoding.
The standardized form of time has defined the format of “date + time” as “YYYY-MM-DD HH:MM:SS”, for instance, “2019-08-10 12:00:00”; the standardized form of location is defined as “toponym + address” or “space coordinate”, for instance, “Taizhou City, Zhejiang Province” and “(121.42, 28.66)”.
- (3)
- State aggregation based on spatio-temporal features. Set the time feature and location feature to be aggregated as t and l, based on result O(N) of object information aggregation, and in each attribute and behavior item of O(N), determine whether there is a feature value with T = t and L = l. If so, the feature value is used as aggregate information, or else continue to determine whether there is a feature value with L = l, T < t and T closest to t. If so, the feature value is used as aggregate information, or else continue to determine whether there is a feature value with L nearest to l, T < t and T closest to t. If so, the feature value is used as aggregate information, or else this attribute or behavior item is not aggregated.
By traversing all the attribute items and behavior items in O(N), each attribute item and behavior item can filter out up to one feature value which is most consistent with the spatio-temporal feature. These attribute information and behavior information are aggregated to form the state information aggregation results of the object under specific spatio-temporal conditions.
For instance, the microblog text recorded that at 1:45 on 10 August, the wind scale of the cyclone reached force 16 wind in Wenling City, Zhejiang Province. When the (2019-08-10 2:00:00, Wenling City) state of the cyclone is aggregated, since there is no information about the wind scale updated between 1:45–2:00, the “force 16 wind” is regarded as the one attribute of the (2019-08-10 2:00:00, Wenling City) state of the cyclone object.
- (4)
- The organization of the results of state information aggregation. In Figure 4c, S is the state of the object O(N) at time t and location l, Al and als are the attribute features of the state, Bn and bnu are the behavior features of the state, and <T,L> is the time and location where the attribute and behavior feature value generated.
2.3.3. Process Information Aggregation Based on States
The process of typhoon events is composed of the different states of many objects. According to the time sequence relationship, the results of state information aggregation are connected with each other to form the result of process information aggregation. The aggregation mechanism includes the following parts:
- (1)
- Aggregation of state sequence. The state sequence is the connection of different states of the same object in time and space. Set the time range and space range to be aggregated as tr and lr, based on the result O(N) of object information aggregation, iterate through all the attribute items and behavior items of the O(N). In each attribute item and behavior item, determine whether there are any feature values of T ⊆ tr and L ⊆ lr, and a set of spatio-temporal nodes is formed with all the <T,L> in the range of tr and lr. For all spatio-temporal nodes in the set, the results of state information aggregation are obtained by using the method of Section 2.3.2.Sort all the results of state information aggregation. Firstly, according to the time features, follow the order or inversed order to arrange the states; Secondly, according to the space features, follow the scale from large to small or from small to large to arrange the states; Finally, according to the attribute and behavior features, follow the magnitude or the similarity of the feature value to arrange the states. A state sequence sorted by multiple features is the process information aggregation result of a single object. The results of process information aggregation can be organized as the form in Figure 4d. P is the process that the object O(N) experiences over the time range tr and space range lr, and S is the state of each spatio-temporal node <tn,ln> that makes up the process.
- (2)
- Aggregation of event process. The event process is further integration of the aggregated results of multiple state sequences. Firstly, all the spatio-temporal information of each object should be taken into account when constructing the set of spatio-temporal nodes; secondly, for multiple state sequences, the same sorting mechanism should be adopted to ensure the consistency of the overall order of aggregation results.
3. Case Study
3.1. Study Data
Super typhoon “Lekima” (International Code: 1909) is the ninth named tropical storm of the 2019 Pacific typhoon season. Due to its landing at wind speeds reaching 52m/s, Lekima is the strongest typhoon to land in China in 2019 and the fifth strongest since 1949. The track of the typhoon after its landfall in China and the areas it passes through are shown in Figure 5. During the typhoon Lekima event, the wind intensity was super strong, and it lasted for a long time and moved widely. The categories of objects involved in the event are abundant, and the state changes of different objects are also more diverse. Therefore, “Lekima” is typical in typhoon events. As a case, it can cover all kinds of conditions that may appear in the process of typhoon events, and the study results are more universal.
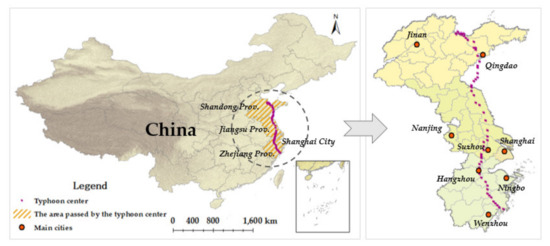
Figure 5.
The track of typhoon Lekima after its landfall.
Sina Weibo, one of the most popular social media platforms in China, has been experiencing explosive growth since its launch in 2009. As of the second quarter of 2020, monthly active users on the platform had reached 523 million. Compared to other microblog platforms, Sina Weibo has a higher degree of discussion on various topics. Moreover, a large number of active users are widely distributed, which is more conducive to provide comprehensive data support for the information detection. Based on Sina Weibo, 67,579 microblogs (5,709,114 characters) in Chinese about the keywords “Typhoon” and “Lekima” from 9 August to 12 August were collected. This study selects microblogs of the main typhoon areas (Zhejiang Province, Jiangsu Province, Shanghai City, and Shandong Province) for processing and analysis (Figure 6). The system environment for data processing is the Windows 10 with an AMD A8-7600 3.1 GHz processor and 4GB of memory.
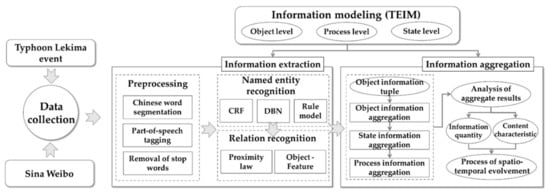
Figure 6.
Technical process of case study.
- (1)
- Using ANSJ (https://github.com/NLPchina/ansj_seg (accessed on 14 March 2021)) to preprocess the microblog text, such as Chinese word segmentation, part-of-speech tagging and removal of stop words.
- (2)
- Based on the named entity recognition method, the object name, and feature information in microblog text are extracted. The CRF model for extracting time information uses the “Yet Another CRF toolkit” tool (https://taku910.github.io/crfpp/#download (accessed on 14 March 2021)). The DBN model for extracting location information is based on the TensorFlow framework (https://github.com/fuzimaoxinan/Tensorflow-Deep-Neural-Networks (accessed on 14 March 2021)). When extracting object name, attribute and behavior information, syntactic annotations are performed based on the results of part of speech tagging. The word vector model to supplement trigger words is based on the Word2vec framework (https://github.com/nlpchina/word2vec_java (accessed on 14 March 2021)), and the word vector dimension is 200.
- (3)
- To filter microblogs, the microblog text needs to include object name, time, and location information, as well as attribute or behavior information. A total of 34,825 microblogs (4,013,341 characters) were selected as study data. Based on the relation recognition method, the object name and feature information of each microblog in the study data are associated to form the object information tuples.
- (4)
- For the object information tuple, firstly the object information is aggregated as core, then the state information and process information of the object are further aggregated according to the spatio-temporal features. When aggregating state information, location information is standardized using the geocoding and reverse geocoding API of Amap (https://developer.amap.com/api (accessed on 14 March 2021)).
- (5)
- Based on the aggregation results of different levels, the information detection of the process of typhoon events is realized by analyzing the location movement and attribute and behavior feature information changes between states of different objects.
3.2. Accuracy Evaluation of the Results of Information Extraction and Aggregation
Test data were randomly selected from all the study data for 5 times, and 200 microblogs were selected each time. The average of all tests was used as the evaluation result. The test data were manually annotated with 495 object names, 1566 time information, 1194 location information, 542 attribute information, and 461 behavior information. For the information extraction effect of microblog text, by comparing the results of manual annotation with those of extraction, the precision (P), recall (R) and F1 value were evaluated.
In the formula, NTP,i is the correct number of judged samples in category i; NFP,I is the number of misjudged samples in category i; NFN,i is the number of samples in category i that are misjudged as other categories.
The extraction method used in this paper can accurately identify the typhoon event information from microblog text. The results of time information extraction are the best, P, R and F1 reach 97.5%, 91.8% and 94.6%. Whereas the R for location information is only 77.5% (Figure 7a). Microblog users can share information anytime and anywhere, including some low-grade toponyms and addresses, which makes it difficult to identify this location information (Table 6). In terms of operational efficiency, it takes 40.2 s to process 10,000 microblogs for naming entity recognition such as object name, and attribute and behavior information, and 16.1s to process 10,000 microblogs for relationship recognition of object name and feature information. It can basically meet information extraction requirements in the current large-scale microblogs.
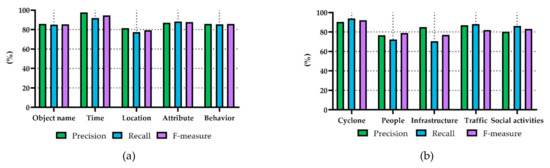
Figure 7.
Evaluation results of information extraction of typhoon events from microblog text. (a) evaluation results of different types of features; (b) evaluation results of different categories of objects.
Table 6.
Part error results of information extraction.
Among different categories of objects, the results of information extraction also vary greatly (Figure 7b). The R of infrastructure object information is less than 75%. The main reason is that infrastructure contains multiple categories of objects, and trigger words cannot be completely covered. For instance, "The underground parking lot is flooded …", in which "parking lot" is not added to the knowledge base (Table 6). Moreover, some trigger words have different semantics with the change of context. For instance, in order to take into account R for the important behaviors such as “injure”, some behavior information like ”… to soothe my injured heart for a day” is incorrectly extracted.
Accurate information extraction results are the basis for information aggregation, then the aggregation results of various objects in different spatio-temporal conditions are further evaluated. Taking the landfall state of typhoon Lekima as an example, the results of information aggregation are closely related to the actual situation of typhoon disaster. The aggregation results include the information of wind force, wind speed, and so on when the cyclone landed. Its accuracy can be confirmed by the data of meteorological monitoring in the same period. In addition, the results also include information about people, infrastructure, traffic, and social activities. It reflects the strong correlation between disaster severity and cyclone intensity. The aggregation results organize the dispersed information elements at multi-levels, to reflect the stage and situation of typhoon events under the special spatio-temporal conditions more directly (Figure 8).
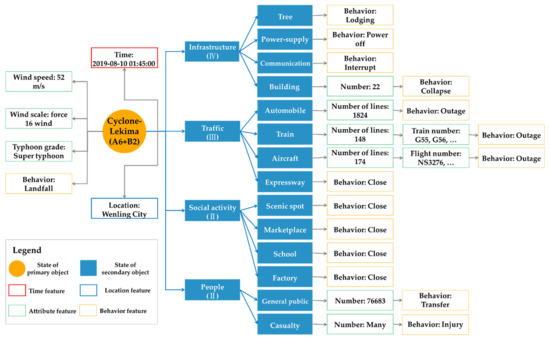
Figure 8.
Information aggregation results of states of different objects during the landfall of typhoon Lekima.
3.3. Analysis of Information Aggregation Results
3.3.1. Information Aggregation Results of Objects
After extracting information from all study data, the information aggregation results of objects, which contained cyclone, people, infrastructure, traffic, and social activities, are analyzed firstly. The results of the cyclone have the most information elements, with 210,916 items in total. For other objects, the quantity of information elements from more to less is traffic, people, infrastructure, and social activities (Figure 9a). This is mainly due to the strong sensitivity of traffic to weather conditions, human life safety has always been a topic of general concern, whereas the destruction of infrastructure and the reduction of social activities occur only when cyclone intensity reaches certain conditions.
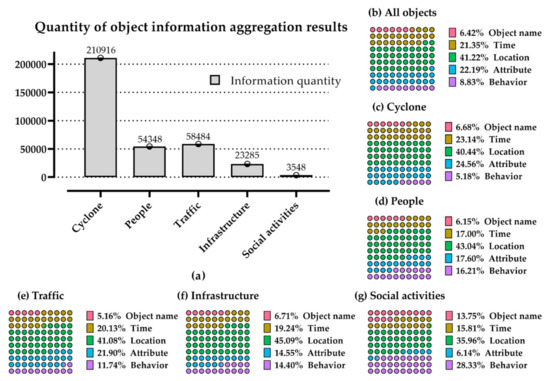
Figure 9.
Statistics of information aggregation results of different categories of objects.
For different categories of objects, there are also differences in the amount of information among each feature. Location information and time information are the most abundant categories. Especially location information accounts for 41.22% of the total information (Figure 9b). For cyclone and traffic objects, the amount of attribute information is also relatively large (Figure 9c,e). The attributes of cyclone mainly include wind force, wind speed, air pressure, and moving direction, while the attributes of traffic mainly focus on train number and flight number. For people and infrastructure objects, the amount of attribute and behavior information is roughly the same (Figure 9d,f) because of the correlation between attributes and behaviors. For instance, number of injuries (attribute) and injured (behavior), number of collapses (attribute) and collapse (behavior), etc. In particular, for social activities objects, the amount of behavior information is relatively large (Figure 9g). People pay more attention to the suspension and resumption of operations of different units and institutions in social activities.
3.3.2. Information Aggregation Results of States
According to the information aggregation results of states, the existence form of different objects in the typhoon event in a specific time and space can be grasped. The differences between the state information aggregation proposed in this paper with the traditional trigger word-based aggregation method are shown in Figure 10.
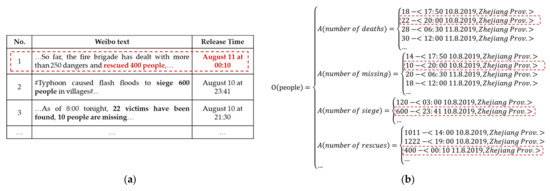
Figure 10.
Comparison of the results of different information aggregation methods. (a) information aggregation results of the trigger word-based method; (b) information aggregation results of states.
For the information about the people in Zhejiang Province involved in the typhoon event, the trigger word-based method can gather the relevant microblogs together. When the need to aggregate state information at 0:00 on 10 August, combined with the microblog release time for further screening, “400 trapped people were rescued” information can be obtained (Figure 10a).
For the state information aggregation method proposed in this paper, it is based on the information aggregation results of objects and further screening based on spatio-temporal features. Through the object information aggregation, the feature information of people object includes not only rescue but also death, siege, missing, and so on. When the need to aggregate state information at 0:00 on 10 August, the rescue information of “400 people” in accordance with the specific spatio-temporal features can be obtained, and the recently updated information can be obtained for other attributes, such as 10 people missing, 600 people siege, and so on (Figure 10b). In comparison, the information aggregation results of states are more comprehensive and can reflect the features of different objects in a specific time and space more completely.
Taking 1h as the time interval, the variation regularity of the quantity of states of different objects from 0:00 on 9 August to 23:59 on 12 August is calculated (Figure 11). The quantitative changes of states of people, infrastructure, traffic, and social activities are positively correlated with the cyclone states. Although different categories of objects have large differences in the quantity of states, there are similarities in the changing trends. However, each category of object has its own characteristics: (1) The cyclone states were most distributed during the periods of 1:00 on 10 August, and the first landfall of cyclone caused the most concern. (2) There were many extreme points in people states, and the continuous emergence of new casualties in typhoon events would always arouse attention. (3) The traffic states had a peak point of quantity in the middle period of the event. (4) The peak of the quantity of infrastructure states occurs a short time after the peak of cyclone states. (5) The highest point of the quantity of social activities appeared before the landfall of the cyclone.
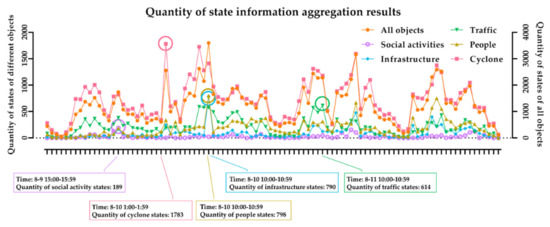
Figure 11.
Temporal distribution of results of state information aggregation.
Figure 12 reflects the spatial distribution of the different states, with at least one of the following characteristics in denser areas: (1) Strongly affected by a cyclone or located at key nodes of cyclone track, including Taizhou City, Wenzhou City, Ningbo City, and Qingdao City. (2) Regional central cities (municipalities, provincial capitals, etc.), including Shanghai City, Hangzhou City, Nanjing City, and Jinan City. (3) Cyclone affected areas for a long time, including Weifang City and Zibo City.
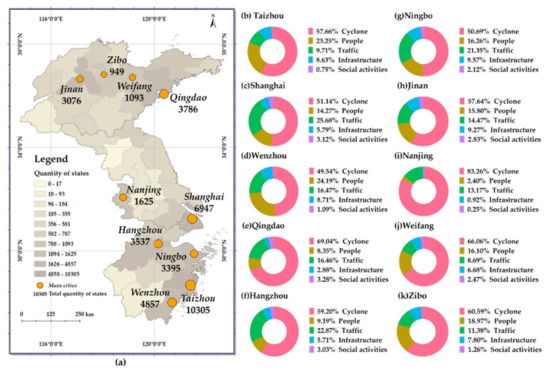
Figure 12.
Spatial distribution of results of state information aggregation.
3.3.3. Information Aggregation Results of Processes
By connecting different states in time and space, the location movement and feature change of different states with time during the process of typhoon events can be detected. This paper further analyzed the information aggregation results of processes of cyclone, people, infrastructure, traffic and social activities, and compares the aggregation results with meteorological monitoring data.
Figure 13 is the meteorological monitoring data for typhoon Lekima released by the Central Meteorological Observatory, including the moving track and intensity changes during the cyclone’s life cycle. Compared with the information aggregation results of the process of the cyclone, the two results are consistent in the evolutionary trend. The influence scope of the cyclone continues to move from south to north and presents the trend of expanding first and then shrinking (Figure 14). However, the two types of information reflect different features of some individual states. For instance, when the cyclone made its second landfall in Qingdao (21:00 on 11 August), the meteorological monitoring information was a force 9 wind, while the information in microblogs recorded “The weather was calm” (Figure 14). This is because the cyclone has weakened to a tropical storm, the structure of the cyclone is severely damaged so that the central pressure is very average, and no gale or rain is generated. Therefore, compared with fixed-scale meteorological monitoring data, microblog text is more able to reflect special weather changes at a small-scale.
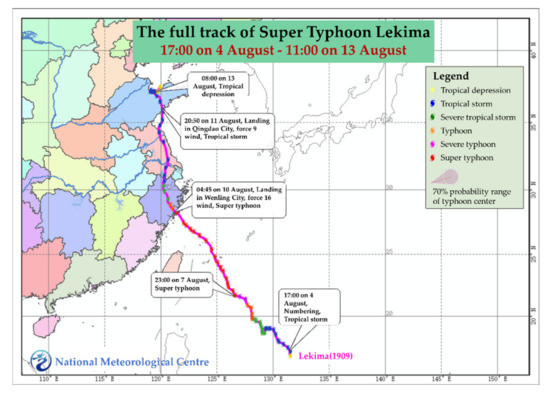
Figure 13.
The full track diagram of cyclone in typhoon Lekima event.
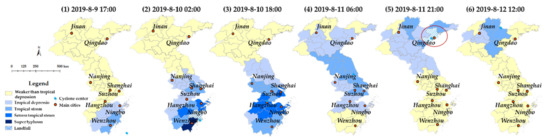
Figure 14.
The process of the state change of cyclone in the typhoon Lekima event.
For the process of social-environmental change that is difficult to be perceived by traditional meteorological monitoring, microblog text can also be used to detect. Based on the aggregated feature information of different states in the process, the states can be quantified and graded according to the state classification in Table 3.
- (1)
- The casualties caused by cyclone are very serious, and have a long duration, it is difficult to recover in the short term. (Figure 15a). Because there are many factors that can cause casualties in typhoon events, the state change of the people is accidental, which is not completely consistent with the process of the cyclone.
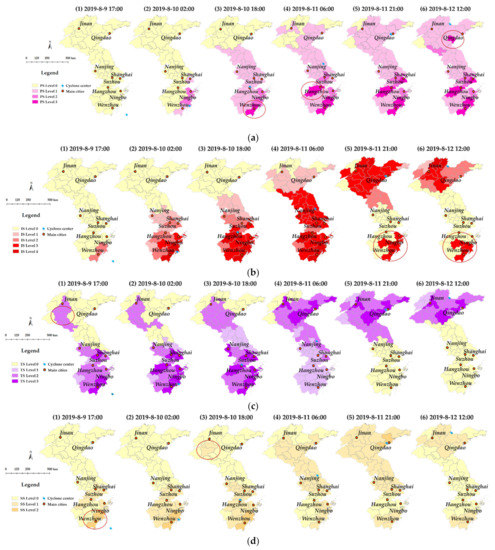 Figure 15. The process of the state change of people, infrastructure, traffic, and social activities in the typhoon Lekima event. (a) state change of people in the process; (b) state change of infrastructure in the process; (c) state change of traffic in the process; (d) state change of social activities in the process.
 - (2)
- The damage of infrastructure is directly related to the devastating effects caused by the cyclone, and the process of the state change of infrastructure is synchronized with that of the cyclone (Figure 15b). In general, the level of the infrastructure states in the cyclone center area is relatively high. After the cyclone has left, the states of the infrastructure depending on the extent of the damage, and the persistence of the state level varies.
- (3)
- Traffic has strengthened the links between different regions, and in typhoon events have accelerated the spread of the impact on traffic operations (Figure 15c). For instance, at 17:00 on 9 August, the cyclone began to affect Taizhou and Wenzhou, resulting in the suspension of train and flight in the region. However, inter-city traffic in other areas not affected by the cyclone was also affected.
- (4)
- The public can prevent disasters that have not occurred in advance; thus, the process of the state change of social activities is more advanced than the cyclone process (Figure 15d).After the cyclone left, social activities usually resumed shortly thereafter. In some areas where the damage is severe, social activities cannot be restored immediately, owing to the harsh post-disaster environment (e.g., collapsed houses, flooded roads, etc.).
4. Discussion
Real-time microblog has shown increasing potential in disaster management. Typhoon event information modeling is a basic scientific problem for information detecting of the process of typhoon events based on microblog text. In the TEIM, the primary objects and secondary objects that make up the typhoon events are analyzed. The time, space, attribute, and behavior features of different categories of objects are sorted out. In addition, the “state-process” represent mechanism is used to describe the dynamic characteristics of typhoon events. Compared with the traditional typhoon event information modeling, the static conceptual model ignores the dynamic process and internal motivation of spatio-temporal variation of the typhoon event, while the time snapshot model cannot represent the process characteristics of different objects and the relationship between objects in the event. TEIM takes time and space as the framework, and abstracts the objects, processes and states of typhoon events by multi-level. It not only highlights the features of different objects in the events, but also represents the evolution process of typhoon events through the state sequence of multiple objects.
Based on the basic framework of TEIM, an information aggregation method for the process of typhoon events (TEPIA) is further proposed. Through the hierarchical aggregation of “Object-State-Process”, the problems of typhoon event information about decentralization, spatial-temporal granularity diversification and disorder in microblog text are solved, respectively. Especially, in the state information aggregation, the aggregated results on any spatio-temporal nodes are not only limited to the attribute and behavior information under specific spatio-temporal features, but also include the recently updated information of other features in the past time, which ensures the completeness and integrity of the aggregated results. Compared with the trigger word-based aggregation, TEPIA results are more detailed in information granularity. The trigger word-based model does not change the original data carrier unit of a microblog, but rather brings together microblogs that contain specific keywords or topics. The aggregation results are still the original unit of microblog text from which need to find the desired information for the user. TEPIA is actually the aggregation method for information elements of typhoon events. Furthermore, it can provide more intuitive aggregation results for users on the basis of the quantitative classification of state types of objects.
Through the case study, the mining of microblog text is beneficial to make full use of the complementary advantages of microblog and traditional meteorological monitoring in the current big data environment. In order to take full advantages of microblog text, data scale and quality are also important factors that cannot be ignored. (1) The degree of microblog abundance will affect the integrity of results. The appropriate scale of microblogs supporting information detection is positively related to the duration, scope and extent of typhoon events. When collecting microblogs, it shall at least cover the microblogs published in the affected areas related to the disaster within the period when typhoon occurs. (2) Most microblogs are published by the public; thus, they often contain the public’s perceptual cognition. As a result, the authenticity of some microblogs is in doubt. It is necessary to strengthen the discrimination of rumors and false information in microblogs [38,39].
More importantly, the method proposed in this paper can provide strong support for improving the service capability of social media resources in disaster management. On the one hand, this method can process 10,000 microblogs for information acquisition of typhoon events in one minute. The high efficiency can adapt to the fast updating dynamic microblog data, and is also helpful to extend this method to other typhoon events. On the other hand, this method has universality in application. TEIM and TEPIA are conceptual frameworks for typhoon event information organization and reconstruction, and there are no restrictions on the source and language of microblog texts. Only the information extraction section is related to the language. Therefore, this method can provide reference for the information detection of the process of typhoon events in different languages and microblog platforms. Collecting microblogs from multiple platforms helps improve the comprehensiveness of results. This will be more conducive to supporting disaster early warning, monitoring, command, assessment, and other disaster management links.
5. Conclusions
The efficient and accurate information detection for the process of typhoon events can provide effective support for disaster management. At the era of big data, microblog text has become an important way to obtain information about typhoon events. Based on the dynamic evolution characteristics of typhoon events and the description features of microblog text, this paper proposes an information detection method of the process of typhoon events in microblog text. On the one hand, a multi-level typhoon event information model is constructed. In the spatio-temporal framework, the features of different objects in the event are described, and the process of typhoon events is represented by the state sequences of multiple objects. On the other hand, an information aggregation method for the process of typhoon events is proposed. Through the hierarchical aggregation of objects, states, and processes, the scattered resource fragments are aggregated to form the ordered information in accordance with of the process of typhoon events.
In future research, firstly, the accurate extraction of information elements in the microblog text is the basis of information aggregation. Through the introduction of domain ontology, as well as attention mechanism, iterative learning, and other deep learning models, the recognition effect can be further improved. Secondly, the geographic information, meteorological monitoring information and social media information are complementary to each other; thus, the typhoon event information aggregation method based on multi-source heterogeneous data is needed to be explored.
Author Contributions
Conceptualization, Peng Ye and Xueying Zhang; Data curation, Peng Ye and Wei Tang; Formal analysis, Peng Ye and An Huai; Investigation, Xueying Zhang; Methodology, Peng Ye and Xueying Zhang; Project administration, Xueying Zhang; Validation, Peng Ye and An Huai; Visualization, Peng Ye; Writing—original draft, Peng Ye; Writing—review and editing, Peng Ye and Xueying Zhang. All authors have read and agreed to the published version of the manuscript.
Funding
This research was funded by the National Natural Science Foundation of China (grant nos. 41631177, and 41971337).
Data Availability Statement
Not applicable.
Acknowledgments
The authors thank Jing Liu and Xiang Li for their critical reviews and constructive comments.
Conflicts of Interest
The authors declare no conflict of interest.
References
- Li, K.; Li, G.S. Vulnerability assessment of storm surges in the coastal area of Guangdong Province. Nat. Hazard. Earth Sys. 2011, 11, 2003–2010. [Google Scholar] [CrossRef]
- Alexander, D. World Disasters Report 2005: Focus on information in disasters. Disasters 2006, 30, 377–379. [Google Scholar] [CrossRef]
- Yang, Y.W.; Eckle, M.; Kuo, C.L.; Herfort, B.; Fan, H.C. Monitoring and Assessing Post-Disaster Tourism Recovery Using Geotagged Social Media Data. ISPRS Int. J. Geo-Inf. 2017, 6, 144. [Google Scholar]
- Xiao, H.J.; Wei, M.Y. An Early Warning Method for Sea Typhoon Detection Based on Remote Sensing Imagery. J. Coastal Res. 2018, 82, 200–205. [Google Scholar] [CrossRef]
- Wu, R.H.; Zhang, H.; Chen, D.K. Effect of Typhoon Kalmaegi (2014) on northern South China Sea explored using Muti-platform satellite and buoy observations data. Prog. Oceanogr. 2020, 180, 102218. [Google Scholar] [CrossRef]
- Townsend, L.; Wallace, C. The Ethics of Using Social Media Data in Research: A New Framework. In Advances in Research Ethics and Integrity; Woodfield, K., Ed.; Emerald Publishing Limited: Bingley, UK, 2017; Volume 2, pp. 189–207. [Google Scholar]
- De Bruijn, J.A.; De Moel, H.; Jongman, B.; Wagemaker, J.; Aerts, J. TAGGS: Grouping Tweets to Improve Global Geoparsing for Disaster Response. J. Geovis. Spat. Anal. 2018, 2, 1–14. [Google Scholar] [CrossRef]
- Wang, Z.Y.; Ye, X.Y. Space, time, and situational awareness in natural hazards: A case study of Hurricane Sandy with social media data. Carto. Geogr. Inf. Sci. 2019, 46, 334–346. [Google Scholar] [CrossRef]
- Martin, M.E.; Schuurman, N. Social Media Big Data Acquisition and Analysis for Qualitative GIScience: Challenges and Opportunities. Ann. Am. Assoc. Geogr. 2020, 110, 1335–1352. [Google Scholar] [CrossRef]
- Yan, Y.W.; Feng, C.C.; Huang, W.; Fan, H.C.; Wang, Y.C.; Zipf, A. Volunteered geographic information research in the first decade: A narrative review of selected journal articles in GIScience. Int. J. Geogr. Inf. Sci. 2020, 34, 1765–1791. [Google Scholar] [CrossRef]
- Liu, Y.; Liu, X.; Gao, S.; Gong, L.; Kang, C.G.; Zhi, Y.; Chi, C.H.; Shi, L. Social Sensing: A New Approach to Understanding Our Socioeconomic Environments. Ann. Assoc. Am. Geogr. 2015, 105, 512–530. [Google Scholar] [CrossRef]
- Sendai Framework for Disaster Risk Reduction 2015–2030. Available online: http://www.unisdr.org/files/43291_sendaiframeworkfordrren.pdf (accessed on 7 January 2021).
- Niles, M.T.; Emery, B.F.; Reagan, A.J.; Dodds, P.S.; Danforth, C.M. Social media usage patterns during natural hazards. PLoS ONE 2019, 14, e0210484. [Google Scholar] [CrossRef]
- Kopliku, A. Aggregated search: From information nuggets to aggregated documents. In Proceedings of the Conférence En Recherche Dinfomations Et Applications-coria, Presquîle De Giens, France, 5–7 May 2009. [Google Scholar]
- De Boom, C.; Van Canneyt, S.; Demeester, T.; Dhoedt, B. Representation learning for very short texts using weighted word embedding aggregation. Pattern Recogn. Lett. 2016, 80, 150–156. [Google Scholar] [CrossRef]
- Mugambi, S.K. Sentiment analysis for hate speech detection on social media: TF-IDF weighted N-Grams based approach. Ph.D. Thesis, Strathmore University, Nairobi, Kenya, 2017. [Google Scholar]
- Gründer-Fahrer, S.; Schlaf, A.; Wiedemann, G.; Heyer, G. Topics and Topical Phases in German Social Media Communication During a Disaster. Nat. Lang. Eng. 2018, 24, 221–264. [Google Scholar] [CrossRef]
- Wang, Y.; Taylor, J.E. Coupling sentiment and human mobility in natural disasters: A Twitter-based study of the 2014 South Napa Earthquake. Nat. Hazards 2018, 92, 907–925. [Google Scholar] [CrossRef]
- Ibrahim, R.; Elbagoury, A.; Kamel, M.S.; Karray, F. Tools and Approaches for Topic Detection from Twitter Streams: Survey. Knowl. Inf. Syst. 2018, 54, 511–539. [Google Scholar] [CrossRef]
- Resch, B.; Uslander, F.; Havas, C. Combining machine-learning topic models and spatiotemporal analysis of social media data for disaster footprint and damage assessment. Carto. Geogr. Inf. Sci. 2018, 45, 362–376. [Google Scholar] [CrossRef]
- Stephenson, M.; Vaganay, M.; Coon, D.; Cameron, R.; Hewitt, N. The role of Facebook and Twitter as organisational communication platforms in relation to flood events in Northern Ireland. J. Flood Risk Manag. 2018, 11, 339–350. [Google Scholar] [CrossRef]
- Li, Z.W.; Xing, Y.F. Research on the Evolution of Emergency Public Opinion Topic in the New Media Environment-A Case of “Jiuzhaigou Earthquake” in Sina Micro-blog. Inf. Sci. 2017, 35, 39–44. [Google Scholar]
- Liu, W.L.; Lai, C.H.; Xu, W.A. Tweeting about emergency: A semantic network analysis of government organizations’ social media messaging during Hurricane Harvey. Public Relat. Rev. 2018, 44, 807–819. [Google Scholar] [CrossRef]
- He, X.R. Typhoon disaster assessment based on Dombi hesitant fuzzy information aggregation operators. Nat. Hazards 2018, 90, 1153–1175. [Google Scholar] [CrossRef]
- Asghar, S.; Alahakoon, D.; Churilov, L. A comprehensive conceptual model for disaster management. J. Humanit. Assist. 2006, 1360, 1–15. [Google Scholar]
- Cyclone Warning Markup Language (CWML) (Version 1.0). Available online: http://xml.coverpages.org/NICTA-CWML-v10-2006.pdf (accessed on 7 January 2021).
- Huang, F.; Yan, L. Reasoning of ontology model for typhoon disasters domain based on Jena. J. Comput. Appl. 2013, 33, 771–775+779. [Google Scholar] [CrossRef]
- Han, M.K.; Lee, J.Y. Bayesian Typhoon Track Prediction Using Wind Vector Data. Commun. Stat. Appl. Methods 2015, 22, 241–253. [Google Scholar] [CrossRef]
- Chen, Y.; Duan, Z.D. A statistical dynamics track model of tropical cyclones for assessing typhoon wind hazard in the coast of southeast China. J. Wind Eng. Ind. Aerod. 2018, 172, 325–340. [Google Scholar] [CrossRef]
- Ye, P.; Zhang, X.Y.; Shi, G.; Chen, S.H.; Huang, Z.W.; Tang, W. TKRM: A Formal Knowledge Representation Method for Typhoon Events. Sustainability 2020, 12, 2030. [Google Scholar] [CrossRef]
- Yang, T.F.; Xie, J.B.; Li, Z.Y.; Li, G.Q. A Method of Typhoon Disaster Loss Identification and Classification Using Micro-blog Information. J. Geo-Inf. Sci. 2018, 20, 906–917. [Google Scholar]
- Tang, C.; Liu, C. Method of Chinese Grammar Rules Automatically Access Based on Mining Association Rules. In Proceedings of the 2008 International Symposium on Computer Science and Computational Technology, Shanghai, China, 20–22 December 2008. [Google Scholar]
- Du, Y.; Yuan, H.; Qian, Y. A Word Vector Representation Based Method for New Words Discovery in Massive Text. In Proceedings of the International Conference on Computer Processing of Oriental Languages National CCF Conference on Natural Language Processing and Chinese Computing, Kunming, China, 2–6 December 2016. [Google Scholar]
- Zhang, C.J.; Zhang, X.Y.; Li, M.; Wang, S. Interpretation of Temporal Information in Chinese Text. Geogr. Geo-Inf. Sci. 2014, 30, 1–6. [Google Scholar]
- Wang, S.; Zhang, X.Y.; Ye, P.; Du, M. Deep Belief Networks Based Toponym Recognition for Chinese Text. ISPRS Int. J. Geo-Inf. 2018, 7, 217. [Google Scholar] [CrossRef]
- Song, G.M.; Zhang, S.Q.; Jia, F.L.; Jiang, S.Y. Temporal Information Extraction and Normalization Method in Chinese Texts. J. Geomat. Sci. Technol. 2019, 36, 538–544. [Google Scholar]
- Lv, H.H.; Zhang, H.; Wang, Y.H. Place Name and Address Matching Method Based on Semantic Mining. In Proceedings of the 2016 4th International Conference on Electrical & Electronics Engineering and Computer Science (ICEEECS 2016), Jinan, China, 15–16 October 2016. [Google Scholar]
- Dayani, R.; Chhabra, N.; Kadian, T.; Kaushal, R. Rumor detection in twitter: An analysis in retrospect. In Proceedings of the IEEE International Conference on Advanced Networks & Telecommuncations Systems (ANTS), Kolkata, India, 15–18 December 2015. [Google Scholar]
- Chan, C.; Zhang, Y.H.; Szabo, C.; Sheng, Q.Z. Extreme User and Political Rumor Detection on Twitter. In Proceedings of the International Conference on Advanced Data Mining and Applications, Gold Coast, Australia, 12–15 December 2016. [Google Scholar]

Publisher’s Note: MDPI stays neutral with regard to jurisdictional claims in published maps and institutional affiliations. |
© 2021 by the authors. Licensee MDPI, Basel, Switzerland. This article is an open access article distributed under the terms and conditions of the Creative Commons Attribution (CC BY) license (http://creativecommons.org/licenses/by/4.0/).