
Using Geotagged Social Media Data to Explore Sentiment Changes in Tourist Flow: A Spatiotemporal Analytical Framework


Abstract
1. Introduction
2. Related Works
2.1. Tourist Flow Analysis
2.1.1. Tourist Flow Analysis Based on Traditional Data
2.1.2. Tourist Flow Analysis Based on Location Data
2.2. Sentiment Analysis
3. Study Area and Data
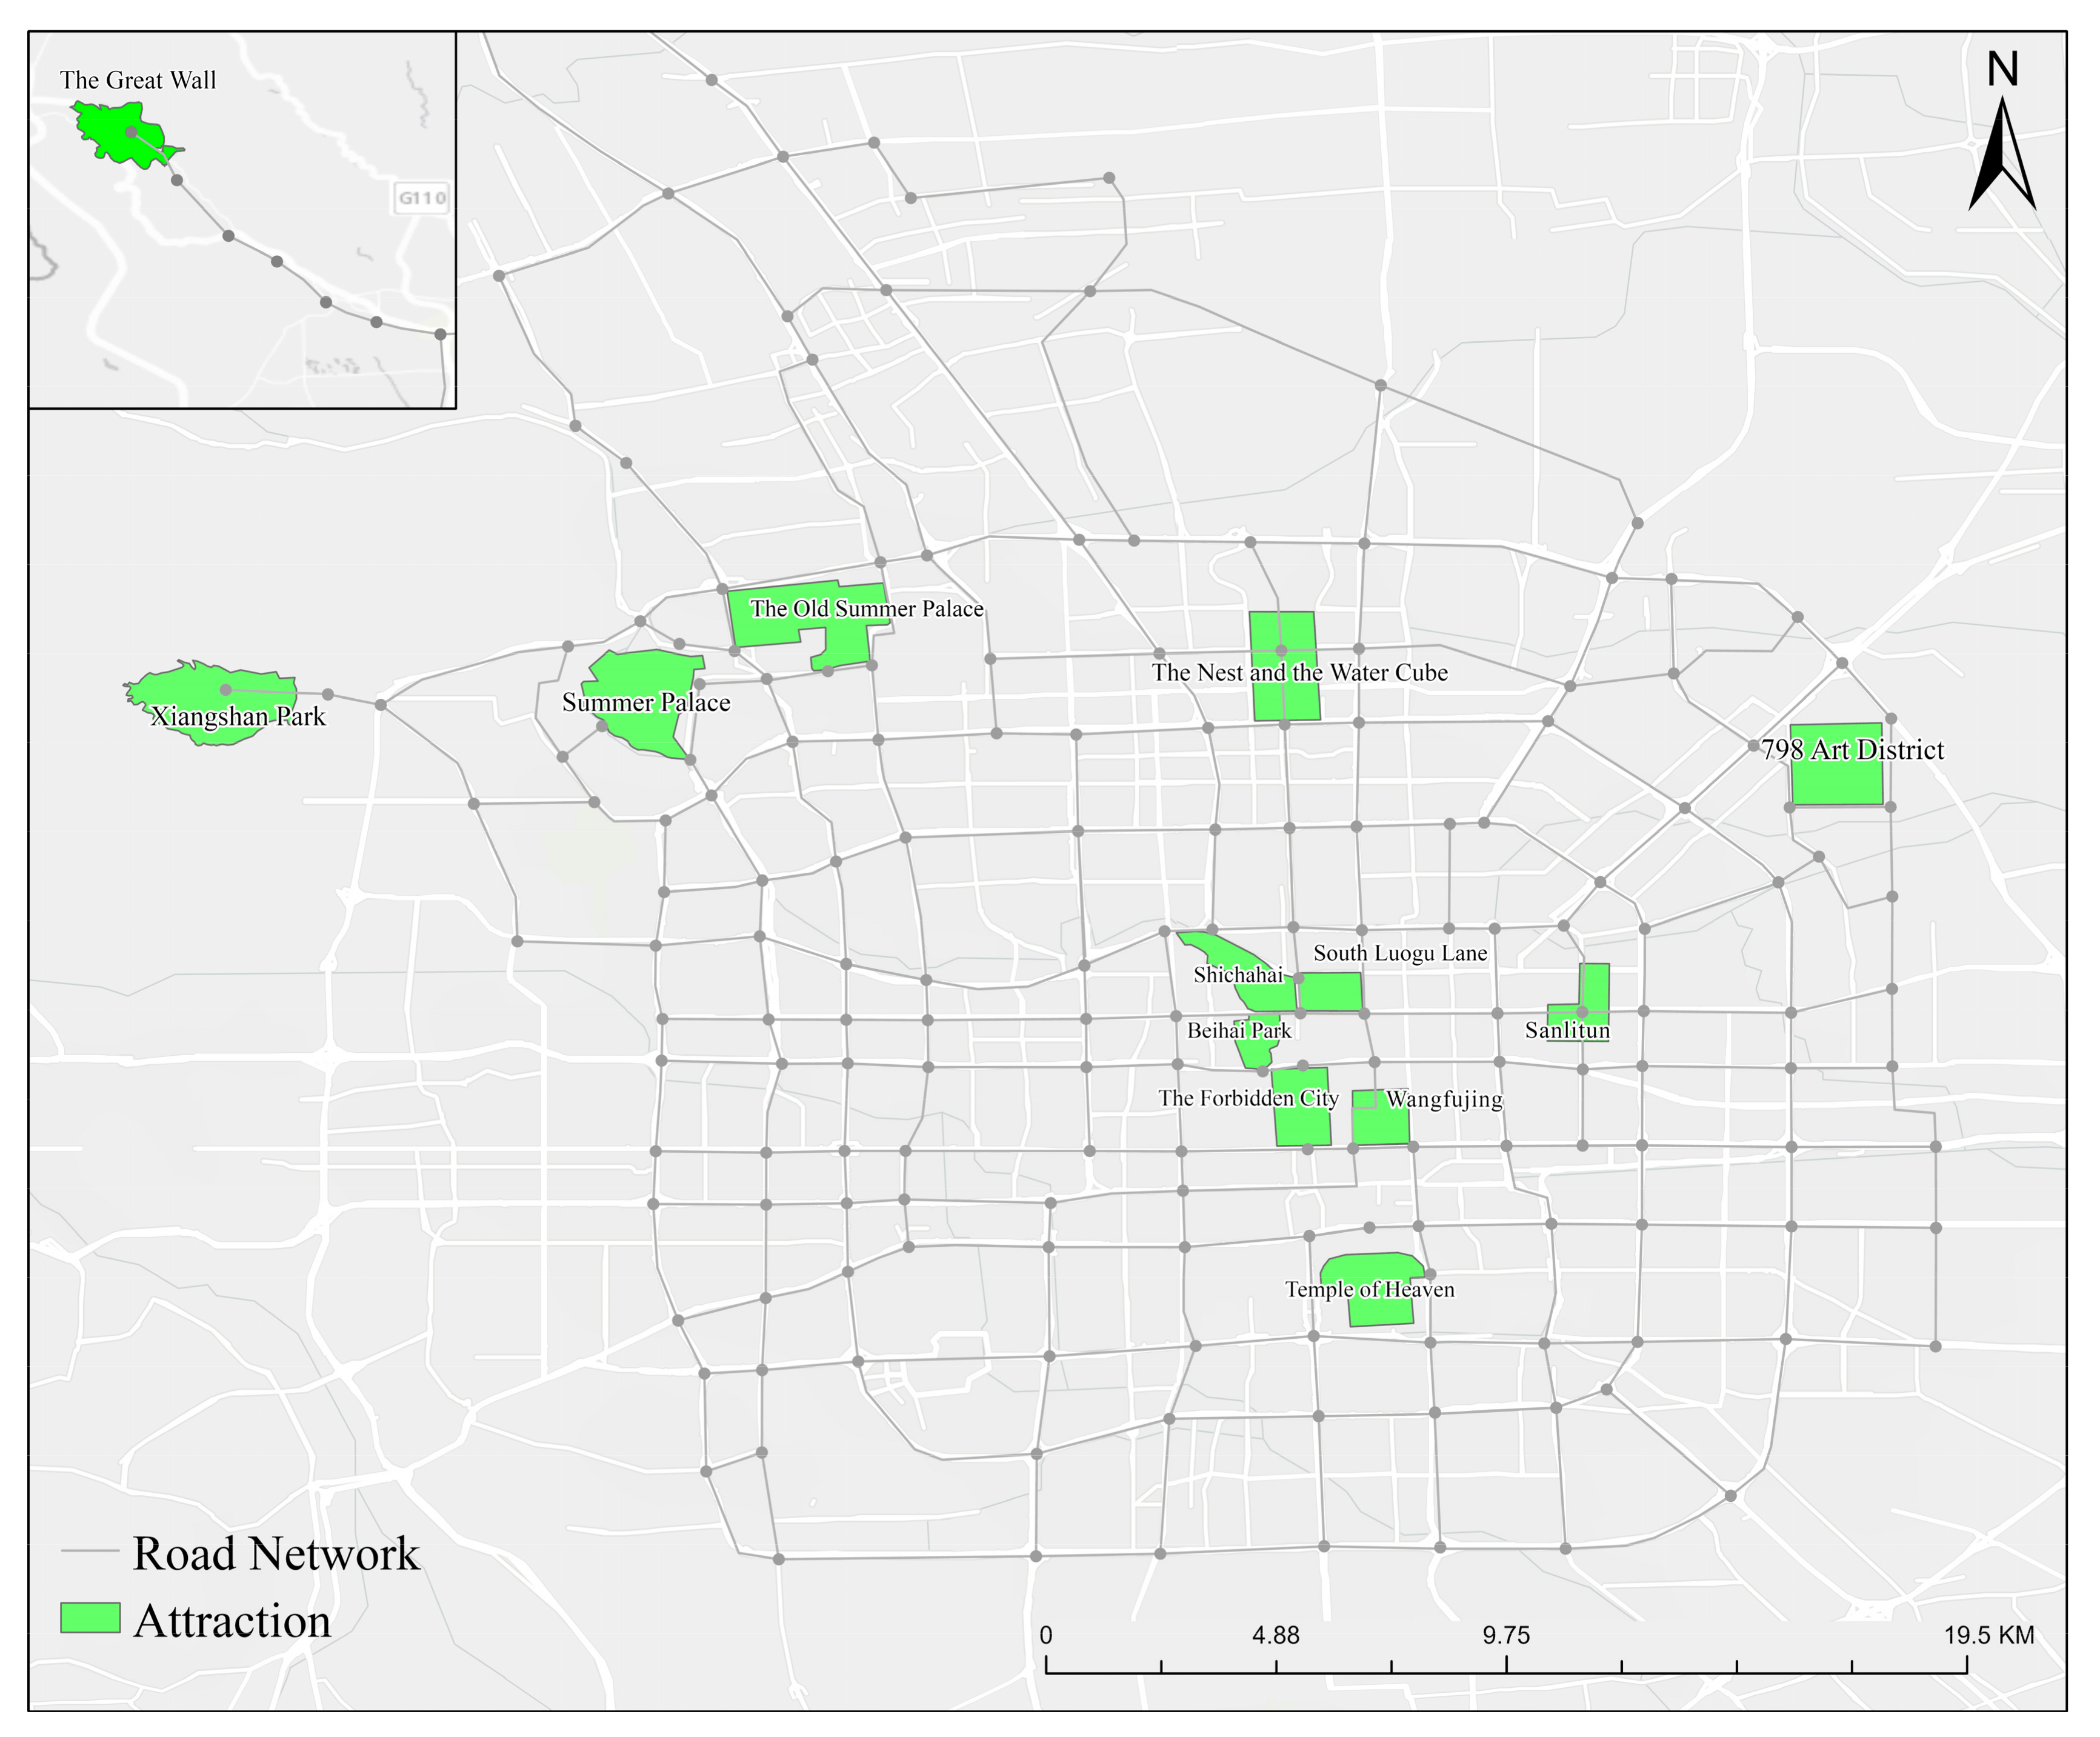
3.1. Study Area
3.2. Data Collection and Preprocessing
4. Method
4.1. Tourist Identification
4.2. Tourist Sentiment Evaluation
4.2.1. Sentiment Dictionary Construction
4.2.2. Grammatical Rule Construction
4.2.3. Sentiment Score Construction
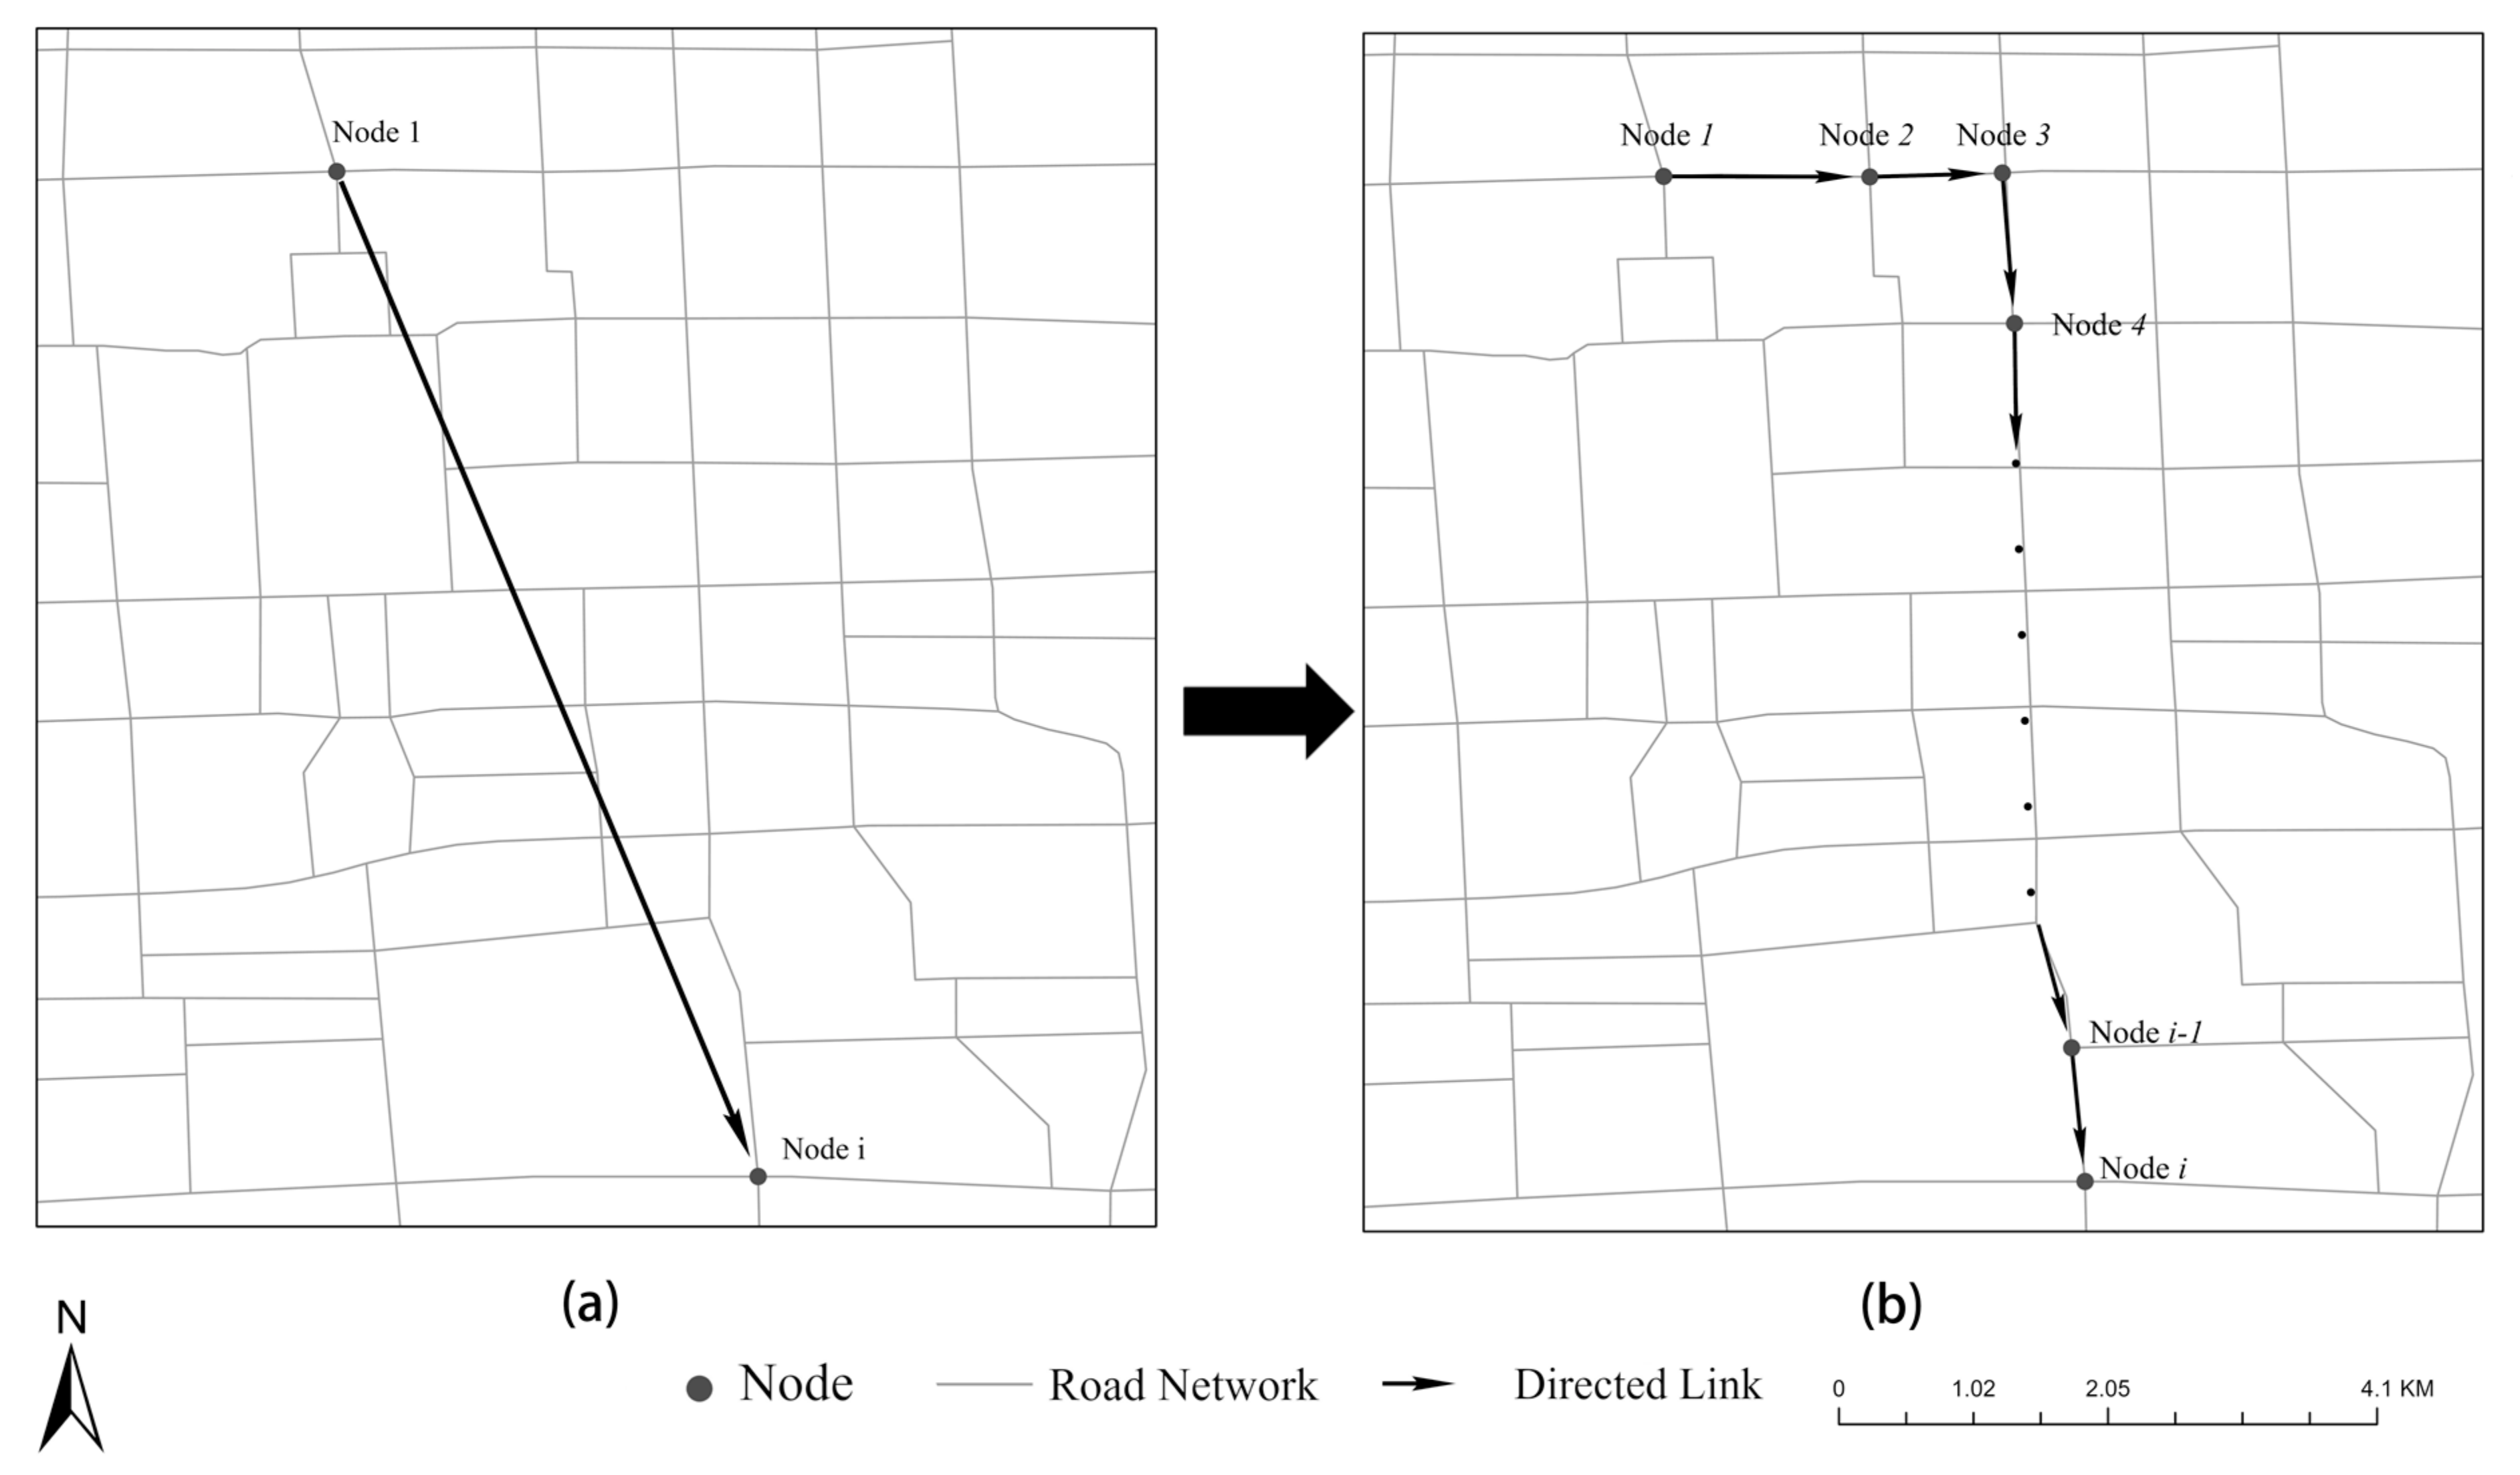
4.3. Sentiment Visualization of the Tourist Flow Network
4.4. Sentiment Profile Construction
5. Results
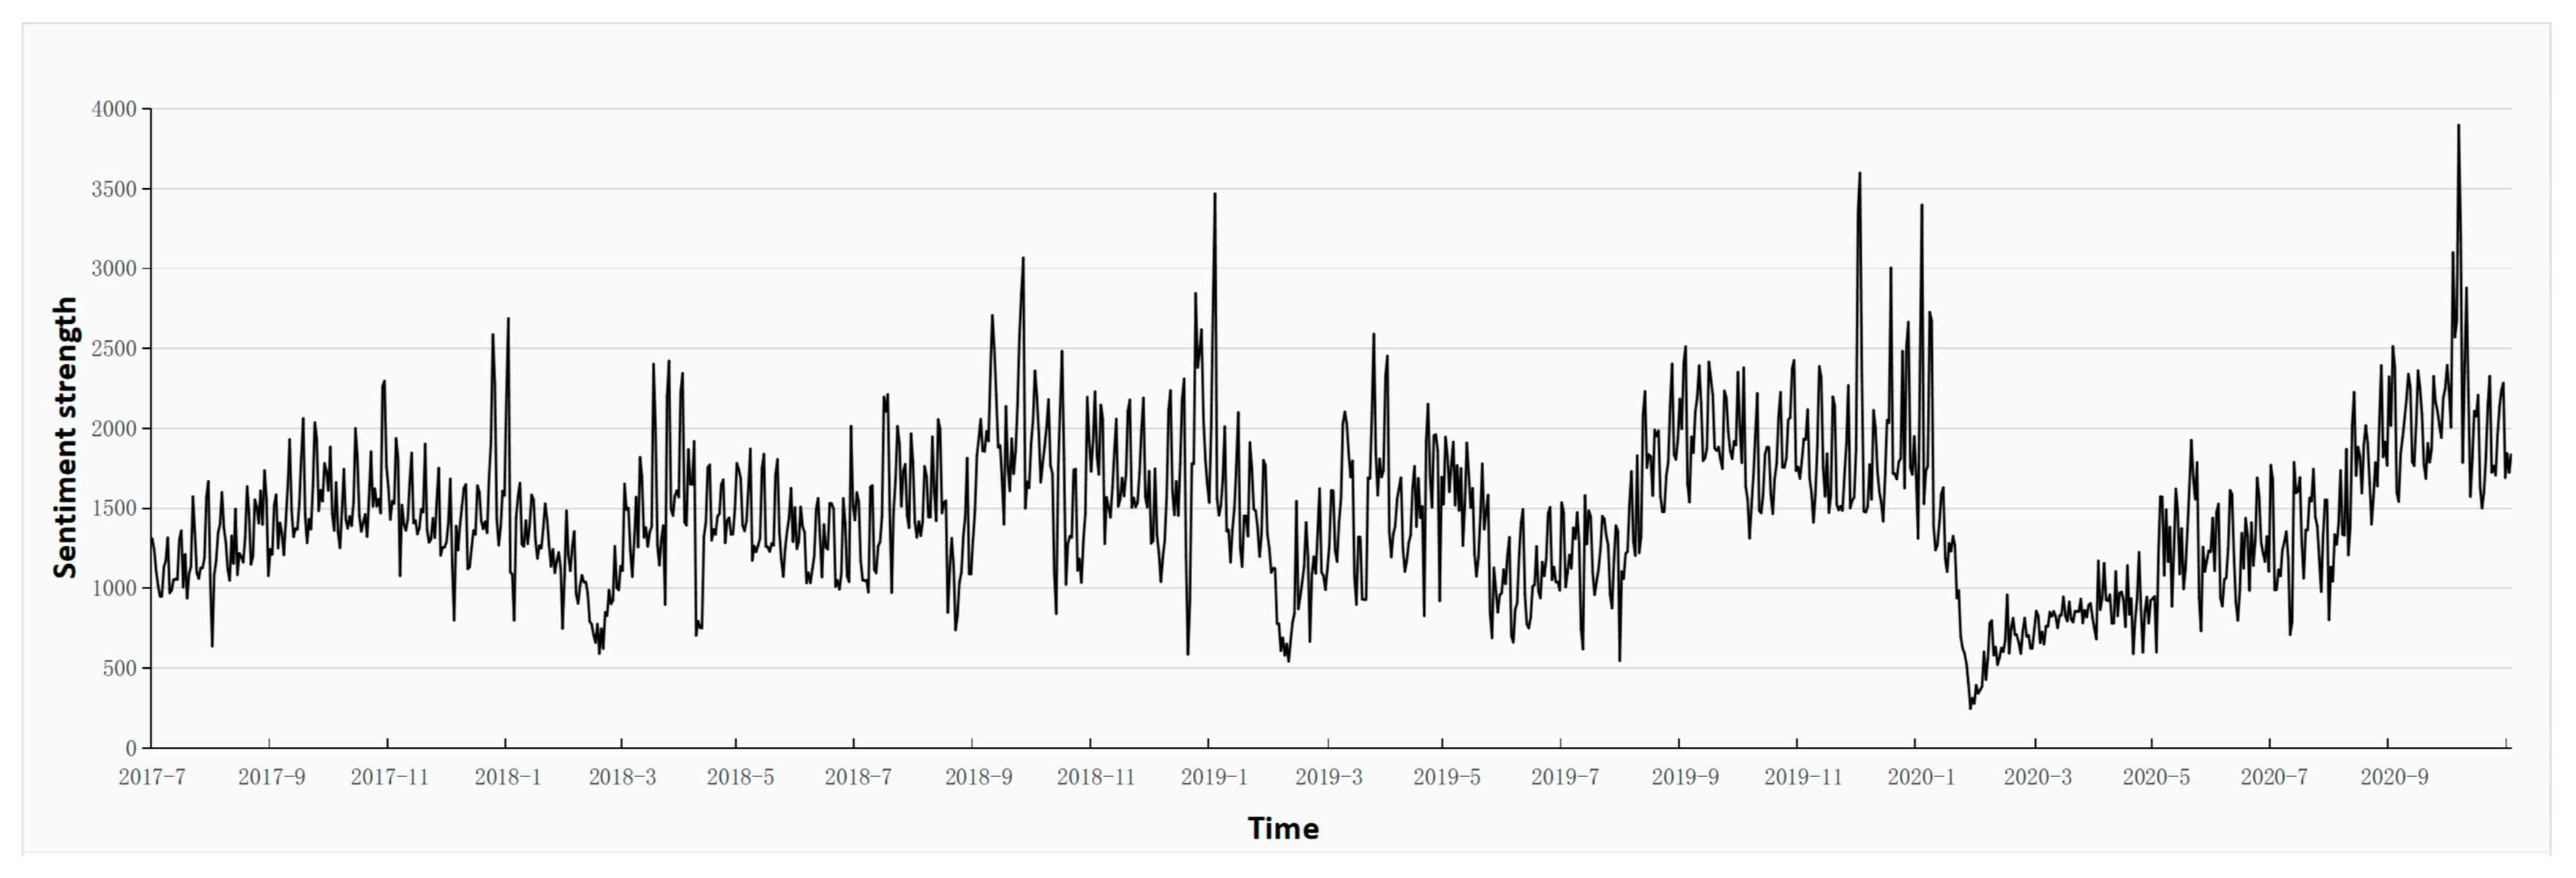
5.1. Temporal Pattern
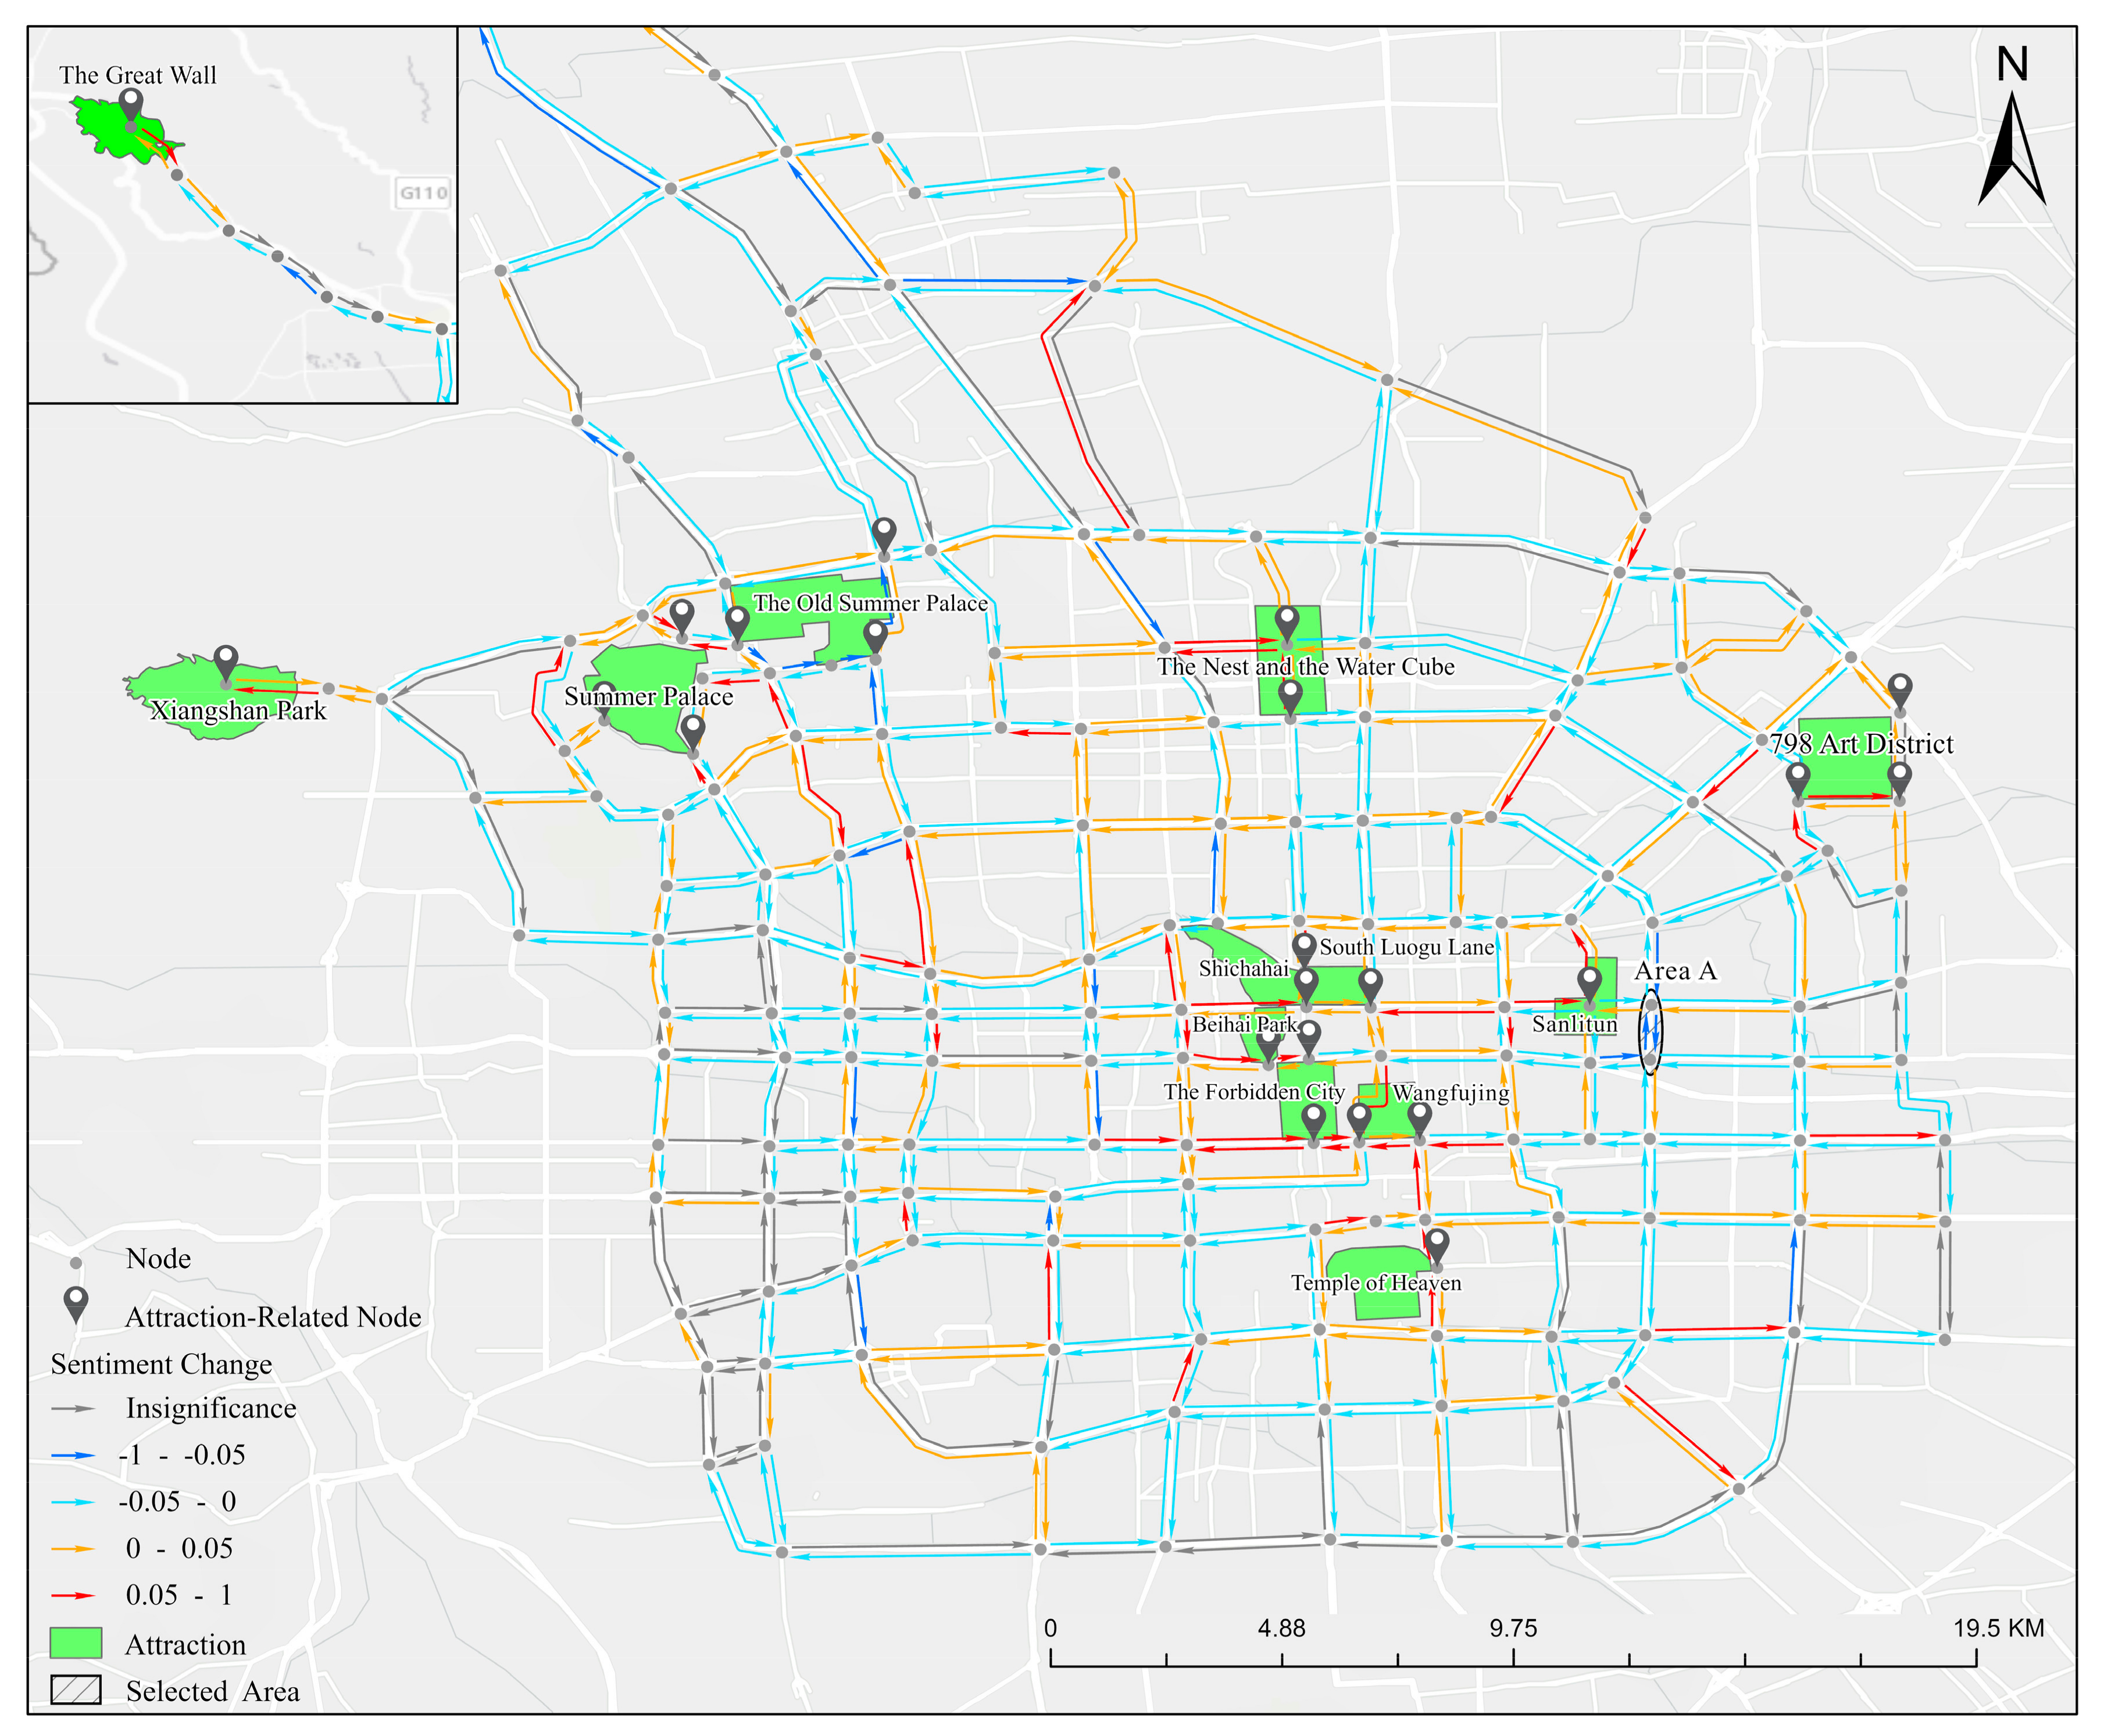
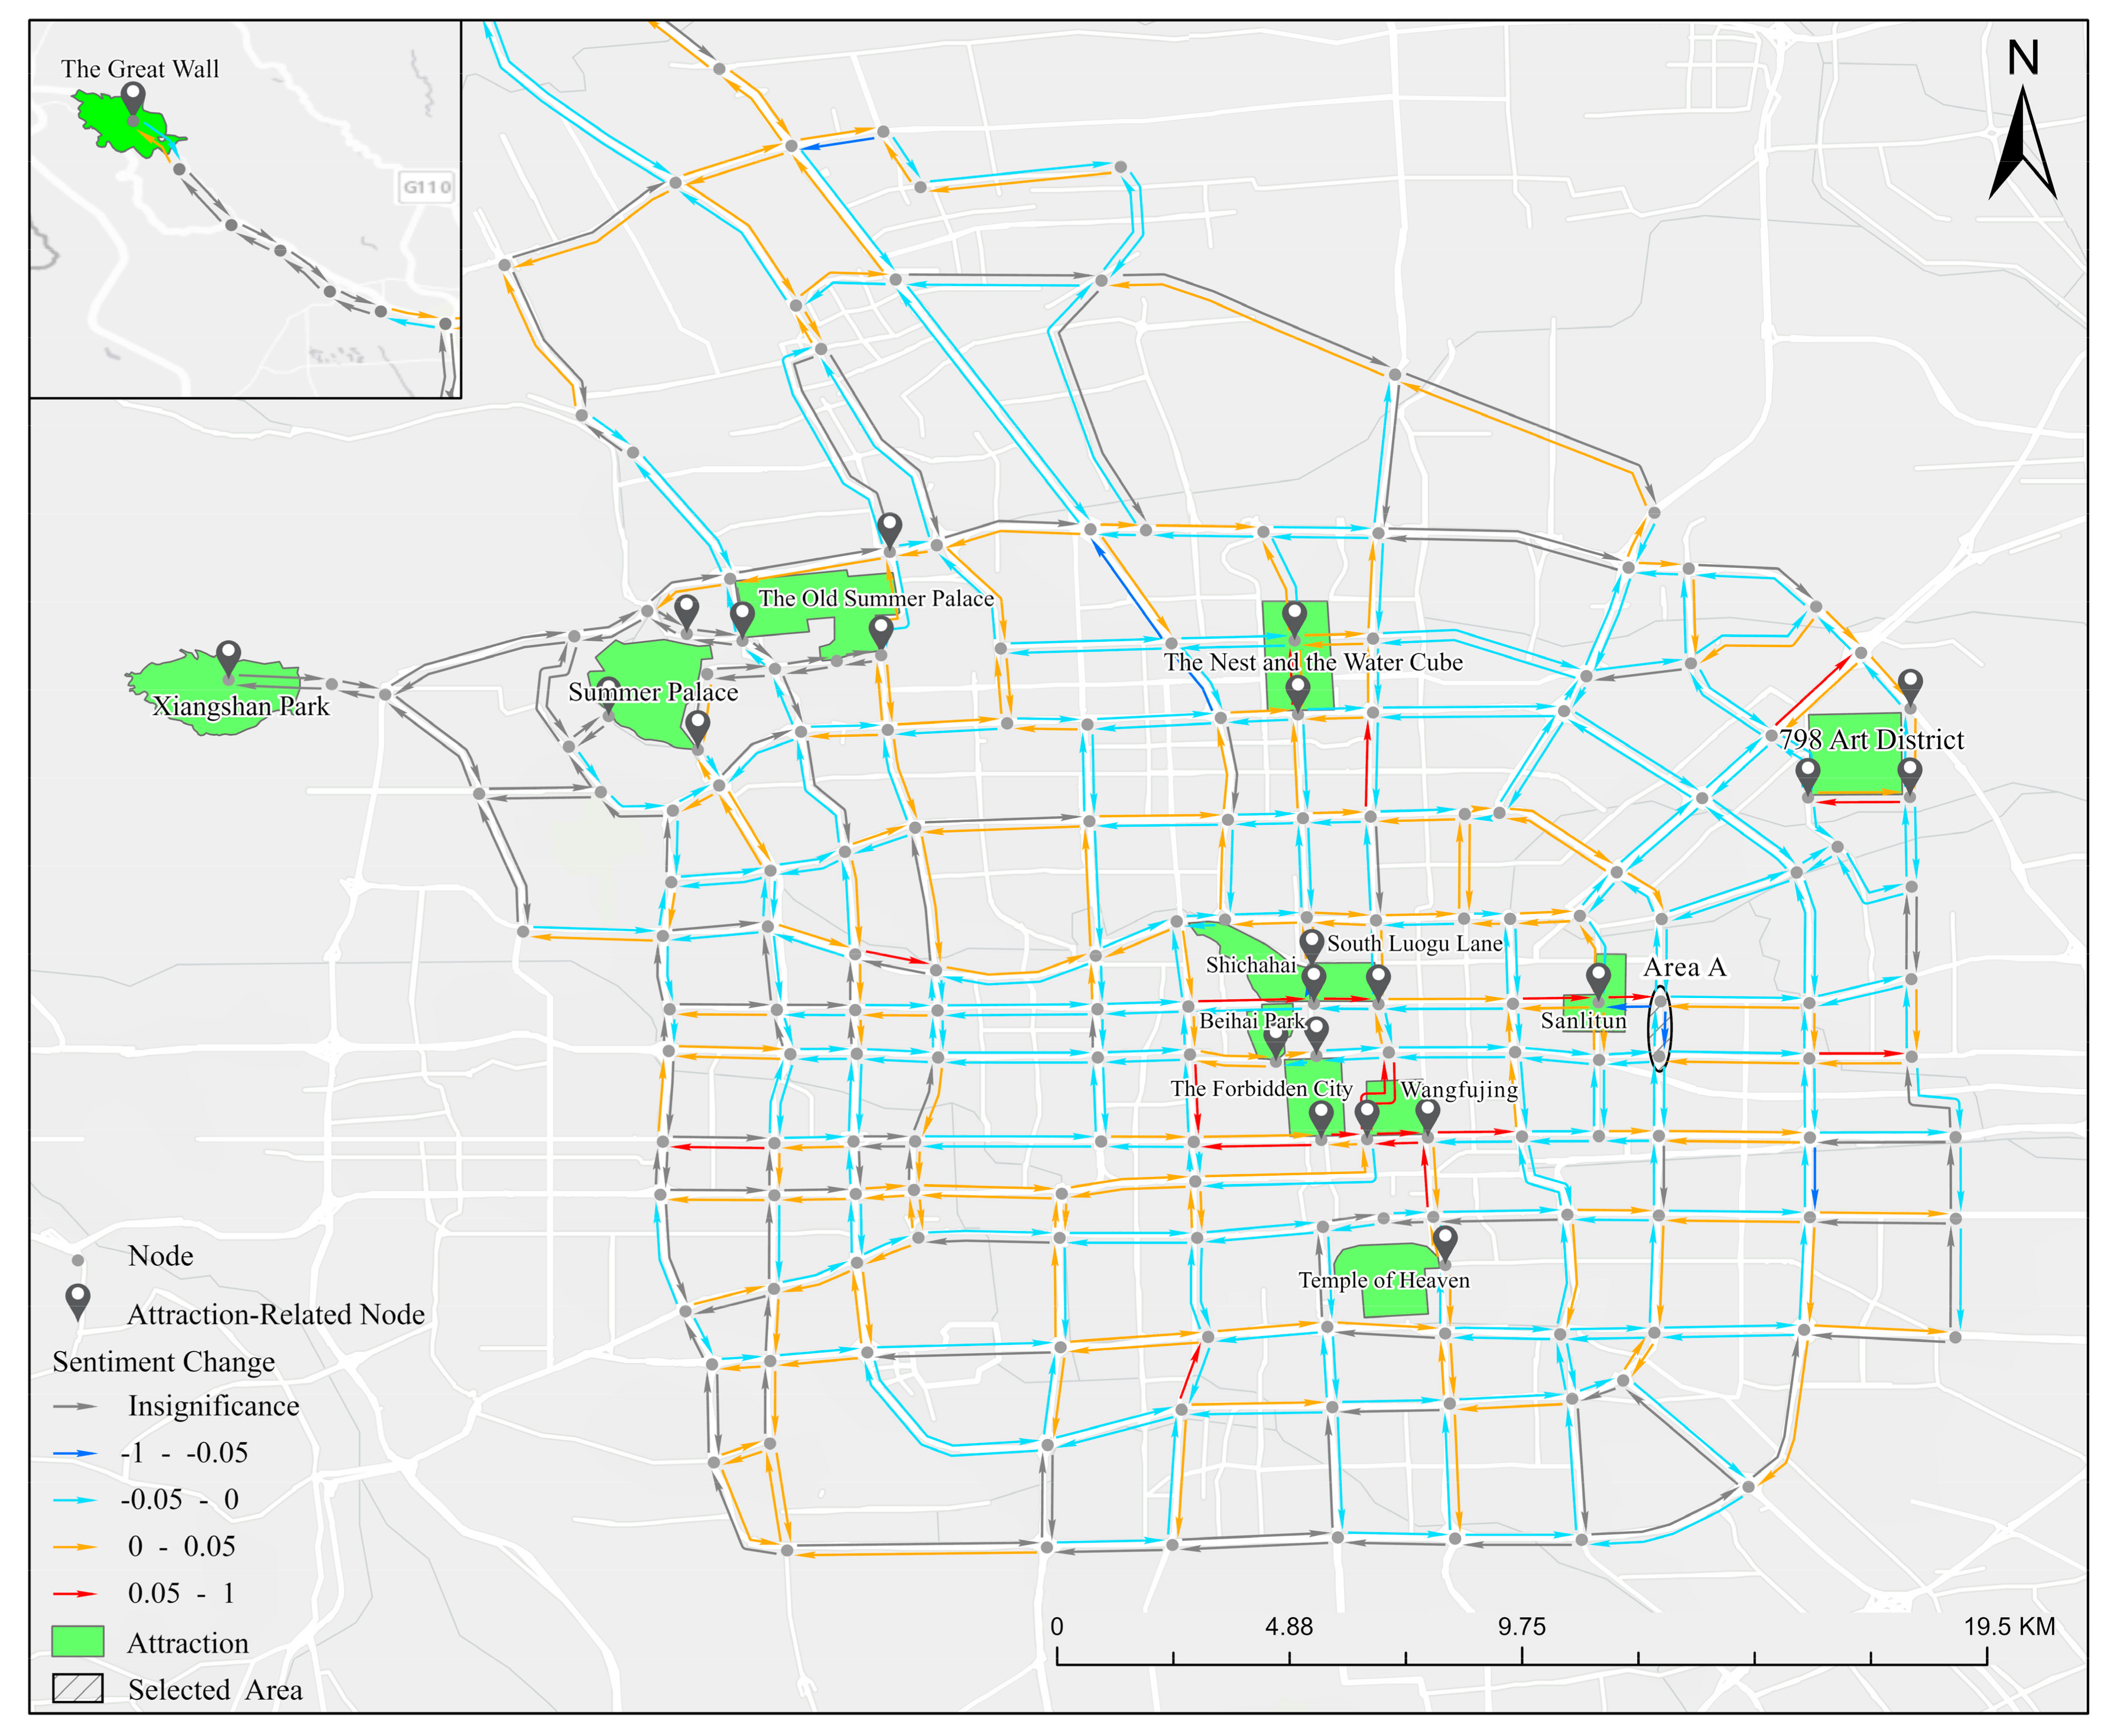
5.2. Spatial Pattern
5.2.1. Daytime
5.2.2. Nighttime
- (1)
- Most highly increased flows were linked to the attraction-related nodes.
- (2)
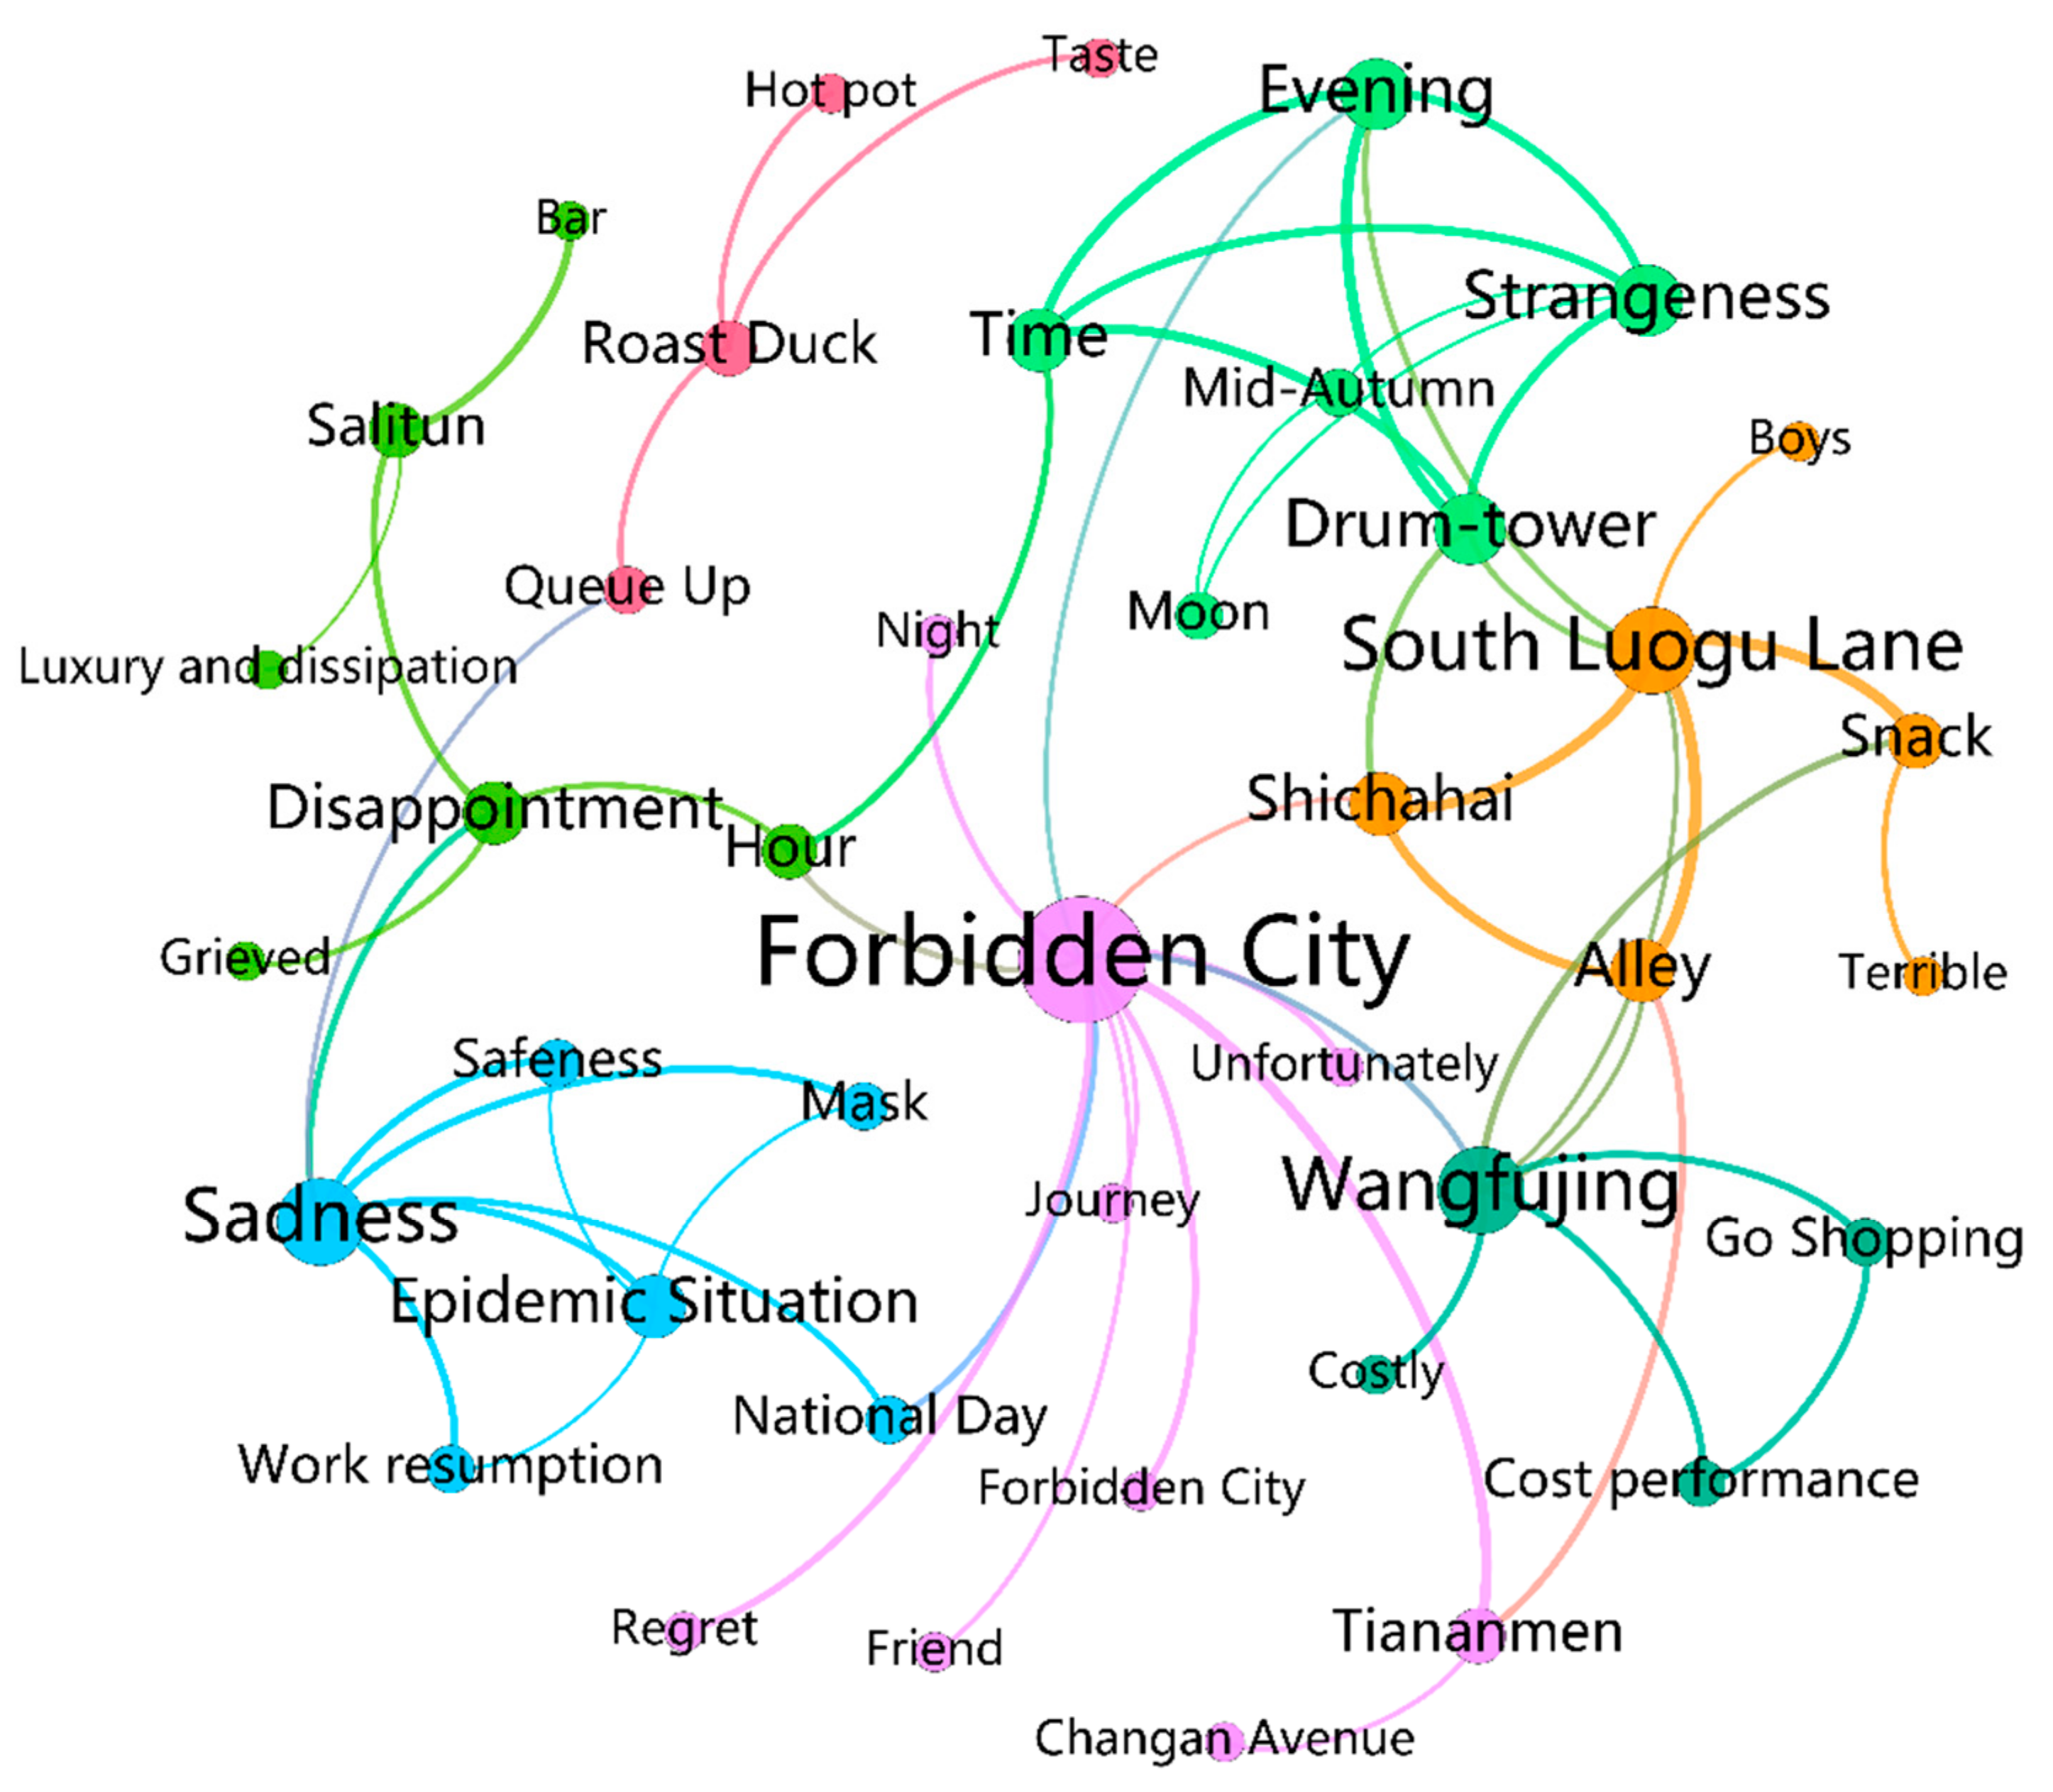
- Due to the impact of an attraction’s historical background, highly decreased flows can be found around attractions.
- (3)
- On the long journey to the attraction, the sentiment strength of tourists decreased.
- (4)
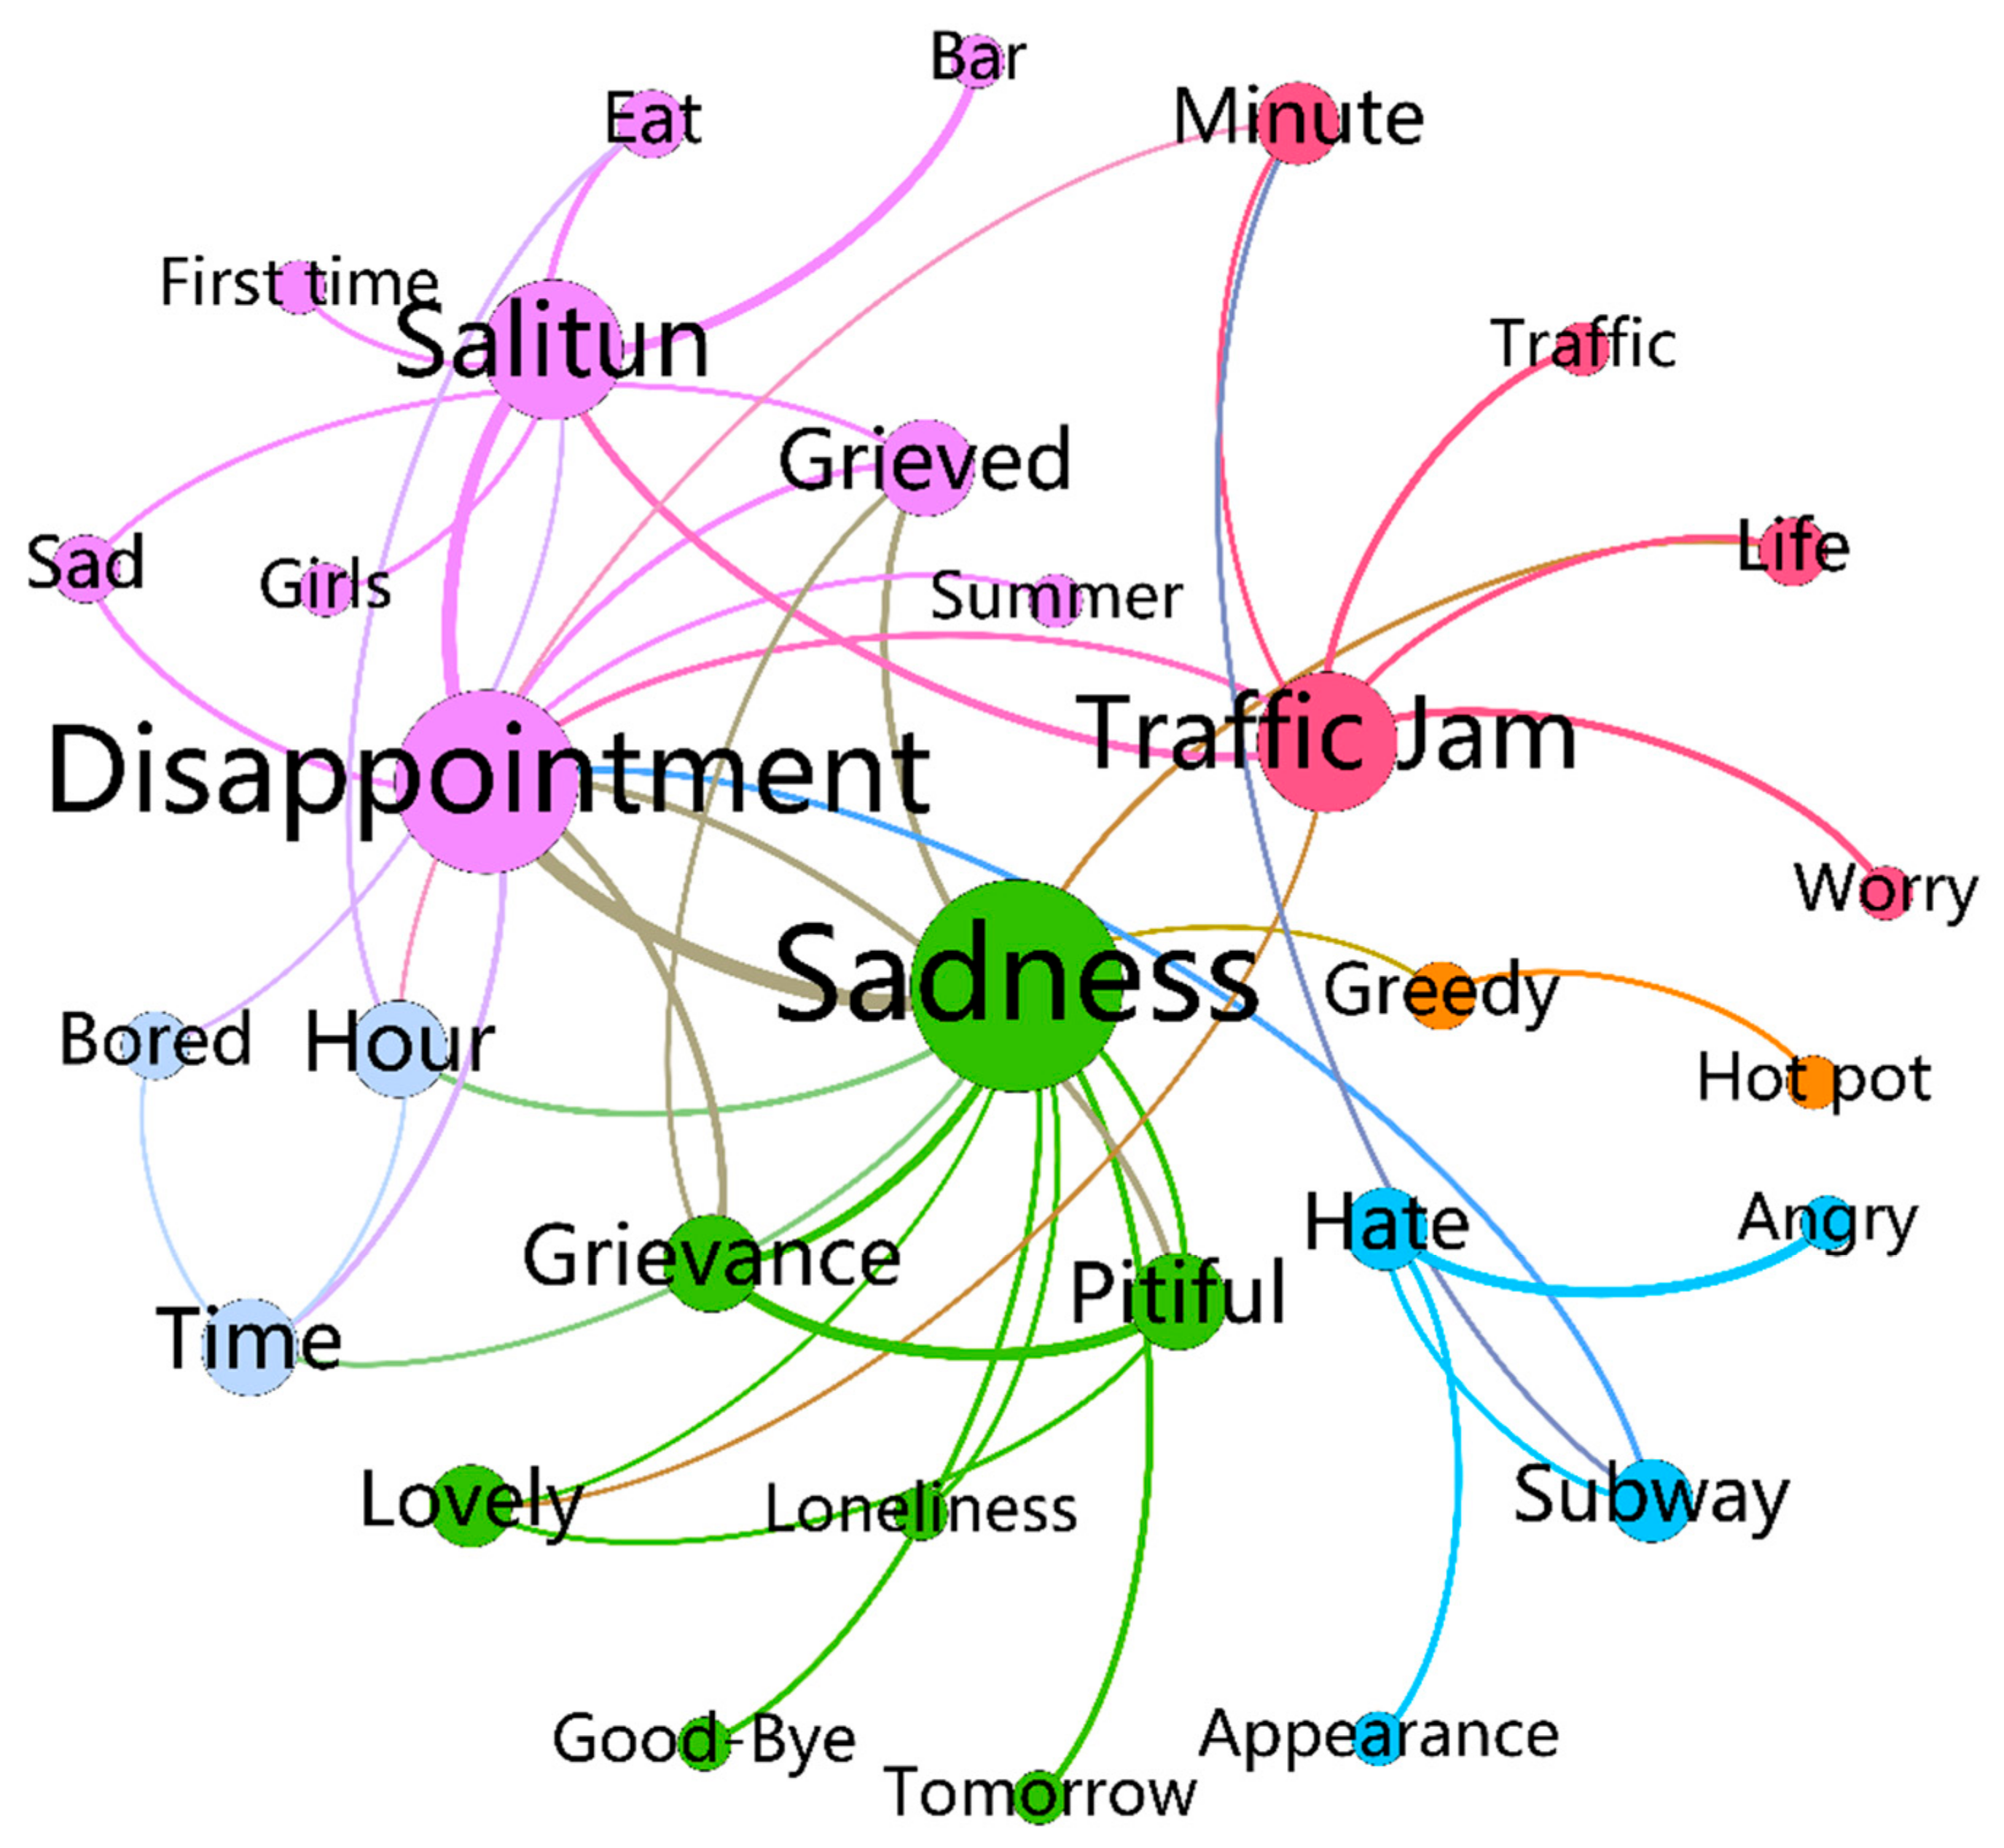
- Bad traffic conditions can significantly decrease tourist sentiment.
6. Discussion
7. Conclusions
- (1)
- The temporal trend of tourist sentiment has seasonal characteristics and is significantly influenced by government control policies against COVID-19.
- (2)
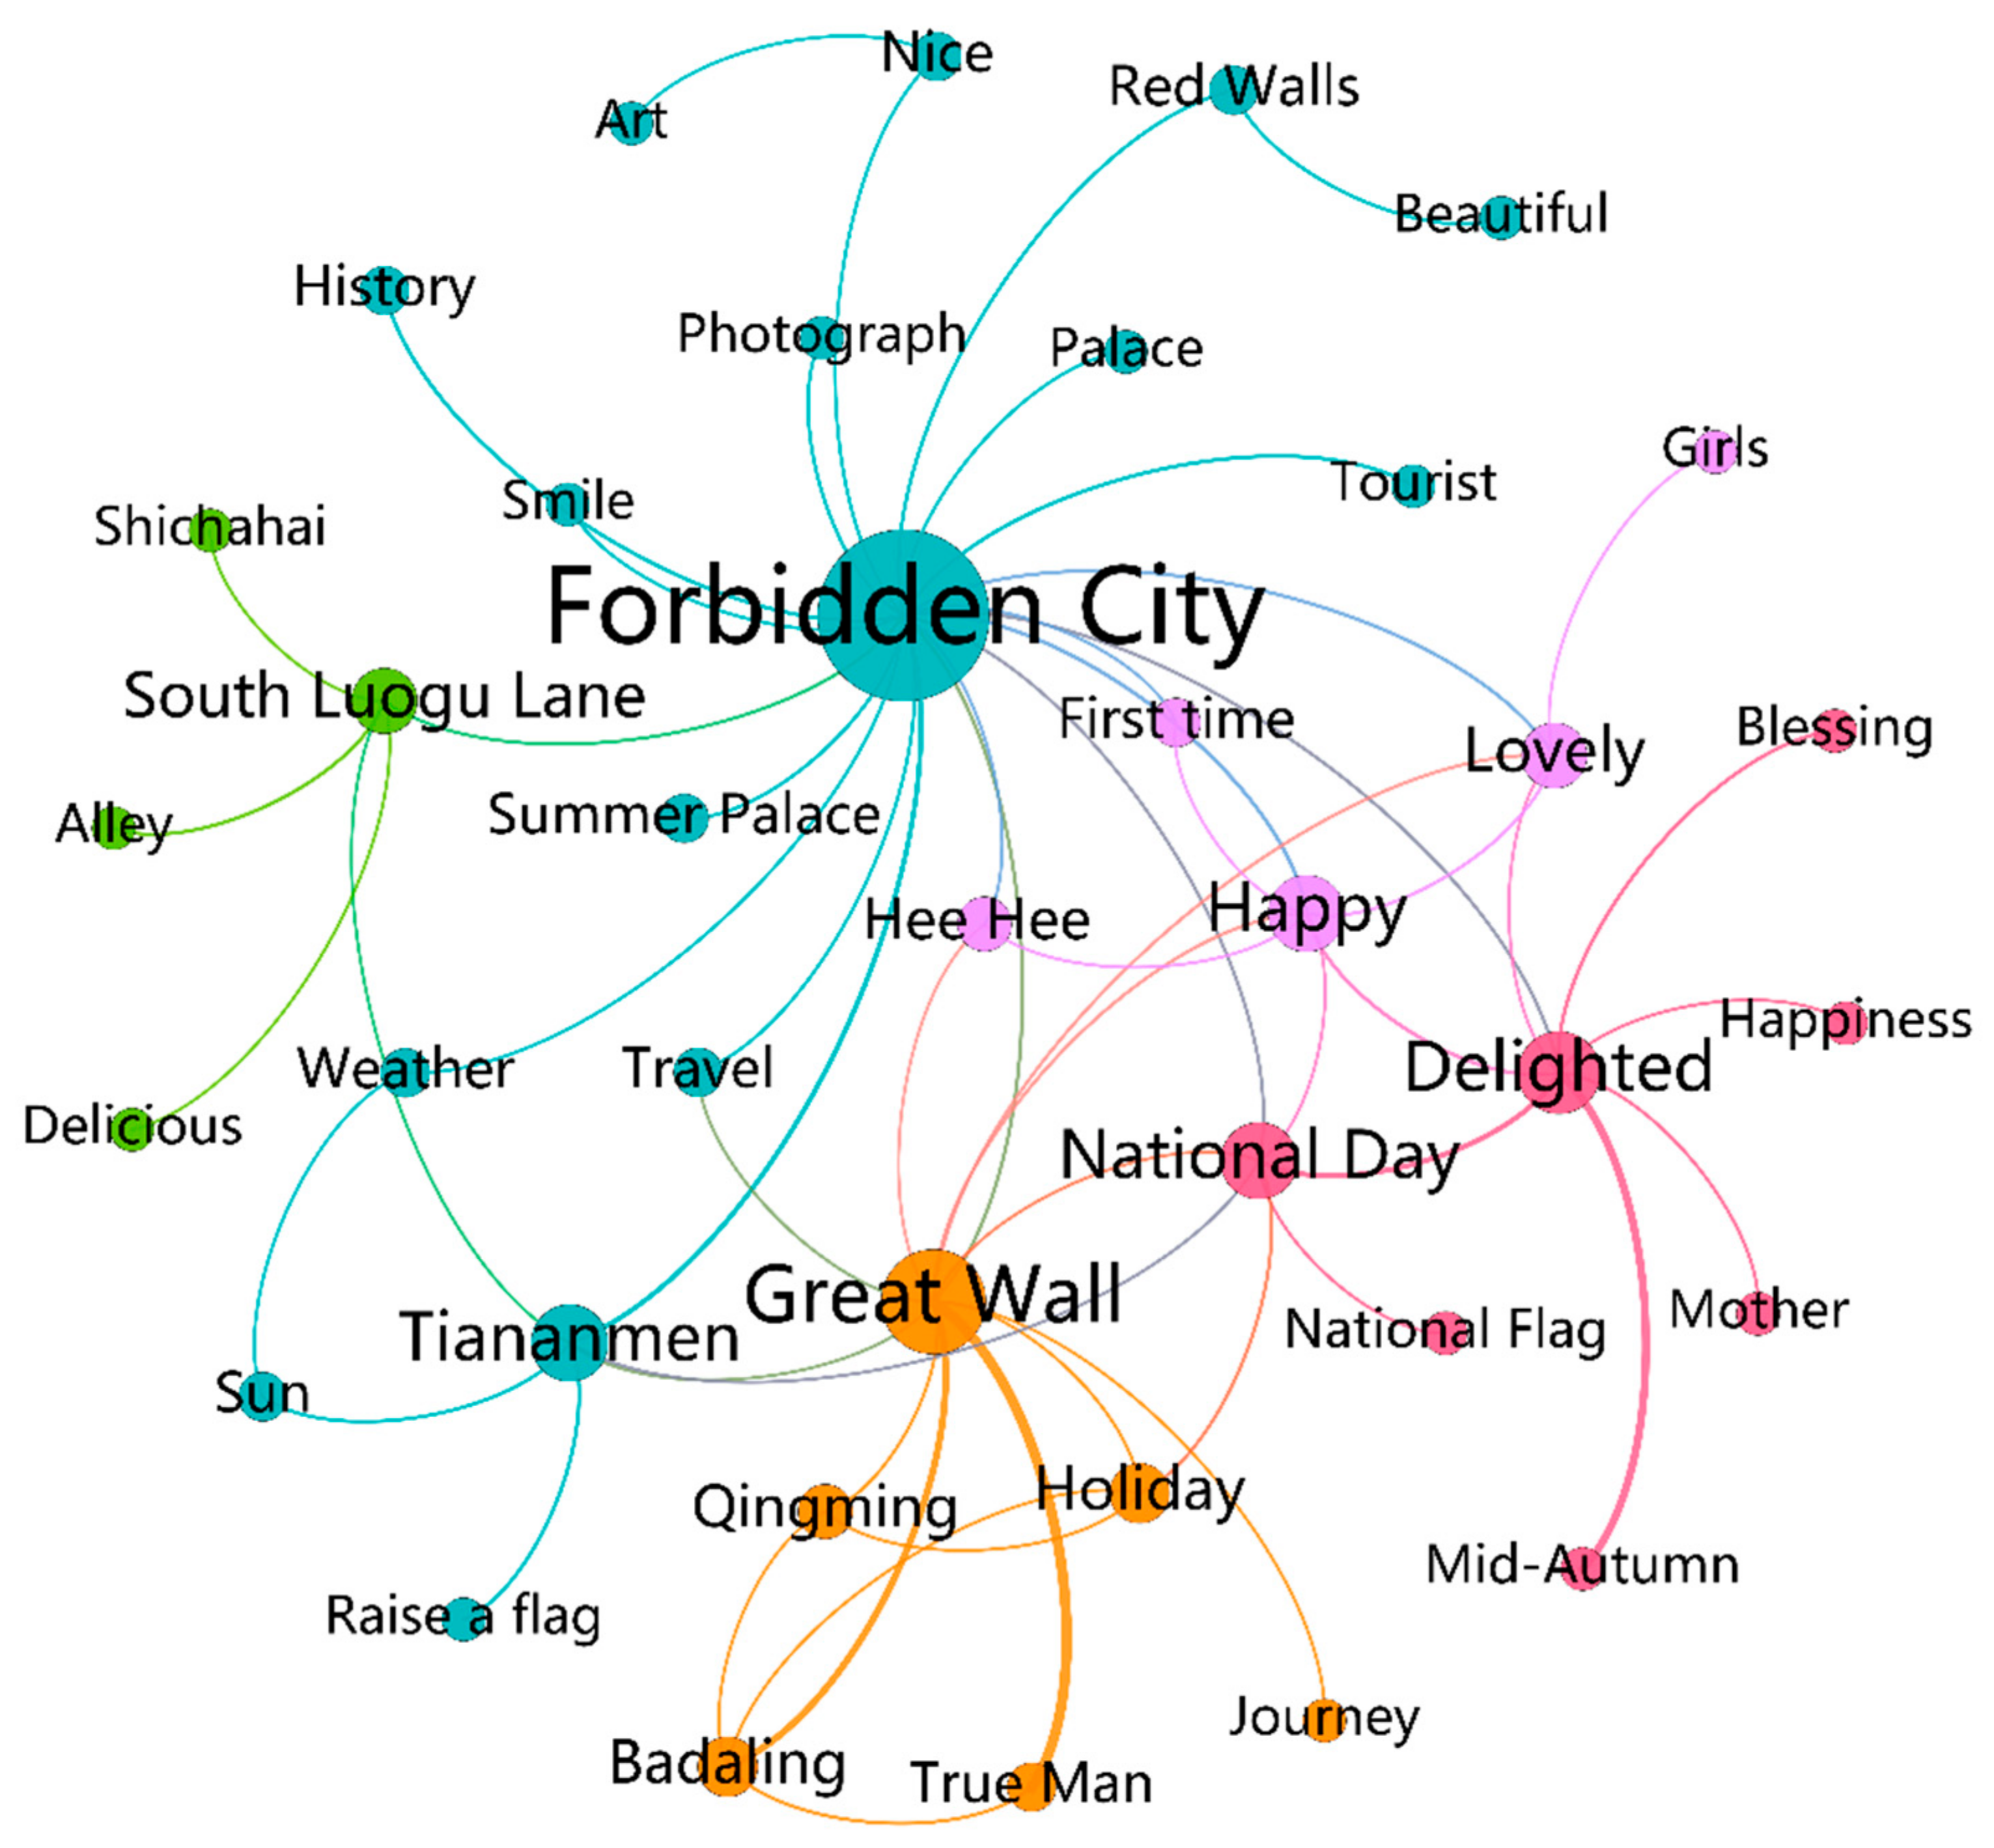
- Most highly increased flows were linked to the attraction-related nodes.
- (3)
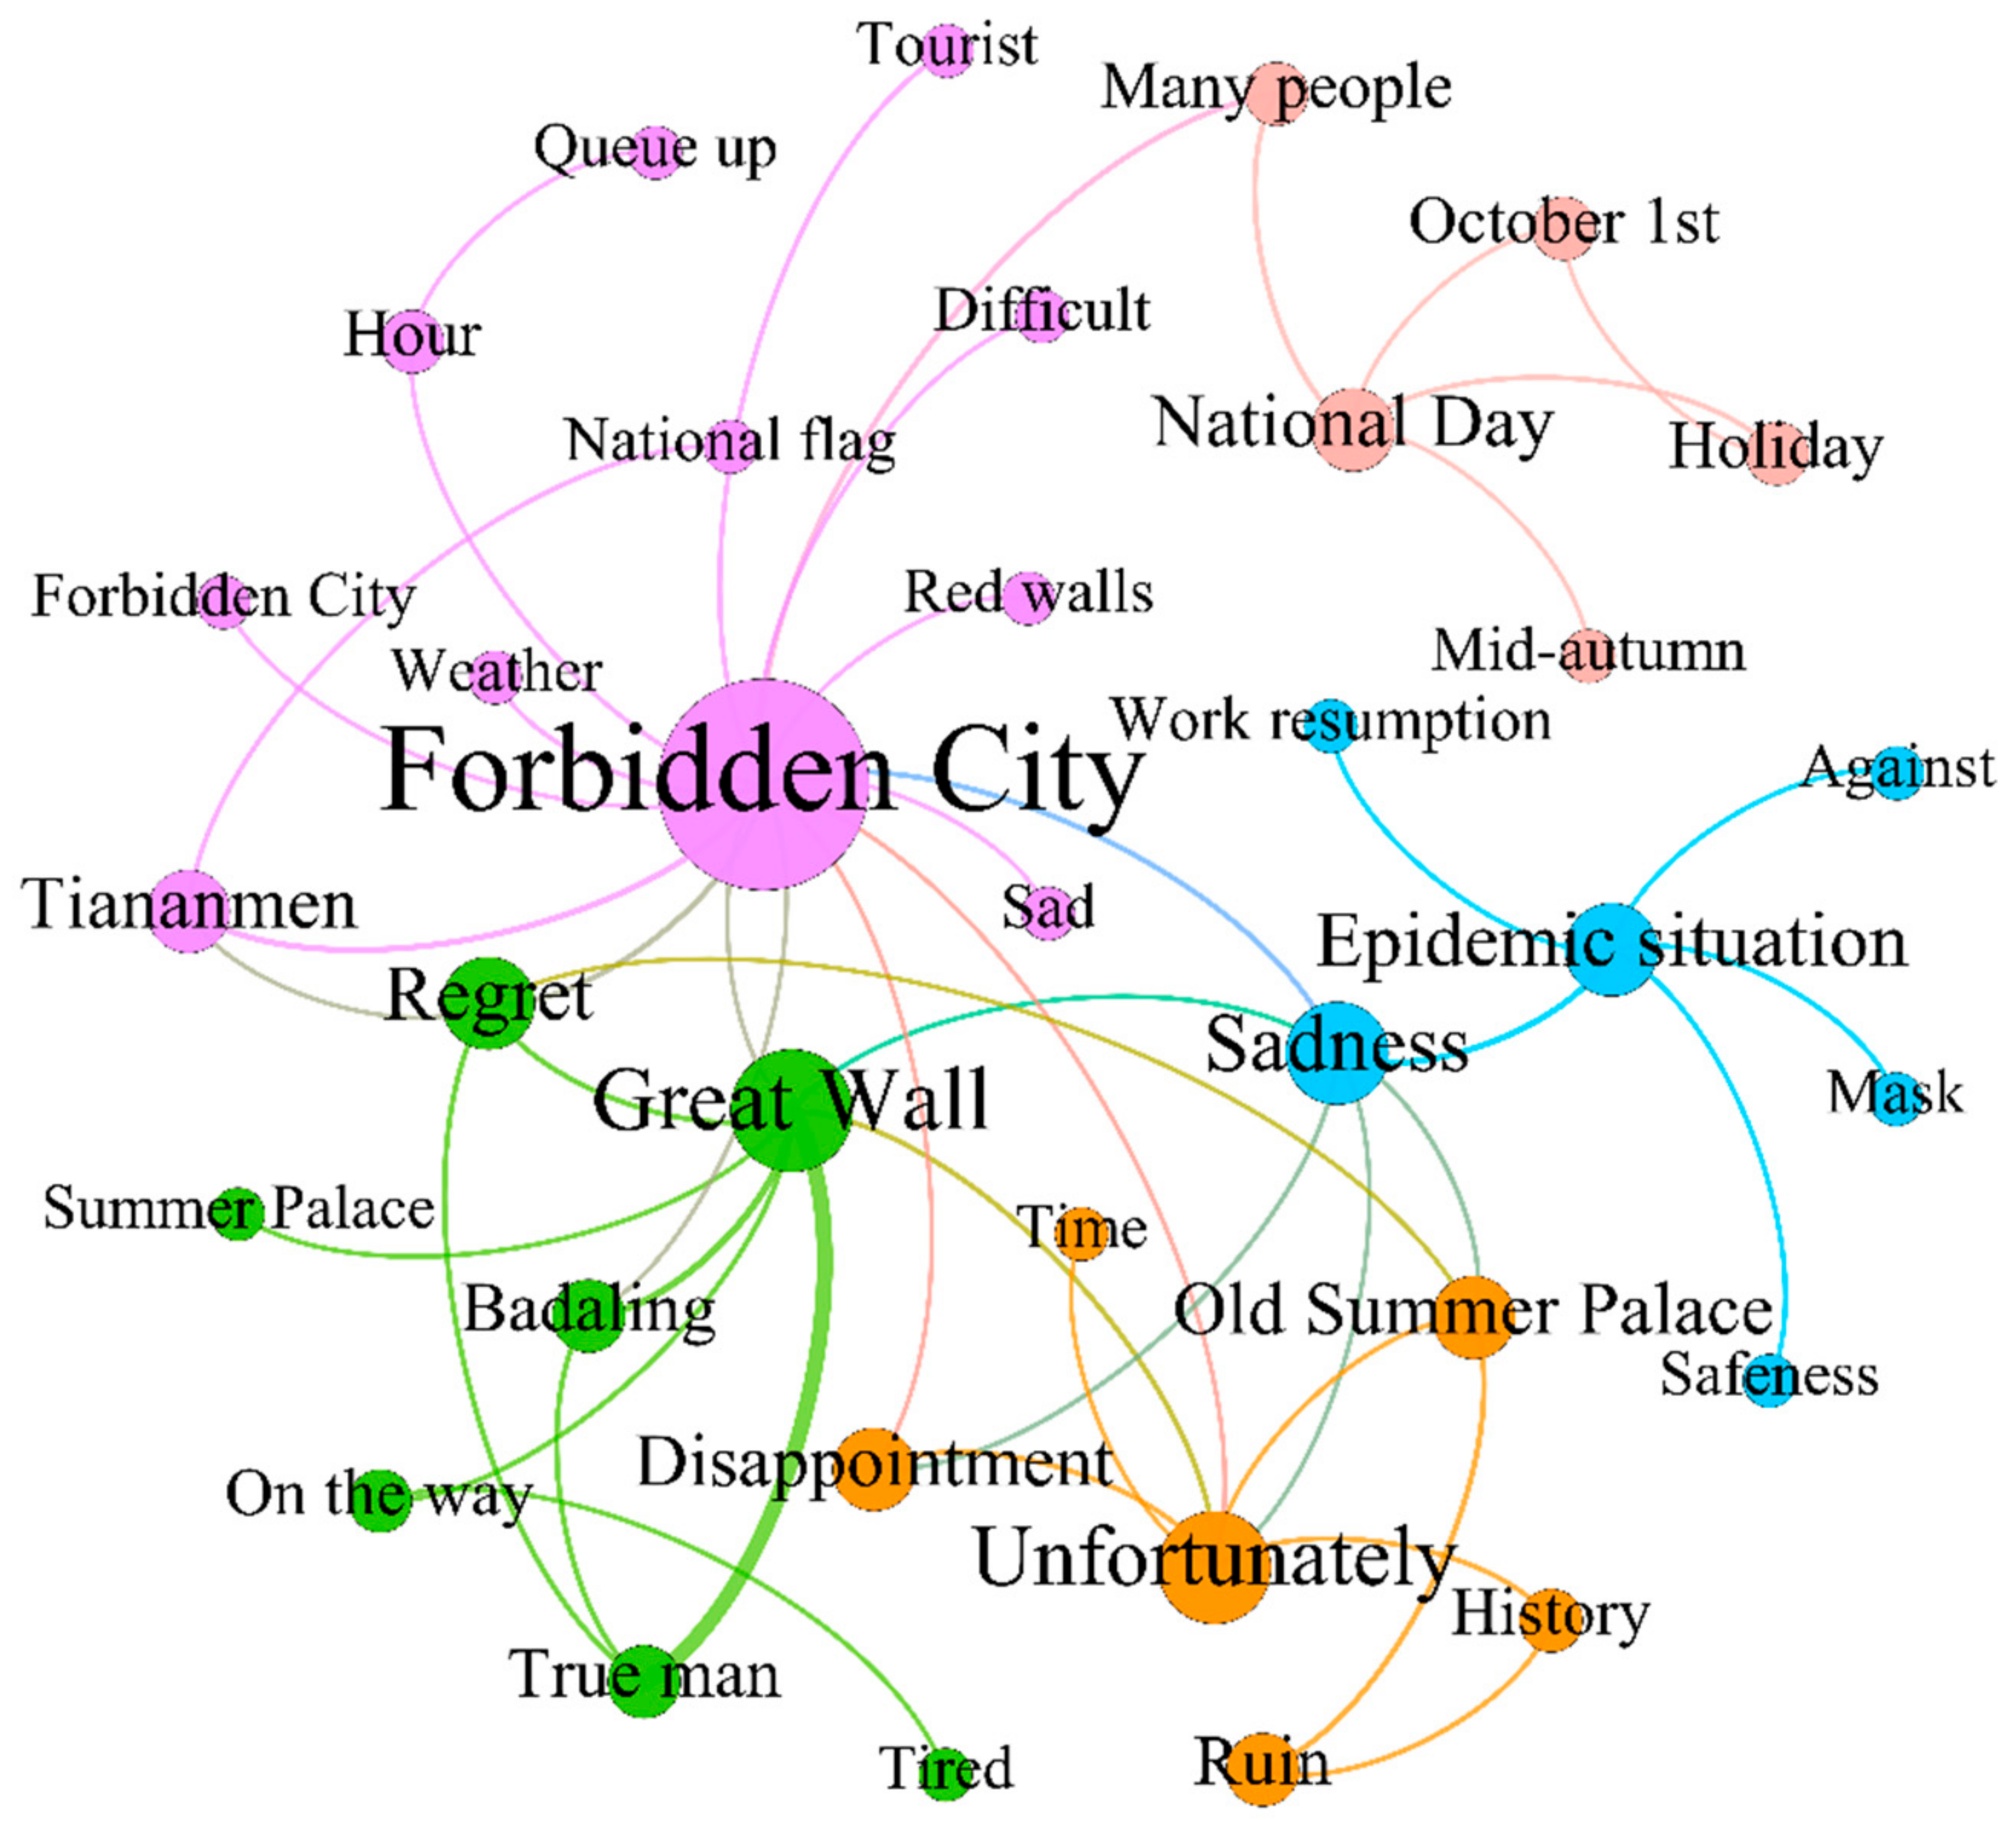
- Due to the impact of an attraction’s historical background, tourist flows with highly decreased sentiment strength can be found around attractions.
- (4)
- On the long journey to the attraction, the sentiment strength of tourists decreased.
- (5)
- Bad traffic conditions can significantly decrease tourist sentiment.
Author Contributions
Funding
Data Availability Statement
Acknowledgments
Conflicts of Interest
Appendix A


References
- Jin, X.; Qu, M.; Bao, J. Impact of crisis events on Chinese outbound tourist flow: A framework for post-events growth. Tour. Manag. 2019, 74, 334–344. [Google Scholar] [CrossRef] [PubMed]
- Huang, Y.; Shi, K.; Zong, H.; Zhou, T.; Shen, J. Exploring Spatial and Temporal Connection Patterns among the Districts in Chongqing Based on Highway Passenger Flow. Remote Sens. 2019, 12, 27. [Google Scholar] [CrossRef]
- Ali, F.; Kim, W.G.; Li, J.; Jeon, H.-M. Make it delightful: Customers’ experience, satisfaction and loyalty in Malaysian theme parks. J. Destin. Mark. Manag. 2018, 7, 1–11. [Google Scholar] [CrossRef]
- Basarangil, İ. The relationships between the factors affecting perceived service quality, satisfaction and behavioral in-tentions among theme park visitors. Tour. Hosp. Res. 2018, 18, 415–428. [Google Scholar] [CrossRef]
- Chen, B.Y.; Li, Q.; Wang, D.; Shaw, S.-L.; Lam, W.H.; Yuan, H.; Fang, Z. Reliable Space–Time Prisms Under Travel Time Uncertainty. Ann. Assoc. Am. Geogr. 2013, 103, 1502–1521. [Google Scholar] [CrossRef]
- Claster, W.; Pardo, P.; Cooper, M.; Tajeddini, K. Tourism, travel and tweets: Algorithmic text analysis methodologies in tourism. Middle East. J. Manag. 2013, 1, 81. [Google Scholar] [CrossRef]
- Leask, A. Visitor attraction management: A critical review of research 2009–2014. Tour. Manag. 2016, 57, 334–361. [Google Scholar] [CrossRef]
- Shi, Y.; Qi, Z.; Liu, X.; Niu, N.; Zhang, H. Urban Land Use and Land Cover Classification Using Multisource Remote Sensing Images and Social Media Data. Remote Sens. 2019, 11, 2719. [Google Scholar] [CrossRef]
- Zhou, Y.; Fang, Z.; Thill, J.-C.; Li, Q.; Li, Y. Functionally critical locations in an urban transportation network: Identification and space–time analysis using taxi trajectories. Comput. Environ. Urban Syst. 2015, 52, 34–47. [Google Scholar] [CrossRef]
- Xi, Z.; Xiaoni, L.; Yuanyuan, L.; Jun, L.; Jun, A. Tourist movement patterns understanding from the perspective of travel party size using mobile tracking data: A case study of Xi’an, China. Tour. Manag. 2018, 69, 368–383. [Google Scholar]
- Chua, A.; Servillo, L.; Marcheggiani, E.; Moere, A.V. Mapping Cilento: Using geotagged social media data to characterize tourist flows in southern Italy. Tour. Manag. 2016, 57, 295–310. [Google Scholar] [CrossRef]
- Tang, J.; Li, J. Spatial network of urban tourist flow in Xi’an based on microblog big data. J. China Tour. Res. 2016, 12, 1–19. [Google Scholar] [CrossRef]
- Mou, N.; Yuan, R.; Yang, T.; Zhang, H.; Tang, J.; Makkonen, T. Exploring spatio-temporal changes of city inbound tourism flow: The case of Shanghai, China. Tour. Manag. 2020, 76, 103955. [Google Scholar] [CrossRef]
- Philander, K.; Zhong, Y. Twitter sentiment analysis: Capturing sentiment from integrated resort tweets. Int. J. Hosp. Manag. 2016, 55, 16–24. [Google Scholar] [CrossRef]
- Bigné, J.E.; Andreu, L.; Gnoth, J. The theme park experience: An analysis of pleasure, arousal and satisfaction. Tour. Manag. 2005, 26, 833–844. [Google Scholar] [CrossRef]
- Mou, N.; Zheng, Y.; Makkonen, T.; Tengfei, Y.; Song, Y. Tourists’ digital footprint: The spatial patterns of tourist flows in Qingdao, China. Tour. Manag. 2020, 81, 104151. [Google Scholar] [CrossRef]
- Kitchin, R. The real-time city? Big data and smart urbanism. GeoJournal 2014, 79, 1–14. [Google Scholar] [CrossRef]
- Cvelbar, L.K.; Mayr, M.; Vavpotic, D. Geographical mapping of visitor flow in tourism. Tour. Econ. 2018, 24, 701–719. [Google Scholar] [CrossRef]
- Zheng, W.; Huang, X.; Li, Y. Understanding the tourist mobility using GPS: Where is the next place? Tour. Manag. 2017, 59, 267–280. [Google Scholar] [CrossRef]
- Zheng, W.; Liao, Z.; Qin, J. Using a four-step heuristic algorithm to design personalized day tour route within a tourist attraction. Tour. Manag. 2017, 62, 335–349. [Google Scholar] [CrossRef]
- Sieber, R. Public Participation Geographic Information Systems: A Literature Review and Framework. Ann. Assoc. Am. Geogr. 2006, 96, 491–507. [Google Scholar] [CrossRef]
- Neuhaus, F. UrbanDiary—A Tracking Project Capturing the beat and rhythm of the city: Using GPS devices to visualise individual and collective routines within Central London. J. Space Syntax 2010, 1, 315–336. [Google Scholar]
- Raun, J.; Ahas, R.; Tiru, M. Measuring tourism destinations using mobile tracking data. Tour. Manag. 2016, 57, 202–212. [Google Scholar] [CrossRef]
- Fang, Z.; Yang, X.; Xu, Y.; Shaw, S.-L.; Yin, L. Spatiotemporal model for assessing the stability of urban human convergence and divergence patterns. Int. J. Geogr. Inf. Sci. 2017, 31, 2119–2141. [Google Scholar] [CrossRef]
- Jiang, W.; Wang, Y.; Tsou, M.-H.; Fu, X. Using Social Media to Detect Outdoor Air Pollution and Monitor Air Quality Index (AQI): A Geo-Targeted Spatiotemporal Analysis Framework with Sina Weibo (Chinese Twitter). PLoS ONE 2015, 10, e0141185. [Google Scholar] [CrossRef] [PubMed]
- Li, Y.R.; Lin, Y.C.; Tsai, P.H.; Wang, Y.Y. Traveller-Generated Contents for Destination Image Formation: Mainland China Travellers to Taiwan as a Case Study. J. Travel Tour. Mark. 2015, 32, 518–533. [Google Scholar] [CrossRef]
- Barchiesi, D.; Moat, H.S.; Alis, C.; Bishop, S.; Preis, T. Quantifying International Travel Flows Using Flickr. PLoS ONE 2015, 10, e0128470. [Google Scholar] [CrossRef] [PubMed]
- Marchiori, E.; Cantoni, L. The role of prior experience in the perception of a tourism destination in user-generated content. J. Destin. Mark. Manag. 2015, 4, 194–201. [Google Scholar] [CrossRef]
- Park, S.B.; Kim, J.; Lee, Y.K.; Ok, C.M. Visualizing theme park visitors’ emotions using social media analytics and geospatial analytics. Tour. Manag. 2020, 80, 104127. [Google Scholar] [CrossRef]
- Hauthal, E.; Burghardt, D. Mapping Space-Related Emotions out of User-Generated Photo Metadata Considering Grammatical Issues. Cartogr. J. 2016, 53, 78–90. [Google Scholar] [CrossRef]
- Shi, B.; Zhao, J.; Chen, P.-J. Exploring urban tourism crowding in Shanghai via crowdsourcing geospatial data. Curr. Issues Tour. 2017, 20, 1186–1209. [Google Scholar] [CrossRef]
- Amaral, F.; Tiago, T.; Tiago, F.B. User-generated content: Tourists’ profiles on TripAdvisor. Int. J. Strat. Innov. Mark. 2014, 137–147. [Google Scholar] [CrossRef]
- Chiu, C.; Chiu, N.-H.; Sung, R.-J.; Hsieh, P.-Y. Opinion mining of hotel customer-generated contents in Chinese weblogs. Curr. Issues Tour. 2013, 18, 477–495. [Google Scholar] [CrossRef]
- Dolnicar, S.; Grün, B.; Yanamandram, V. Dynamic, Interactive Survey Questions Can Increase Survey Data Quality. J. Travel Tour. Mark. 2013, 30, 690–699. [Google Scholar] [CrossRef]
- Pang, B.; Lee, L. Opinion Mining and Sentiment Analysis. Found. Trends Inf. Retr. 2008, 2, 1–135. [Google Scholar] [CrossRef]
- Ribeiro, F.N.; Araújo, M.; Gonçalves, P.; Gonçalves, M.A.; Benevenuto, F. SentiBench—A benchmark comparison of state-of-the-practice sentiment analysis methods. EPJ Data Sci. 2016, 5, 1. [Google Scholar] [CrossRef]
- Cantallops, A.S.; Salvi, F. New consumer behavior: A review of research on eWOM and hotels. Int. J. Hosp. Manag. 2014, 36, 41–51. [Google Scholar] [CrossRef]
- Duan, W.; Cao, Q.; Yu, Y.; Levy, S. Mining Online User-Generated Content: Using Sentiment Analysis Technique to Study Hotel Service Quality. In Proceedings of the 2013 46th Hawaii International Conference on System Sciences, Wailea, HI, USA, 7–10 January 2013; pp. 3119–3128. [Google Scholar]
- Pearce, D.G. Toward an Integrative Conceptual Framework of Destinations. J. Travel Res. 2013, 53, 141–153. [Google Scholar] [CrossRef]
- Leung, D.; Law, R.; Van Hoof, H.; Buhalis, D. Social Media in Tourism and Hospitality: A Literature Review. J. Travel Tour. Mark. 2013, 30, 3–22. [Google Scholar] [CrossRef]
- Jiang, W.; Wang, Y.; Dou, M.; Liu, S.; Shao, S.; Liu, H. Solving Competitive Location Problems with Social Media Data Based on Customers’ Local Sensitivities. ISPRS Int. J. Geo Inf. 2019, 8, 202. [Google Scholar] [CrossRef]
- Garcia, A.; Gaines, S.; Linaza, M.T. A Lexicon based sentiment analysis retrieval system for tourism domain. e-Rev. Tour. Res. 2012, 10, 35–38. [Google Scholar]
- Liu, Y.; Bao, J.; Zhu, Y. Exploring emotion methods of tourism destination evaluation: A big-data approach. Geograph. Res. 2017, 36, 1091–1105. [Google Scholar]
- Di, P.; Li, A.; Duan, L. Text sentiment polarity analysis based on transition sentence. Comput. Eng. Design 2014, 35, 4289–4295. [Google Scholar]
- Zheng, D.; Tian, W.; Zhang, R. A study on the presuppositions of adversative relations. Foreign Lang. Res. 2013, 3, 24–30. [Google Scholar]
- Salas-Olmedo, M.H.; Moya-Gómez, B.; García-Palomares, J.C.; Gutiérrez, J. Tourists’ digital footprint in cities: Comparing Big Data sources. Tour. Manag. 2018, 66, 13–25. [Google Scholar] [CrossRef]


| ID | User_ID | Created_at | Text | Geo | POI_Title | Source | Registration Place |
|---|---|---|---|---|---|---|---|
| XX | XX | 07:45:20 01 May 2018 | 不到长城非好汉, 到了长城不遗憾 [耶] [耶] [耶] (“Not a true man unless he comes to the Great Wall”. It is not regrettable to arrive at the Great Wall [Yeah] [Yeah] [Yeah]). | 116.01387;40.356033 | 北京八达岭长城 (The Great Wall at Badaling, Beijing) | iPhone 7 | 山东 青岛 (A city in China) |
| XX | XX | 09:29:51 12 August 2019 | 一年四季的故宫都值得来看看 [微风] (The Forbidden City is worth visiting all the year round [Breeze]). | 116.397316; 39.91814 | 故宫博物院 (The Palace Museum) | iPhone | 陕西 西安 (A city in China) |
| XX | XX | 14:12:04 24 October 2019 | 观京城美景, 练康健体魄! [加油] [微风] (See Beijing’s beauty and exercise the body! [Strong] [Breeze]) | 116.186951; 39.991596 | 香山公园 (Xiangshan Park) | iPhone | 湖北 武汉 (A city in China) |
| XX | XX | 11:06:53 18 August 2017 | (助我赢取77.77元现金大奖) 骑ofo小黄车集齐5种七夕卡, 赢77.77元现金大奖 (Help me win a prize of RMB 77.77. Collect 5 kinds of cards by riding shared bikes.) | 116.447613; 39.951815 | Null | PP 时光机 (PP time machine) | 河北 廊坊 (A city in China) |
| Category | Number | Samples |
|---|---|---|
| The first category | 14 | “虽然”, “虽是”, “虽说”, “尽管”, “固然”, “即便”, “纵使”, “即使”, “无论”, “纵然”, “不论”, “不管”, “任凭”, “原本” (The meaning of Chinese words in the first category is similar to “although” or “whatever”) |
| The second category | 14 | “但是”, “可是”, “不过”, “倒是”, “然而”, “然则”, “但”, “却”, “只是”, “只不过”, “才”, “可”, “还是”, “而” (The meaning of Chinese words in the second category is similar to “but”) |
| Sentence Structure | Sentiment Polarity |
|---|---|
| First category + positive words | Negative |
| First category + odd number of privative words + positive words | Positive |
| First category + even number of privative words + positive words | Negative |
| First category + negative words | Positive |
| First category + odd number of privative words + negative words | Negative |
| First category + even number of privative words + negative words | Positive |
| Second category + positive words | Positive |
| Second category + odd number of privative words + positive words | Negative |
| Second category + even number of privative words + positive words | Positive |
| Second category + negative words | Negative |
| Second category + odd number of privative words + negative words | Positive |
| Second category + even number of privative words + negative words | Negative |
Publisher’s Note: MDPI stays neutral with regard to jurisdictional claims in published maps and institutional affiliations. |
© 2021 by the authors. Licensee MDPI, Basel, Switzerland. This article is an open access article distributed under the terms and conditions of the Creative Commons Attribution (CC BY) license (http://creativecommons.org/licenses/by/4.0/).
Share and Cite
Jiang, W.; Xiong, Z.; Su, Q.; Long, Y.; Song, X.; Sun, P. Using Geotagged Social Media Data to Explore Sentiment Changes in Tourist Flow: A Spatiotemporal Analytical Framework. ISPRS Int. J. Geo-Inf. 2021, 10, 135. https://doi.org/10.3390/ijgi10030135
Jiang W, Xiong Z, Su Q, Long Y, Song X, Sun P. Using Geotagged Social Media Data to Explore Sentiment Changes in Tourist Flow: A Spatiotemporal Analytical Framework. ISPRS International Journal of Geo-Information. 2021; 10(3):135. https://doi.org/10.3390/ijgi10030135
Chicago/Turabian StyleJiang, Wei, Zhengan Xiong, Qin Su, Yi Long, Xiaoqing Song, and Peng Sun. 2021. "Using Geotagged Social Media Data to Explore Sentiment Changes in Tourist Flow: A Spatiotemporal Analytical Framework" ISPRS International Journal of Geo-Information 10, no. 3: 135. https://doi.org/10.3390/ijgi10030135
APA StyleJiang, W., Xiong, Z., Su, Q., Long, Y., Song, X., & Sun, P. (2021). Using Geotagged Social Media Data to Explore Sentiment Changes in Tourist Flow: A Spatiotemporal Analytical Framework. ISPRS International Journal of Geo-Information, 10(3), 135. https://doi.org/10.3390/ijgi10030135