Abstract
Cytokine storm (CS) is associated with poor prognosis in COVID-19 patients. Hypoxic signaling has been proposed to influence proinflammatory pathways and to be involved in the development of CS. Here, for the first time, the role of hypoxia in coronavirus-mediated inflammation has been investigated, using transcriptomic and proteomic approaches. Analysis of the transcriptome of A549 lung epithelial cells using RNA sequencing revealed 191 mRNAs which were synergistically upregulated and 43 mRNAs which were synergistically downregulated by the combination of human Betacoronavirus OC43 (HCoV-OC43) infection and hypoxia. Synergistically upregulated mRNAs were strongly associated with inflammatory pathway activation. Analysis of the expression of 105 cytokines and immune-related proteins using antibody arrays identified five proteins (IGFBP-3, VEGF, CCL20, CD30, and myeloperoxidase) which were markedly upregulated in HCoV-OC43 infection in hypoxia compared to HCoV-OC43 infection in normal oxygen conditions. Our findings show that COVID-19 patients with lung hypoxia may face increased risk of inflammatory complications. Two of the proteins we have identified as synergistically upregulated, the cytokines VEGF and CCL20, represent potential future therapeutic targets. These could be targeted directly or, based on the novel findings described here by inhibiting hypoxia signaling pathways, to reduce excessive inflammatory cytokine responses in patients with severe infections.
1. Introduction
The effect of hypoxia (low oxygen) on mRNA and protein expression changes in lung epithelial cells infected with the human coronavirus HCoV-OC43 has not previously been investigated in detail. Here we demonstrate that hypoxia has profound and wide-ranging effects, particularly on inflammatory mediators linked to the serious pathological condition cytokine storm (CS).
Serious cases of COVID-19, caused by infection with severe acute respiratory syndrome coronavirus (SARS-CoV-2), are associated with CS [1]. First used to describe the effects of graft-versus-host disease, CS is a hyperactive, run-away inflammatory response characterized by the excessive release of inflammatory mediators [2,3]. Although the incidence of CS is likely under-reported, a study conducted early in the COVID-19 pandemic (March–September 2020) found that 14.3% of hospitalized COVID-19 patients experienced CS [4]. CS has been observed in patients with Middle East respiratory syndrome-related coronavirus (MERS-CoV), severe acute respiratory syndrome coronavirus (SARS-CoV) and influenza virus infections [5], as well as conditions such as sepsis [6]. Clinical studies examining serum cytokine levels have identified COVID-19 hyperinflammation as being characterized by significantly elevated concentrations of a range of cytokines, including G-CSF, HGF, IFN-α2, IFN-γ, IL-10, IL-12, IL-17, IL-1ra, IL-1α, IL-1β, IL-2, IL-2R, IL-4, IL-6, IL-7, IL-8, IP-10, MCP-1, M-CSF, MIP-1α, MIP-3α (herein referred to as CCL20), MIP-3β, PDGF-BB, and TNF [7,8,9,10,11]. Elevated levels of many of these cytokines have also been identified as predictors of mortality in severe COVID-19 cases [7,8].
Damage to lung tissue caused by SARS-CoV-2 replication and persistent excess immune cell infiltration contributes to the development of acute respiratory distress syndrome (ARDS), a condition characterized by lung epithelial and endothelial damage, inflammation, apoptosis, necrosis and increased alveolar-capillary permeability, leading to alveolar edema [12]. In the early phase of the COVID-19 pandemic, 75% of patients who were transferred to the intensive care unit (ICU) had ARDS and 90% of patients who died in the ICU had ARDS [13].
ARDS is diagnosed using the Berlin 2012 ARDS diagnostic criteria, with one of the major diagnostic hallmarks being the degree of hypoxemic respiratory failure [14]. When oxygen falls below normal levels within a cell, hypoxia-related signaling occurs which allows the cell to adapt to an oxygen-scarce environment. Hypoxia has been shown to regulate the expression of hundreds of genes [15]. This signaling is principally facilitated by a group of transcription factors called hypoxia-inducible factors (HIFs) [16].
Hypoxic signaling has been proposed to influence the inflammatory process via interaction with proinflammatory pathways such as the NF-κB signaling pathway and has been shown to exacerbate lung inflammation [17,18,19] including in the development of CS in patients with COVID-19 [20]. Hypoxia is also capable of synergizing with other stimuli to markedly enhance inflammatory responses [21,22]. There is evidence that this may be due in part to the ability of some of these stimuli to directly modulate HIFs [23,24]. These findings suggest that COVID-19 patients with lung hypoxia may face a greater risk of inflammatory complications [25].
Hypoxia has been identified as a risk factor in various chronic and acute airway diseases. For example, chronic intermittent hypoxia, such as that observed in obstructive sleep apnea, has been shown to exacerbate airway hyperresponsiveness, elevate the expression of proinflammatory cytokines, and promote immune cell infiltration in in vivo models of asthma [26,27]. Moreover, infection of epithelial cells with an Influenza H1N1 virus under hypoxic conditions leads to increased expression of the proinflammatory cytokines TNF and IL-6, and a decrease in the anti-inflammatory cytokine IL-10 [23].
CS and ARDS following COVID-19 infection create a harmful cycle of epithelial injury and deteriorating gaseous exchange in the lungs, exacerbating hypoxia [28], which may then further exacerbate this damaging cycle of hyperinflammation. Identifying inflammatory markers upregulated by hypoxia may be of utility in the development of future therapies to ameliorate CS in SARS-CoV-2 and other infections, as an addition to current therapies such as corticosteroids. Here, we employed Illumina RNA sequencing and cytokine antibody proteome arrays to investigate how hypoxia modulates lung epithelial cell responses to HCoV-OC43 infection. The A549 lung epithelial cell line was used, given that alveolar type II epithelial cells are primary targets for SARS-CoV-2 replication in the lungs [29]. The A549 cell line has previously been used in studies involving SARS-CoV-2 and HCoV-OC43 [30,31]. HCoV-OC43 was used as a surrogate virus for SARS-CoV-2 as it belongs to the same genus and is well characterized, amenable to study and has been used to develop antiviral compounds targeting both HCoV-OC43 and SARS-CoV-2 in vitro, such as AT-527 [32], allowing us to investigate conserved innate immune responses that are important against a range of coronaviruses [33]. This approach could contribute towards the identification of immune mechanisms and potential therapeutic targets that could be of utility against both current and future emerging coronavirus infections.
2. Materials and Methods
2.1. Cell and Virus Culture
Human lung epithelial (A549) and fibroblast (MRC-5) cell lines were obtained from American Tissue Culture Collection (ATCC). These cell lines were maintained in Eagle’s Minimum Essential Medium (EMEM) with 10% fetal bovine serum (FBS), 100 units/mL of penicillin and 100 μg/mL of streptomycin (herein called growth media). Cells were cultured in 75 cm2 flasks with 10 mL of medium under normoxic conditions (20.9% O2, 5% CO2).
HCoV-OC43 VR-1558 was propagated as recommended (ATCC) in MRC-5 cells [34]. The virus was harvested by agitating glass beads in the flask to disrupt the cell monolayer, as described by [35]. The cell lysate was collected, aliquoted into cryovials, and stored at −80 °C. Viral titres were determined using a 50% tissue culture infectious dose (TCID50) assay, as described in [36].
2.2. Infection of A549 Cells with HCoV-OC43 Under Hypoxic and Normoxic Conditions
To investigate the effects of hypoxia and HCoV-OC43 infection on A549 cell inflammatory signaling, four conditions were selected. These were an uninfected normoxic control (NAlone), uninfected hypoxia alone (HAlone), normoxia + HCoV-OC43 (NOC43) and hypoxia + HCoV-OC43 (HOC43). A549 cells were seeded in 6-well plates at a density of 4 × 10⁵ cells per well in growth media and incubated overnight (24 h) prior to infection. Before infection, the medium was aspirated, and HCoV-OC43 was added at an MOI of 5, diluted in 500 µL of serum-free EMEM. The plates were incubated at 37 °C with 5% CO2 for 2 h to allow viral adsorption. Subsequently, 1.5 mL of growth media was added to each well, and the cells were incubated either under normoxic conditions (37 °C, 5% CO2, 20.9% O2) or in hypoxia (Baker Ruskinn InvivO2 400 Physoxia Workstation; 37 °C, 5% CO2, 2% O2) for 24 h. Oxygen levels were independently verified using a separate Analox oxygen meter, in addition to the built-in oxygen sensor. mRNA was then isolated using the Quick-RNA Miniprep Kit (Zymo Research., Irvine, CA, USA cat: R1054) according to the manufacturer’s protocol.
2.3. RNA Sequencing of A549 Alveolar Epithelial Cells Infected with HCoV-OC43
The quality of isolated RNA was evaluated using a Qubit fluorometer (Thermo Fisher Scientific, Waltham, MA, USA) and an Agilent 2100 Bioanalyzer (Agilent Technologies, Inc., Santa Clara, CA, USA). RNA samples (n = 4) were then sent to Genewiz (Azenta Life Sciences, Germany) for library preparation and RNA sequencing, including poly-A enrichment. Sequencing was performed on an Illumina NovaSeq platform (version 2.0.0) with a 2 ×150 base pair read length and a depth of 20 million reads per sample. Raw reads were processed using Trimmomatic v0.36 for adapter removal and quality filtering. RNA sequencing data was mapped to the human reference genome (Homo sapiens GRCh38) so that the transcriptomic differences between conditions could be observed. Differentially expressed genes (DEGs) were identified using Differential Gene Expression Analysis Based on the Negative Binomial Distribution (DESeq2) [37], with significant DEGs defined by an absolute log2 fold change > 1 and an adjusted p value (padj) < 0.05 using the Wald’s test followed by a Benjamini–Hochberg correction for multiple comparisons. RNA sequencing data was also mapped to the HCoV-OC43 reference genome (ATCC VR-759-NC_006213.1) to assess the degree of infection between conditions by analyzing the relative abundance of structural genes [38,39]. Transcript per million (TPM) normalization was used to enable accurate quantitative comparisons of genes between conditions and among genes within the same condition [40].
2.4. Identification of Synergistic Genes
To identify genes with synergistic expression patterns, three DESeq2 comparisons were used: NAlone vs. HAlone, NAlone vs. NOC43, and NAlone vs. HOC43. The comparisons were standardized to the same baseline condition, NAlone, to enable fold change comparisons. Genes were classified as synergistically regulated if the fold change in the HOC43 condition exceeded twice the sum of the fold changes observed in the individual conditions (synergistic downregulation was performed on the reciprocal of the fold changes), based on a modification of the approach of [41]. The DESeq2 analysis comparing NOC43 vs. HOC43 was used to determine whether changes in mRNA levels identified in the synergistic analysis were statistically significant between the two viral infection conditions. To assess whether synergistic gene expression was specific to A549 cells, MRC-5 lung fibroblasts were infected with HCoV-OC43 under hypoxic and normoxic conditions as described for A549 cells. Selected synergistic genes identified in A549 RNA-seq were analyzed by qRT-PCR to evaluate expression in a different cell type.
2.5. Gene Ontology Analysis
Significant DEGs were functionally annotated using ShinyGO v0.80 [42], using the list of all DEGs from the appropriate condition as a background. Gene ontology (GO) enrichment analysis was performed using the Kyoto Encyclopedia of Genes and Genomes (KEGG) and biological process (BP) databases. Significance was defined as a false discovery rate (FDR) of p < 0.05. Following enrichment, terms were filtered and sorted by significance (FDR), and then the top 10 terms were further sorted by fold enrichment to obtain the terms of interest.
2.6. Analysis of Cytokine and Immune-Related Protein Expression Using an Antibody Array
Expression of cytokines, chemokines and selected immune-related soluble proteins was quantified using the Proteome Profiler Human XL Cytokine Array (R&D Systems, Minneapolis, MN, USA, cat: ARY022B). 250 µL of cell culture supernatant from four independent biological repeats, each including all four experimental conditions, were pooled to create average (n = 4) samples of the four experimental conditions. Incubation and washing were carried out according to manufacturer’s instructions. Visualization of the cytokine arrays was performed using a LI-COR IRDye 800 CW streptavidin visualization antibody (LICOR, Lincoln, NE, USA, cat: 926-32230) and was performed according to the manufacturer’s instructions. Imaging of the arrays was performed on a LI-COR Odyssey M imager. Densitometry analysis was carried out on the cytokine arrays using LI-COR Image Studio Lite software version 5.2.5. To analyze cytokine expression between the four experimental conditions, each array was further normalized in relation to the average intensity of the reference spots on each array [43,44].
2.7. Quantification of IL-6 Concentration Using ELISA
IL-6 quantification was performed using the human IL-6 DuoSet ELISA Kit (R&D Systems, cat: DY206). Cell culture supernatants from four biological repeats were thawed and pooled to create an average sample of each condition. The ELISA was conducted according to manufacturer’s instructions. Absorbance was recorded at 450 nm using a BioTek Epoch 2 Microplate spectrophotometer, with 540 nm and 570 nm readings for correction. IL-6 concentrations were calculated using a 4-parameter logistic curve generated in R, aligning sample absorbances with the standard curve for accurate quantification.
2.8. Statistical Analyses
Statistical analyses were performed using R and GraphPad Prism v10. The specific statistical tests used are indicated in the figure legends. A p-value of <0.05 was considered statistically significant. RNA sequencing fold change data were rounded to the nearest whole number, while values exceeding 100 were rounded to the nearest ten. For cytokine array data, fold change values were rounded to one decimal place.
3. Results
3.1. Effect of HCoV-OC43 Infection on Lung Epithelial Cell Gene Expression in Hypoxia and Normoxia
To investigate the impact of hypoxia and HCoV-OC43 infection on gene expression in A549 cells, individually and in combination, RNA sequencing was used. Significant differentially expressed genes (DEGs), (defined as log2 fold change > 1 and an adjusted p value (padj) < 0.05) were identified using DESeq2 analysis [37] using three conditions, hypoxia alone (HAlone), normoxia + HCoV-OC43 (NOC43) and hypoxia + HCoV-OC43 (HOC43), all normalized to normoxia alone (NAlone). Cells incubated in the HOC43 condition exhibited a higher number of DEGS (4551), including both up- and downregulated mRNAs, compared to either stressor alone (HAlone, 1792 genes; NOC43, 2460 genes) (Figure 1A,B). Interestingly, in addition, the total number of significant DEGs was greater in the HOC43 condition (4551 genes) than the sum of the genes regulated by either stressor alone (HAlone and NOC43) (4252 genes, Figure 1C), suggesting a synergistic response for a number of genes, which require both hypoxia and virus infection in order to be significantly differentially regulated. However, it must be borne in mind that the increase in DEGs seen in the HOC43 condition may in part reflect differences in mRNA stability in hypoxia [45] or due to virus infection, rather than solely changes in transcriptional activity.
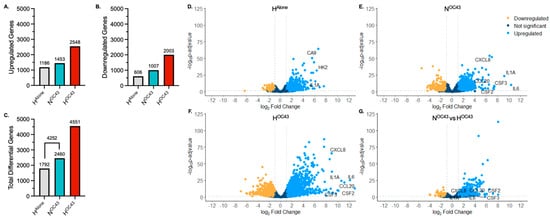
Figure 1.
Transcriptomic Profiling of RNA Sequencing Data from A549 Lung Epithelial Cells. (A–C), Variation in significantly differentially expressed genes (DEGs) between RNA sequencing readouts from cells incubated in different experimental conditions (n = 4). The x-axis shows the condition group, and the y-axis represents the number of significantly (A) upregulated, (B) downregulated and (C) total DEGs compared to NAlone. Differential gene expression was analyzed using the DESeq2 R package. A gene was defined as significantly differentially expressed if p ≤ 0.05 (using the Wald test followed by a Benjamini–Hochberg correction for multiple testing) and if the log2 fold change was >1. (D–G), Volcano plots showing the distribution of DEGs in A549 cells in (D) HAlone, (E) NOC43 and (F) HOC43, compared to NAlone. Volcano plot (G) shows DEGs in HOC43, compared to NOC43. Clinically relevant cytokine genes of interest are annotated in each volcano plot. The x-axis shows the log2 fold change in each gene and the y-axis shows the log10 (p-adjusted value) of each gene. Genes with a p-value less than 0.05 and a log2 fold change greater than 1 are indicated by blue dots. These represent upregulated genes. Genes with a p-value less than 0.05 and a log2 fold change less than −1 are indicated by yellow dots. These represent downregulated genes. Genes with a p-value greater than 0.05, or a log2 fold change less than one or greater than −1 are indicated by dark blue dots. These represent unchanged genes. All data is based on n = 4 independent biological repeats.
Volcano plot (significance versus fold-change) mapping further supported these findings, highlighting the amplifying effect of dual stressors (hypoxia and HCoV-OC43 infection) on gene expression (Figure 1D–G). The hypoxic HAlone condition caused 1792 genes to be significantly upregulated (blue) or downregulated (yellow), as shown in Figure 1D. The virus infection NOC43 condition (Figure 1E) induced more (2460) changes in gene expression, including a cluster of genes indicative of the activation of immune-related pathways, including upregulation of the mRNAs of proinflammatory genes, such as IL6, CXCL8 and IL1A. The combined HOC43 condition (Figure 1F) had the most pronounced changes in gene expression, with dramatic increases in the number of both up- and downregulated genes compared to either condition alone. A direct comparison between HOC43 and NOC43 (Figure 1G) further confirmed that hypoxia significantly modulated cytokine genes during HCoV-OC43 infection identified in the NOC43 condition, with additional genes of interest being either upregulated or downregulated specifically under the hypoxia plus virus condition.
GO pathway enrichment analysis [42] provided insight into the biological processes modulated by each experimental condition by categorizing DEGs into different functional gene sets. As expected, in the HAlone condition (Figure 2A), BP enriched terms were primarily related to cellular responses to hypoxia and epithelial cell regulation, while KEGG enriched pathways were associated with metabolic adaptations and hypoxic signaling, confirming that A549 cells were adapting to the hypoxic environment at the transcriptomic level. The NOC43 condition (Figure 2B) enriched GO terms and KEGG pathways associated with immune and inflammatory responses, including “response to lipopolysaccharide”, “inflammatory response”, and “cytokine-cytokine receptor interactions”, reflecting the activation of immune-related processes due to viral infection. In the HOC43 condition (Figure 2C), significant DEGs enriched pathways related to inflammatory responses, with these terms showing a much stronger and more significant enrichment compared to infection in normoxia (NOC43), with the number of genes in shared terms associated with inflammation, for example “inflammatory response”, increasing from 104 in NOC43 to 190 in infected cells in HOC43.
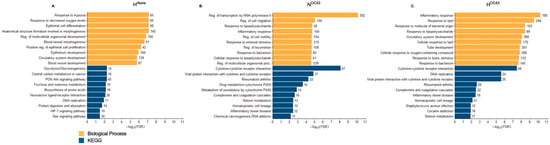
Figure 2.
Gene Ontology of RNA Sequencing Data from A549 Lung Epithelial Cells. (A–C), GO clustering of significantly DEGs in A549 lung epithelial cell RNA sequencing data. GO analysis was performed using ShinyGO v0.80, focusing on the BP and KEGG GO term databases. The analysis included DEGs under the three conditions: (A) HAlone, (B) NOC43, and (C) HOC43, each compared to NAlone. The top ten GO terms identified through this filtering and ranking process are displayed per condition. The x-axis shows the −log10 of the FDR (False Discovery Rate) values, with the more significant pathways having longer bars, per GO term. GO terms were filtered based on their false discovery rate (FDR) and then ranked by fold enrichment. Numbers at the end of each column indicate the number of genes regulated. All data is based on n = 4 biological repeats.
Together, these results confirm our finding of the effect of hypoxia and HCoV-OC43 infection in combination inducing a strong and diverse inflammatory and immune response, highlighting the amplifying role of hypoxia in modulating the cellular responses to viral infection.
3.2. Synergistic Effect of Hypoxia and HCoV-OC43 Infection on Synergistic Inflammatory Gene Expression
HCoV-OC43 infection in hypoxia appeared to exacerbate inflammatory responses compared to infection under normoxic conditions, as evidenced by GO and transcriptomic analyses (Figure 1 and Figure 2), suggesting a possible synergistic interaction between the two factors, as indicated previously in the literature [22]. Therefore, we decided to investigate this in more detail. We defined gene expression changes as synergistic when the fold change of a gene in the HOC43 condition was at least twice the sum of fold changes seen in the HAlone and NOC43 conditions, normalized to NAlone. To identify synergistic downregulation, we applied the same principle to the reciprocal of the downregulated mRNA fold changes. In addition, we compared the results from these potential synergistically regulated genes with results from the NOC43 vs. HOC43 differential expression analysis to assess correlation and statistical significance between conditions. The analysis revealed 191 synergistically upregulated genes (Figure 3) and 43 synergistically downregulated genes (Figure 4). In total, 162 of these genes were protein-coding, 30 were long non-coding RNAs, 19 were long intergenic non-coding RNAs, 11 were pseudogenes, and 12 were unidentified transcripts. Complete data for all 191 synergistically regulated genes are provided in Supplementary Materials File S1. To determine whether synergistic gene expression was specific to the A549 cell line, MRC-5 lung fibroblast cells were infected with HCoV-OC43 under hypoxic or normoxic conditions using the same methodology described previously. Three synergistic genes, IL1B, TNFAIP3 and IRAK2 that exhibited synergistic upregulation in A549 cells and are key modulators of inflammatory signaling were then analyzed for expression in MRC-5 cells by qRT-PCR, confirming that all three genes were significantly upregulated in the HOC43 condition (Figure S1).
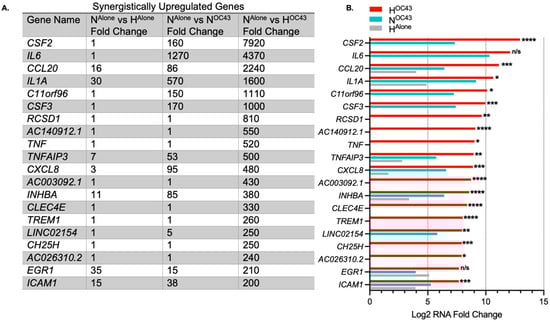
Figure 3.
The most highly synergistically upregulated genes induced by HCoV-OC43 infection of A549 cells in hypoxia. (A) The top 20 genes showing the highest synergistic upregulation in response to HCoV-OC43 infection under hypoxic conditions (n = 4). For this study, synergistic gene upregulation was defined as upregulation more than two-fold higher in the presence of both hypoxia and HCoV-OC43 infection than the sum of fold changes by either condition alone. The fold changes shown are for HAlone, NOC43, and HOC43, normalized to NAlone. In total, 191 genes were identified as synergistically upregulated, including 133 protein-coding genes, 25 long non-coding RNAs (lncRNAs), 12 long intergenic non-coding RNAs (lincRNAs), 9 pseudogenes, and 12 undefined transcripts. (B) The bar chart displays the log2-transformed fold changes in mRNA levels for the top 20 synergistically upregulated genes in HOC43 (red), NOC43 (turquoise) and HAlone (gray). Statistical significance between NOC43 and HOC43 was assessed using a Wald test followed by Benjamini–Hochberg correction for multiple testing based on the DESeq2 differential analysis. Significance levels are indicated as follows: n/s = not significant, * = p < 0.05, ** = p < 0.01, *** = p < 0.001, **** = p < 0.0001. Complete data for all 191 synergistically upregulated genes are provided in Supplementary Materials File S1.
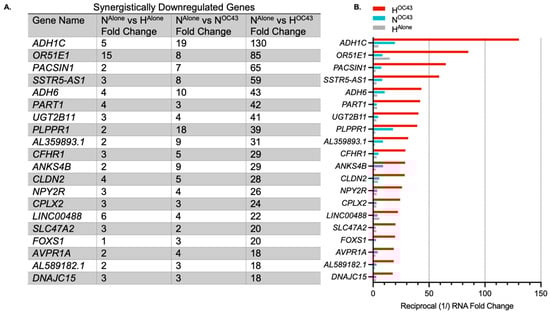
Figure 4.
Top synergistically downregulated genes induced by HCoV-OC43 infection of A549 cells in hypoxia. (A) The top 20 genes showing the highest synergistic downregulation in response to HCoV-OC43 infection under hypoxic conditions (n = 4). For this study, synergistic gene downregulation was defined as a reduction in the number of transcripts by more than two-fold in the presence of both hypoxia and HCoV-OC43 infection than the sum of fold changes by either condition alone. The fold changes shown are for HAlone, NOC43, and HOC43, normalized to NAlone. In total, 43 genes were identified as synergistically downregulated, including 29 protein-coding genes, 5 lncRNAs, 7 lincRNAs, and 2 pseudogenes. (B) The bar chart displays the log2-transformed fold changes in mRNA levels for the top 20 synergistically downregulated genes in HOC43 (red), NOC43 (turquoise) and HAlone (gray). Statistical significance between NOC43 and HOC43 was assessed using a Wald test followed by Benjamini–Hochberg correction for multiple testing based on the DESeq2 differential analysis, but no genes were statistically significant. Complete data for all 44 synergistically regulated genes are provided in Supplementary Materials File S1.
Key genes synergistically upregulated by HCoV-OC43 infection in hypoxia compared to individual conditions included CSF2 (also known as GM-CSF), IL6, CCL20, IL1A, and CXCL8 (also known as IL-8) (Figure 3). Some of the most differentially expressed genes, such as CSF2 or IL6, had very large fold changes into the thousands. This is likely due to the de novo nature of expression, where the levels of mRNA at homeostasis were low or zero, resulting in very high fold-upregulation being observed. Levels of IL-6 protein have previously been shown to increase around 1000-fold during inflammatory events [46].
While HCoV-OC43 infection in hypoxia also induced synergistic downregulation, the overall fold change in these responses was smaller compared to the upregulated genes, and the downregulated genes appeared more random with no clear focus on immune or inflammatory pathways (Figure 4).
3.3. Effect of Hypoxia on HCoV-OC43 Induced Expression of Clinically Relevant Cytokine Genes
Severe COVID-19 cases, particularly those involving CS, are characterized by heightened levels of proinflammatory cytokines, which are critical predictors of disease severity and mortality [1]. We analyzed our A549 cell RNA sequencing data to investigate the expression of 24 cytokines commonly elevated in severe COVID-19, with a particular focus on their expression in epithelial cells and the influence of hypoxia. This panel of cytokines was selected based on multiple studies that analyzed serum cytokine levels in mild, severe or fatal COVID-19 cases, demonstrating elevated levels in more severely affected patients [7,8,9,10,11]. Our findings revealed that 10 out of the 24 cytokines, namely CSF3, IL1A, IL1B, IL6, CXCL8, CCL2, CSF1, CCL20, PDGFB, and TNF, were expressed at the RNA level by A549 lung epithelial cells. Eight of these ten cytokines were significantly upregulated in the HOC43 condition, compared to NOC43 (Figure 5). All genes were identified as synergistically expressed, apart from CSF1 and PDGFB. This suggests that hypoxia may play a critical role in exacerbating the inflammatory response associated with COVID-19, potentially intensifying CS observed in severe cases. PDGFB gene expression was also significantly elevated in the HAlone condition compared to NOC43 [47].
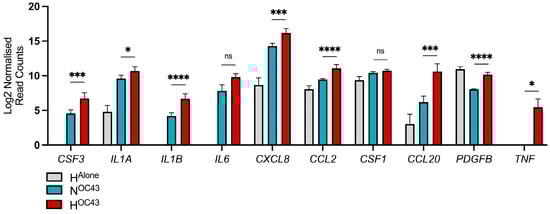
Figure 5.
Transcriptomic analysis of clinically relevant cytokine genes expressed by A549 cells. RNA sequencing data (n = 4) from A549 lung epithelial cells infected with HCoV-OC43 under normoxic and hypoxic conditions were compared to a curated list of clinically relevant cytokines identified from studies comparing serum cytokine levels in severely and mildly affected COVID-19 patients. A panel of cytokines was selected based on multiple studies that analyzed serum cytokine levels in COVID-19 patients with mild, severe or death cases, demonstrating elevated levels in those with more severe disease [7,8,9,10,11]. These cytokines were compared to the RNA sequencing data to assess whether hypoxia influences their levels of mRNA in lung epithelial cells during HCoV-OC43 infection. The displayed data represents the log2-transformed reads for each gene in HAlone (gray), NOC43 (turquoise), and HOC43 (red), normalized to NAlone. Statistical significance of differential expression between NOC43 and HOC43 was assessed using a Wald test followed by Benjamini–Hochberg correction for multiple testing, based on the DESeq2 differential analysis: ns = not significant, * = p < 0.05, *** = < 0.001, **** = < 0.0001.
3.4. Effect of Hypoxia and HCoV-OC43 Infection on Cytokine Protein Secretion by A549 Lung Epithelial Cells
To investigate the impact of hypoxia and HCoV-OC43 infection on secreted cytokine protein expression in A549 cells, cytokine antibody arrays were used to analyze pooled cell culture supernatants (n = 4 independent biological repeats) from the A549 lung epithelial cell RNA sequencing experiments, in the four experimental conditions: NAlone, HAlone, NOC43, and HOC43. The arrays revealed distinct profiles of cytokine secretion depending on the treatment condition (Figure 6A). Biological significance was assumed if the fold change exceeded 1.5 [48].
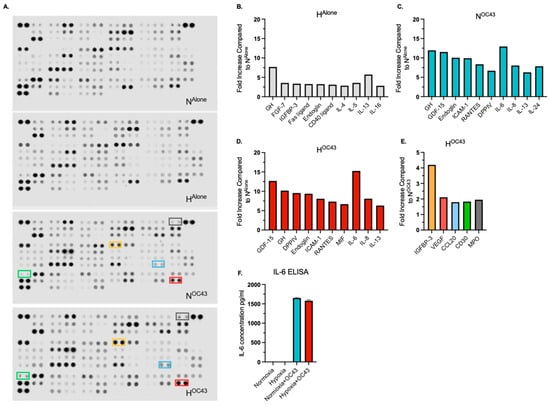
Figure 6.
Secreted/released cytokine, chemokine and immune-related protein expression in A549 lung epithelial cells infected with HCoV-OC43 under normoxic and hypoxic conditions. Protein levels were assessed using cytokine, chemokine and immune-related antibody arrays, analyzing pooled cell culture supernatant samples from the RNA sequencing experiments (n = 4 independent biological repeats). (A) shows the antibody arrays used to evaluate protein expression across the four experimental conditions. (B–D) display the top 10 upregulated protein in each condition, normalized to NAlone. (E) highlights the expression of the five proteins—IGFBP-3, VEGF, CCL20, CD30 and MPO—that were upregulated by more than 1.5-fold in the HOC43 condition compared to the NOC43 condition. The color of the bars corresponds to the color-coded boxes on the antibody arrays. (F) IL-6 ELISA assay on pooled supernatant samples (n = 4).
Analysis of cytokine and immune-related protein expression showed that HCoV-OC43 infection in normoxia markedly upregulated proinflammatory proteins, including ICAM-1 (9.9-fold), IL-6 (13.0-fold), and IL-8 (8.0-fold) (Figure 6C). This pattern mirrored transcriptomic data from RNA sequencing (Figure 3). A similar profile of cytokine secretion was observed in the HOC43 condition, with IL-6 (15.3-fold) and IL-8 (8.1-fold) showing comparable increases to NOC43. Importantly, these results indicate that enhanced cytokine gene expression as determined by quantification of mRNA levels does not necessarily correlate directly to proportional increases in secreted proteins. IL-6 protein levels were quantified independently using a different technique (ELISA), confirming a strong induction in both NOC43 (1651.3 pg/mL) and HOC43 (1578.6 pg/mL) conditions (Figure 6F) with uninfected conditions showing no upregulation of IL-6.
Interestingly, there were elevated levels of IL-13, IL-4, and IL-5 across all conditions compared to NAlone, with fold changes exceeding the arbitrarily set threshold of biological significance (>1.50-fold). IL-13 levels increased 5.7-fold in HAlone, 6.3-fold in NOC43, and 6.3-fold in HOC43. IL-4 and IL-5 also displayed increases under all conditions (Figure 6B and Supplementary Materials File S2).
Only five of the cytokines, chemokines and immune-related proteins included in the array, namely Insulin-like Growth Factor Binding Protein-3 (IGFBP-3), Vascular Endothelial Growth Factor (VEGF), Chemokine (C-C motif) ligand 20 (CCL20), Cluster of Differentiation 30 (CD30) and myeloperoxidase (MPO), were specifically upregulated under HOC43 when compared to NOC43 above the set threshold of significance, with fold increases of 4.2, 2.1, 1.8, 2.0 and 1.8, respectively (Figure 6E). CCL20 was also identified as a synergistically upregulated gene. These results suggest that while hypoxia and HCoV-OC43 infection can synergistically enhance the secretion of specific immune system proteins, this effect is selective and not uniform across all such proteins, even when synergy is observed at the transcriptomic level.
It is clear from the mRNA data presented in Figure 3, Figure 4 and Figure 5 and the protein data in Figure 6 that there is not a linear relationship between changes in mRNA level and protein level for the cytokine mRNA/protein combinations quantified. In order to investigate the relationship between mRNA and protein expression in hypoxia and during viral infection, the mRNAs coding for the top ten up- and downregulated cytokine and immune-related proteins identified from the antibody array in the HOC43 condition compared to the NOC43 were analyzed for the presence of putative internal ribosomal entry sites (IRESs) within their 5′UTRs using the Human IRES Atlas database [49,50]. Interestingly, analysis revealed that the mRNAs coding for seven out of the ten most upregulated proteins in HOC43 contain a putative IRES within the 5′UTR, compared to zero out of ten for the mRNAs of the downregulated cytokine and immune-regulated proteins identified in the array (Figure S2).
4. Discussion
Cytokine Storm (CS) has been implicated in increased mortality not only in COVID-19 [4] but also in many other severe inflammatory conditions such as bacterial sepsis [6]. Understanding the molecular mechanisms underlying CS is critical for developing targeted therapeutic strategies.
Differentially expressed genes. Analysis of our RNA sequencing data revealed that both hypoxia (HAlone) and HCoV-OC43 infection in normoxia (NOC43) individually caused changes in expression in a large number of genes, and additionally that hypoxia is able to strongly amplify signaling pathways activated by HCoV-OC43 infection, enhancing these responses in distinct ways (Figure 1 and Figure 2).
Synergistic upregulation. Importantly, the total number of differentially expressed genes (DEGs) was greater in the HOC43 condition (4551 genes) than the sum of the genes regulated by either stressor alone (HAlone and NOC43) (4252 genes, Figure 1C), suggesting synergistic regulation (in which the fold change caused by hypoxia and virus together is more than double the sum of the fold changes caused by either factor alone) of a number of genes, involving hypoxia and virus infection combined.
Different modes of regulation between the two stimuli were observed. Some genes, such as CSF2, were not differentially regulated in HAlone, but the combination of hypoxia and viral infection resulted in a significantly higher level of CSF2 mRNA compared to NOC43 (160-fold in NOC43 compared to 7920-fold in HOC43, padj = 1.60 × 10⁻⁵, Figure 3). This indicates that hypoxia is able to strongly amplify signaling pathways activated by HCoV-OC43 infection. In contrast, some genes, such as CCL20, were differentially regulated in both separate conditions (16-fold in HAlone and 1300-fold in NOC43) but exhibited much higher levels of mRNA in the combined HOC43 condition (2240-fold, padj = 2.05 × 10⁻⁴, Figure 3). This highlights a distinct synergistic effect where hypoxia and HCoV-OC43 infection-mediated signaling may converge to enhance the levels of gene expression beyond the levels seen in either condition alone. Importantly, there was also a group of purely synergistically regulated genes, including TNF and TREM1 that showed no differential gene expression in HAlone or NOC43 (Figure 3), indicating that these genes are only upregulated when both stimuli are present. Based on our data we propose three different modes by which hypoxia was observed to enhance inflammatory signaling:
- (1)
- amplification of pathways already activated by viral infection, where there is no upregulation by hypoxia alone, i.e., enhancement of virus-induced upregulation, as exemplified by CSF2,
- (2)
- amplification of pathways already activated by viral infection, where there is also upregulation by hypoxia alone, i.e., a combined effect on a gene also upregulated independently by both factors alone, as exemplified by CCL20,
- (3)
- increasing expression of genes which are not responsive to either stimulus alone, i.e., both factors together are strictly required for significant upregulation, as exemplified by TNF.
Synergistic downregulation. The majority (191 of a total of 235 genes) of the synergistically regulated genes identified in the RNA sequencing data were upregulated. However, 44 genes were identified as being synergistically downregulated (Figure 4). Compared to the synergistically upregulated genes, the synergistically downregulated genes had lower fold changes and GO analysis revealed no specific biological emphasis compared to the inflammatory focus of the upregulated genes. Thus, while hypoxia and HCoV-OC43 infection together synergistically modulate proinflammatory genes, the downregulatory effects are associated with a wider range of biological processes. Interestingly this suggests purposeful positive upregulation of specific proinflammatory pathways as opposed to a more general non-specific downregulation of transcription across a wide range of genes, potentially even all genes, being responsible for relative downregulation of certain non-essential genes which may lack counter-balancing upregulation-promoting features such as binding sites for hypoxia-inducible transcription factors. This downregulation effect is likely geared towards energy conservation in hypoxia, which limits potential for ATP generation [49].
Effects on specific cytokines and other inflammatory response proteins. When compared with studies analyzing serum cytokine levels in patients with severe or fatal COVID-19 [7,8,9,10,11], our RNA sequencing data revealed synergistic upregulation of many of the same cytokines, with 10 out of the 24 proteins identified in clinical data also being synergistically upregulated (Figure 5). This suggests that coronavirus-infected epithelial cells, particularly under hypoxic conditions as a result of ARDS, may serve as a crucial contributor of excessive cytokine release contributing to a COVID-19 cytokine storm.
CCL20. When analyzing the specific cytokines, chemokines and immune-related proteins that were upregulated by HCoV-OC43 infection in hypoxia, our finding that CCL20 was upregulated in HOC43 compared NOC43 (Figure 6E) is particularly noteworthy and clinically relevant. CCL20 is a proinflammatory chemokine that primarily attracts T cells and dendritic cells to sites of infection and inflammation [51,52]. CCL20 interacts with its receptor CCR6 [53], which is particularly highly expressed on proinflammatory Th17 T cells and anti-inflammatory regulatory (Treg) T cells, causing migration and accumulation of these cells in lung tissue [54]. Analyses of bronchial lavage fluid from patients with severe COVID-19 have revealed a higher than normal proportion of Th17 cells relative to Treg cells, a pattern also observed in other lung injuries marked by hyperinflammation, such as ARDS and acute lung injury [55]. This excessive recruitment of Th17 cells, which secrete the important highly proinflammatory cytokine IL-17, contributes to the amplification of local inflammatory responses in the lungs, which plays a critical role in the development and progression of ARDS [56]. The persistent inflammatory signaling mediated by CCL20 contributes to the severity of pulmonary pathology [57]. This process can be further exacerbated by the fact that Th17 cells can themselves release CCL20, leading to a positive feedback loop.
From a mechanistic view, the CCL20 gene has been shown to contain a HIF-1 responsive hypoxia response element (HRE) within the promoter, and CCL20 gene expression has been shown to increase in chronic hypoxia [58] and CCL20 was found to be synergistically upregulated by the combination of hypoxia and HCoV-OC43 infection in our RNA sequencing data (Figure 3). Hue et al. [59] found that serum levels of CCL20 were higher in patients with COVID-19 ARDS compared to patients with non-COVID-19 ARDS, and that the concentration increased over time, which was associated with prolonged ICU stays. This rise in serum CCL20 levels over time may be due in part to hypoxic signaling having a greater effect due to increased lung damage and ARDS linked to COVID-19 progression. This hypothesis is also supported by the fact that the same study reported the same trend in serum VEGF, a key hypoxia-related marker protein (as well as IL-8 which did not follow the same trend in our data) [16,59]. Serum levels of CCL20 were also found to be significantly higher in patients who died of COVID-19 compared to those that survived, indicating that CCL20 levels are an important negative predictor of survival in COVID-19 [11].
Therefore, targeting the CCL20/CCR6 axis could represent a promising future potential therapeutic opportunity for patients with severe COVID-19 who often exhibit elevated levels of Th17 cells [51,55]. At the time of writing, there are no currently approved drugs that target CCL20 or its target receptor CCR6. As CCL20/CCR6 mediates signaling through G-protein-coupled receptors [60], which are commonly and relatively easily targeted, our data suggest that this represents a promising potential future target for therapeutic intervention particularly in patients with severe, hypoxic COVID-19 disease. GSK3050002, a humanized IgG1κ antibody that binds to CCL20, has been investigated for use in inflammatory diseases [61] and this or a similar agent could potentially be effective in treating severe coronavirus infections.
VEGF. Using cytokine and immune-related protein arrays, A549 lung epithelial cells were observed to upregulate VEGF in HAlone (1.8-fold increase compared to NAlone), with this expression being slightly higher in HOC43 (2.2-fold, Supplementary Materials File S2). When compared to NOC43, secreted VEGF protein expression was higher in HOC43, above the arbitrarily set threshold of biological significance (>1.5-fold, Figure 6E). Josuttis et al. [62] performed a retrospective screen of 139 COVID-19 patients, of which 71 had been admitted to ICUs. Patients requiring intensive care exhibited 1.9-fold higher protein levels of VEGF. Development of ARDS and organ failure could also be predicted by VEGF levels, with 277 pg/L on admission was correlated with increased risk of developing ARDS. VEGF is induced by hypoxia via the HIF-1 pathway [63] and contributes to inflammation in a number of ways. VEGF induces vascular permeability and vasodilation as well as increasing the expression of adhesion molecules such as ICAM-1 and VCAM-1 [64,65], with ICAM-1 being identified as a synergistic gene in our RNA sequencing data (Figure 3). Additionally, VEGF can act as a chemokine, recruiting monocytes to sites of infection [66]. Thus, under hypoxia, VEGF secretion by lung epithelial cells may drive increased inflammatory infiltration, increasing damage to the surrounding microenvironment and may contribute to ARDS and CS. Some clinical trials have already taken place using bevacizumab to target VEGF in the treatment of severe hypoxemic COVID-19, but the results have not yet been published [67].
CD30 and MPO. Antibody array data revealed that CD30 and myeloperoxidase (MPO) were both upregulated at the protein level in HOC43 compared NOC43, above the arbitrarily set threshold of biological significance (Figure 6E). Interestingly, RNA sequencing did not show differential expression of either mRNA, highlighting the importance of assessing protein levels as well as RNA levels to obtain an accurate picture of biological responses. CD30 is known to play a significant role in lung inflammation [68] and has been reported to be overexpressed in chronic lung conditions such as COPD [69]. However, the expression of CD30 and MPO in epithelial cells remains debated, as expression of these proteins is typically associated with immune cells [69,70]. Additionally, this observation may be driven by cell line selection, as lung cancer cell lines such as A549 cells have been shown to express CD30 [71], with no evidence of expression for MPO. Nevertheless, we have identified CD30 and MPO as interesting prospects for investigation as potential players in epithelial cell-mediated inflammatory responses.
Other cytokines. A surprising observation was the consistently elevated levels of IL-13, IL-5 and IL-4 proteins in HAlone, NOC43 and HOC43 compared to NAlone. Elevated IL-13 has been previously associated with severe COVID-19 outcomes, including the need for mechanical ventilation [72]. Despite the increased levels of IL-13, IL-4, and IL-5 under both hypoxia and HCoV-OC43 infection, there was no observed synergistic effect between these stimuli for these cytokines. However, hypoxia-induced cytokine expression in chronic conditions, such as COPD, may exacerbate inflammatory responses during coronavirus infections [73]. This suggests that patients with chronic lung hypoxia may be at increased risk of inflammatory complications due to elevated levels of IL-13, IL-5, and IL-4 released by the lung epithelium, possibly in combination with increased levels of other cytokines.
Protective effects. Although hypoxia-induced increases in proinflammatory cytokines may contribute to worse outcomes in patients with severe COVID-19, the data also suggest that hypoxia may exert context-dependent protective effects. Cytokine protein array analysis found that IGFBP-3 was upregulated 4.2-fold higher in HOC43 compared to NOC43 (Figure 6E). Lee et al. [74] demonstrated using a lung epithelial cell line and a mouse model of asthma that IGFBP-3 was able to inhibit inflammation by facilitating the activation of caspase 3/7 and caspase 8 which degraded IκBα and p65, reducing TNF-induced inflammation. Therefore, hypoxic signaling may play a protective role in controlling excess inflammation through the upregulation of IGFBP-3 in the lung. Furthermore, expression of certain synergistic genes, such PDGF-BB (Figure 5) has been shown to negatively correlate with the lung injury Murray score [7], suggesting a potential protective role of hypoxia in mitigating lung injury in COVID-19 patients. Therefore, these findings indicate that hypoxia may contribute to modulating immune responses during coronavirus infections by limiting tissue-damaging inflammation, highlighting new research opportunities.
Disparity between gene and protein expression levels. An interesting observation from our data was that relatively modest changes were seen in the expression of certain cytokine and immune-related inflammatory proteins compared to the respective increases in their mRNA levels in RNA sequencing data. This was especially notable in inflammatory genes identified as being synergistically regulated. CSF2 was identified as a synergistic gene, being upregulated 160-fold in NOC43 and 7920-fold in HOC43 (Figure 3). However, at the protein level, CSF2 was only upregulated 3.5-fold in NOC43 and 3.7-fold in HOC43 (Supplementary Materials File S2). This drastic increase in the levels of CSF2 mRNA resulted in little if any additional protein expression. This disparity between gene and protein expression has been reported before in hypoxia, e.g., for the matrix proteoglycan versican, where there was a >600-fold increase in mRNA but a only 3-fold increase in protein expression in primary human macrophages [75]. In hypoxia, some proteins have been reported to be preferentially expressed through different mechanisms, such as Internal Ribosome Entry Sites (IRES), upstream open reading frames (uORFs) or selective mRNA partitioning [49]. IRES are crucial in hypoxia because they allow cells to bypass the usual 5′ cap-dependent translation pathway, which is often inhibited during low oxygen conditions [76]. Analysis of our proteomic data using the Human IRES Atlas found that proteins that were upregulated in HOC43 (compared to NOC43) were more likely to contain an IRES compared to those that were downregulated by the same comparison (Figure S2) [50]. CCL20 which was identified as a synergistically regulated mRNA (Figure 3) and which underwent a 1.8-fold increase in protein expression in hypoxia (Figure 6E) was also identified as containing an IRES, whereas as other synergistically regulated cytokine mRNAs such as IL6 or CSF2 without a predicted IRES underwent little to no upregulation at the protein level (1.2-fold and 1.0-fold). Thus, the increased expression of certain proinflammatory cytokines during coronavirus infections in hypoxia could be, at least in part, dependent on the presence of an IRES within the 5′UTR of the mRNA, and experimental investigation of this interesting possibility which our data highlight represents an exciting future avenue of investigation. Both CD30 and MPO proteins were upregulated above the threshold in HOC43 (compared to NOC43), and were predicted to contain a putative IRES, so this may have facilitated the increased expression of these proteins in hypoxia during HCoV-OC43 infection, even when no differential expression was seen in RNA sequencing data. However, it is important to note that the presence of outliers within the data set, such as IGFBP-3, indicates that while potentially important, this could be one of several contributing factors and is unlikely to be the single deciding factor for all genes. In summary, both in the present study and across the wider literature, the exact reasons for disparity between mRNA levels and protein levels in hypoxia for particular genes remain to be confirmed. It may simply be that increased levels of specific mRNAs are required to ensure continued production of or modest increases in protein levels, given the energetic and consequent translational inhibition constraints imposed by hypoxia.
The use of HCoV-OC43 in this study is grounded in practical and mechanistic considerations. HCoV-OC43 shares several key features with SARS-CoV-2, including aspects of genomic organization, replication, and host immune modulation, making it a suitable surrogate for studying conserved coronavirus-host interactions. HCoV-OC43 typically causes mild upper respiratory illness and does not typically cause the severe pulmonary pathology associated with early strains of SARS-CoV-2 [77]. However, more recently identified SARS-CoV-2 variants, such as Omicron and its sublineages, have demonstrated a shift in tropism toward the upper respiratory tract [78], aligning more closely with HCoV-OC43 infection. This apparent convergence strengthens the use of HCoV-OC43 as a comparative model, but care should be taken as to not extrapolate findings without further validation. While HCoV-OC43 is a virus with lower pathogenicity compared to SARS-CoV-2, molecular epidemiologic evidence indicates that this virus arose via a zoonotic transmission event, possible moving into the human population from cattle, around 1890 [79]. It has been speculated, although not proven, that this virus could have been responsible for the “Russian Flu” pandemic which occurred in 1889–1890 and caused at least 1 million excess deaths worldwide [80]. The current low pathogenicity of the now-endemic HCoV-OC43 virus may also in part be due to exposure earlier in life, as children can respond very differently to viruses compared to adults, as seen for COVID-19 [81].
In summary, we have shown that hypoxia (HAlone) and HCoV-OC43 infection in normoxia (NOC43) caused changes in expression in a large number of genes, and that there are synergistic increases in expression of certain genes in HCoV-OC43 infection in hypoxia. There are corresponding changes in protein expression levels (<13×) but these are much less than the increase in mRNA levels (<8000). Proteins that were upregulated in HOC43 (compared to NOC43) were more likely to contain an IRES within the 5′UTR of the mRNA compared to those that were downregulated by the same comparison. The main applications of this work relate to the observation that increased expression is largely related to proinflammatory pathways, and that some changes in expression are related to protective mechanisms, both of which may be relevant to the search for therapeutic interventions. To complement and expand the in vitro data presented here, extension of the work into animal models, primary cell cultures and organoid models could further enhance our understanding of how hypoxia modulates inflammatory responses to HCoV-OC43 infection. In addition to hypoxia, hyperoxia could be included in future studies since supplemental oxygen and even hyperbaric oxygen supplementation is often used in the treatment of respiratory virus and other airway conditions.
5. Conclusions
Our study highlights inflammatory changes in mRNA and protein levels that distinguish hypoxic and normoxic HCoV-OC43-infected lung epithelial cells and identifies possible regulatory mechanisms for further investigation. Our work also identifies two potential therapeutic targets, VEGF and CCL20, which are synergistically upregulated by hypoxia during HCoV-OC43 infection, the targeting of which, for example, by modulating hypoxia signaling pathways such as the HIF-1 pathway which regulates both these proteins, may be of utility in controlling hyperinflammation and inhibiting cytokine storm in patients with severe COVID-19.
Supplementary Materials
The following supporting information can be downloaded at: https://www.mdpi.com/article/10.3390/biom15081144/s1. Supplementary data file S1: All synergistically up-regulated and down-regulated genes identified in RNA sequencing analysis; Supplementary data file S2: Cytokine array raw data. Supplementary Figure S1: Analysis of synergistic gene expression in MRC-5 cells by HCoV-OC43 infection in hypoxia; Supplementary Figure S2: Analysis of IRES sequences in proteins that are up-regulated or down-regulated due to HCoV-OC43 infection in hypoxia.
Author Contributions
Conceptualization, J.Z.-H. and B.B.; methodology, J.Z.-H., B.B. and P.G.; software, J.Z.-H., A.A., and R.W.; validation, J.Z.-H. and B.B.; formal analysis, J.Z.-H., B.B., H.S. and A.A.; investigation, J.Z.-H. and H.Z.K.; data curation, J.Z.-H., A.A. and R.W.; writing—original draft preparation, J.Z.-H. and B.B.; writing—review and editing, J.Z.-H., B.B., H.S., P.G., C.A.R.; visualization, J.Z.-H., B.B., and H.S., A.A.; supervision, B.B.; project administration, J.Z.-H. and B.B.; funding acquisition, B.B. All authors have read and agreed to the published version of the manuscript.
Funding
This research was funded by a Coventry University COVID PhD Studentship awarded to BB.
Institutional Review Board Statement
This project was granted ethical approval by Coventry University, UK. Ethical approval number P111796, approval date 11 December 2020.
Informed Consent Statement
Not applicable.
Data Availability Statement
The original contributions presented in this study are included in the article/Supplementary Materials. Further inquiries can be directed to the corresponding authors.
Acknowledgments
The authors thank the technical staff within the Coventry University Centre for Health and Life Sciences for excellent technical support.
Conflicts of Interest
The authors declare no conflicts of interest.
Abbreviations
The following abbreviations are used in this manuscript:
| ARDS | Acute respiratory distress syndrome |
| BP | Biological process |
| CCL20 | C-C motif chemokine ligand 20 |
| CD30 | Cluster of differentiation 30 |
| CS | Cytokine Storm |
| DEG | Differentially expressed gene |
| DESeq2 | Differential gene expression analysis based on the negative binomial distribution 2 |
| EMEM | Eagle’s minimum essential medium |
| FBS | Fetal bovine serum |
| FDR | False discovery rate |
| HCoV-OC43 | Betacoronavirus OC43 |
| HIF | Hypoxia inducible factor |
| ICU | Intensive care unit |
| IGFBP-3 | Insulin-like growth factor-binding protein-3 |
| IRES | Internal ribosomal entry site |
| KEGG | Kyoto Encyclopedia of Genes and Genomes |
| LincRNA | long intergenic non-coding RNA |
| LncRNA | Long non-coding RNA |
| MERS-CoV | Middle East respiratory syndrome-related coronavirus |
| MPO | Myeloperoxidase |
| NF-κB | Nuclear factor kappa B |
| Padj | Adjusted p value |
| SARS-CoV | Severe acute respiratory syndrome coronavirus |
| SARS-CoV-2 | Severe acute respiratory syndrome coronavirus 2 |
| TCID50 | 50% tissue culture infectious dose |
| TPM | Transcripts per million |
| uORF | Upstream open reading frame |
| VEGF | Vascular endothelial growth factor |
References
- Frisoni, P.; Neri, M.; D'Errico, S.; Alfieri, L.; Bonuccelli, D.; Cingolani, M.; Di Paolo, M.; Gaudio, R.M.; Lestani, M.; Marti, M.; et al. Cytokine storm and histopathological findings in 60 cases of COVID-19-related death: From viral load research to immunohistochemical quantification of major players IL-1beta, IL-6, IL-15 and TNF-alpha. Forensic Sci. Med. Pathol. 2022, 18, 4–19. [Google Scholar] [CrossRef]
- Ferrara, J.L.; Abhyankar, S.; Gilliland, D.G. Cytokine storm of graft-versus-host disease: A critical effector role for interleukin-1. Transplant. Proc. 1993, 25, 1216–1217. [Google Scholar]
- Jarczak, D.; Nierhaus, A. Cytokine Storm-Definition, Causes, and Implications. Int. J. Mol. Sci. 2022, 23, 11740. [Google Scholar] [CrossRef]
- Ramatillah, D.L.; Gan, S.H.; Pratiwy, I.; Syed Sulaiman, S.A.; Jaber, A.A.S.; Jusnita, N.; Lukas, S.; Abu Bakar, U. Impact of cytokine storm on severity of COVID-19 disease in a private hospital in West Jakarta prior to vaccination. PLoS ONE 2022, 17, e0262438. [Google Scholar] [CrossRef]
- Ryabkova, V.A.; Churilov, L.P.; Shoenfeld, Y. Influenza infection, SARS, MERS and COVID-19: Cytokine storm—The common denominator and the lessons to be learned. Clin. Immunol. 2021, 223, 108652. [Google Scholar] [CrossRef] [PubMed]
- Feuerecker, M.; Sudhoff, L.; Crucian, B.; Pagel, J.I.; Sams, C.; Strewe, C.; Guo, A.; Schelling, G.; Briegel, J.; Kaufmann, I.; et al. Early immune anergy towards recall antigens and mitogens in patients at onset of septic shock. Sci. Rep. 2018, 8, 1754. [Google Scholar] [CrossRef] [PubMed]
- Liu, Y.; Zhang, C.; Huang, F.; Yang, Y.; Wang, F.; Yuan, J.; Zhang, Z.; Qin, Y.; Li, X.; Zhao, D.; et al. Elevated plasma levels of selective cytokines in COVID-19 patients reflect viral load and lung injury. Natl. Sci. Rev. 2020, 7, 1003–1011. [Google Scholar] [CrossRef]
- Chen, L.; Liu, H.G.; Liu, W.; Liu, J.; Liu, K.; Shang, J.; Deng, Y.; Wei, S. Analysis of clinical features of 29 patients with 2019 novel coronavirus pneumonia. Zhonghua Jie He He Hu Xi Za Zhi 2020, 43, E005. [Google Scholar] [CrossRef] [PubMed]
- Huang, C.; Wang, Y.; Li, X.; Ren, L.; Zhao, J.; Hu, Y.; Zhang, L.; Fan, G.; Xu, J.; Gu, X.; et al. Clinical features of patients infected with 2019 novel coronavirus in Wuhan, China. Lancet 2020, 395, 497–506. [Google Scholar] [CrossRef]
- Varchetta, S.; Mele, D.; Oliviero, B.; Mantovani, S.; Ludovisi, S.; Cerino, A.; Bruno, R.; Castelli, A.; Mosconi, M.; Vecchia, M.; et al. Unique immunological profile in patients with COVID-19. Cell Mol. Immunol. 2021, 18, 604–612. [Google Scholar] [CrossRef]
- Andersen, L.; Hindsberger, B.; Bastrup Israelsen, S.; Pedersen, L.; Bela Szecsi, P.; Benfield, T. Higher levels of IL-1ra, IL-6, IL-8, MCP-1, MIP-3alpha, MIP-3beta, and fractalkine are associated with 90-day mortality in 132 non-immunomodulated hospitalized patients with COVID-19. PLoS ONE 2024, 19, e0306854. [Google Scholar] [CrossRef]
- Fanelli, V.; Vlachou, A.; Ghannadian, S.; Simonetti, U.; Slutsky, A.S.; Zhang, H. Acute respiratory distress syndrome: New definition, current and future therapeutic options. J. Thorac. Dis. 2013, 5, 326–334. [Google Scholar] [CrossRef] [PubMed]
- Tzotzos, S.J.; Fischer, B.; Fischer, H.; Zeitlinger, M. Incidence of ARDS and outcomes in hospitalized patients with COVID-19: A global literature survey. Crit. Care 2020, 24, 516. [Google Scholar] [CrossRef] [PubMed]
- Force, A.D.T.; Ranieri, V.M.; Rubenfeld, G.D.; Thompson, B.T.; Ferguson, N.D.; Caldwell, E.; Fan, E.; Camporota, L.; Slutsky, A.S. Acute respiratory distress syndrome: The Berlin Definition. JAMA 2012, 307, 2526–2533. [Google Scholar] [CrossRef]
- Vengellur, A.; Woods, B.G.; Ryan, H.E.; Johnson, R.S.; LaPres, J.J. Gene expression profiling of the hypoxia signaling pathway in hypoxia-inducible factor 1alpha null mouse embryonic fibroblasts. Gene Expr. 2003, 11, 181–197. [Google Scholar] [CrossRef] [PubMed]
- Samanta, D.; Prabhakar, N.R.; Semenza, G.L. Systems biology of oxygen homeostasis. Wiley Interdiscip. Rev. Syst. Biol. Med. 2017, 9, e1382. [Google Scholar] [CrossRef]
- Mirchandani, A.S.; Jenkins, S.J.; Bain, C.C.; Sanchez-Garcia, M.A.; Lawson, H.; Coelho, P.; Murphy, F.; Griffith, D.M.; Zhang, A.; Morrison, T.; et al. Hypoxia shapes the immune landscape in lung injury and promotes the persistence of inflammation. Nat. Immunol. 2022, 23, 927–939. [Google Scholar] [CrossRef]
- Vuichard, D.; Ganter, M.T.; Schimmer, R.C.; Suter, D.; Booy, C.; Reyes, L.; Pasch, T.; Beck-Schimmer, B. Hypoxia aggravates lipopolysaccharide-induced lung injury. Clin. Exp. Immunol. 2005, 141, 248–260. [Google Scholar] [CrossRef]
- Titto, M.; Ankit, T.; Saumya, B.; Gausal, A.; Saranda, S. Curcumin prophylaxis refurbishes alveolar epithelial barrier integrity and alveolar fluid clearance under hypoxia. Respir. Physiol. Neurobiol. 2020, 274, 103336. [Google Scholar] [CrossRef]
- Jahani, M.; Dokaneheifard, S.; Mansouri, K. Hypoxia: A key feature of COVID-19 launching activation of HIF-1 and cytokine storm. J. Inflamm. 2020, 17, 33. [Google Scholar] [CrossRef]
- Fitzpatrick, S.F.; Tambuwala, M.M.; Bruning, U.; Schaible, B.; Scholz, C.C.; Byrne, A.; O'Connor, A.; Gallagher, W.M.; Lenihan, C.R.; Garvey, J.F.; et al. An intact canonical NF-kappaB pathway is required for inflammatory gene expression in response to hypoxia. J. Immunol. 2011, 186, 1091–1096. [Google Scholar] [CrossRef]
- Mi, Z.; Rapisarda, A.; Taylor, L.; Brooks, A.; Creighton-Gutteridge, M.; Melillo, G.; Varesio, L. Synergystic induction of HIF-1alpha transcriptional activity by hypoxia and lipopolysaccharide in macrophages. Cell Cycle 2008, 7, 232–241. [Google Scholar] [CrossRef]
- Guo, X.; Zhu, Z.; Zhang, W.; Meng, X.; Zhu, Y.; Han, P.; Zhou, X.; Hu, Y.; Wang, R. Nuclear translocation of HIF-1alpha induced by influenza A (H1N1) infection is critical to the production of proinflammatory cytokines. Emerg. Microbes Infect. 2017, 6, e39. [Google Scholar] [CrossRef]
- Blouin, C.C.; Page, E.L.; Soucy, G.M.; Richard, D.E. Hypoxic gene activation by lipopolysaccharide in macrophages: Implication of hypoxia-inducible factor 1alpha. Blood 2004, 103, 1124–1130. [Google Scholar] [CrossRef]
- Grieb, P.; Swiatkiewicz, M.; Prus, K.; Rejdak, K. Hypoxia may be a determinative factor in COVID-19 progression. Curr. Res. Pharmacol. Drug Discov. 2021, 2, 100030. [Google Scholar] [CrossRef] [PubMed]
- Teodorescu, M.; Song, R.; Brinkman, J.A.; Sorkness, R.L. Chronic intermittent hypoxia increases airway hyperresponsiveness during house dust mites exposures in rats. Respir. Res. 2023, 24, 189. [Google Scholar] [CrossRef] [PubMed]
- Meng, H.; Zhang, D.; Que, Y.; Hu, P.; Wang, R.; Liao, Y.; Xu, G. Intermittent hypoxic pretreatment exacerbates house dust mite-induced asthma airway inflammation. Immun. Inflamm. Dis. 2024, 12, e1253. [Google Scholar] [CrossRef] [PubMed]
- Gibson, P.G.; Qin, L.; Puah, S.H. COVID-19 acute respiratory distress syndrome (ARDS): Clinical features and differences from typical pre-COVID-19 ARDS. Med. J. Aust. 2020, 213, 54–56.e51. [Google Scholar] [CrossRef]
- Bridges, J.P.; Vladar, E.K.; Huang, H.; Mason, R.J. Respiratory epithelial cell responses to SARS-CoV-2 in COVID-19. Thorax 2022, 77, 203–209. [Google Scholar] [CrossRef]
- Chang, C.W.; Parsi, K.M.; Somasundaran, M.; Vanderleeden, E.; Liu, P.; Cruz, J.; Cousineau, A.; Finberg, R.W.; Kurt-Jones, E.A. A Newly Engineered A549 Cell Line Expressing ACE2 and TMPRSS2 Is Highly Permissive to SARS-CoV-2, Including the Delta and Omicron Variants. Viruses 2022, 14, 1369. [Google Scholar] [CrossRef]
- Karmakar, S.; Das Sarma, J. Human coronavirus OC43 infection remodels connexin 43-mediated gap junction intercellular communication in vitro. J. Virol. 2024, 98, e0047824. [Google Scholar] [CrossRef]
- Good, S.S.; Westover, J.; Jung, K.H.; Zhou, X.J.; Moussa, A.; La Colla, P.; Collu, G.; Canard, B.; Sommadossi, J.P. AT-527, a Double Prodrug of a Guanosine Nucleotide Analog, Is a Potent Inhibitor of SARS-CoV-2 In Vitro and a Promising Oral Antiviral for Treatment of COVID-19. Antimicrob. Agents Chemother. 2021, 65, 10–1128. [Google Scholar] [CrossRef]
- Kim, M.I.; Lee, C. Human Coronavirus OC43 as a Low-Risk Model to Study COVID-19. Viruses 2023, 15, 578. [Google Scholar] [CrossRef] [PubMed]
- Schirtzinger, E.E.; Kim, Y.; Davis, A.S. Improving human coronavirus OC43 (HCoV-OC43) research comparability in studies using HCoV-OC43 as a surrogate for SARS-CoV-2. J. Virol. Methods 2022, 299, 114317. [Google Scholar] [CrossRef]
- Gould, E.A. Methods for long-term virus preservation. Mol. Biotechnol. 1999, 13, 57–66. [Google Scholar] [CrossRef]
- Hierholzer, J.C.; Killington, R.A. Virus Isolation and Quantitation; Academic Press: Cambridge, MA, USA, 1996. [Google Scholar]
- Love, M.I.; Huber, W.; Anders, S. Moderated estimation of fold change and dispersion for RNA-seq data with DESeq2. Genome Biol. 2014, 15, 550. [Google Scholar] [CrossRef] [PubMed]
- Su, M.; Ping, S.; Nguyen, P.V.; Rojas, A.; Hussaini, L.; Carmola, L.R.; Taz, A.; Sullivan, J.; Martin, G.S.; Piantadosi, A.; et al. Subgenomic RNA Abundance Relative to Total Viral RNA Among Severe Acute Respiratory Syndrome Coronavirus 2 Variants. Open Forum Infect. Dis. 2022, 9, ofac619. [Google Scholar] [CrossRef]
- Dagotto, G.; Mercado, N.B.; Martinez, D.R.; Hou, Y.J.; Nkolola, J.P.; Carnahan, R.H.; Crowe, J.E., Jr.; Baric, R.S.; Barouch, D.H. Comparison of Subgenomic and Total RNA in SARS-CoV-2 Challenged Rhesus Macaques. J. Virol. 2021, 95. [Google Scholar] [CrossRef]
- Wagner, G.P.; Kin, K.; Lynch, V.J. Measurement of mRNA abundance using RNA-seq data: RPKM measure is inconsistent among samples. Theory Biosci. 2012, 131, 281–285. [Google Scholar] [CrossRef] [PubMed]
- Goldstein, I.; Paakinaho, V.; Baek, S.; Sung, M.H.; Hager, G.L. Synergistic gene expression during the acute phase response is characterized by transcription factor assisted loading. Nat. Commun. 2017, 8, 1849. [Google Scholar] [CrossRef]
- Ge, S.X.; Jung, D.; Yao, R. ShinyGO: A graphical gene-set enrichment tool for animals and plants. Bioinformatics 2020, 36, 2628–2629. [Google Scholar] [CrossRef]
- Yang, Y.; Koga, H.; Nakagawa, Y.; Nakamura, T.; Katagiri, H.; Takada, R.; Katakura, M.; Tsuji, K.; Sekiya, I.; Miyatake, K. Characteristics of the synovial microenvironment and synovial mesenchymal stem cells with hip osteoarthritis of different bone morphologies. Arthritis Res. Ther. 2024, 26, 17. [Google Scholar] [CrossRef]
- Bentaberry-Rosa, A.; Nicaise, Y.; Delmas, C.; Gouaze-Andersson, V.; Cohen-Jonathan-Moyal, E.; Seva, C. Overexpression of Growth Differentiation Factor 15 in Glioblastoma Stem Cells Promotes Their Radioresistance. Cancers 2023, 16, 27. [Google Scholar] [CrossRef]
- Levy, N.S.; Chung, S.; Furneaux, H.; Levy, A.P. Hypoxic stabilization of vascular endothelial growth factor mRNA by the RNA-binding protein HuR. J. Biol. Chem. 1998, 273, 6417–6423. [Google Scholar] [CrossRef] [PubMed]
- Rose-John, S. Interleukin-6 Family Cytokines. Cold Spring Harb. Perspect. Biol. 2018, 10. [Google Scholar] [CrossRef] [PubMed]
- Ten Freyhaus, H.; Dagnell, M.; Leuchs, M.; Vantler, M.; Berghausen, E.M.; Caglayan, E.; Weissmann, N.; Dahal, B.K.; Schermuly, R.T.; Ostman, A.; et al. Hypoxia enhances platelet-derived growth factor signaling in the pulmonary vasculature by down-regulation of protein tyrosine phosphatases. Am. J. Respir. Crit. Care Med. 2011, 183, 1092–1102. [Google Scholar] [CrossRef]
- Torres-Estay, V.; Mastri, M.; Rosario, S.; Fuenzalida, P.; Echeverria, C.E.; Flores, E.; Watts, A.; Cerda-Infante, J.; Montecinos, V.P.; Sotomayor, P.C.; et al. The Differential Paracrine Role of the Endothelium in Prostate Cancer Cells. Cancers 2022, 14, 4750. [Google Scholar] [CrossRef]
- Chee, N.T.; Lohse, I.; Brothers, S.P. mRNA-to-protein translation in hypoxia. Mol. Cancer 2019, 18, 49. [Google Scholar] [CrossRef]
- Yang, T.H.; Wang, C.Y.; Tsai, H.C.; Liu, C.T. Human IRES Atlas: An integrative platform for studying IRES-driven translational regulation in humans. Database 2021, 2021, baab025. [Google Scholar] [CrossRef] [PubMed]
- Kadomoto, S.; Izumi, K.; Mizokami, A. The CCL20-CCR6 Axis in Cancer Progression. Int. J. Mol. Sci. 2020, 21, 5186. [Google Scholar] [CrossRef]
- Kondo, T.; Takata, H.; Takiguchi, M. Functional expression of chemokine receptor CCR6 on human effector memory CD8+ T cells. Eur. J. Immunol. 2007, 37, 54–65. [Google Scholar] [CrossRef]
- Schutyser, E.; Struyf, S.; Van Damme, J. The CC chemokine CCL20 and its receptor CCR6. Cytokine Growth Factor. Rev. 2003, 14, 409–426. [Google Scholar] [CrossRef]
- Yamazaki, T.; Yang, X.O.; Chung, Y.; Fukunaga, A.; Nurieva, R.; Pappu, B.; Martin-Orozco, N.; Kang, H.S.; Ma, L.; Panopoulos, A.D.; et al. CCR6 regulates the migration of inflammatory and regulatory T cells. J. Immunol. 2008, 181, 8391–8401. [Google Scholar] [CrossRef]
- Martonik, D.; Parfieniuk-Kowerda, A.; Rogalska, M.; Flisiak, R. The Role of Th17 Response in COVID-19. Cells 2021, 10, 1550. [Google Scholar] [CrossRef]
- Hou, Q.; Jiang, J.; Na, K.; Zhang, X.; Liu, D.; Jing, Q.; Yan, C.; Han, Y. Potential therapeutic targets for COVID-19 complicated with pulmonary hypertension: A bioinformatics and early validation study. Sci. Rep. 2024, 14, 9294. [Google Scholar] [CrossRef]
- Coperchini, F.; Chiovato, L.; Ricci, G.; Croce, L.; Magri, F.; Rotondi, M. The cytokine storm in COVID-19: Further advances in our understanding the role of specific chemokines involved. Cytokine Growth Factor. Rev. 2021, 58, 82–91. [Google Scholar] [CrossRef]
- Korbecki, J.; Kojder, K.; Barczak, K.; Siminska, D.; Gutowska, I.; Chlubek, D.; Baranowska-Bosiacka, I. Hypoxia Alters the Expression of CC Chemokines and CC Chemokine Receptors in a Tumor-A Literature Review. Int. J. Mol. Sci. 2020, 21, 5647. [Google Scholar] [CrossRef]
- Hue, S.; Beldi-Ferchiou, A.; Bendib, I.; Surenaud, M.; Fourati, S.; Frapard, T.; Rivoal, S.; Razazi, K.; Carteaux, G.; Delfau-Larue, M.H.; et al. Uncontrolled Innate and Impaired Adaptive Immune Responses in Patients with COVID-19 Acute Respiratory Distress Syndrome. Am. J. Respir. Crit. Care Med. 2020, 202, 1509–1519. [Google Scholar] [CrossRef] [PubMed]
- Li, Y.; Geng, W.L.; Li, C.C.; Wu, J.H.; Gao, F.; Wang, Y. Progress of CCL20-CCR6 in the airways: A promising new therapeutic target. J. Inflamm. 2024, 21, 54. [Google Scholar] [CrossRef] [PubMed]
- Bouma, G.; Zamuner, S.; Hicks, K.; Want, A.; Oliveira, J.; Choudhury, A.; Brett, S.; Robertson, D.; Felton, L.; Norris, V.; et al. CCL20 neutralization by a monoclonal antibody in healthy subjects selectively inhibits recruitment of CCR6(+) cells in an experimental suction blister. Br. J. Clin. Pharmacol. 2017, 83, 1976–1990. [Google Scholar] [CrossRef] [PubMed]
- Josuttis, D.; Schwedler, C.; Heymann, G.; Gumbel, D.; Schmittner, M.D.; Kruse, M.; Hoppe, B. Vascular Endothelial Growth Factor as Potential Biomarker for COVID-19 Severity. J. Intensive Care Med. 2023, 38, 1165–1173. [Google Scholar] [CrossRef]
- Forsythe, J.A.; Jiang, B.H.; Iyer, N.V.; Agani, F.; Leung, S.W.; Koos, R.D.; Semenza, G.L. Activation of vascular endothelial growth factor gene transcription by hypoxia-inducible factor 1. Mol. Cell. Biol. 1996, 16, 4604–4613. [Google Scholar] [CrossRef]
- Bates, D.O. Vascular endothelial growth factors and vascular permeability. Cardiovasc. Res. 2010, 87, 262–271. [Google Scholar] [CrossRef]
- Kim, I.; Moon, S.O.; Kim, S.H.; Kim, H.J.; Koh, Y.S.; Koh, G.Y. Vascular endothelial growth factor expression of intercellular adhesion molecule 1 (ICAM-1), vascular cell adhesion molecule 1 (VCAM-1), and E-selectin through nuclear factor-kappa B activation in endothelial cells. J. Biol. Chem. 2001, 276, 7614–7620. [Google Scholar] [CrossRef]
- Barleon, B.; Sozzani, S.; Zhou, D.; Weich, H.A.; Mantovani, A.; Marme, D. Migration of human monocytes in response to vascular endothelial growth factor (VEGF) is mediated via the VEGF receptor flt-1. Blood 1996, 87, 3336–3343. [Google Scholar] [CrossRef]
- Paris, H.d. Efficacy and Safety of Bevacizumab (Zirabev®) in Patients with Severe Hypoxiemic COVID-19 (BEVA). Available online: https://clinicaltrials.gov/study/NCT04822818?cond=COVID%2019&term=VEGF&rank=5 (accessed on 15 January 2025).
- Nam, S.Y.; Kim, Y.H.; Do, J.S.; Choi, Y.H.; Seo, H.J.; Yi, H.K.; Hwang, P.H.; Song, C.H.; Lee, H.K.; Kim, J.S.; et al. CD30 supports lung inflammation. Int. Immunol. 2008, 20, 177–184. [Google Scholar] [CrossRef][Green Version]
- Luo, L.; Liu, Y.; Chen, D.; Chen, F.; Lan, H.B.; Xie, C. CD30 Is Highly Expressed in Chronic Obstructive Pulmonary Disease and Induces the Pulmonary Vascular Remodeling. Biomed. Res. Int. 2018, 2018, 3261436. [Google Scholar] [CrossRef]
- Khan, A.A.; Alsahli, M.A.; Rahmani, A.H. Myeloperoxidase as an Active Disease Biomarker: Recent Biochemical and Pathological Perspectives. Med. Sci. 2018, 6, 33. [Google Scholar] [CrossRef]
- Kang, L.; Jiang, D.; Ehlerding, E.B.; Barnhart, T.E.; Ni, D.; Engle, J.W.; Wang, R.; Huang, P.; Xu, X.; Cai, W. Noninvasive Trafficking of Brentuximab Vedotin and PET Imaging of CD30 in Lung Cancer Murine Models. Mol. Pharm. 2018, 15, 1627–1634. [Google Scholar] [CrossRef]
- Donlan, A.N.; Sutherland, T.E.; Marie, C.; Preissner, S.; Bradley, B.T.; Carpenter, R.M.; Sturek, J.M.; Ma, J.Z.; Moreau, G.B.; Donowitz, J.R.; et al. IL-13 is a driver of COVID-19 severity. JCI Insight 2021, 6, 2020–2026. [Google Scholar] [CrossRef]
- Choudhury, P.; Biswas, S.; Singh, G.; Pal, A.; Ghosh, N.; Ojha, A.K.; Das, S.; Dutta, G.; Chaudhury, K. Immunological profiling and development of a sensing device for detection of IL-13 in COPD and asthma. Bioelectrochemistry 2022, 143, 107971. [Google Scholar] [CrossRef]
- Lee, Y.C.; Jogie-Brahim, S.; Lee, D.Y.; Han, J.; Harada, A.; Murphy, L.J.; Oh, Y. Insulin-like growth factor-binding protein-3 (IGFBP-3) blocks the effects of asthma by negatively regulating NF-kappaB signaling through IGFBP-3R-mediated activation of caspases. J. Biol. Chem. 2011, 286, 17898–17909. [Google Scholar] [CrossRef] [PubMed]
- Sotoodehnejadnematalahi, F.; Staples, K.J.; Chrysanthou, E.; Pearson, H.; Ziegler-Heitbrock, L.; Burke, B. Mechanisms of Hypoxic Up-Regulation of Versican Gene Expression in Macrophages. PLoS ONE 2015, 10, e0125799. [Google Scholar] [CrossRef]
- Marques, R.; Lacerda, R.; Romao, L. Internal Ribosome Entry Site (IRES)-Mediated Translation and Its Potential for Novel mRNA-Based Therapy Development. Biomedicines 2022, 10, 1865. [Google Scholar] [CrossRef]
- Zumla, A.; Chan, J.F.; Azhar, E.I.; Hui, D.S.; Yuen, K.Y. Coronaviruses - drug discovery and therapeutic options. Nat. Rev. Drug Discov. 2016, 15, 327–347. [Google Scholar] [CrossRef]
- Hughes, T.D.; Subramanian, A.; Chakraborty, R.; Cotton, S.A.; Herrera, M.; Huang, Y.; Lambert, N.; Pinto, M.D.; Rahmani, A.M.; Sierra, C.J.; et al. The effect of SARS-CoV-2 variant on respiratory features and mortality. Sci. Rep. 2023, 13, 4503. [Google Scholar] [CrossRef]
- Vijgen, L.; Keyaerts, E.; Moes, E.; Thoelen, I.; Wollants, E.; Lemey, P.; Vandamme, A.M.; Van Ranst, M. Complete genomic sequence of human coronavirus OC43: Molecular clock analysis suggests a relatively recent zoonotic coronavirus transmission event. J. Virol. 2005, 79, 1595–1604. [Google Scholar] [CrossRef]
- Brussow, H.; Brussow, L. Clinical evidence that the pandemic from 1889 to 1891 commonly called the Russian flu might have been an earlier coronavirus pandemic. Microb. Biotechnol. 2021, 14, 1860–1870. [Google Scholar] [CrossRef]
- Morrell, E.D.; Mikacenic, C. Differences between Children and Adults with COVID-19: It's Right under Our Nose. Am. J. Respir. Cell Mol. Biol. 2022, 66, 122–123. [Google Scholar] [CrossRef]
Disclaimer/Publisher’s Note: The statements, opinions and data contained in all publications are solely those of the individual author(s) and contributor(s) and not of MDPI and/or the editor(s). MDPI and/or the editor(s) disclaim responsibility for any injury to people or property resulting from any ideas, methods, instructions or products referred to in the content. |
© 2025 by the authors. Licensee MDPI, Basel, Switzerland. This article is an open access article distributed under the terms and conditions of the Creative Commons Attribution (CC BY) license (https://creativecommons.org/licenses/by/4.0/).