
Acetaldehyde Enhances Alcohol Sensitivity and Protects against Alcoholism: Evidence from Alcohol Metabolism in Subjects with Variant ALDH2*2 Gene Allele


Abstract
:1. Introduction
2. Materials and Methods
2.1. Subjects
2.2. General Procedure
2.3. Genotyping
2.4. Determination of Blood Ethanol and Acetaldehyde
2.5. Assessment of Subjective Response
2.6. Statistical Analysis
3. Results
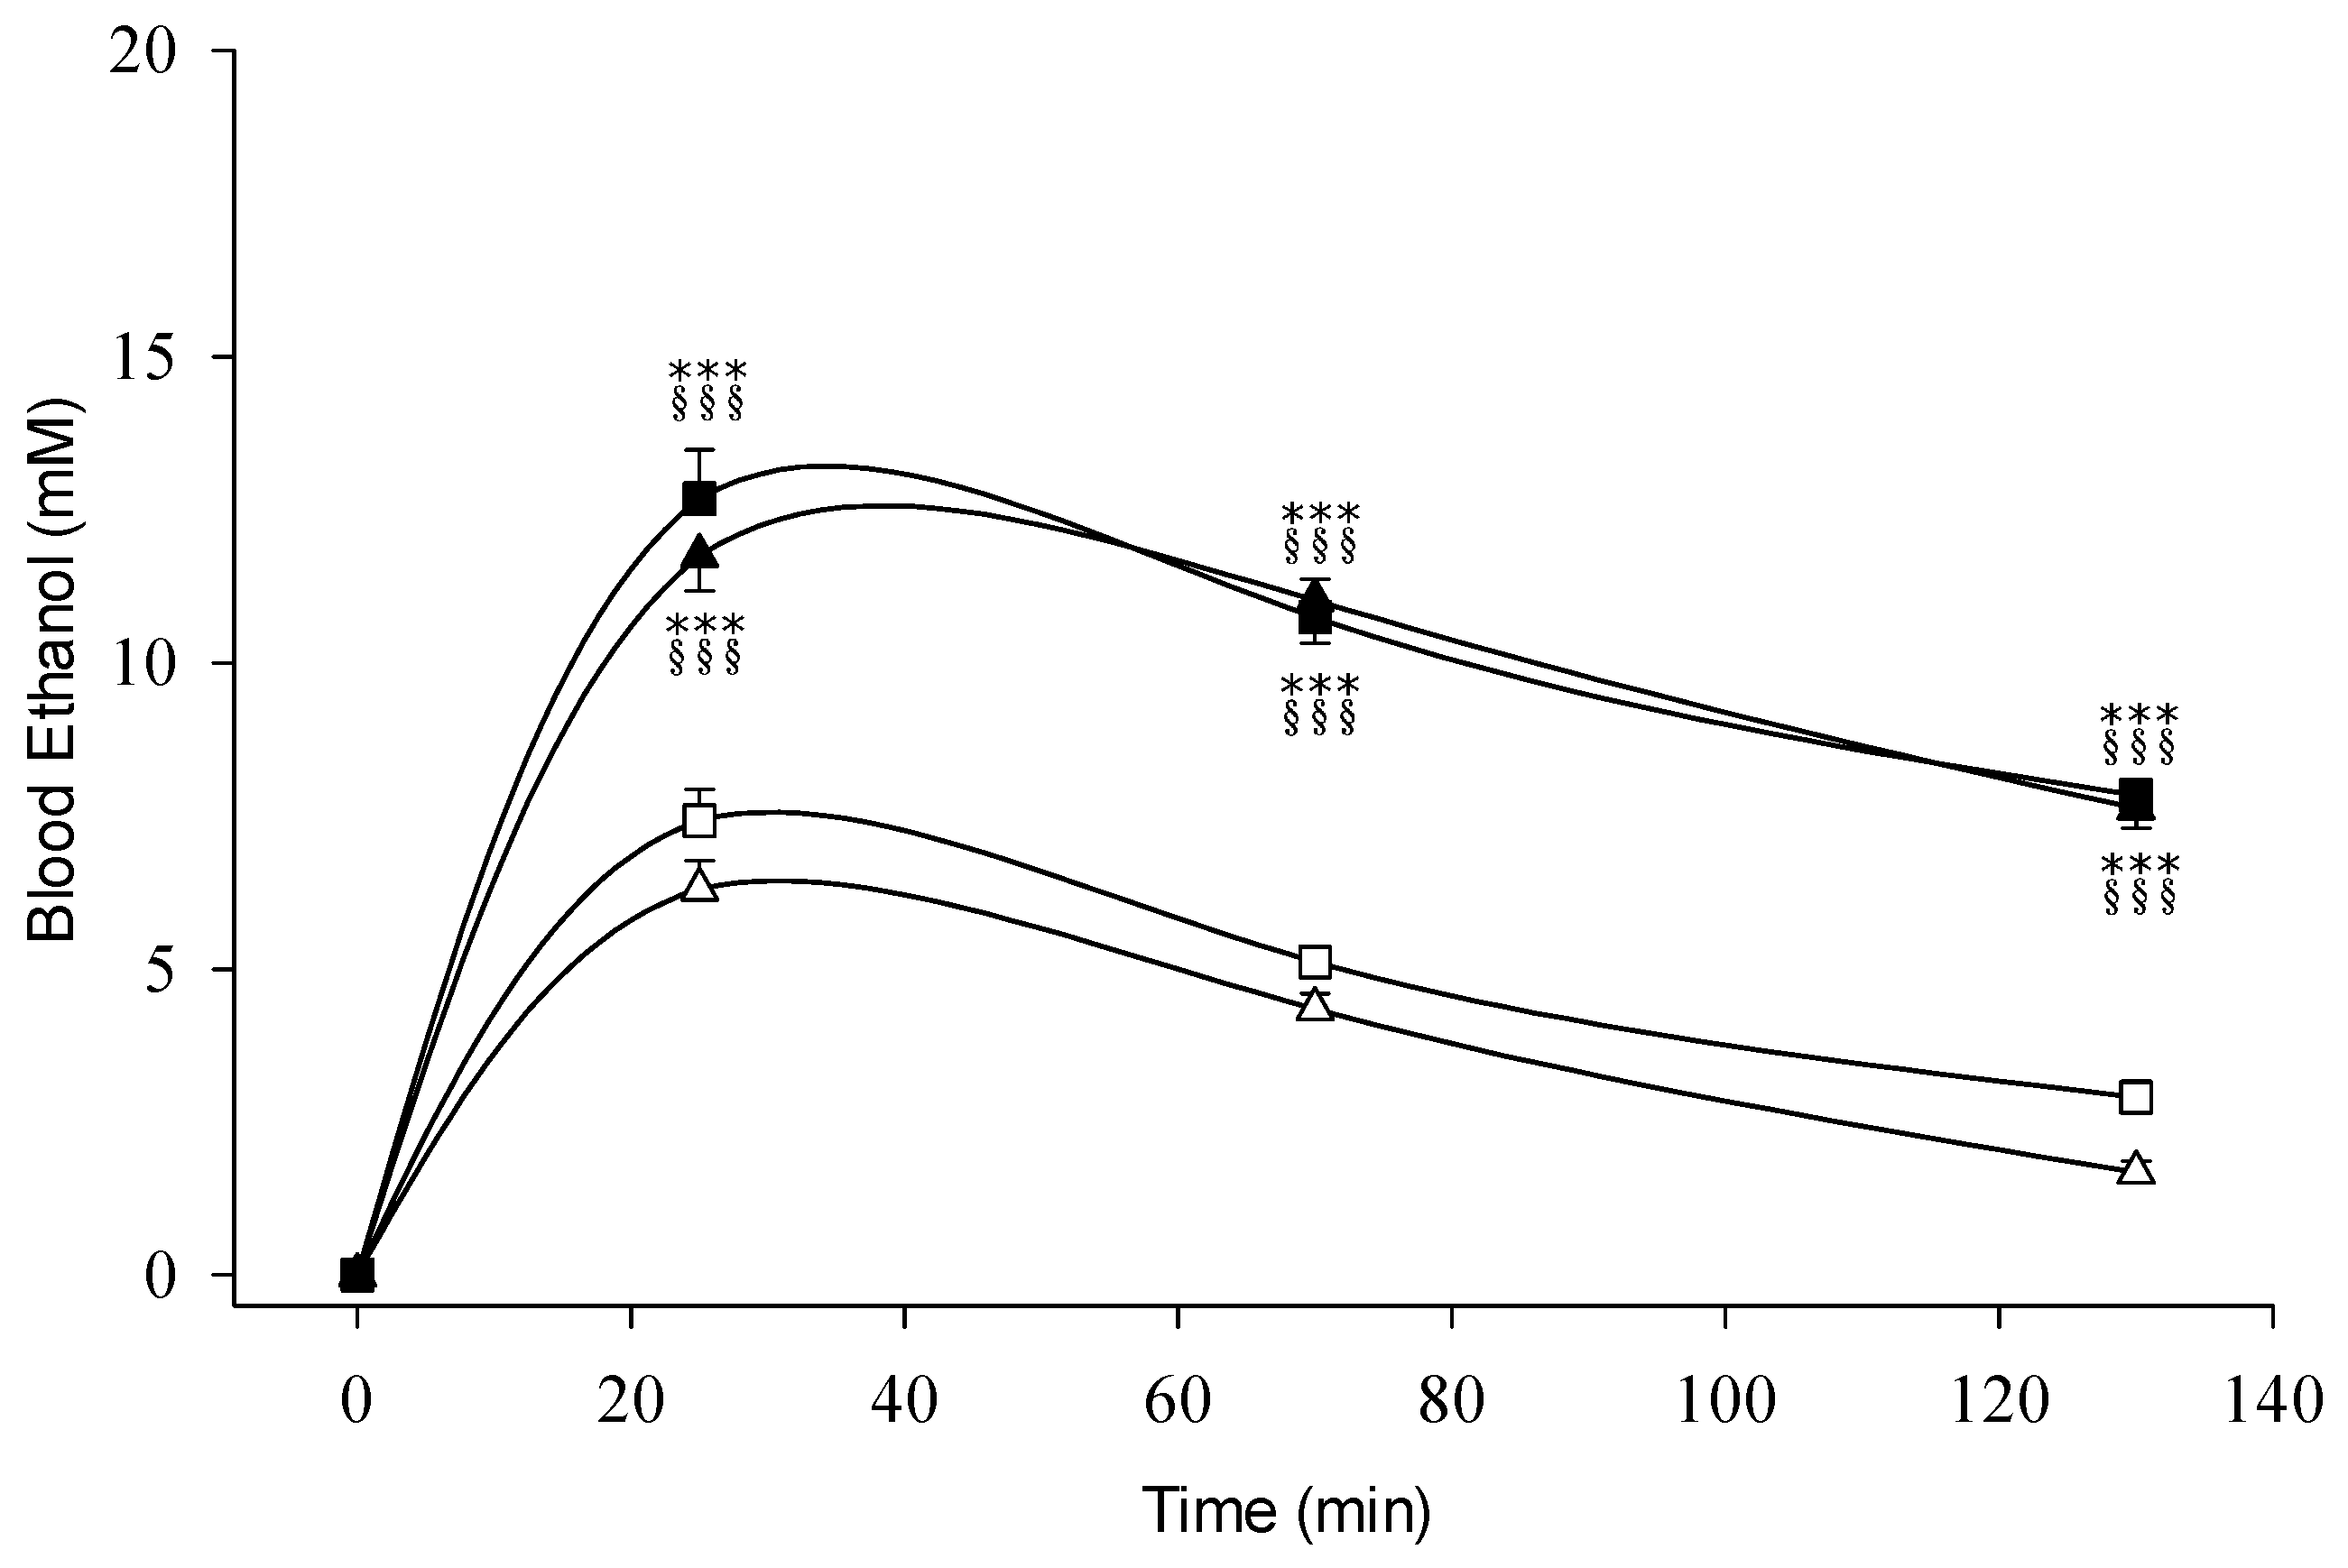
3.1. Blood Ethanol
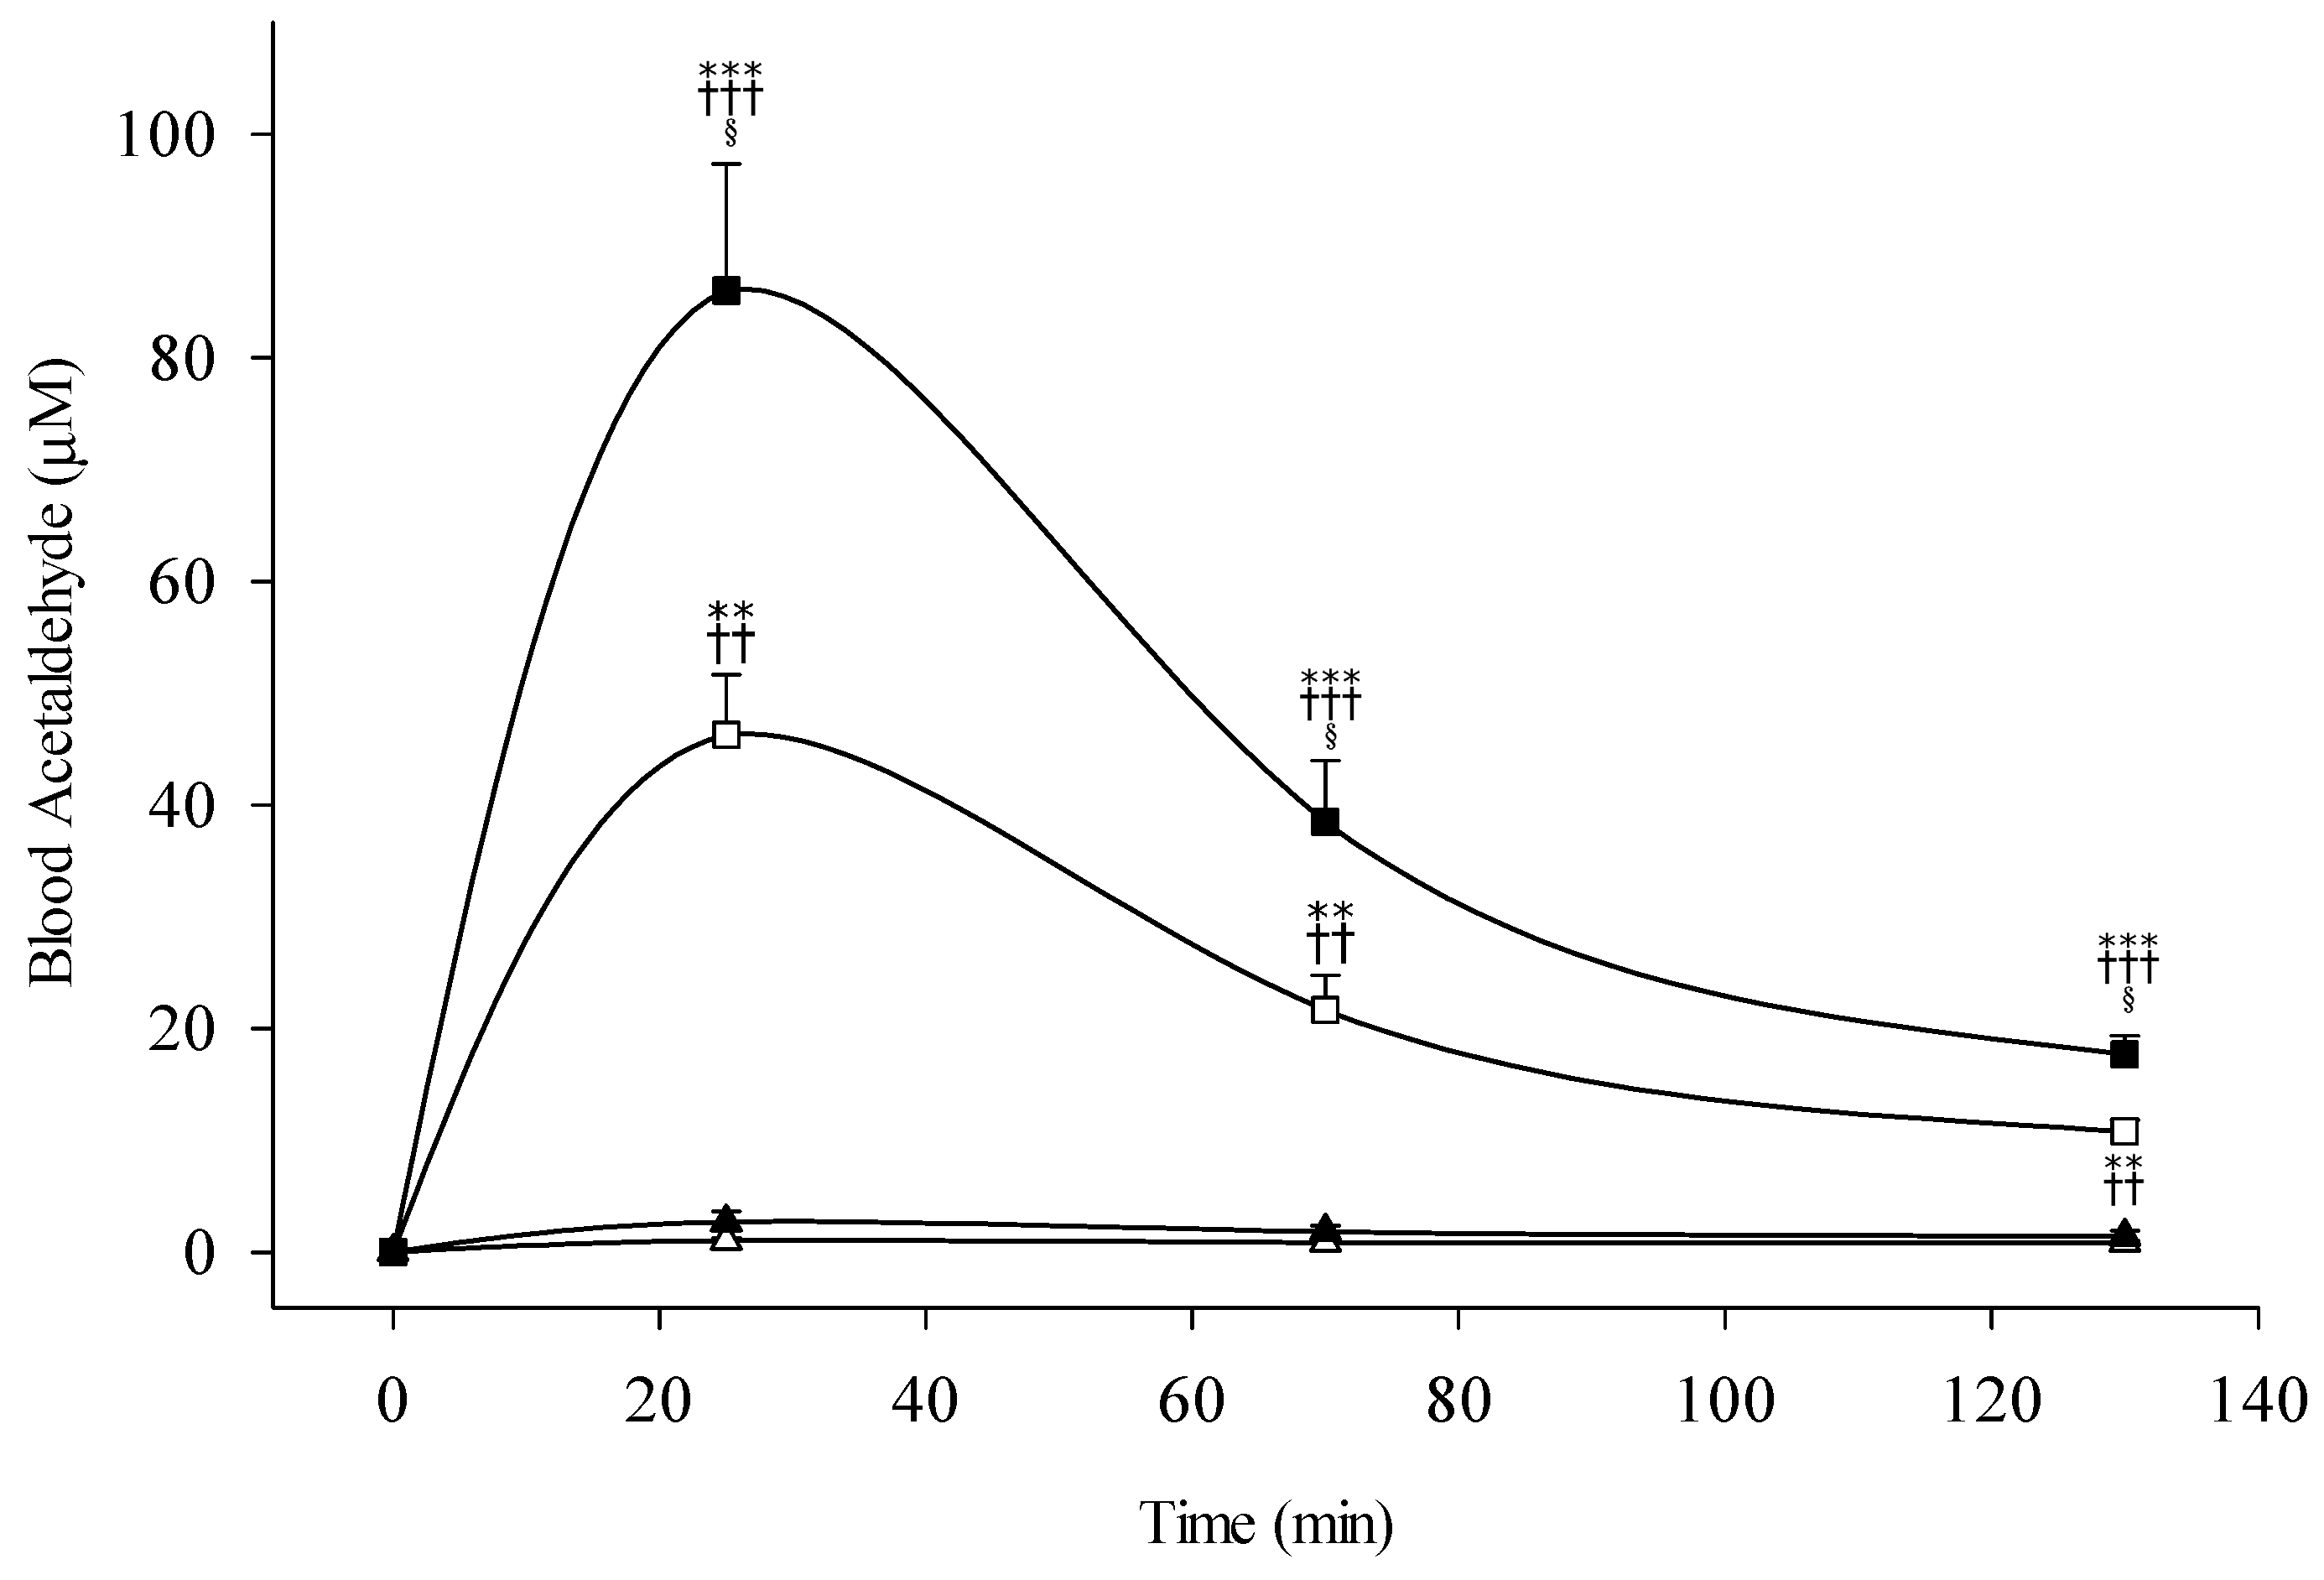
3.2. Blood Acetaldehyde
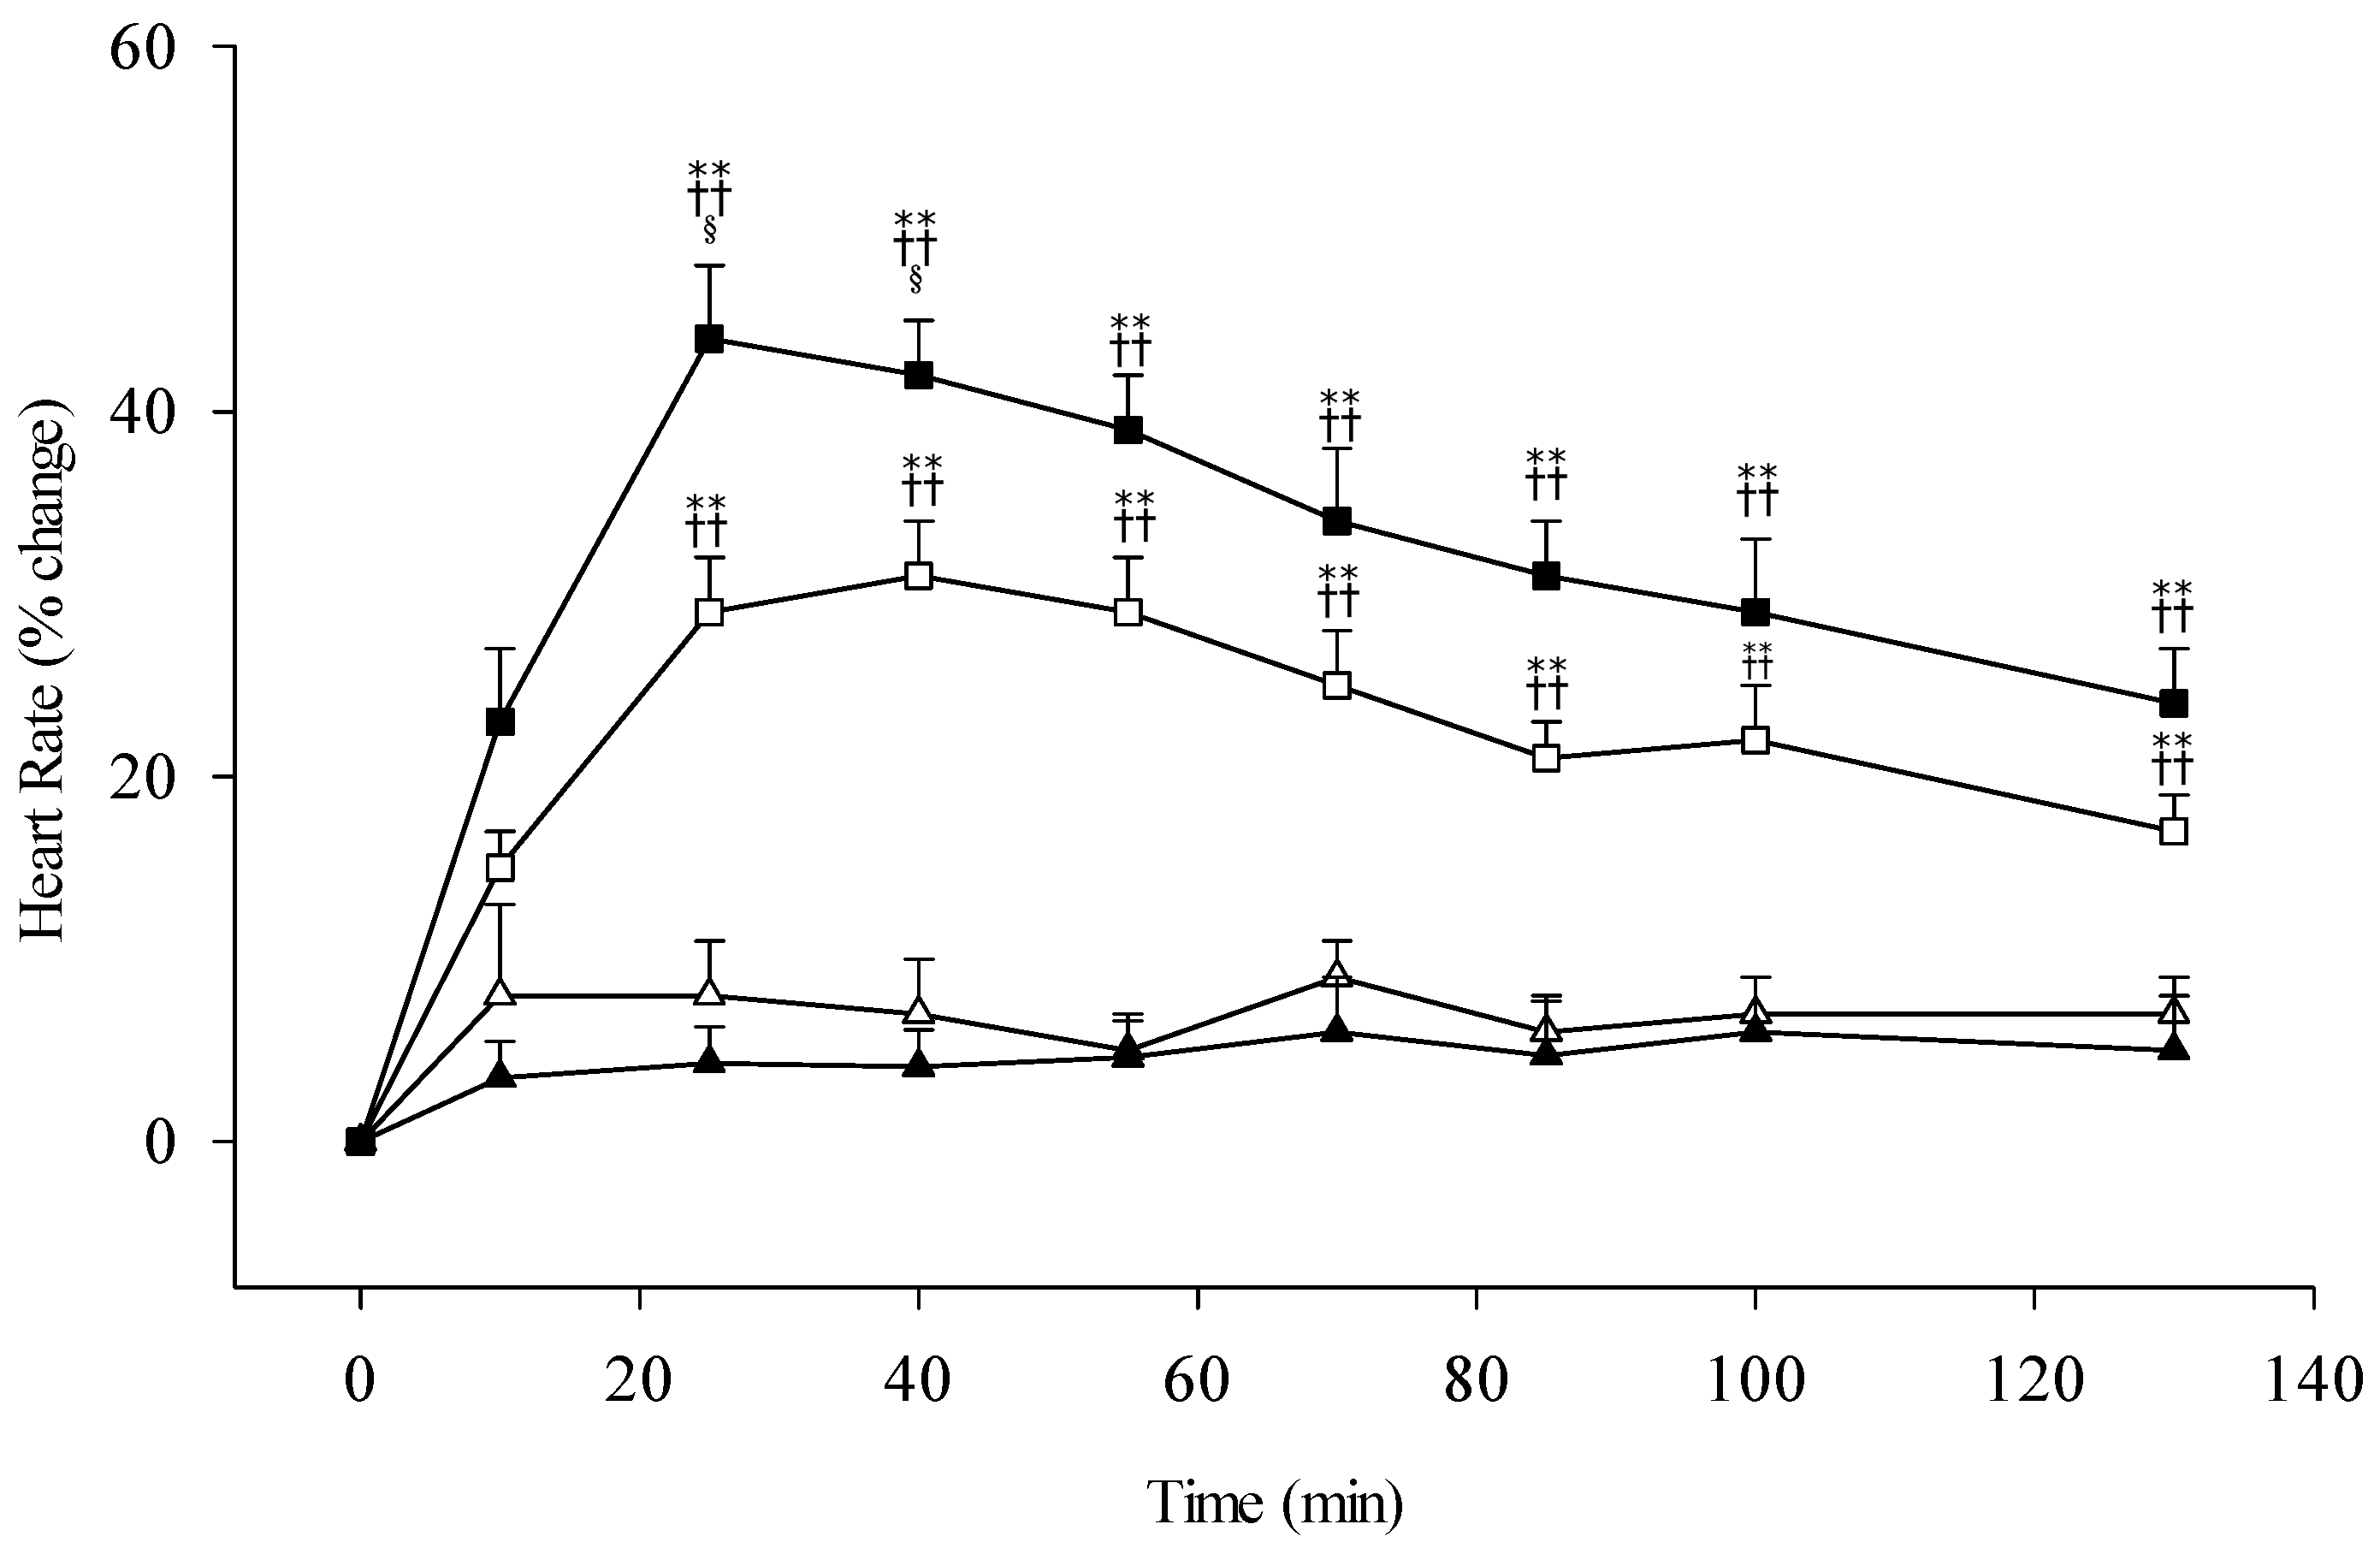
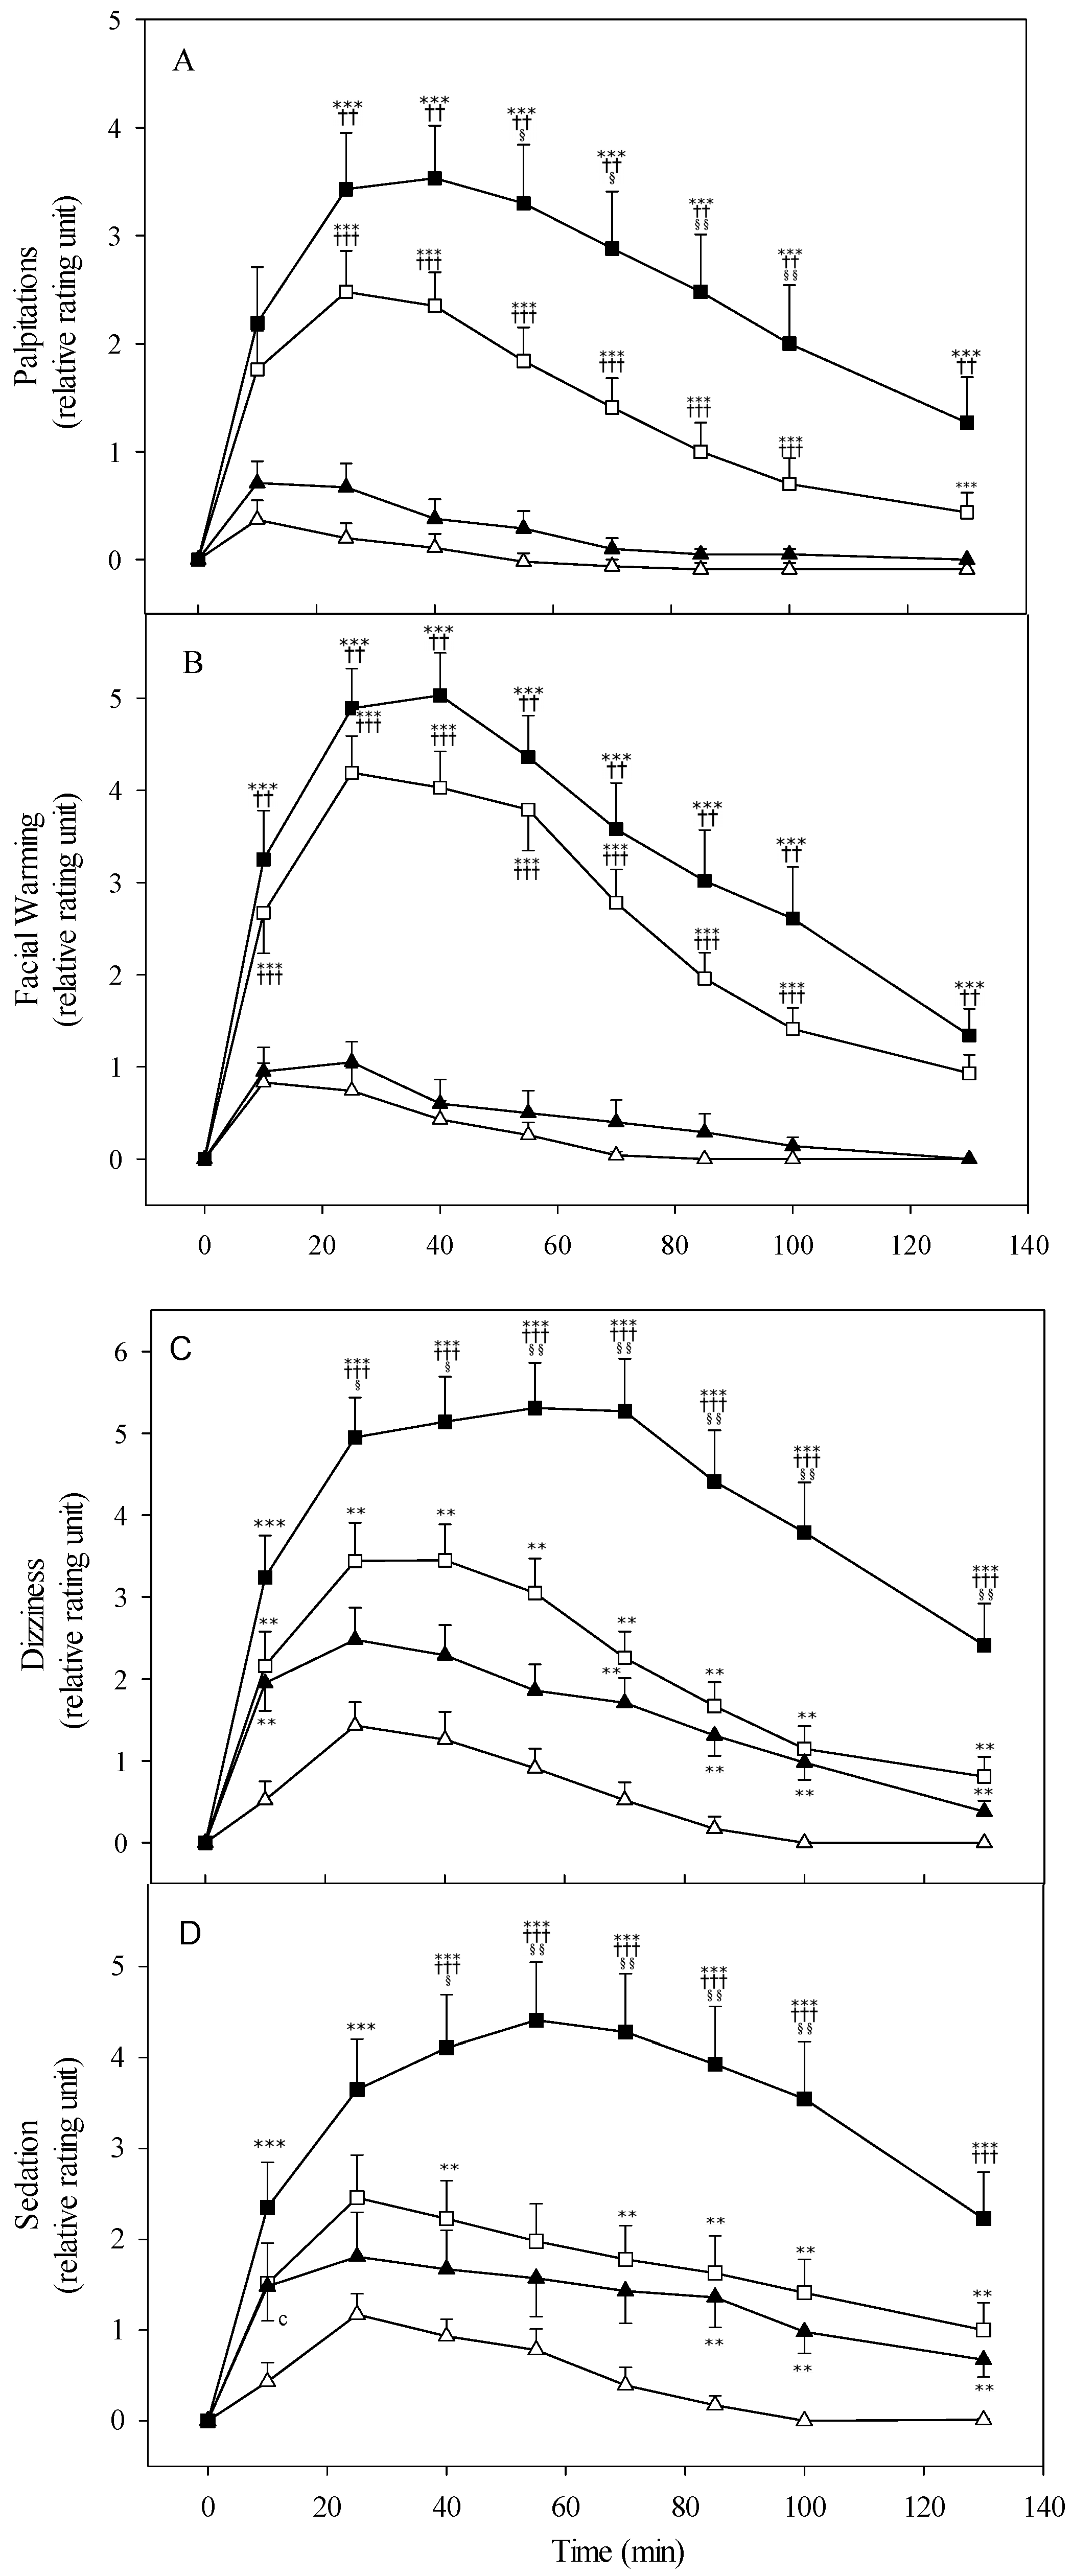
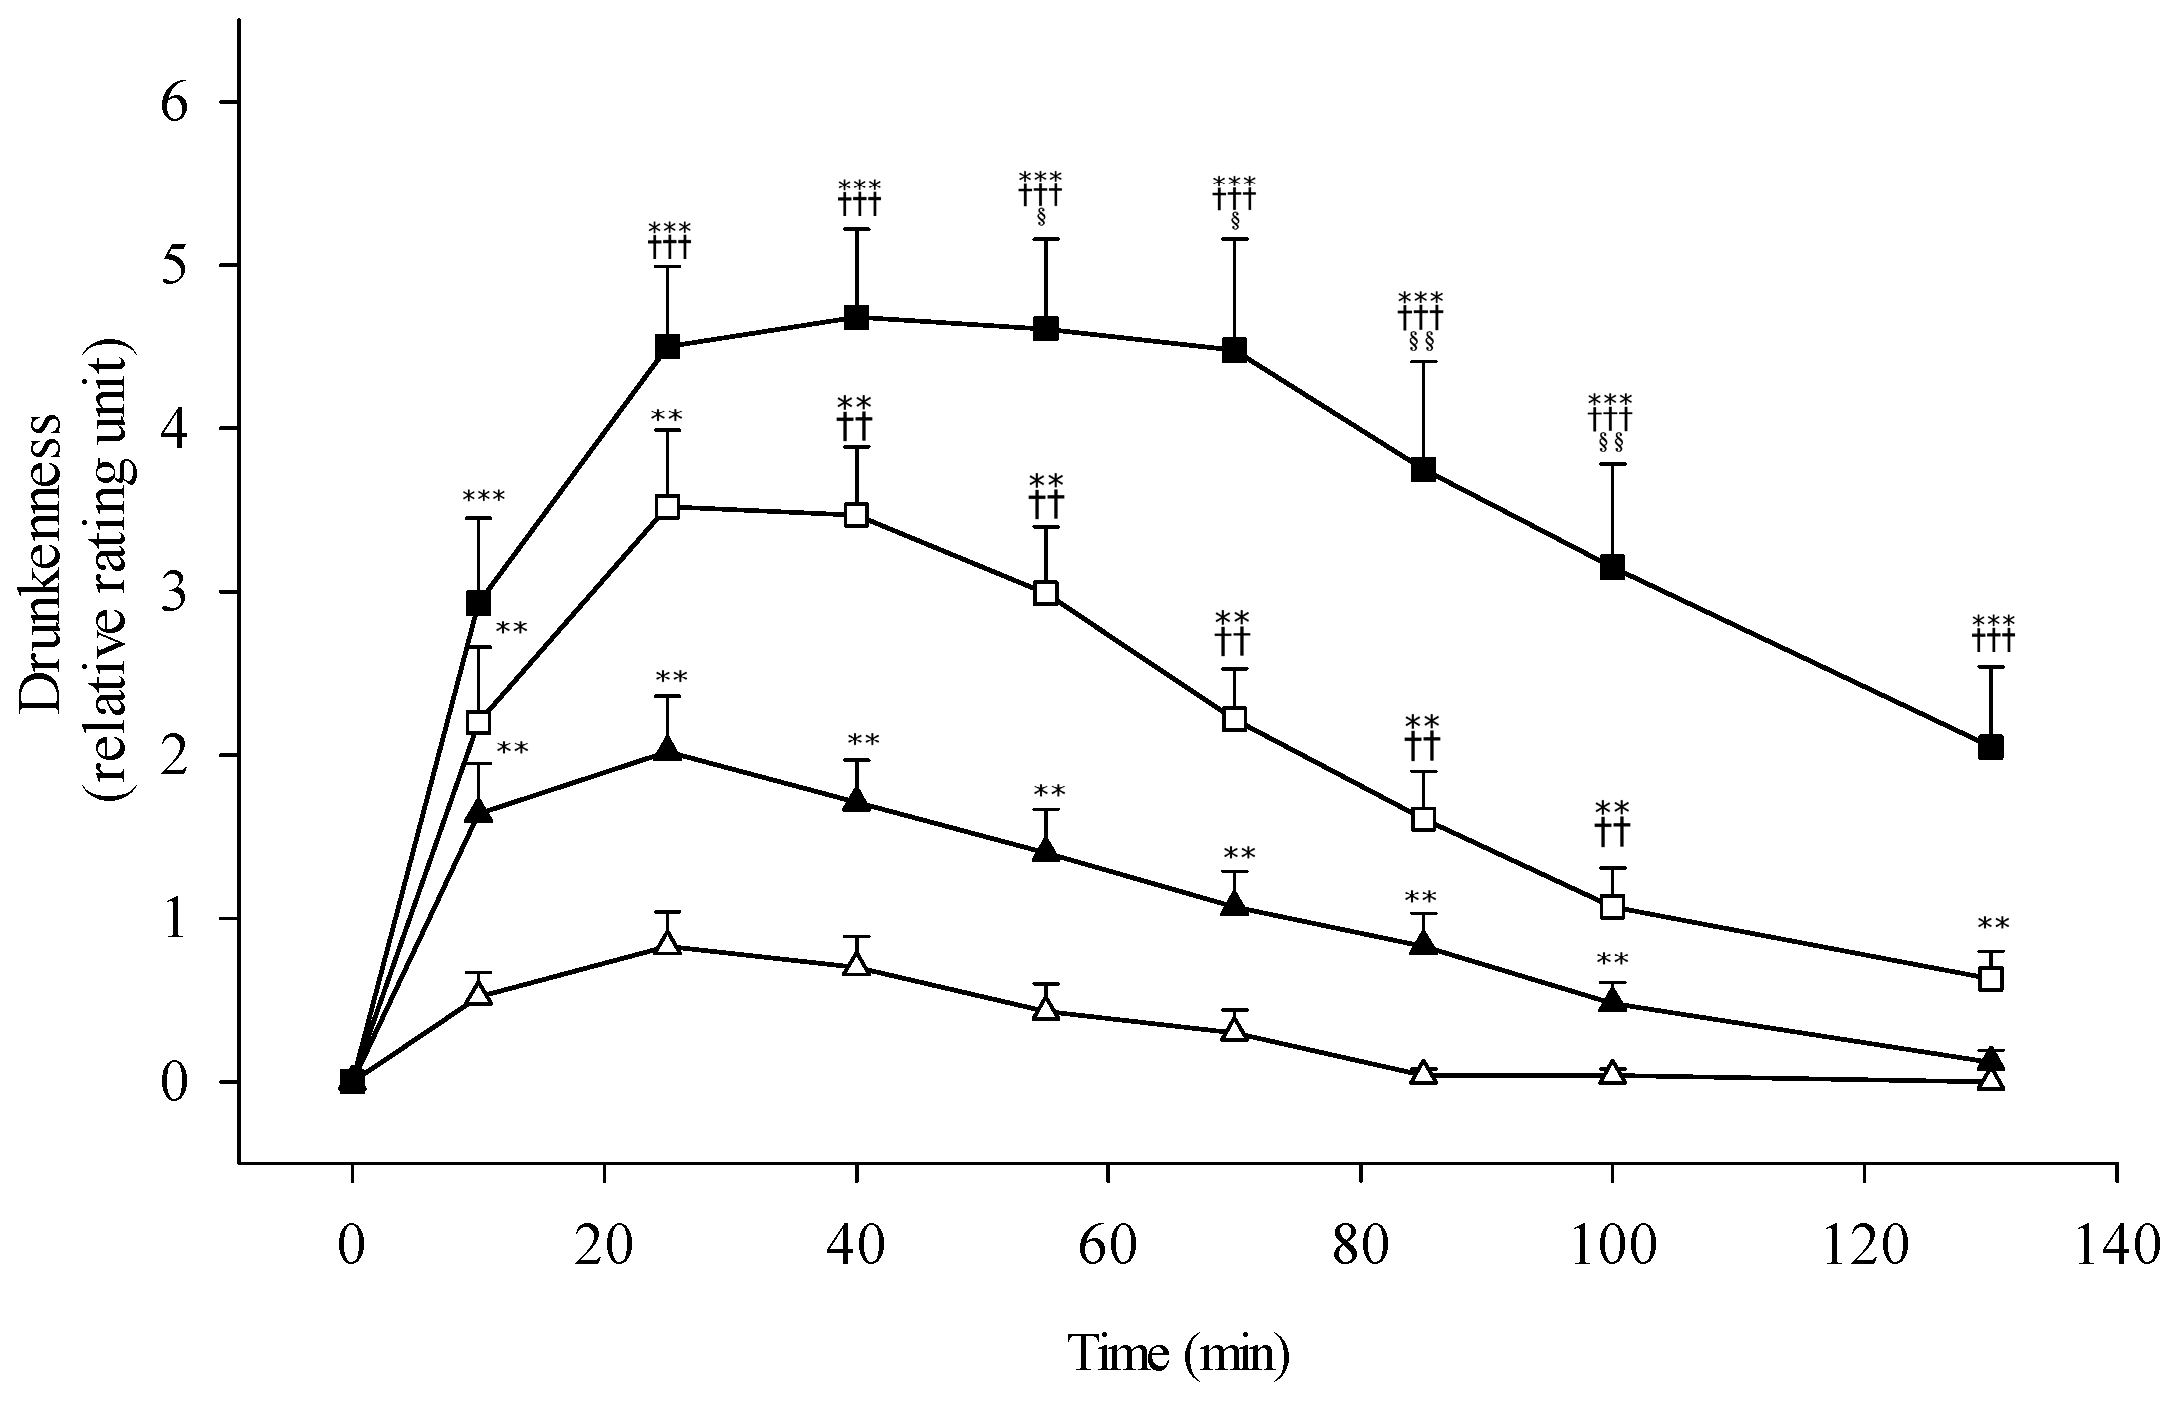
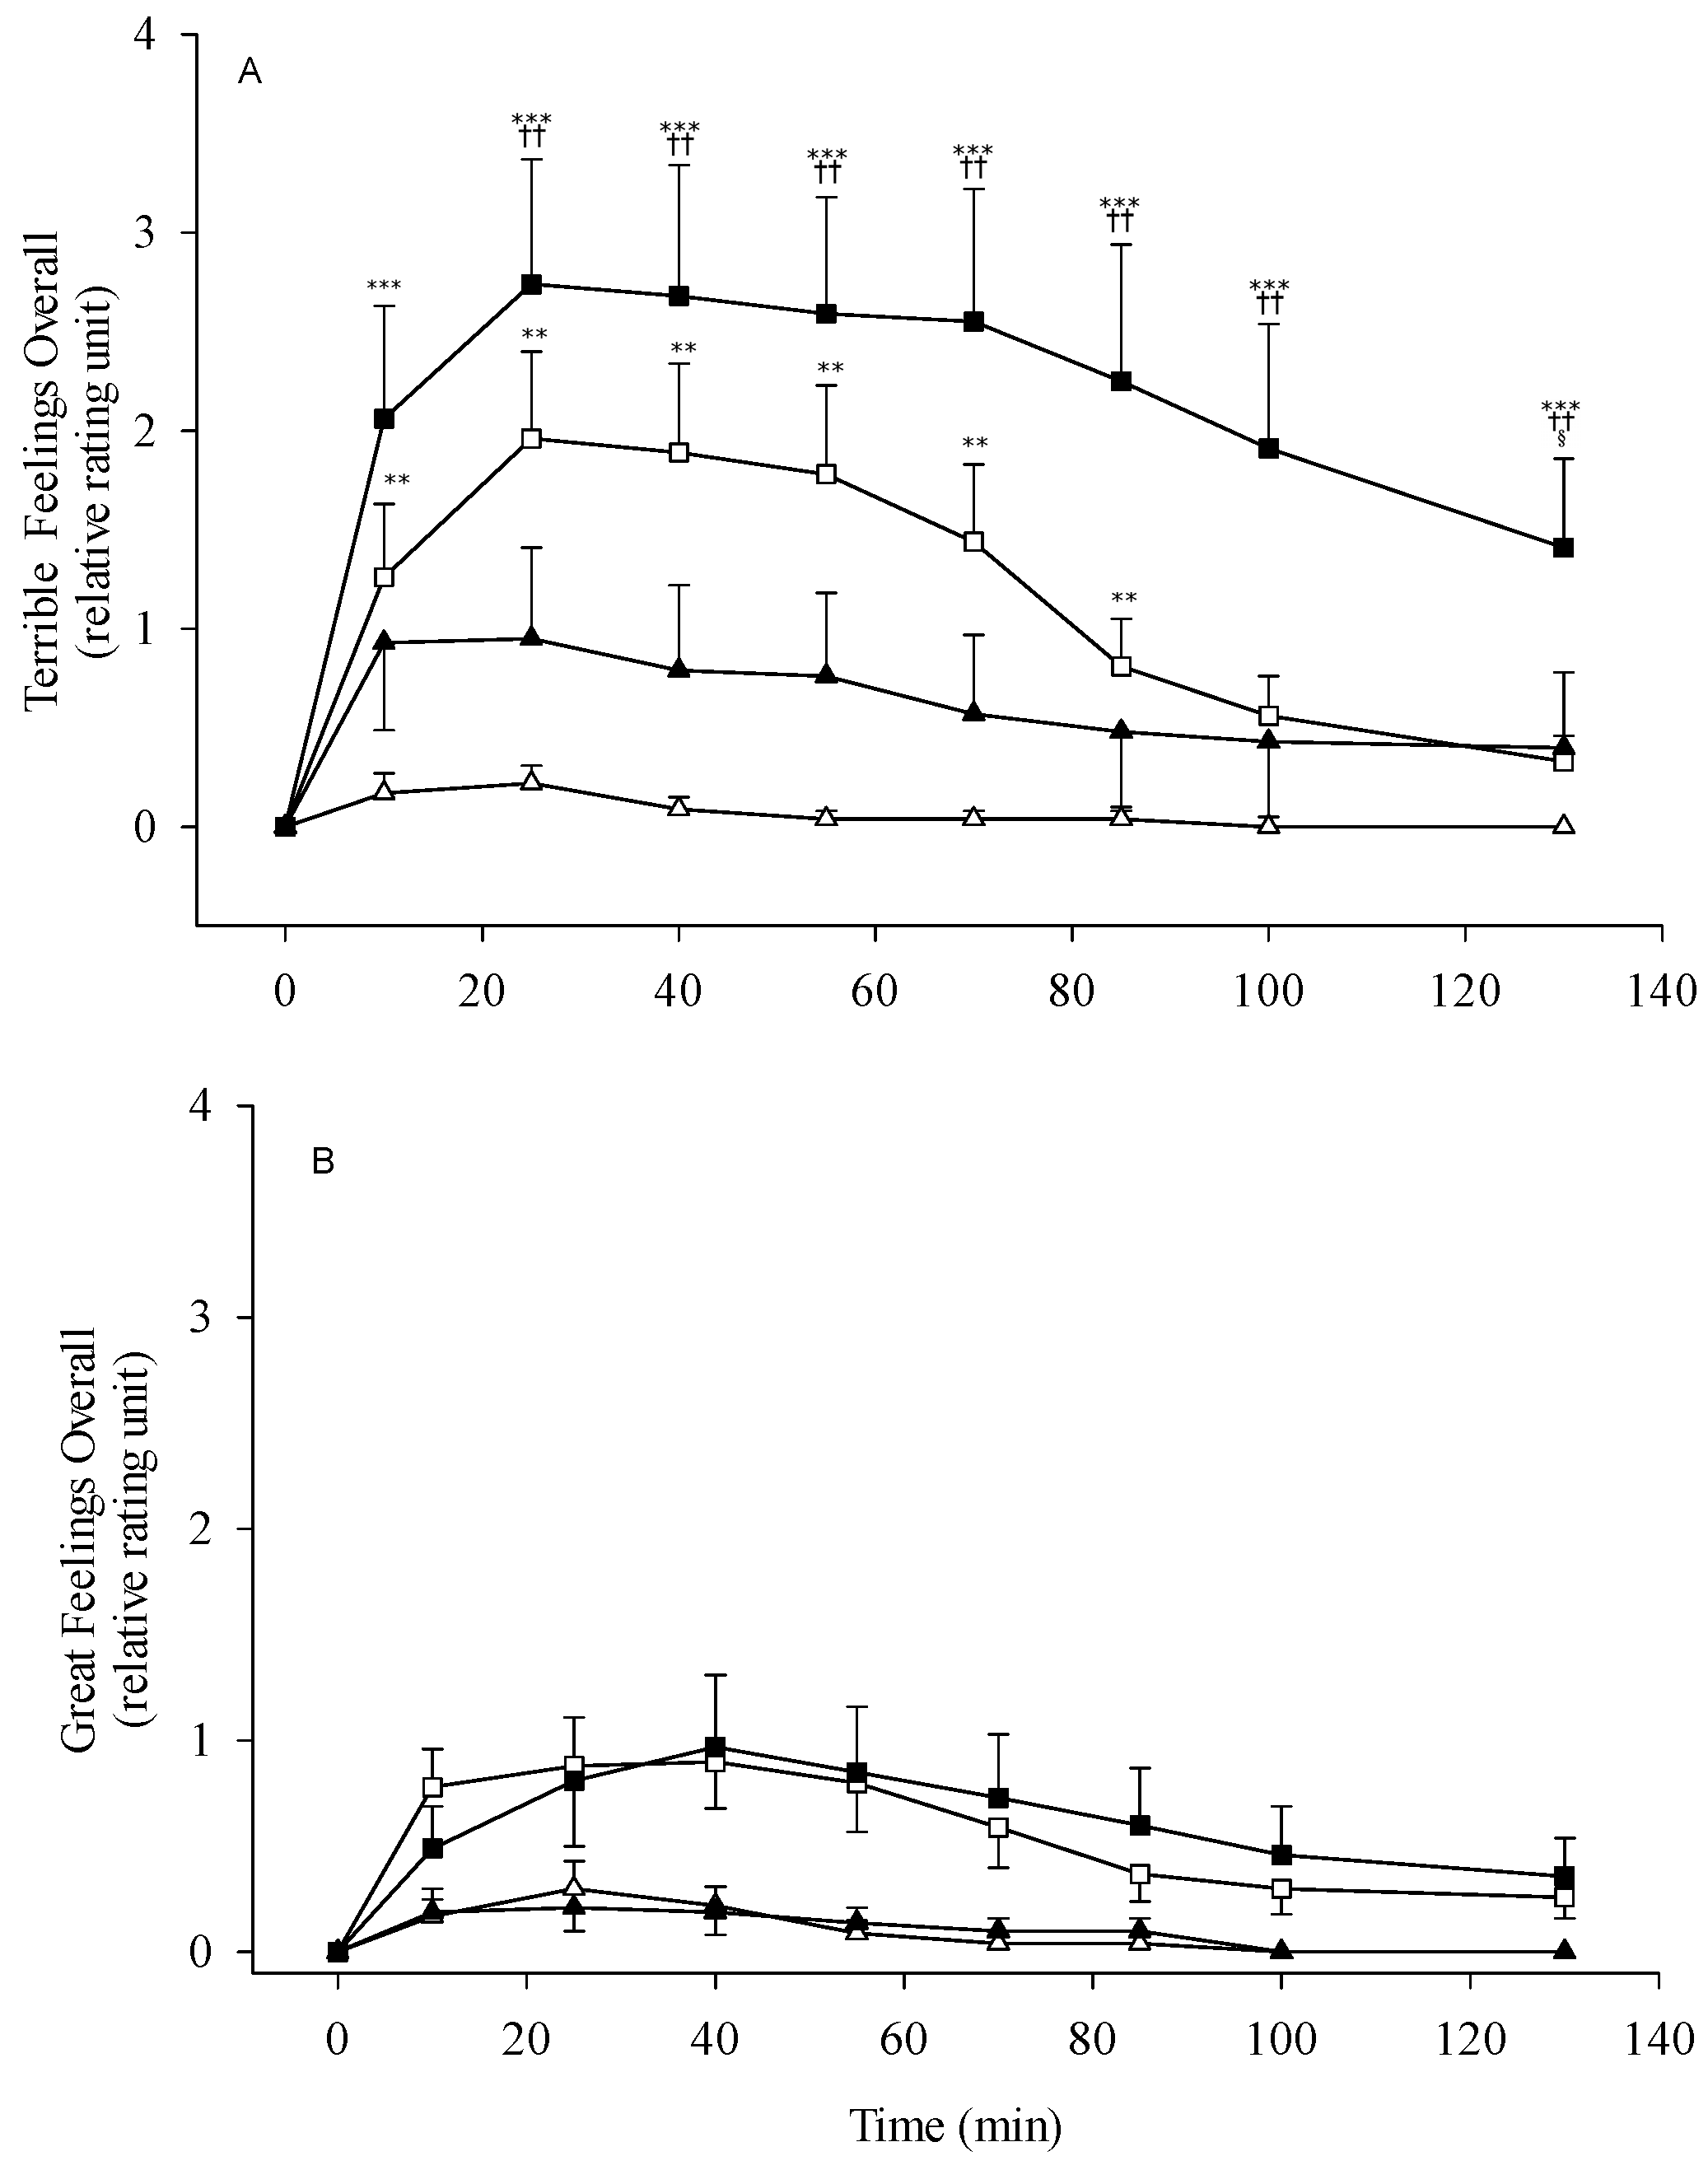
3.3. Alcohol Sensitivity and Subjective Response
4. Discussion
4.1. Pharmacokinetics of Ethanol and Acetaldehyde
4.2. Alcohol Sensitivity and Subjective Perception
4.3. Acetaldehyde and Alcoholism
5. Conclusions
Supplementary Materials
Author Contributions
Funding
Institutional Review Board Statement
Informed Consent Statement
Conflicts of Interest
References
- Kendler, K.S.; Ohlsson, H.; Sundquist, J.; Sundquist, K. Alcohol Use Disorder and Mortality Across the Lifespan: A Longitudinal Cohort and Co-relative Analysis. JAMA Psychiatry 2016, 73, 575–581. [Google Scholar] [CrossRef] [Green Version]
- Westman, J.; Wahlbeck, K.; Laursen, T.M.; Gissler, M.; Nordentoft, M.; Hallgren, J.; Arffman, M.; Osby, U. Mortality and life expectancy of people with alcohol use disorder in Denmark, Finland and Sweden. Acta Psychiatr. Scand. 2015, 131, 297–306. [Google Scholar] [CrossRef] [PubMed]
- Crabb, D.W.; Edenberg, H.J.; Bosron, W.F.; Li, T.-K. Genotypes for aldehyde dehydrogenase deficiency and alcohol sensitivity. The inactive ALDH2 (2) allele is dominant. J. Clin. Investig. 1989, 83, 314–316. [Google Scholar] [CrossRef] [PubMed] [Green Version]
- Yin, S.-J. Alcohol dehydrogenase: Enzymology and metabolism. Alcohol Alcohol. (Oxf. Oxfs.) Suppl. 1994, 2, 113–119. [Google Scholar]
- Li, T.-K. Pharmacogenetics of responses to alcohol and genes that influence alcohol drinking. J. Stud. Alcohol 2000, 61, 5–12. [Google Scholar] [CrossRef] [PubMed]
- Li, T.K.; Yin, S.J.; Crabb, D.W.; O’Connor, S.; Ramchandani, V.A. Genetic and environmental influences on alcohol metabolism in humans. Alcohol. Clin. Exp. Res. 2001, 25, 136–144. [Google Scholar] [CrossRef] [PubMed]
- Yin, S.-J.; Agarwal, D.P. Functional polymorphism of alcohol and aldehyde dehydrogenases: Alcohol metabolism, alcoholism, and alcohol-induced organ damage. In Alcohol in Health and Disease; Agarwal, D.P., Seitz, H.K., Eds.; Marcel Dekker: New York, NY, USA, 2001; pp. 1–26. [Google Scholar]
- Lee, S.L.; Chau, G.Y.; Yao, C.T.; Wu, C.W.; Yin, S.J. Functional assessment of human alcohol dehydrogenase family in ethanol metabolism: Significance of first-pass metabolism. Alcohol. Clin. Exp. Res. 2006, 30, 1132–1142. [Google Scholar] [CrossRef] [PubMed]
- Chen, Y.C.; Peng, G.S.; Wang, M.F.; Tsao, T.P.; Yin, S.J. Polymorphism of ethanol-metabolism genes and alcoholism: Correlation of allelic variations with the pharmacokinetic and pharmacodynamic consequences. Chem. Biol. Interact. 2009, 178, 2–7. [Google Scholar] [CrossRef] [PubMed]
- Edenberg, H.J.; McClintick, J.N. Alcohol Dehydrogenases, Aldehyde Dehydrogenases, and Alcohol Use Disorders: A Critical Review. Alcohol. Clin. Exp. Res. 2018, 42, 2281–2297. [Google Scholar] [CrossRef] [PubMed]
- Agarwal, D.P.; Goedde, H.W. Pharmacogenetics of alcohol metabolism and alcoholism. Pharmacogenetics 1992, 2, 48–62. [Google Scholar] [CrossRef]
- Yoshida, A.; Hsu, L.C.; Yasunami, M. Genetics of human alcohol-metabolizing enzymes. Prog. Nucl. Acid Res. Mol. Biol. 1991, 40, 255–287. [Google Scholar]
- Smith, M. Genetics of human alcohol and aldehyde dehydrogenases. In Advances in Human Genetics 15; Harris, H., Hirschhorn, K., Eds.; Springer: Boston, MA, USA, 1986; pp. 249–290. [Google Scholar]
- Yin, S.J.; Peng, G.S. Overview of ALDH polymorphism: Relation to cardiovascular effects of alcohol. In Comprehensive Handbook of Alcohol Related Pathology; Preedy, V.R., Watson, R.R., Eds.; Elsevier Science Ltd.: London, UK, 2005; Volume 1, pp. 411–426. [Google Scholar]
- Chen, C.C.; Lu, R.B.; Chen, Y.C.; Wang, M.F.; Chang, Y.C.; Li, T.K.; Yin, S.J. Interaction between the functional polymorphisms of the alcohol-metabolism genes in protection against alcoholism. Am. J. Hum. Genet. 1999, 65, 795–807. [Google Scholar] [CrossRef] [PubMed] [Green Version]
- Higuchi, S.; Matsushita, S.; Murayama, M.; Takagi, S.; Hayashida, M. Alcohol and aldehyde dehydrogenase polymorphisms and the risk for alcoholism. Am. J. Psychiatry 1995, 152, 1219–1221. [Google Scholar] [PubMed]
- Shen, Y.C.; Fan, J.H.; Edenberg, H.J.; Li, T.K.; Cui, Y.H.; Wang, Y.F.; Tian, C.H.; Zhou, C.F.; Zhou, R.L.; Wang, J.; et al. Polymorphism of ADH and ALDH genes among four ethnic groups in China and effects upon the risk for alcoholism. Alcohol. Clin. Exp. Res. 1997, 21, 1272–1277. [Google Scholar] [CrossRef] [PubMed]
- Kim, D.J.; Choi, I.G.; Park, B.L.; Lee, B.C.; Ham, B.J.; Yoon, S.; Bae, J.S.; Cheong, H.S.; Shin, H.D. Major genetic components underlying alcoholism in Korean population. Hum. Mol. Genet. 2008, 17, 854–858. [Google Scholar] [CrossRef] [PubMed] [Green Version]
- Zhou, H.; Sealock, J.M.; Sanchez-Roige, S.; Clarke, T.K.; Levey, D.F.; Cheng, Z.; Li, B.; Polimanti, R.; Kember, R.L.; Smith, R.V.; et al. Genome-wide meta-analysis of problematic alcohol use in 435,563 individuals yields insights into biology and relationships with other traits. Nat. Neurosci. 2020, 23, 809–818. [Google Scholar] [CrossRef]
- Chen, Y.C.; Lu, R.B.; Peng, G.S.; Wang, M.F.; Wang, H.K.; Ko, H.C.; Chang, Y.C.; Lu, J.J.; Li, T.K.; Yin, S.J. Alcohol metabolism and cardiovascular response in an alcoholic patient homozygous for the ALDH2*2 variant gene allele. Alcohol. Clin. Exp. Res. 1999, 23, 1853–1860. [Google Scholar] [CrossRef] [PubMed]
- Peng, G.S.; Chen, Y.C.; Wang, M.F.; Lai, C.L.; Yin, S.J. ALDH2*2 but not ADH1B*2 is a causative variant gene allele for Asian alcohol flushing after a low-dose challenge: Correlation of the pharmacokinetic and pharmacodynamic findings. Pharmacogenet. Genom. 2014, 24, 607–617. [Google Scholar] [CrossRef] [PubMed]
- Harada, S.; Agarwal, D.; Goedde, H. Aldehyde dehydrogenase polymorphism and alcohol metabolism in alcoholics. Alcohol 1985, 2, 391–392. [Google Scholar] [CrossRef]
- Mizoi, Y.; Ijiri, I.; Tatsuno, Y.; Kijima, T.; Fujiwara, S.; Adachi, J.; Hishida, S. Relationship between facial flushing and blood acetaldehyde levels after alcohol intake. Pharmacol. Biochem. Behav. 1979, 10, 303–311. [Google Scholar] [CrossRef]
- Chen, Y.C.; Peng, G.S.; Tsao, T.P.; Wang, M.F.; Lu, R.B.; Yin, S.J. Pharmacokinetic and pharmacodynamic basis for overcoming acetaldehyde-induced adverse reaction in Asian alcoholics, heterozygous for the variant ALDH2*2 gene allele. Pharmacogenet. Genom. 2009, 19, 588–599. [Google Scholar] [CrossRef]
- Sellers, E.M.; Naranjo, C.A.; Peachey, J.E. Drugs to decrease alcohol consumption. N. Engl. J. Med. 1981, 305, 1255–1262. [Google Scholar] [PubMed]
- Arolfo, M.P.; Overstreet, D.H.; Yao, L.; Fan, P.; Lawrence, A.J.; Tao, G.; Keung, W.M.; Vallee, B.L.; Olive, M.F.; Gass, J.T.; et al. Suppression of heavy drinking and alcohol seeking by a selective ALDH-2 inhibitor. Alcohol. Clin. Exp. Res. 2009, 33, 1935–1944. [Google Scholar] [CrossRef] [PubMed]
- Li, T.K. From herbal roots to synthetic medicines: A historical perspective. Alcohol. Clin. Exp. Res. 2010, 34, 1–3. [Google Scholar] [CrossRef] [PubMed]
- Yokoyama, A.; Muramatsu, T.; Omori, T.; Yokoyama, T.; Matsushita, S.; Higuchi, S.; Maruyama, K.; Ishii, H. Alcohol and aldehyde dehydrogenase gene polymorphisms and oropharyngolaryngeal, esophageal and stomach cancers in Japanese alcoholics. Carcinogenesis 2001, 22, 433–439. [Google Scholar] [CrossRef]
- Chen, Z.; Zhang, J.; Stamler, J.S. Identification of the enzymatic mechanism of nitroglycerin bioactivation. Proc. Natl. Acad. Sci. USA 2002, 99, 8306–8311. [Google Scholar] [CrossRef] [PubMed] [Green Version]
- Li, Y.; Zhang, D.; Jin, W.; Shao, C.; Yan, P.; Xu, C.; Sheng, H.; Liu, Y.; Yu, J.; Xie, Y.; et al. Mitochondrial aldehyde dehydrogenase-2 (ALDH2) Glu504Lys polymorphism contributes to the variation in efficacy of sublingual nitroglycerin. J. Clin. Investig. 2006, 116, 506–511. [Google Scholar] [CrossRef] [PubMed] [Green Version]
- Chen, C.H.; Budas, G.R.; Churchill, E.N.; Disatnik, M.H.; Hurley, T.D.; Mochly-Rosen, D. Activation of aldehyde dehydrogenase-2 reduces ischemic damage to the heart. Science 2008, 321, 1493–1495. [Google Scholar] [CrossRef] [PubMed] [Green Version]
- Schuckit, M.A. A Critical Review of Methods and Results in the Search for Genetic Contributors to Alcohol Sensitivity. Alcohol. Clin. Exp. Res. 2018, 42, 822–835. [Google Scholar] [CrossRef] [PubMed]
- Cloninger, C.R. Neurogenetic adaptive mechanisms in alcoholism. Science 1987, 236, 410–416. [Google Scholar] [CrossRef] [PubMed] [Green Version]
- Kerfoot, K.; Pittman, B.; Ralevski, E.; Limoncelli, D.; Koretski, J.; Newcomb, J.; Arias, A.J.; Petrakis, I.L. Effects of family history of alcohol dependence on the subjective response to alcohol using the intravenous alcohol clamp. Alcohol. Clin. Exp. Res. 2013, 37, 2011–2018. [Google Scholar] [CrossRef] [PubMed]
- Edwards, A.C.; Deak, J.D.; Gizer, I.R.; Lai, D.; Chatzinakos, C.; Wilhelmsen, K.P.; Lindsay, J.; Heron, J.; Hickman, M.; Webb, B.T.; et al. Meta-Analysis of Genetic Influences on Initial Alcohol Sensitivity. Alcohol. Clin. Exp. Res. 2018, 42, 2349–2359. [Google Scholar] [CrossRef] [PubMed] [Green Version]
- Lo, C.L.; Lossie, A.C.; Liang, T.; Liu, Y.; Xuei, X.; Lumeng, L.; Zhou, F.C.; Muir, W.M. High Resolution Genomic Scans Reveal Genetic Architecture Controlling Alcohol Preference in Bidirectionally Selected Rat Model. PLoS Genet. 2016, 12, e1006178. [Google Scholar] [CrossRef] [PubMed]
- Schuckit, M.A. Subjective responses to alcohol in sons of alcoholics and control subjects. Arch. Gen. Psychiatry 1984, 41, 879–884. [Google Scholar] [CrossRef] [PubMed]
- Peng, G.S.; Chen, Y.C.; Tsao, T.P.; Wang, M.F.; Yin, S.J. Pharmacokinetic and pharmacodynamic basis for partial protection against alcoholism in Asians, heterozygous for the variant ALDH2*2 gene allele. Pharmacogenet. Genom. 2007, 17, 845–855. [Google Scholar] [CrossRef] [PubMed]
- Peng, G.S.; Wang, M.F.; Chen, C.Y.; Luu, S.U.; Chou, H.C.; Li, T.K.; Yin, S.J. Involvement of acetaldehyde for full protection against alcoholism by homozygosity of the variant allele of mitochondrial aldehyde dehydrogenase gene in Asians. Pharmacogenetics 1999, 9, 463–476. [Google Scholar] [PubMed]
- Judd, L.L.; Hubbard, B.; Janowsky, D.S.; Huey, L.Y.; Attewell, P.A. The effect of lithium carbonate on affect, mood, and personality of normal subjects. Arch. Gen. Psychiatry 1977, 34, 346–351. [Google Scholar] [CrossRef] [PubMed]
- Martin, C.S.; Earleywine, M.; Musty, R.E.; Perrine, M.; Swift, R.M. Development and validation of the biphasic alcohol effects scale. Alcohol. Clin. Exp. Res. 1993, 17, 140–146. [Google Scholar] [CrossRef] [PubMed]
- Maisto, S.A.; Connors, G.J.; Tucker, J.A.; McCollam, J.B.; Adesso, V.J. Validation of the Sensation Scale, a measure of subjective physiological responses to alcohol. Behav. Res. Ther. 1980, 18, 37–43. [Google Scholar] [CrossRef]
- Schuckit, M.A.; Smith, T.L.; Tipp, J.E. The self-rating of the effects of alcohol (SRE) form as a retrospective measure of the risk for alcholism. Addiction 1997, 92, 979–988. [Google Scholar] [CrossRef]
- Lai, C.L.; Yao, C.T.; Chau, G.Y.; Yang, L.F.; Kuo, T.Y.; Chiang, C.P.; Yin, S.J. Dominance of the inactive Asian variant over activity and protein contents of mitochondrial aldehyde dehydrogenase 2 in human liver. Alcohol. Clin. Exp. Res. 2014, 38, 44–50. [Google Scholar] [CrossRef] [PubMed]
- Luczak, S.E.; Liang, T.; Wall, T.L. Age of Drinking Initiation as a Risk Factor for Alcohol Use Disorder Symptoms is Moderated by ALDH2*2 and Ethnicity. Alcohol. Clin. Exp. Res. 2017, 41, 1738–1744. [Google Scholar] [CrossRef]
- Higuchi, S.; Matsushita, S.; Muramatsu, T.; Murayama, M.; Hayashida, M. Alcohol and aldehyde dehydrogenase genotypes and drinking behavior in Japanese. Alcohol. Clin. Exp. Res. 1996, 20, 493–497. [Google Scholar] [CrossRef] [PubMed]
- Wall, T.L.; Thomasson, H.R.; Schuckit, M.A.; Ehlers, C.L. Subjective feelings of alcohol intoxication in Asians with genetic variations of ALDH2 alleles. Alcohol. Clin. Exp. Res. 1992, 16, 991–995. [Google Scholar] [CrossRef] [PubMed]
- Hipolito, L.; Sanchez, M.; Polache, A.; Granero, L. Brain metabolism of ethanol and alcoholism: An update. Curr. Drug Metab. 2007, 8, 716–727. [Google Scholar] [CrossRef]
- Quertemont, E.; Grant, K.A.; Correa, M.; Arizzi, M.N.; Salamone, J.D.; Tambour, S.; Aragon, C.M.; McBride, W.J.; Rodd, Z.A.; Goldstein, A. The role of acetaldehyde in the central effects of ethanol. Alcohol. Clin. Exp. Res. 2005, 29, 221–234. [Google Scholar] [CrossRef] [PubMed]
- Eriksson, C.P. The role of acetaldehyde in the actions of alcohol (update 2000). Alcohol. Clin. Exp. Res. 2001, 25, 15S–32S. [Google Scholar] [CrossRef] [PubMed]
- Jin, S.; Cao, Q.; Yang, F.; Zhu, H.; Xu, S.; Chen, Q.; Wang, Z.; Lin, Y.; Cinar, R.; Pawlosky, R.J.; et al. Brain ethanol metabolism by astrocytic ALDH2 drives the behavioural effects of ethanol intoxication. Nat. Metab. 2021, 3, 337–351. [Google Scholar] [CrossRef] [PubMed]

| ADH1B*2/*2–ALDH2*1/*1 | ADH1B*2/*2–ALDH2*1/*2 | ADH1B*1/*1–ALDH2*1/*1 | ||||
|---|---|---|---|---|---|---|
| 0.3 g/kg (n = 23) | 0.5 g/kg (n = 21) | 0.3 g/kg (n = 27) | 0.5 g/kg (n = 22) | 0.3 g/kg (n = 10) | 0.5 g/kg (n = 10) | |
| Age (years) | 22.6 ± 0.7 | 22.5 ± 0.6 | 23.1 ± 0.8 | 23.0 ± 0.8 | 22.9 ± 1.0 | 22.9 ± 1.0 |
| Body weight (kg) | 67.8 ± 7.2 | 68.2 ± 7.3 | 66.4 ± 6.8 | 66.6 ± 6.7 | 62.8 ± 5.6 | 62.8 ± 5.6 |
| Body mass index (kg/m2) | 22.8 ± 2.5 | 22.8 ± 2.5 | 22.0 ± 2.0 | 22.0 ± 2.0 | 21.3 ± 1.8 | 21.3 ± 1.8 |
Publisher’s Note: MDPI stays neutral with regard to jurisdictional claims in published maps and institutional affiliations. |
© 2021 by the authors. Licensee MDPI, Basel, Switzerland. This article is an open access article distributed under the terms and conditions of the Creative Commons Attribution (CC BY) license (https://creativecommons.org/licenses/by/4.0/).
Share and Cite
Chen, Y.-C.; Yang, L.-F.; Lai, C.-L.; Yin, S.-J. Acetaldehyde Enhances Alcohol Sensitivity and Protects against Alcoholism: Evidence from Alcohol Metabolism in Subjects with Variant ALDH2*2 Gene Allele. Biomolecules 2021, 11, 1183. https://doi.org/10.3390/biom11081183
Chen Y-C, Yang L-F, Lai C-L, Yin S-J. Acetaldehyde Enhances Alcohol Sensitivity and Protects against Alcoholism: Evidence from Alcohol Metabolism in Subjects with Variant ALDH2*2 Gene Allele. Biomolecules. 2021; 11(8):1183. https://doi.org/10.3390/biom11081183
Chicago/Turabian StyleChen, Yi-Chyan, Li-Fang Yang, Ching-Long Lai, and Shih-Jiun Yin. 2021. "Acetaldehyde Enhances Alcohol Sensitivity and Protects against Alcoholism: Evidence from Alcohol Metabolism in Subjects with Variant ALDH2*2 Gene Allele" Biomolecules 11, no. 8: 1183. https://doi.org/10.3390/biom11081183
APA StyleChen, Y.-C., Yang, L.-F., Lai, C.-L., & Yin, S.-J. (2021). Acetaldehyde Enhances Alcohol Sensitivity and Protects against Alcoholism: Evidence from Alcohol Metabolism in Subjects with Variant ALDH2*2 Gene Allele. Biomolecules, 11(8), 1183. https://doi.org/10.3390/biom11081183