Abstract
Stark broadening parameters are of interest for many problems in astrophysics and laboratory plasmas investigation. Ar II spectral lines are observed in many kinds of stellar atmospheres such as the atmospheres of B-Type stars and subdwarf B stars. In this work, we present theoretical Stark widths for Ar II spectral lines. We use the impact semiclassical perturbation approach. Our results are compared with the available experimental values. Finally, the importance of the Stark broadening mechanism is studied in atmospheric conditions of subdwarf B stars.
1. Introduction
Argon in different ionization stages is important for modelling and investigating stellar atmospheres. For example, Werner et al. [1] used Ar VII = 1063.55 Å spectral line for abundance determination of argon in the extremely hot helium-rich white dwarf PG . In [2], the discovery of argon in hot evolved stars and white dwarfs has been reported. Rauch et al. [3] have identified Ar VI absorption lines in the spectrum of a hydrogen-rich central star using high-resolution, high signal to noise observations obtained with Far Ultraviolet Spectroscopic Explorer (FUSE) and Space Telescope Imaging Spectrograph (STIS) aboard the Hubble Space Telescope (HST). In [4], the Ar III = 1002.097 Å spectral line has been used in the determination of abundance in hydrogen-rich subdwarf B stars. Ar III spectral lines were also observed by O’Toole and Heber [5] in the spectra of subdwarf B stars. Based on lines of Ar II, Heber and Edelmann [6] have reported abundances of argon in B subdwarfs. Keenan et al. [7] have determined the abundance of argon from stellar absorption lines of Ar II in the optical spectra of main-sequence early-type stars. Recently, Ar II spectral lines were observed by kupfer et al. [8] in extreme helium stars.
Stark broadening is an important broadening mechanism for modelling and investigating stellar atmospheres and for the determination of abundance of chemical elements. For example, the importance of the Stark broadening effect in stellar atmospheres of A and B type stars was studied by Popović et al. [9] and Simić et al. [10]. Based on Si VI lines, Hamdi et al. [11] demonstrated that the Stark broadening mechanism is dominant in broad regions in the studied atmospheres of DO white dwarfs. The influence of Stark broadening in DO white dwarf atmospheres was also studied by Dimitrijević et al. [12] using Xe VIII spectral lines and similar conclusions were found. Hamdi et al. [13] studied the importance of Stark broadening in the atmospheres of subdwarf B stars using Ar III spectral lines. It was demonstrated that this mechanism is important, especially for atmospheres with high values of log g.
In this paper, we have reported Stark widths of 34 spectral lines of Ar II ions belonging to the 3d–4p transition array. Calculations were performed using the semiclassical perturbation approach (SCP) in impact approximation [14,15]. Energy levels and oscillator strengths needed as input parameters for Stark width calculation were calculated using the Hartree–Fock relativistic approach using Cowan code [16]. We use an atomic model including 24 configurations. Our results are compared with the experimental values. In the last section of this paper, we have studied the importance of the Stark broadening mechanism in the atmospheres of subdwarf B Stars. Stark and Doppler widths are compared as a function of the temperature of the atmospheric layers and as a function of optical depth.
2. The Impact Semiclassical Perturbation Method
In the semiclassical perturbation approach, the full width at half maximum (W) can be expressed in terms of the inelastic cross-section and elastic processes as:
where is the density of colliding perturbers, is the Maxwell distribution of the relative atom-perturber velocity , and are the inelastic cross-sections between the initial level i (resp. f the final level) and the perturbing levels (resp. ) of transition. represents the contribution of elastic collisions and includes Feshbach resonances when ion–electron impacts are studied.
The main input data used in the semiclassical perturbation calculation of Stark broadening parameters are energy levels and oscillator strengths. The set of atomic data needed for the semiclassical method is relatively large. In this paper, the set of energy levels and oscillator strengths needed for the SCP calculation of Stark widths is calculated using the multiconfiguration Hartree–Fock method with relativistic correction (HFR) [16]. We use an atomic model including 24 configurations: 3s 3p; 3s 3p ( = 4p, 4f, 5p, 5f, 6p, 6f, 6h, 7p, 7f, 7h) (odd parity) and 3s 3p; 3s 3p ( = 3d, 4s, 4d, 5s, 5d, 5g, 6s, 6d, 6g, 7s, 7d, 7g) (even parity).
In order to introduce a correction to the widths due to the difference between calculated and experimental wavelengths, we have used Equation (8) of Hamdi et al. [17].
3. Stark Widths
Our Stark widths calculated as described above are presented in Table 1 along with the experimental results of [18,19,20,21,22,23]. Table 1 is organized in the following way: In the first five columns of Table 1, we give the transition array, transition, wavelength, electron temperature (T) and electron density (N). In column 6 of Table 1, we show the experimental Stark widths (W). In columns 7 and 8, we present our electron impact Stark widths (W) and ion impact Stark widths (W) calculated using the semiclassical perturbation approach as described in Section 2. Ionic Perturbers are Ar ions. The ratios (W/W) between the experimental and our calculated Stark widths are shown in column 9, where W = W + W is the total width. Finally, in the last two columns, we give the accuracies and the references of the experimental results. For the estimates, we use code letters used by Konjević et al. [24] which indicate the following:

Table 1.
Our electron impact Stark widths (FWHM) (W) and ion impact Stark width (W) calculated using the semiclassical perturbation (SCP) approach in impact approximation [14,15] compared with experimental Stark widths (W). Transitions, wavelengths, electron temperature (T) and electron density (N) are also given. All wavelengths are taken from the NIST database [25].
- A = uncertainties within 15%
- B+ = uncertainties within 23%
- B = uncertainties within 30%
- C+ = uncertainties within 40%
- C = uncertainties within 50%
- D = uncertainties larger than 50%
Generally, for the (P) 3d–(P) 4p transitions, our Stark widths agree well with the experimental results. The difference between our Stark widths and Pellerin et al. [20] ones does not exceed 31% except for two transitions: D–D ( = 3808.57 Å) and P–S ( = 3499.48 Å) for which the differences are 39% and 56% respectively. We note that for the transition D–D ( = 3808.57 Å), the ratio is equal to 0.87 when we compare with Djurović et al. [23]. Our results underestimate the experimental values of Pellerin et al. [20] for four transitions. For the other sixteen transitions, the values of Pellerin et al. [20] are overestimated.
On average, our Stark width agrees with Aparicio et al. [21] and Djurović et al. [23] within 20%. The largest difference found with Djurović et al. [23] is for D–S( = 3499.48 Å) transition for which the ratio is equal 1.42. We note here that the value is measured with an error between 30% and 50%. The values of Aparicio et al. [21] are underestimated for seven transitions and overestimated for the other eighteen transitions.
Our Stark widths are compared with Iglesias et al. [22] for two transitions. Results of Iglesias et al. [22] are given for three values of electron densities: 4.5 × 10 cm, 7.2 × 10 cm and 9.0 × 10 cm. Comparing with Iglesias et al. [22], the average difference is 21% but a large difference is found for the transition D–D ( = 3968.36 Å) for the value measured at 7.20 × 10 cm electron density. In fact, for this value, the ratio is equal to 0.62. On the other hand, for the values measured at 4.5 × 10 cm and 9.0 × 10 cm electron densities, the ratio is equal 0.80.
Our Stark widths are compared with Dzierzega and Musiol [19] for the transition D–D ( = 4013.86 Å). Dzierzega and Musiol [19] have measured Stark widths for different values of temperature and electron densities. All our Stark widths overestimate those of Dzierzega and Musiol [19]. The average ratio is equal to 0.74. Better agreement with Dzierzega and Musiol [19] ( = 0.96) is found for the width measured at the temperature 12,200 K and the electron density 0.74 × 10 cm. The largest disagreement is found for the width measured at the temperature 11,520 K and the electron density 1.79 × 10 cm.
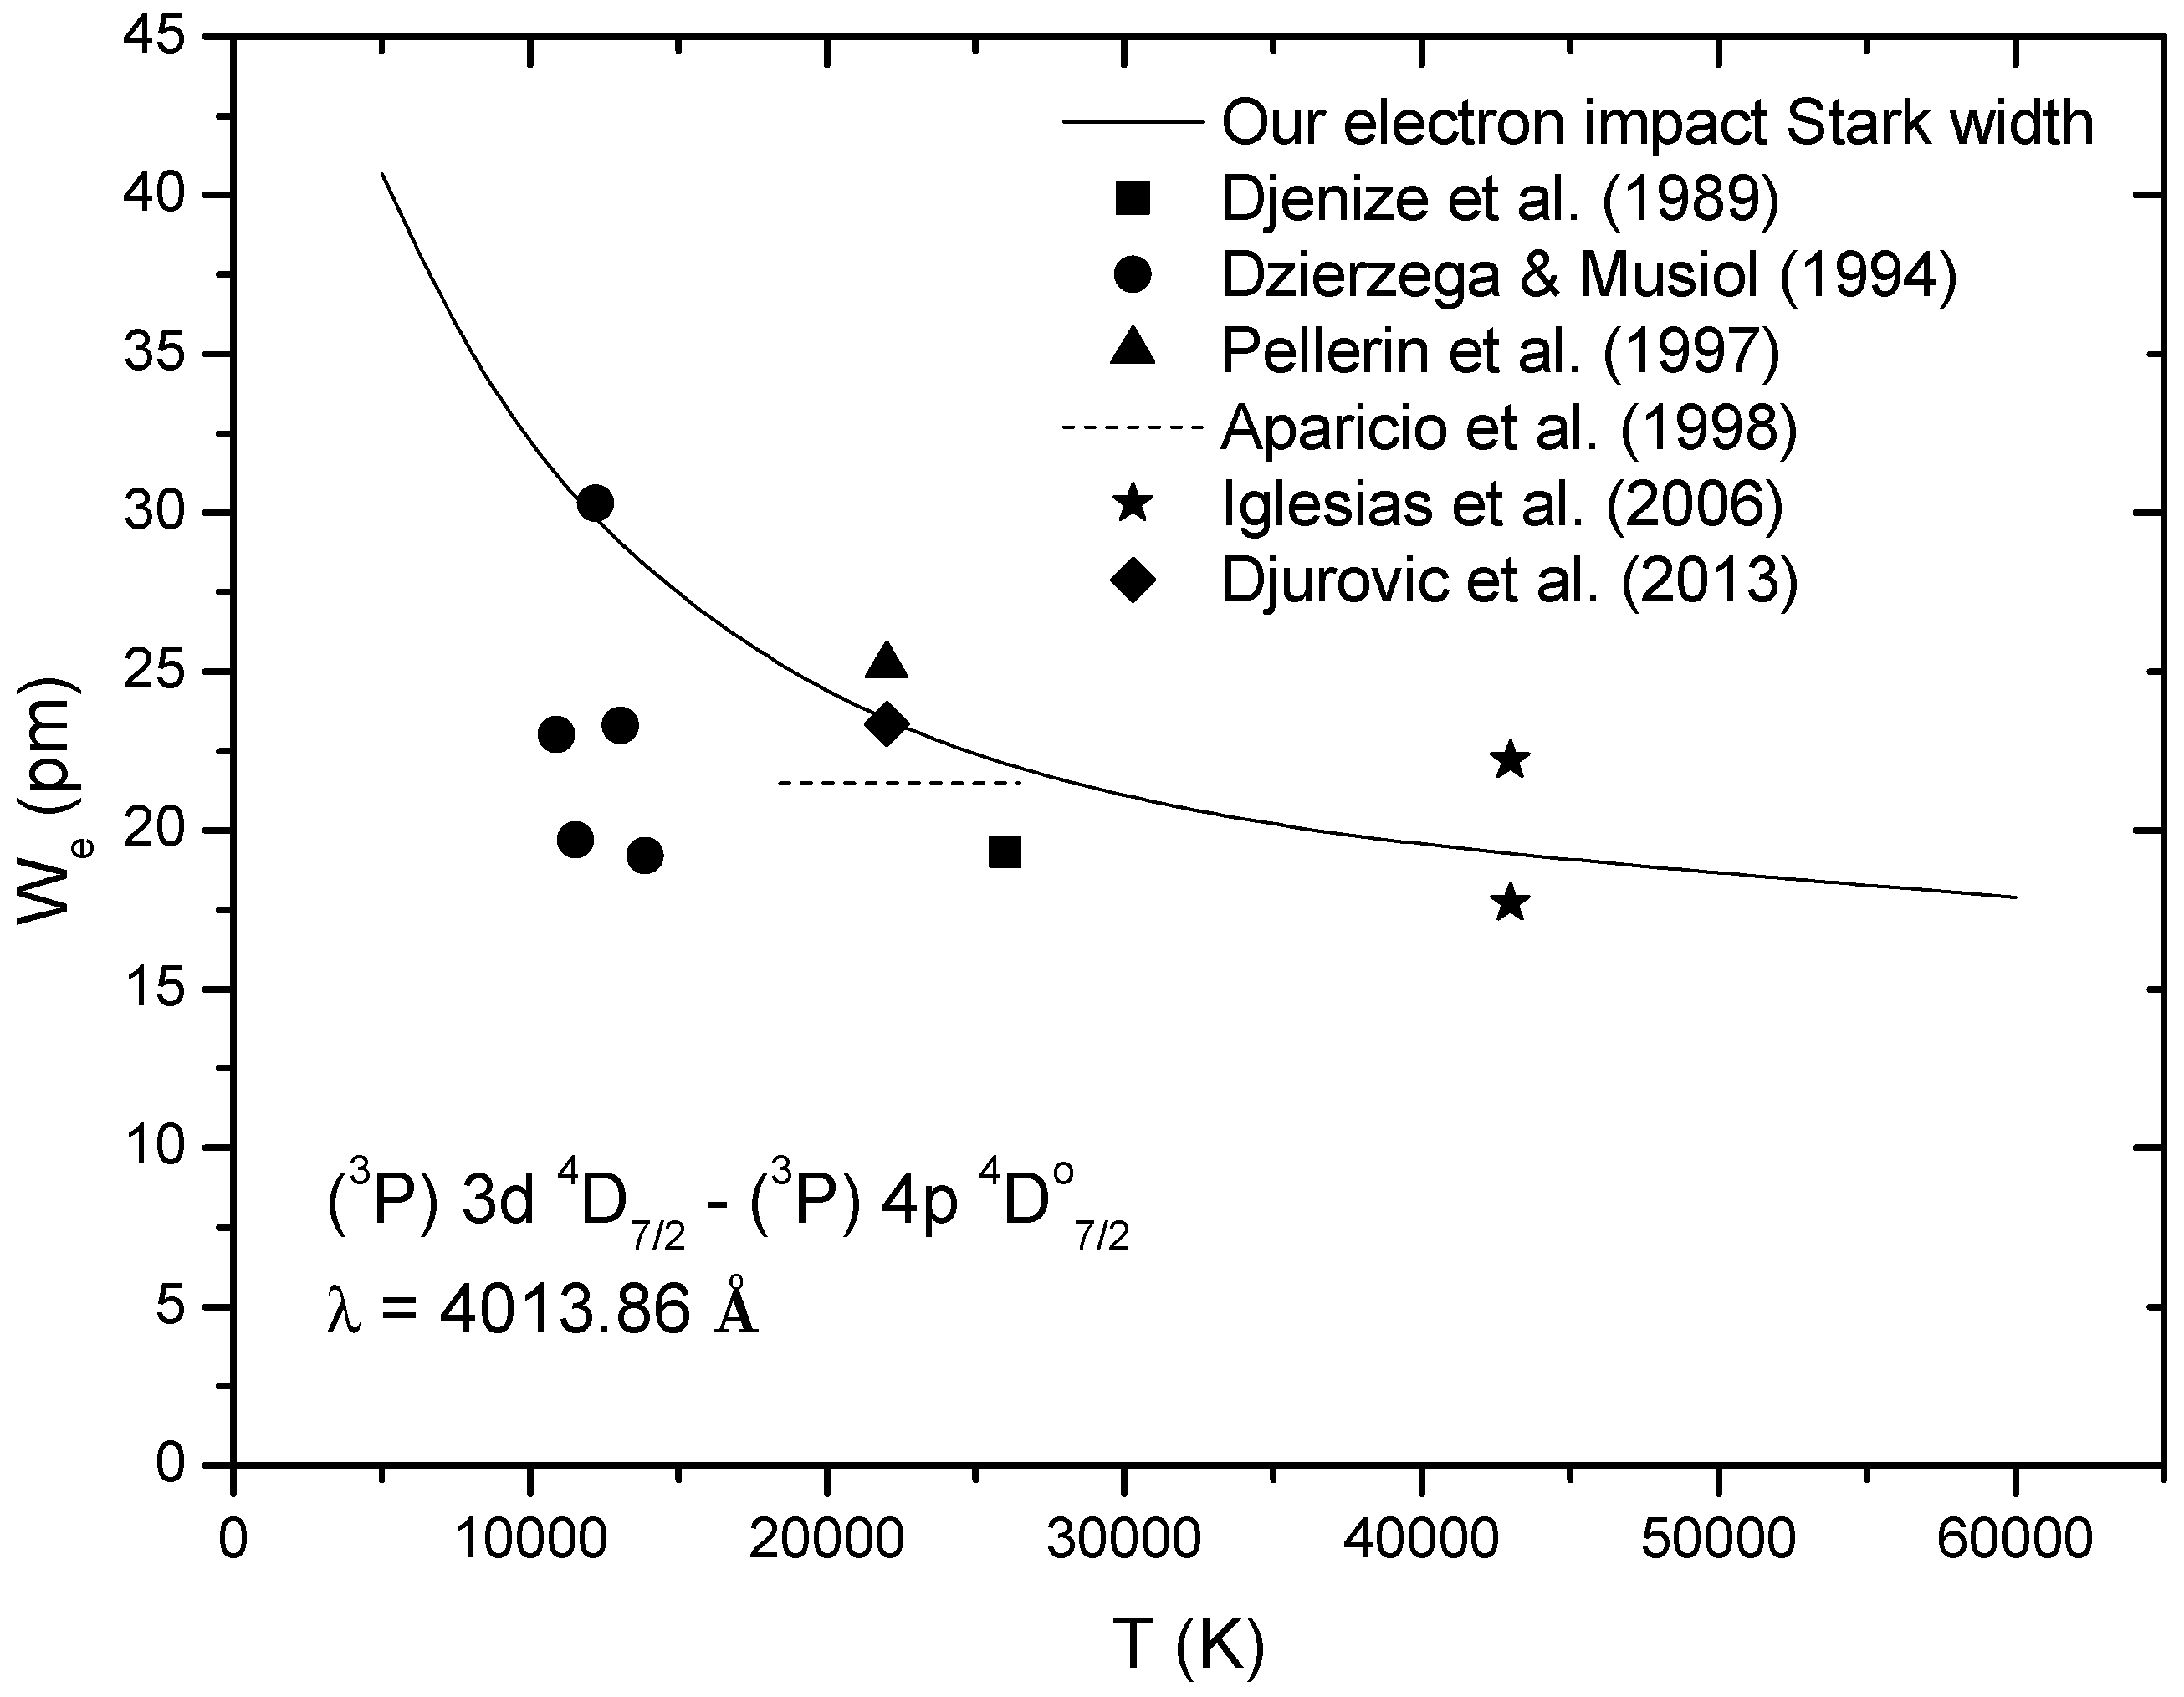
In Figure 1, we present our electron impact Stark width as a function of temperature for the interval from 5000 to 60,000 K along with the experimental values of [18,19,20,21,22,23] for the transition (P) 3d D–(P) 4p D ( = 4013.86 Å). All the experimental results are normalized to an electron density of cm. Figure 1 shows that our Stark widths are close to the experimental results. The closest values to our widths are those of Djurović et al. [23] and of Dzierzega and Musiol [19] measured at the temperature of 12,200 K and the electron density of 0.74 × 10 cm. Figure 1 shows also that our Stark widths overestimate the result of Iglesias et al. [22] measured at the electron density equal to 9.0 × 10 cm and underestimate values of Iglesias et al. [22] measured at the electron densities equal to 4.5 × 10 cm and 7.2 × 10 cm.

Figure 1.
Electron impact Stark width (FWHM) obtained using the semiclassical perturbation approach [14,15] for (P) 3d D–(P) 4p D ( = 4013.86 Å) spectral lines as a function of electron temperature compared with experimental results. Electron density is cm.
4. Stark Broadening Effect in sdB Stars
Subdwarf B stars are low-mass (roughly half a solar mass) helium burning stars with extremely thin hydrogen envelopes. They behave as helium main sequence stars. The sdB stars have a high effective temperature (20,000 K ≤ T ≤ 40,000 K) and gravities (log g ≃ 5–6) (see e.g., [26]). Ar II spectral lines are observed in the atmospheres of sdB stars. For example, Heber and Edelmann [6] have reported abundance of argon in B subdwarfs using Ar II spectral lines.
Beside broadening by collisions with electrons (Stark broadening), Doppler broadening is also important in stellar atmospheres. The intensity distribution function is Lorentzian in the case of Stark broadened lines and Gaussian in the case of Doppler broadened lines. In order to study the importance of Stark broadening in the atmospheric conditions of subdwarf B stars, we have compared Stark and Doppler widths for Ar II (P) 3d D–(P) 4p P ( = 4371.33 Å) spectral lines. We used the atmospheric models of Jeffery et al. [27] which are plane-parallel line-blanketed model atmospheres for hot stars in local thermal, radiative and hydrostatic equilibrium. The considered atmospheres have the following composition: 0.001 helium, 0.99741 hydrogen and 0.00047 carbon and nitrogen.
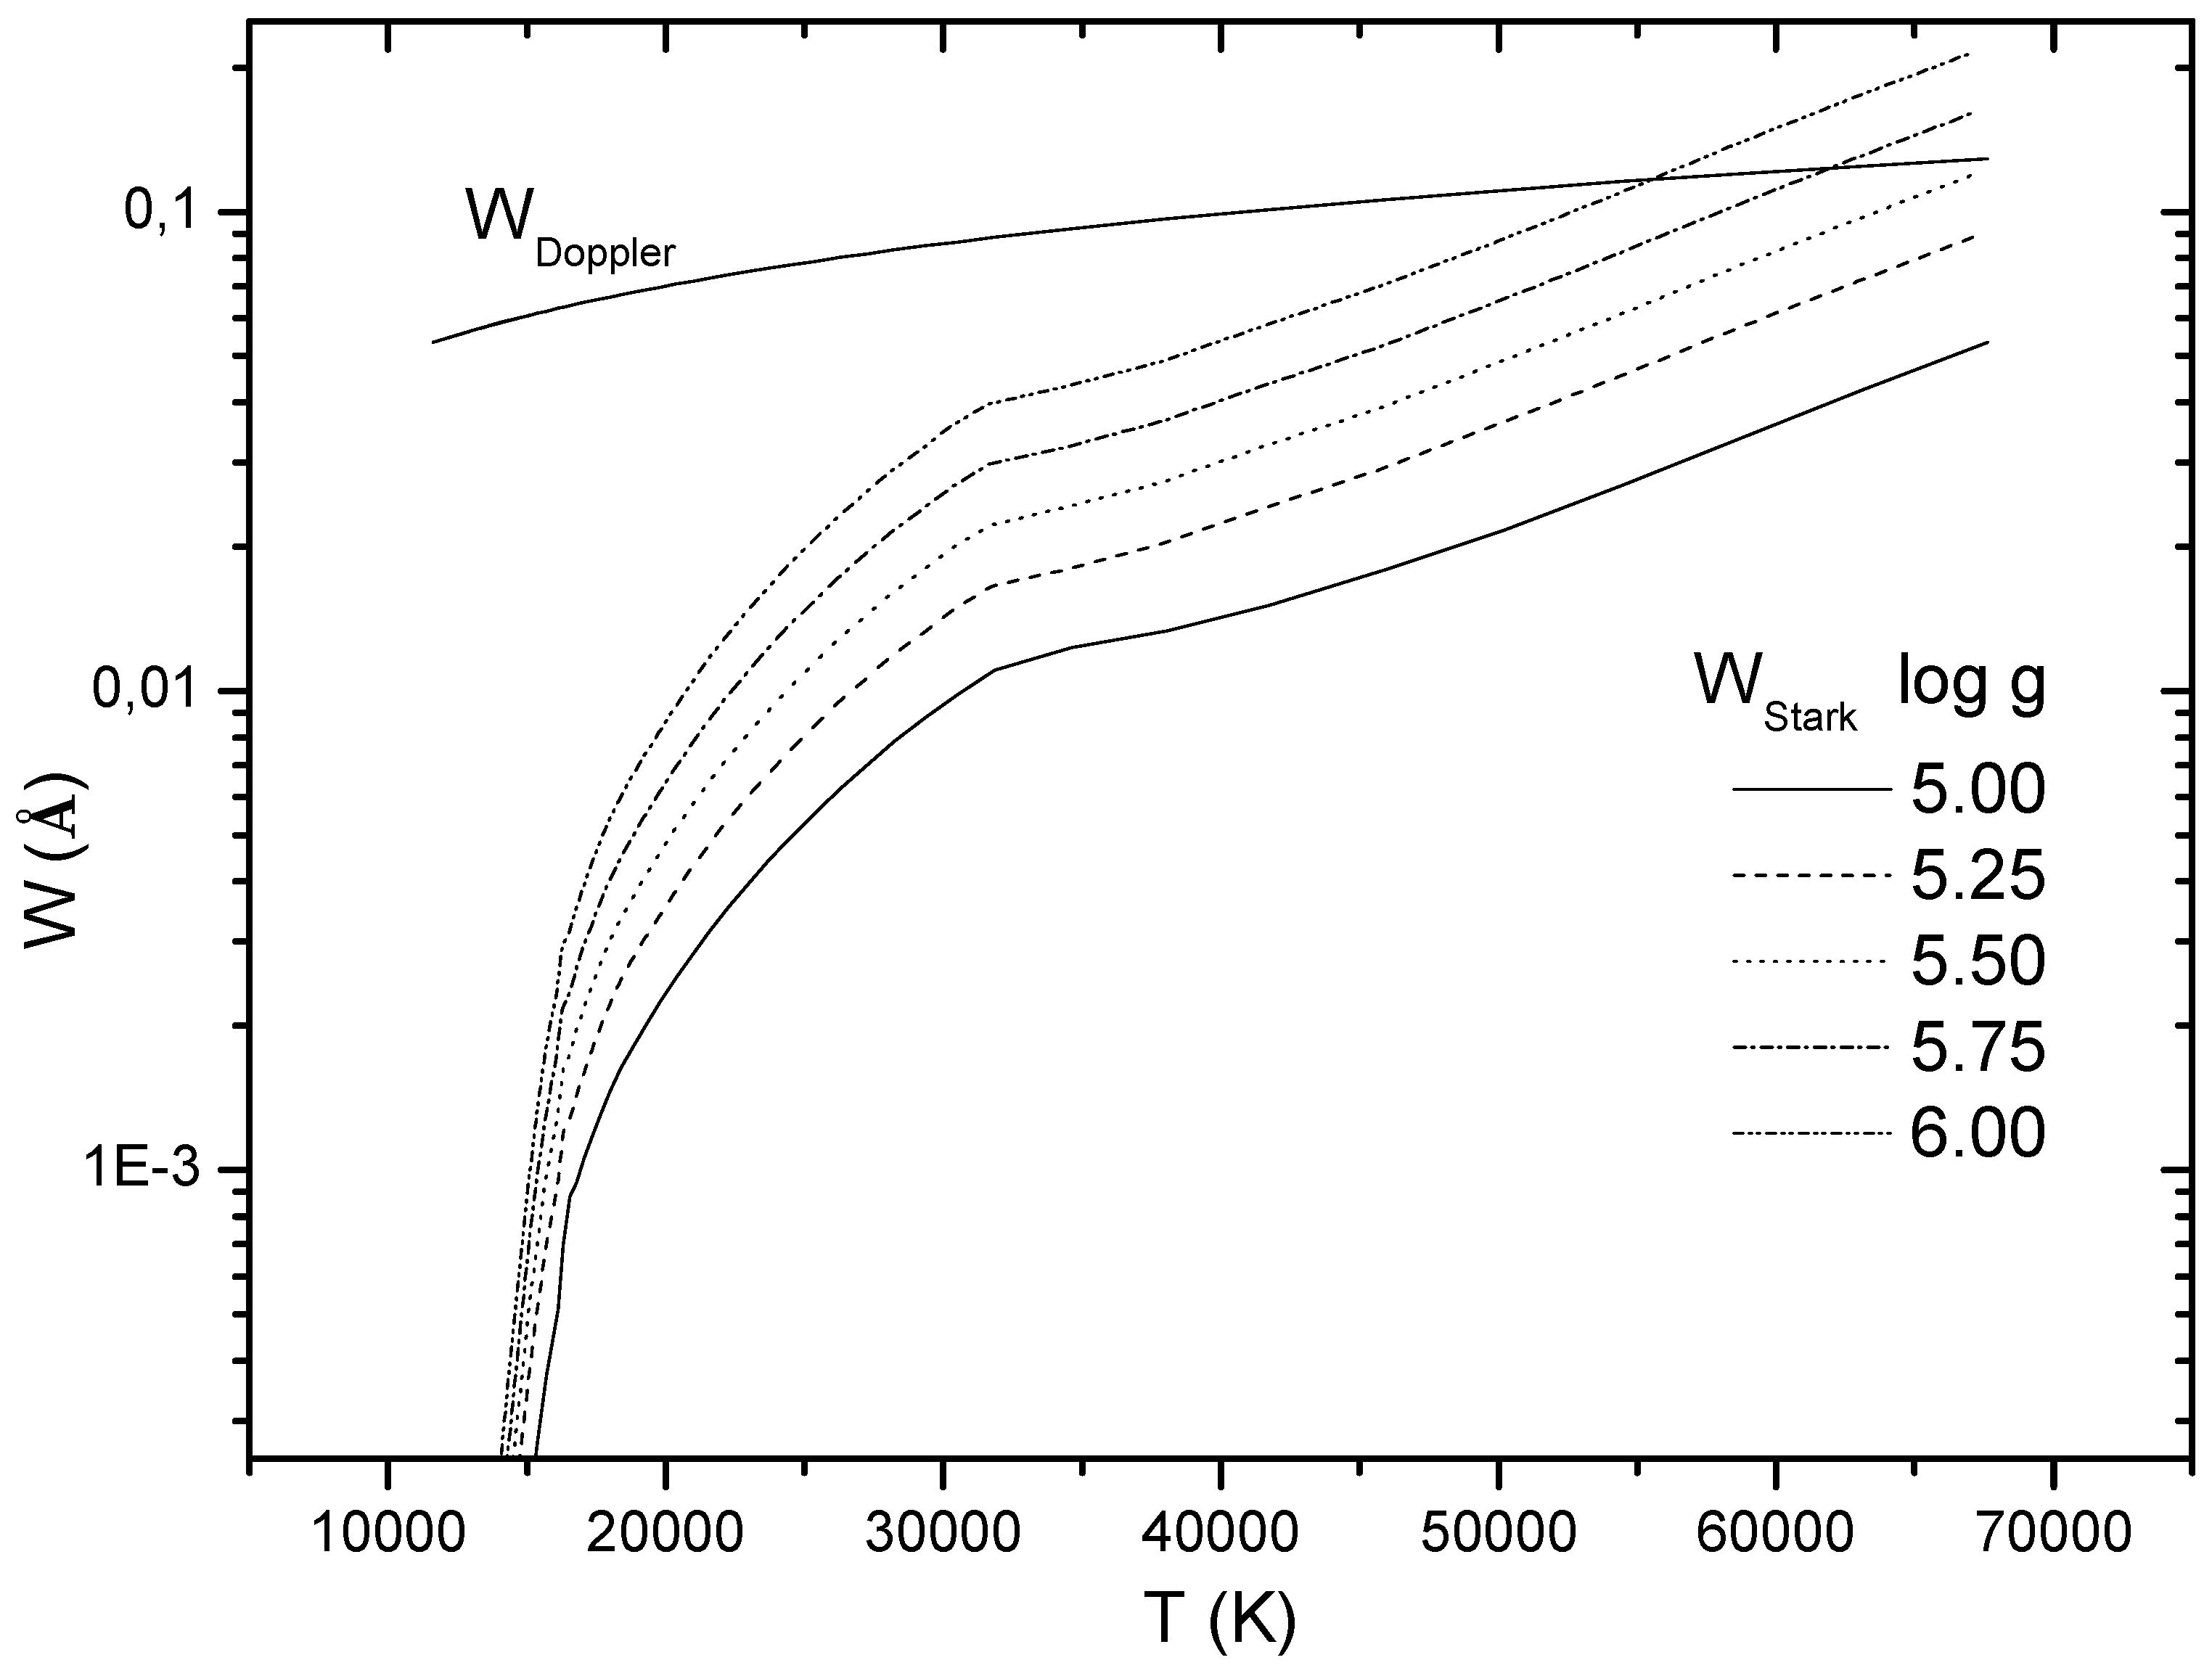
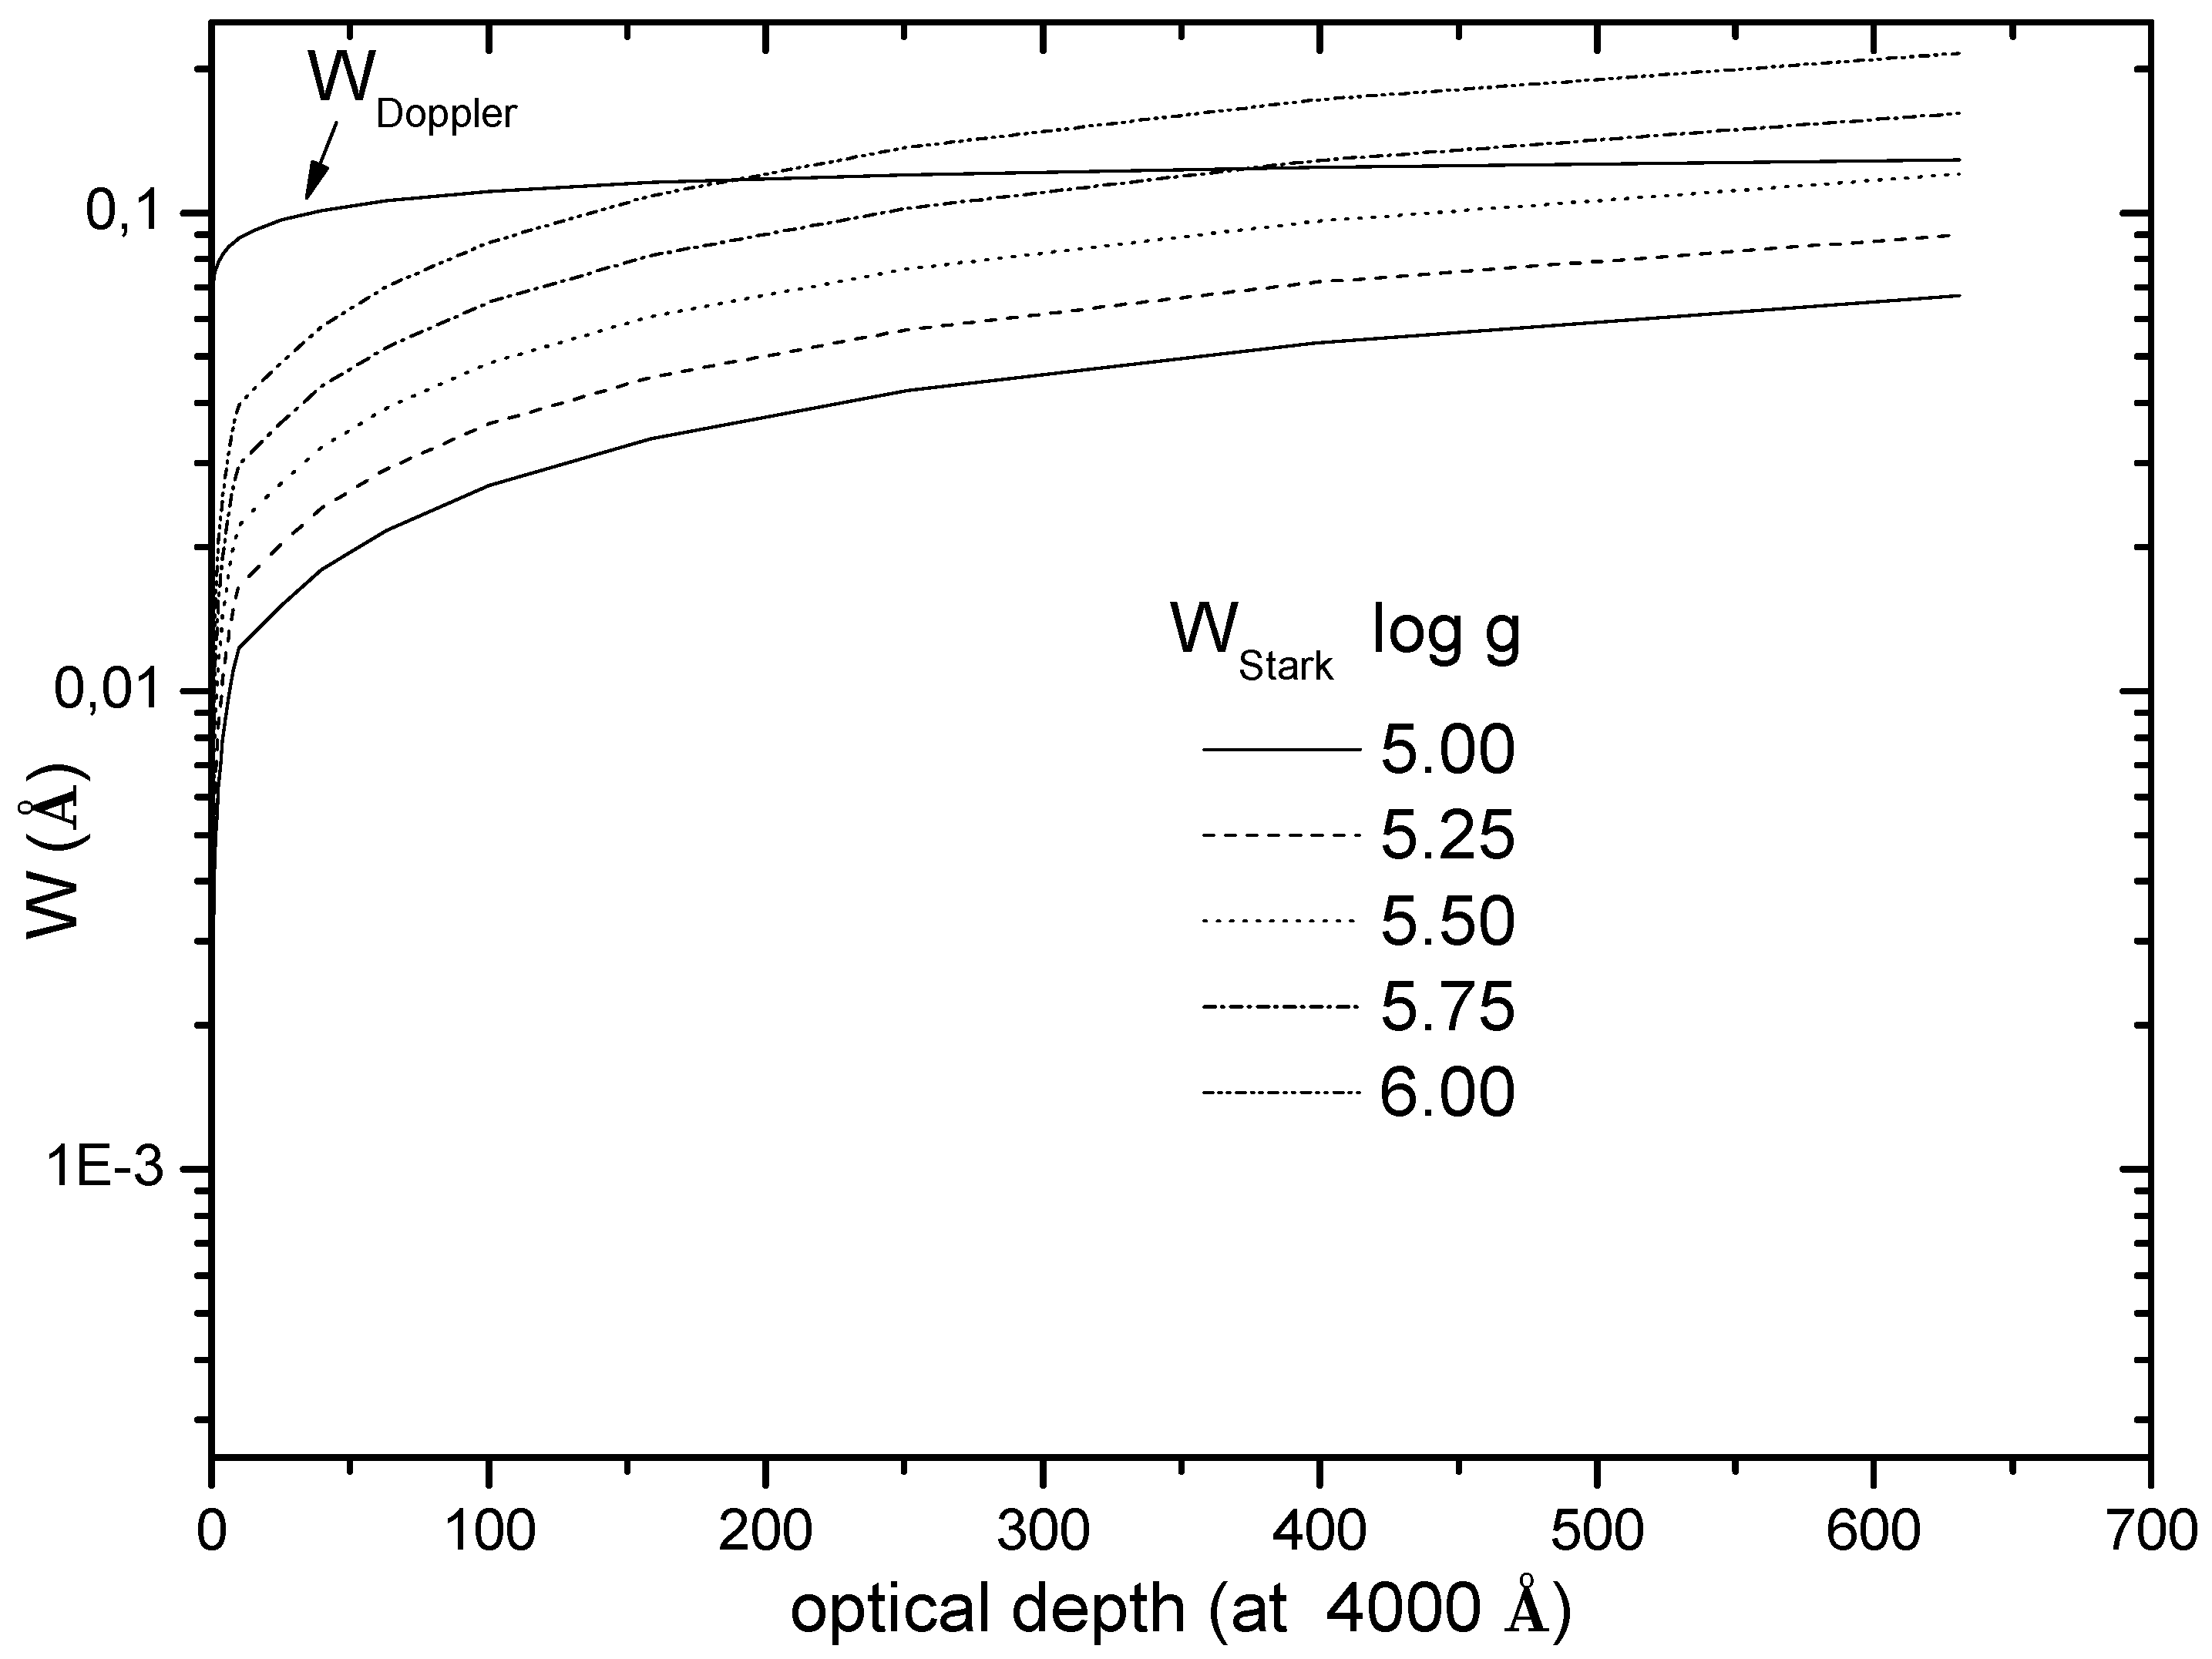
In Figure 2 and Figure 3, we present Stark and Doppler widths for Ar II (P) 3d D–(P) 4p P ( = 4371.33 Å) spectral lines as a function of the temperature of the atmospheric layers and as a function of optical depth respectively. Figure 2 shows that for the atmospheres with log g = 6.00 and log g = 5.75, Stark width become larger than Doppler width from the atmospheric layer with temperature T = 55,000 K and T = 60,000 K respectively. For the atmosphere with log g = 5.50, Stark width is comparable to Doppler width only for the dipper layers of the atmosphere. For the atmospheres with log g = 5.25 and log g = 5.00, Stark width is dominated by Doppler width in all atmospheric layers. Due to the different behavior of Gaussian and Lorentzian distributions, Stark broadening may be important in the line wings even when Doppler width is larger than Stark width.
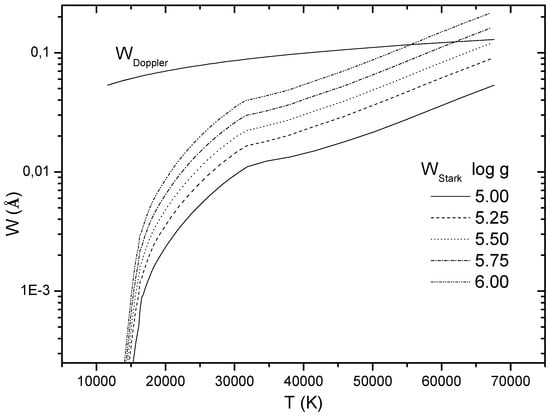
Figure 2.
Stark and Doppler widths for Ar II (P) 3d D–(P) 4p P ( = 4371.33 Å) spectral lines as a function of atmospheric layer temperature. Stark widths are shown for five values of model gravity log , T = 22,000 K.
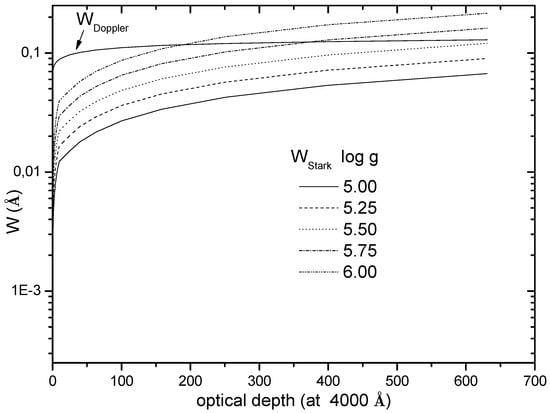
Figure 3.
Stark and Doppler widths for Ar II (P) 3d D–(P) 4p P ( = 4371.33 Å) spectral lines as a function of optical depth. Stark widths are shown for five values of model gravity log , T = 22,000 K.
5. Conclusions
Using the Hartree–Fock approach with relativistic corrections for the calculations of energy levels and oscillator strengths, and the semiclassical perturbation approach in impact approximation, we have determined Stark widths for 34 spectral lines of Ar II ion. All studied lines belong to the 3d–4p transition array. The comparison of our results shows that they are, generally, in good agreement with the experimental values. Our study will be extended to other transition arrays. Stark shift will also be studied. Our investigation on the importance of Stark broadening in the atmospheres of subdwarf B stars, shows that Stark broadening is an important broadening mechanism for the atmospheres with high surface gravity. So, Stark widths obtained here may be useful for modeling and investigating those kind of stars.
Acknowledgments
This work is part of the project 176002 “Influence of collisional processes on astrophysical plasma line shapes” supported by the Ministry of Education, Science and Technological Development of Serbia. This work has been also supported by the Paris Observatory, the CNRS and the PNPS (Programme National de Physique Stellaire, INSU-CNRS), France.
Author Contributions
Rafik Hamdi carried out the calculations. All the authors were involved in the discussions of results and in writing the manuscript.
Conflicts of Interest
The authors declare no conflict of interest.
References
- Werner, K.; Rauch, T.; Kruk, J.W. Far-UV spectroscopy of two extremely hot, helium-rich white dwarfs. Astron. Astrophys. 2017, 601. [Google Scholar] [CrossRef]
- Werner, K.; Rauch, T.; Kruk, J.W. Discovery of photospheric argon in very hot central stars of planetary nebulae and white dwarfs. Astron. Astrophys. 2007, 466, 317–322. [Google Scholar] [CrossRef]
- Rauch, T.; Ziegler, M.; Werner, K.; Kruk, J.W.; Oliveira, C.M.; Van de Putte, D.; Mignani, R.P.; Kerber, F. High-resolution FUSE and HST ultraviolet spectroscopy of the white dwarf central star of Sh 2-216. Astron. Astrophys. 2007, 470, 317–329. [Google Scholar] [CrossRef]
- Blanchette, J.-P.; Chayer, P.; Wesemael, F.; Fontaine, G.; Fontaine, M.; Dupuis, J.; Kruk, J.W.; Green, E.M.T. FUSE Determination of Abundances in Long-Period Pulsating V1093 Her (PG 1716 + 426) Stars. Astrophys. J. 2008, 678, 1329–1341. [Google Scholar] [CrossRef]
- O’Toole, S.J.; Heber, U.T. Abundance studies of sdB stars using UV echelle HST/STIS spectroscopy. Astron. Astrophys. 2006, 452, 579–590. [Google Scholar] [CrossRef]
- Heber, U.; Edelmann, H. Atmospheric Parameters and Abundances of sdB Stars. Astrophys. Space Sci. 2004, 291, 341–349. [Google Scholar] [CrossRef]
- Keenan, F.P.; Bates, B.; Dufton, P.L.; Holmgren, D.E.; Gilheany, S. The determination of element abundances in the solar neighborhood from B-type stellar spectra. I–Argon. Astrophys. J. 1990, 348, 322–327. [Google Scholar] [CrossRef]
- Kupfer, T.; Przybilla, N.; Heber, U.; Jeffery, C.S.; Behara, N.T.; Butler, K. Quantitative spectroscopy of extreme helium stars Model atmospheres and a non-LTE abundance analysis of BD + 10o2179. Mon. Not. R. Astron. Soc. 2017, 471, 877–890. [Google Scholar] [CrossRef]
- Popović, L.Č.; Simić, S.; Milovanović, N.; Dimitrijević, M.S. Stark Broadening Effect in Stellar Atmospheres: Nd II Lines. Astrophys. J. Suppl. Ser. 2001, 135, 109–114. [Google Scholar] [CrossRef]
- Simić, Z.; Dimitrijević, M.S.; Milovanović, N.; Sahal-Bréchot, S. Stark broadening of Cd I spectral lines. Astron. Astrophys. 2005, 441, 391–393. [Google Scholar] [CrossRef]
- Hamdi, R.; Ben Nessib, N.; Milovanović, N.; Popović, L.Č.; Dimitrijević, M.S.; Sahal-Bréchot, S. Atomic data and electron-impact broadening effect in DO white dwarf atmospheres: SiVI. Mon. Not. R. Astron. Soc. 2008, 387, 871–882. [Google Scholar] [CrossRef]
- Dimitrijević, M.S.; Simić, Z.; Kovačević, A.; Valjarević, A.; Sahal-Bréchot, S. Stark broadening of Xe VIII spectral lines. Mon. Not. R. Astron. Soc. 2015, 454, 1736–1741. [Google Scholar] [CrossRef]
- Hamdi, R.; Ben Nessib, N.; Sahal-Bréchot, S.; Dimitrijević, M.S. Stark widths of Ar III spectral lines in the atmospheres of subdwarf B stars. Adv. Space Res. 2014, 54, 1223–1230. [Google Scholar] [CrossRef]
- Sahal-Bréchot, S. Impact Theory of the Broadening and Shift of Spectral Lines due to Electrons and Ions in a Plasma. Astron. Astrophys. 1969, 1, 91–123. [Google Scholar]
- Sahal-Bréchot, S. Impact Theory of the Broadening and Shift of Spectral Lines due to Electrons and Ions in a Plasma (Continued). Astron. Astrophys. 1969, 2, 322–354. [Google Scholar]
- Cowan, R.D. The Theory of Atomic Structure and Spectra; Los Alamos Series in Basic and Applied Sciences; University of California Press: Berkeley, CA, USA, 1981; ISBN 9780520038219. [Google Scholar]
- Hamdi, R.; Ben Nessib, N.; Dimitrijević, M.S.; Sahal-Bréchot, S. Stark broadening of Pb IV spectral lines. Mon. Not. R. Astron. Soc. 2013, 431, 1039–1047. [Google Scholar] [CrossRef]
- Djeniže, S.; Malešević, M.; Srećković, A.; Milosavljević, M.; Purić, J. Stark broadening and shift of singly-ionized argon spectral lines in higher multiplets. J. Quant. Spectrosc. Radiat. Transf. 1989, 42, 429–435. [Google Scholar] [CrossRef]
- Dzierzega, K.; Musiol, K. Stark broadening and shift for Ar II lines. J. Quant. Spectrosc. Radiat. Transf. 1994, 52, 747–754. [Google Scholar] [CrossRef]
- Pellerin, S.; Musiol, K.; Chapelle, J. Measurement of atomic parameters of singly ionized argon lines. III. Stark broadening parameters. J. Quant. Spectrosc. Radiat. Transf. 1997, 57, 377–393. [Google Scholar] [CrossRef]
- Aparicio, J.A.; Gigosos, M.A.; González, V.R.; Pérez, C.; de la Rosa, M.I.; Mar, S. Measurement of Stark broadening and shift of singly ionized Ar lines. J. Phys. B 1998, 31, 1029–1048. [Google Scholar] [CrossRef]
- Iglesias, E.J.; Ghosh, J.; Elton, R.C.; Griem, H.R. Spectral-line width measurements in Ar II from a laser-heated gas-puff plasma. J. Quant. Spectrosc. Radiat. Transf. 2006, 98, 101–106. [Google Scholar] [CrossRef]
- Djurović, S.; Belmonte, M.T.; Peláez, R.J.; Aparicio, J.A.; Mar, S. Stark parameter measurement of Ar II UV spectral lines. Mon. Not. R. Astron. Soc. 2013, 433, 1082–1093. [Google Scholar] [CrossRef]
- Konjević, N.; Lesage, A.; Fuhr, J.R.; Wiese, W.L. Experimental Stark Widths and Shifts for Spectral Lines of Neutral and Ionized Atoms (A Critical Review of Selected Data for the Period 1989 Through 2000). J. Phys. Chem. Ref. Data 2002, 31, 819–927. [Google Scholar] [CrossRef]
- Kramida, A.; Ralchenko, Y.; Reader, J.; NIST ASD Team. NIST Atomic Spectra Database (ver. 5.1); National Institute of Standards and Technology: Gaithersburg, MD, USA, 2013. Available online: http://physics.nist.gov/asd (accessed on 9 March 2014).
- Ohl, R.G.; Chayer, P.; Moos, H.W. Photospheric Metals in the Far Ultraviolet Spectroscopic Explorer Spectrum of the Subdwarf B Star PG 0749+658. Astrophys. J. Lett. 2000, 538, L95–L98. [Google Scholar] [CrossRef]
- Jeffery, C.S.; Woolf, V.M.; Pollacco, D.L. Time-resolved spectral analysis of the pulsating helium star V652 Her. Astron. Astrophys. 2001, 376, 497–517. [Google Scholar] [CrossRef]
© 2017 by the authors. Licensee MDPI, Basel, Switzerland. This article is an open access article distributed under the terms and conditions of the Creative Commons Attribution (CC BY) license (http://creativecommons.org/licenses/by/4.0/).