Abstract
In an attempt to improve U II analysis, the lowest configurations of both parities have been interpreted by means of the Racah-Slater parametric method, using Cowan codes. In the odd parity, including the ground state, 253 levels of the interacting configurations are interpreted by 24 free parameters and 64 constrained ones, with a root mean square (rms) deviation of 60 cm. In the even parity, the four known configurations and the unknown form a basis for interpreting 125 levels with a rms deviation of 84 cm. Due to perturbations, the theoretical description of the higher configurations remains unsatisfactory. The known and predicted levels of U II are used for a determination of the partition function. The parametric study led us to a re-investigation of high resolution ultraviolet spectrum of uranium recorded at the Meudon Observatory in the late eighties, of which the analysis was unachieved. In the course of the present study, a number of 451 lines of U II has been classified in the region 2344–2955 Å. One new level has been established as at 39113.98 cm.
1. Introduction
The spectroscopy of uranium is of interest in many respects. Being the element with the highest atomic number (Z = 92) naturally available, the nuclear decay of U provides a tool for the evaluation of the age of the Universe [1]. In the astrophysical plasma models, the ionized uranium (U II) transition at 3859.572 Å ( − ) is used for the diagnostics. Not only are specific radiative data for this transition needed, but so are partition functions that depend on energy levels relative to the ground level . Therefore a comprehensive picture of the level scheme in ionized uranium is desired. For U II, as for other complex spectra of heavy elements, the interpretation of the observed emission lines does not allow a complete determination of the energy level scheme. Nevertheless, by application of the Racah-Slater parametric method, the energy parameters adjusted against known experimental energy values should lead to improved predictions of energies for the levels left undetermined. The relevance of the methods that were used with success in lower-Z elements [2] was confirmed in the cases of several higher-Z elements, including thorium [3,4], despite the fact that the non-relativistic perturbative model was primarily unsatisfactory for these heavy systems. Due to the limited computer capacities in the early times, the previous calculations on U II [5,6] had to neglect configuration interaction (CI) effects or to use truncated bases of configurations. Therefore, the necessary limitation of core configurations and to their lowest terms impaired the calculated energies and wave functions for the and levels, consequence of the large spin-orbit interactions and the intermediate coupling conditions.
The critical compilation of energy levels and spectra of actinides published in 1992 by Blaise and Wyart [3] provided preliminary tables of energy levels of both parities in U II. The compilation of U II was based on emission data from Steinhaus et al. [7] and on new FTS measurements by Palmer et al. [8]. In particular, energy values of the lowest levels of configurations involving electrons were reported, thus updating the previous estimates by Brewer [9]. The list of experimental energy levels in U II was further extended by Blaise et al. [6]. Although the earlier calculations [5,6] usefully supported the search for energy levels, it is worth taking advantage of the present possibilities of Cowan codes [10,11] implemented on modern computers for improving the interpretation of the level scheme in U II, and more generally in actinides. This is the main purpose of the present work.
On the experimental side, a set of uranium emission spectra in the ultraviolet range (1000–3000 Å) recorded in the late eighties at the Meudon Observatory was available at the beginning of the present work. The original aim of these recordings, involving one of the present authors (JFW), was to support the critical compilation of the U III spectrum in Blaise and Wyart [3] by supplementing the Fourier Transform measurements [12] in the range (2000 Å– 4 ) with data in the shorter wavelength range. However the spectrograms had been only partly measured and had never been completely analyzed, leaving most of the experimental material unpublished. Only improvements for U III were reported in an EGAS conference [13] and in the compilation [3]. The analysis of the unknown spectrum of U IV was also planned but never initiated. With the recent publication of IR data on uranium [14], these unused ultraviolet data represent an opportunity for a new step in a comprehensive description of ionized uranium emission spectra.
2. Available Experimental Data
The available experimental spectra in the wavelength range 1000–3000 Å were emitted by a vacuum triggered spark source with uranium electrode and recorded on photographic plates using the high-resolution 10.7 m normal incidence vacuum ultraviolet spectrograph of the Meudon Observatory. The spectrograph is equipped with a 3600 lines/mm holographic concave grating, leading to a linear dispersion of 0.26 Å/mm on the plates. At the time of the experiment, only partial measurement of the plates was carried out on a semi-automatic comparator (microdensitometer). Wavelength calibration was insured by external reference lines in a superimposed spectrum from a iron Penning discharge source. In addition to U III lines, the spectrograms contain known lines from U V [15] and U VI [16], and a number of unidentified lines. Among the last ones, many likely belong to the unknown U IV spectrum. Although the discharge conditions were favorable for producing more than doubly charged ions, many sharp lines were present at the long wavelength end, which we presumed to belong to U II. In the present work, more complete measurements have been resumed for the wavelength range 2250–2955 Å, by digitizing the spectral plates using a flatbed scanner. The plates were scanned simultaneously with a precision ruler with markings every 1 mm, allowing interpolation between markings for correction of possible distortions, as described in [17]. Then the positions of lines were determined by superimposing two symmetrical profiles of the line displayed by a “homemade” software that mimics the rotating prism set-up of the comparator [18]. For wavelength calibration, internal standards were preferred. These were chosen among the U III wavelengths from Fourier Transform Spectrometry (FTS) [12] and the U II Ritz wavelengths calculated from level energies determined by FTS [6]. For the wavelength range shorter than 2350 Å, some U V wavelengths [15] were used. The uncertainty of the wavelength measurements varies between and Å.
Figure 1 shows a section of the triggered spark spectrum between 2863–2875Å. The shape of the lines, from relatively sharp (for U II) to hazy (for U IV) may be attributed to Doppler broadening as higher charged ions are produced in hotter part of the sparks. Identified U II lines are numbered. The numbers and corresponding wavelengths can be found in Table 9.
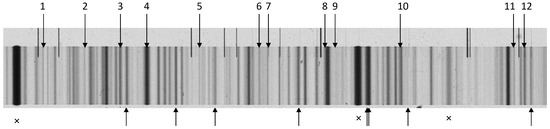
Figure 1.
Section of a vacuum triggered spark spectrum (2863–2875 Å). Downward arrows: the U II lines identified in the present work, their numbers and corresponding wavelengths can be found in Table 9; Upward arrows: U III lines from [12]; x: Unidentified lines, likely from U IV. The superimposed iron spectrum is visible above the uranium spectrum but not used in the present work.
3. Theoretical Interpretation of the Energy Levels
Figure 2 shows a diagram of U II configurations of both parities included in the present study. The energy levels spread as predicted by ab initio calculations in the Relativistic Hartree-Fock mode (Cf text below).
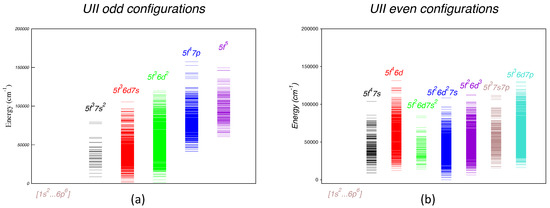
Figure 2.
Energy levels of U II belonging to the configurations included in the present study as predicted by ab initio HFR calculations. (a) Odd parity configurations. (b) Even parity configurations.
We started our work from the energy values tabulated in the final publication on U II [6]. Table 1 recalls the account of various observables available in [6] used for checking the validity of theoretical calculations. The lowest levels of configurations with and electrons, as determined in [6], may be supplemented by predictions for unknown configurations given in [3] according to Brewer’s work [9]. This guided our choice of the bases of interacting electronic configurations.

Table 1.
Summary of experimental data available for the parametric interpretation of U II levels. : total number of levels; : number of levels with Landé factor measured by Zeeman effect, : number of levels with measured isotope shift; : number of levels with empirical identification. The number of classified lines per level was not given in [6].
3.1. Odd Parity Levels
The present work benefited from the similarities between lanthanides and actinides elements. In the periodic table of elements, neodymium occupies the same position in the lanthanide row as does uranium in the actinide row. Similarities between the two spectra do exist, although configurations built on the core are much lower relative to the core in U II than are those built on relative to in Nd II.
In Nd II, the basis set of overlapping odd configurations was adopted for the parametric interpretation of 596 energy levels of these configurations [19,20] by means of the Cowan’s codes [10,11]. It had been proven to be adequate by a (rms) deviation as small as 53 cm. Since in U II the corresponding configurations (with principal quantum numbers increased by one) are also the lowest ones in the parity, we used the same basis set for resuming the calculation of odd parity levels, including the lowest odd parity levels listed in [6]. However, in the case of U II, the configuration is unknown but is involved by electrostatic interaction with the configuration. The next higher unknown configuration was not included in the basis. Since its lowest level is expected at 38000 ± 5000 cm above the ground state, according to Brewer’s estimates [9], it should not overlap the other odd levels included in the calculation, although CI repulsion effects could be present.
In the first step of the calculation, the and codes were used in the Relativistic Hartree-Fock () mode. The electrostatic and spin-orbit radial integrals were then scaled with factors obtained as averages from earlier actinide calculations [4] and helped for generating the set of parameters for the first diagonalization by the code. Appropriate corrections on the average energy parameters were made for establishing a fair correspondence between calculated and experimental energies and Landé factors [6] for the low levels of , and . Then the iterative Least Squares Fit (LSF) of the energy parameters was performed by means of the code, minimizing the rms deviation , where and are respectively the number of experimental energies and the number of free parameters, with a few dozens of experimental energies to start. Constraints on the parameters were applied for preventing uncontrolled divergence problems. Step by step, the number of levels in the fit was increased up to 253 with a final deviation of 60 cm. Final values for 22 free parameters and 64 constrained ones are reported in Table 2. The electrostatic and spin-orbit integrals are listed with their fitted values and their values from which the scaling factors = are derived. In addition to the explicit CI effects, second order CI effects of distant configurations have been taken into account by using effective parameters. These are , and for the core configurations and Slater forbidden parameters for (enabled by a specific option of the code). Their initial values were chosen semi-empirically by comparison with earlier works [4].
Table 2.
Fitted parameters (in cm) for odd parity configurations of U II compared with HFR radial integrals. The scaling factors (dimensionless) are replaced by = − for average energies (in cm). Constraints on some parameters are in the second column under ’Cstr.’ (denoted ’f’ for fixed parameters or ’rn’ , which link parameters of the same ’rn’ to vary in a constant ratio). The values of parameters are relative to the ground state configuration taken as zero value.
The comparison of experimental and calculated levels is given in Table 3, which is ordered by increasing theoretical energies E. One may notice that leading components of eigenfunctions often represent a small part of the total wave functions. As an example, the eigenfunction of the level at E = 8379.697 cm has three leading components representing respectively only 14, 11 and 10 percent of the total wavefunction. However, the calculation seems correct, as shown by the small deviations for both energies and Landé factors: E–E = 22 cm and g– g = 0.002. At higher energies, in the bulk of calculated levels, it occurs that leading components become as small as 3% only. Considering that the configuration sharing is more meaningful than tiny term components, we have summed the squared amplitudes in the wave functions separately for the 5 configurations. The dominant configuration and its percentage are respectively reported in the last two columns of the table.
Table 3.
Energy levels of U II, odd parity. Comparison of experimental energies and Landé factors with values calculated from the parameter set of Table 2. = − . The percentage of the leading term (notations from Cowan codes) and its configuration are specified by columns 7–9. The dominant configuration and its percentage are reported in the last two columns.
Below 20,000 cm, it was possible to establish a reliable correspondence between experimental and theoretical energies for the LSF procedure, which was generally supported by agreement between g and g Landé factors, when availabie [6]. However, a few exceptions have been observed. As an example, the two J = 7.5 levels at 8394.362 and 8521.922 cm were previously [6] assigned respectively as and , based on the empirical identification of Landé factors and isotope shifts. In the present work, the initial HFR step predicted these two levels in an inverted order of energies at respectively 8536 and 8438 cm, with strongly mixed eigenfunctions. Furthermore, the LSF following this inverted order led to smaller deviations, although physically unsatisfactory. Therefore this order has been adopted in Table 3. Above 20,000 cm Landé factors are missing for a majority of levels and the quantum number J is reported as ambiguous for some of them. Since the correspondence between calculated and experimental energies becomes uncertain as energy increases, identifications above 25,726 cm are not reported here.
At an intermediate step of the parametric fitting, the previously assigned J value, , of the level = 13,695.737 cm raised questions. It was found that on one hand, no other level with was predicted between the two experimental levels at 13,270.612 and 13,961.850 cm, and on the other hand, one level was missing between = 13,450.490 and 14,265.976 cm. The possibility for correcting the J-value for = 13,695.737 was thus examined. Indeed, while a attribution can be justified by only one unique transition with a even level, a value is supported by 16 lines of [7] and by two unidentified lines from the infrared line list of [14] that fit transitions with even levels. Table 4 collects the transitions supporting the present assignation of a for this level. Similar ambiguity for some other levels led us to be cautious and to avoid inclusion of too many values in the LSF fitting process with no other reason but a small value.
Table 4.
Transitions of the U II odd parity level at 13695.737 cm with to even levels of .
3.2. Even Parity Levels
Similarly to the odd parity study, the and codes were used in the Relativistic Hartree-Fock () mode. Considering the large CI interaction integrals within the group , the previously undetermined configuration was added to the four lowest configurations . Appropriate scaling of Slater and spin-orbit integrals and corrections on the average energy parameters were applied for preparing the initial input data of the code and of the LSF in the code. In the final cycle of optimization, 125 levels and 22 free parameters led to a rms deviation of 84 cm, i.e., which is less satisfactory than in the odd parity. One of these levels, given at E = 22917.453 cm without any label in [6] has been identified as the lowest level of the configuration, slightly above the error bars of Brewer’s predictions [9]. It is seen that the scaling factors of fitted parameters reported in Table 5 are not very different from those obtained in the opposite parity (Table 2). With regard to the unachieved status of the parametric interpretation in the even parity, only the dominant configuration and the first component of the eigenfunctions are given in Table 6, together with the energies and Landé factors calculated in the final LSF.
Table 5.
Fitted parameters (in cm) for even parity configurations of U II with and cores compared with HFR radial integrals. The scaling factors are (dimensionless). They are replaced by = − for average energies (in cm). Constraints on some parameters are in the ’Cstr’ columns (denoted ’f’ for fixed parameters or ’rn’ , which link parameters of the same ’rn’ to vary in a constant ratio). The values of parameters are relative to the lowest odd configuration taken as zero value.
Table 6.
Energy levels of U II, even parity with and parent configurations. Comparison of experimental energies and Landé factors with values calculated from the parameter set of Table 5. = − . The percentage, the configuration and the name of the leading component in the corresponding configuration are given in the last three columns.
Attempts to interpret with the same method of parametric fitting could not go beyond the optimization of the average energy and spin-orbit parameters. In Table 7 energy parameters adopted for are reported and they lead to the calculated energies in Table 8. The empirical attribution of levels to configurations derived from isotope shifts and transition intensities in [6] are not fully supported by the present calculations. There were more labels in Table 2 of [6] than predicted from the present work (Cf Table 8). The quantitative evaluation of the effects within the whole group + has been attempted but has failed.
Table 7.
Adopted parameters (in cm) for even parity configurations and of U II compared with HFR radial integrals. The scaling factors are . Constraints on some parameters (denoted ’rn’ in the ’Unc’ columns of standard errors) link parameters of the same ’rn’ to vary in a constant ratio. The values of parameters are relative to the lowest even configuration taken as zero value.
Table 8.
Energy levels for even parity configurations and of U II. = − . The percentage, the configuration and the name of the leading component in the corresponding configuration are given in the last three columns.
3.3. Partition Function
To get an idea of how semi-empirical parametric calculations could influence the value of the partition function ( : Boltzmann constant), we made an estimation of the partition function of U II for a typical stellar temperature. The temperature chosen is 4825 K ( cm), which is the temperature quoted by Cayrel et al. [1] for a metal-poor star showing the U II line at 3859.57 Å in its spectrum.
Since experimental levels are incompletely determined, a partition function calculated with only known experimental energies would be underestimated. Therefore we calculated the partition function with all the available experimental energies supplemented by the final least squares fitted energies when experimental ones are missing. In the expression of the partition function we included all the levels below 46 000 cm of both parities. The result is : = 122.99, which is the best value possible in the present case. When the partition function is calculated with the same number of levels, but with all the fitted energies, the result is: (T) = 120.99, which agrees with within 2%. When ab initio HFR energy values are used, we have (T) = 89.19, which is 26% smaller. Consequently, in absence of complete experimental level energies, the energies calculated from fitted parameters provide a realistic estimation of the partition function.
3.4. Transition Probabilities
The parametric calculations provide gA values for transition probabilities (g: upper level statistical weight; A: Einstein coefficient of spontaneous emission) between calculated levels. Extensive comparison with experimental transition probabilities is not possible because of the scarcity of measurements. Furthermore, because of the strongly mixed wave functions, weak transitions are sensitive to small changes of energy parameters and may not be reliable for comparison. Nevertheless, it is interesting to consider the line at 3859.6 Å, which is strong and used as cosmochronometer [1]. Chen and Borzileri [21] measured the gA value for this line and found s, to be compared with previous measurement s by Corliss [22]. Nilsson et al. [23] derived branching ratios from relative intensities measured in FTS spectra and combined with radiative lifetime of the upper level at 26191 cm to find a gf value of 0.856 for the oscillator strength weighted by the lower level degeneracy. The corresponding gA value (Equation (1) of [23]) is s in agreement with the value of s calculated by Kurucz [24]. Our calculations lead to gA = s, four times larger, but they confirm the order of magnitude. However, the parametric study for the high even levels of is still unachieved, since treated without all the interacting even configurations. Its results should be taken with caution.
4. Classified Lines of U II in the Ultraviolet
On our spectrograms described in Section 2, some lines were relatively sharp and were likely emitted by singly charged uranium ions. For identification of U II lines, we searched experimental wave numbers matching the Ritz wave numbers calculated from the energy differences of known U II energy levels reported in [6], even when the level was not assigned with quantum numbers. The maximum uncertainty of the wavelength measurements is estimated to be Å . Thus the corresponding uncertainty on wave numbers should be less than cm. To take into account any possible perturbations in the spark spectrum, we chose a tolerance of cm for a criterion of identification. Indeed, according to [14], the level energies in [6], therefore the Ritz wave numbers, have negligible uncertainties of about cm. Table 9 lists the 451 lines between 2344 and 2955 Å identified as U II transitions, with calculated Ritz wavelengths, experimental wavelengths, deviations exp-Ritz and line intensities, together with the corresponding upper and lower levels. One line has triple identification and 24 lines have double identification. These concern mostly lines with two deviations of opposite signs. Otherwise, the line with the smallest deviation is retained. No gA values were available here for confirmation of identifications since the even levels involved in these transitions have only experimental energy values but no quantum numbers assigned except the J values.
Table 9.
Ultraviolet transitions of U II emitted from a vacuum spark source. : Ritz wavelength calculated with experimental energies from [6]; : experimental wavelength ; = −; : experimental wavenumbers; = −(−).
Search of new levels of close to the predicted energies of Table 8 was attempted using the possible U II lines left unidentified. Unfortunately, only one chain of transitions supported by calculated transition probabilities could be found leading to a level with at 39113.98 ± 0.1 cm. Table 10 lists the six transitions that establish this level.
Table 10.
Transitions establishing the newly determined even parity level of the U ion at 39113.98 ± 0.1 cm. In log(gf) , f is the absorption oscillator strength and g, the statistical weight of the lower level. gA is the upper level statistical weight g multiplied by the Einstein coefficient of spontaneous emission. CF is the cancellation factor defined by Equation (14.107), p432 in [10].
5. Conclusions
The lowest energy levels of the singly ionized uranium are interpreted following the Racah-Slater parametric method by means of Cowan codes. In the odd parity, the number of interpreted levels is about ten times larger than the number of free parameters. The relatively small rms deviation of the energies and the deviations between and Landé factors for many levels show that the present model is robust. Some experimental level energies, although supported by the high accuracy of the observed FTS wave numbers, could not be attributed unambiguously to a theoretical level energy. The limitations of the present theoretical description are even more obvious in the even parity with larger rms deviations on the energies for both groups of configurations studied. After 70 years of investigations, the spectrum of U II still deserves further experimental studies for removing uncertain interpretations. The main difficulties are due to the ambiguities on the J values of levels, the determination of which would need a more complete study of Zeeman effect. Furthermore, the description of the strongly mixed CI wave functions could only be confirmed by the value of the Landé factor. By remembering the sentence Levels without known g values are less certain because of the possibilities of fortuitous coincidences written in [6], we do consider that the present calculations are satisfactory in spite the uninterpreted levels. A theoretical interpretation of the core configurations and of U III is presently under way for a better knowledge of appropriate scaling factors of the radial integrals to be used in U II. An estimate of the partition function shows that level energies from parametric fit are preferable for its calculation. On the experimental side, a list of 451 ultraviolet spectral lines from high resolution vacuum spark spectra identified as U II transitions is reported, as well as six other transitions establishing a new energy level in the even parity configuration .
Acknowledgments
The photographic spectrograms were recorded between 1986 and 1988 with technical assistance of Françoise Launay and Maurice Benharrous. Christophe Blaess is acknowledged for digitizing the spectrograms. The financial support of the French CNRS – PNPS national program is acknowledged. This work is part of the Plas@Par LabEx project managed by the ANR (ANR-11-IDEX-0004-02). AM and MS wish to acknowledge supports from Université Mouloud Mammeri, Tizi-Ouzou, Algeria and from the project CNEPRU D00520110032, Algeria.
Author Contributions
These authors contributed equally to this work.
Conflicts of Interest
The authors declare no conflict of interest.
References
- Cayrel, R.; Hill, V.; Beers, T.; Barbuy, B.; Spite, M.; Spite, F.; Plez, B.; Andersen, J.; Bonifacio, P.; Francois, P.; et al. Measurement of stellar age from uranium decay. Nature 2001, 409, 691–692. [Google Scholar] [CrossRef] [PubMed]
- Judd, B. R. Complex atomic spectra. Rep. Prog. Phys. 1985, 48, 907–954. [Google Scholar] [CrossRef]
- Blaise, J.; Wyart, J.-F. Selected Constants Energy Levels and Atomic Spectra of Actinides; Centre National de la Recherche Scientifique: Paris, France, 1992; Volume 20. [Google Scholar]
- Wyart, J.-F.; Blaise, J.; Worden, E.F. Studies of electronic configurations in the emission spectra of lanthanides and actinides: application to the interpretation of Es I and Es II, predictions for Fm I. J. Sol. State Chem. 2005, 178, 589–602. [Google Scholar] [CrossRef]
- Guyon, F.; Blaise, J.; Wyart, J.-F. Etude paramétrique des configurations impaires profondes dans les spectres de l’uranium UI et UII. J. Phys. 1974, 35, 929–933. [Google Scholar] [CrossRef][Green Version]
- Blaise, J.; Wyart, J.-F.; Vergès, J.; Engleman, R., Jr.; Palmer, B.A.; Radziemski, L.J. Energy levels and isotope shifts for singly ionized uranium (U II). J. Opt. Soc. Am. B 1994, 11, 1897–1929. [Google Scholar] [CrossRef]
- Steinhaus, D.W.; Radziemski, L.J., Jr.; Cowan, R.D.; Blaise, J.; Guelachvili, G.; Ben Osman, Z.; Vergès, J. Present Status of the Analyses of the First and Second Spectra of Uranium (U I and U II) as Derived from Measurements of Optical Spectra; LASL Report LA-4501; Los Alamos Scientific Lab., N. Mex.: Los Alamos, NM, USA, 1971.
- Palmer, B.A.; Keller, R.A.; Engleman, R., Jr. An Atlas of Uranium Emission Intensities in A Hollow Cathode Discharge; LASL Informal Report LA-8251-MS,UC-34a; Los Alamos Scientific Lab., N. Mex.: Los Alamos, NM, USA, 1980.
- Brewer, L. Energies of the electronic configurations of the singly, doubly and triply ionized lanthanides and actinides. J. Opt. Soc. Am. 1971, 12, 1666–1682. [Google Scholar] [CrossRef]
- Cowan, R.D. The Theory of Atomic Structure and Spectra; University of California Press: Berkeley, CA, USA, 1981. [Google Scholar]
- Kramida, A. PC Version of Cowan Codes. Available online: http://das101.isan.troitsk.ru (accessed on 21 August 2012).
- Palmer, B.A.; Engleman, R., Jr. Wavelengths and energy levels of doubly ionized uranium obtained using a Fourier Transform spectrometer. J. Opt. Soc. Am. B 1984, 1, 609–625. [Google Scholar] [CrossRef]
- Blaise, J.; Wyart, J.-F.; Palmer, B.A.; Engleman, R., Jr.; Launay, F. Analysis of the spectrum of doubly ionized Uranium (U III). In 19th EGAS, Dublin: European Group for Atomic Spectroscopy: 14–17 July 1987: Abstracts; European Physical Society: Mulhouse, France, 1987; pp. A3–08. [Google Scholar]
- Redman, S.L.; Lawler, J.E.; Nave, G.; Ramsey, L.W.; Mahadevan, S. The infrared spectrum of Uranium Hollow athode Lamps from 850nm to 4000nm. Astrophys. J. Supp. Ser. 2011, 195, 24. [Google Scholar] [CrossRef]
- Wyart, J.-F.; Kaufman, V.; Sugar, J. Analysis of the Spectrum of Four-Times-Ionized Uranium (U5). Phys. Scr. 1980, 22, 389–396. [Google Scholar] [CrossRef]
- Kaufman, V.; Radziemski, L.F., Jr. The sixth spectrum of Uranium (UVI). J. Opt. Soc. Am. 1976, 66, 599–600. [Google Scholar] [CrossRef]
- Meftah, A.; Wyart, J.-F.; Tchang-Brillet, W.-Ü.L.; Blaess, C.; Champion, N. Spectrum and energy levels of the Yb4+ free ion (Yb V). Phys. Scr. 2013, 88, 045305. [Google Scholar]
- Tomkins, F.S.; Fred, M. A photoelectric setting device for a spectrum plate comparator. J. Opt. Soc. Am. 1951, 41, 641. [Google Scholar] [CrossRef]
- Wyart, J.-F. Theoretical interpretation of the Nd II spectrum: Odd parity energy levels. Phys. Scr. 2010, 82, 035302. [Google Scholar] [CrossRef]
- Wyart, J.-F. On the interpretation of complex atomic spectra by means of the parametric Racah-Slater method and Cowan codes. Can. J. Phys. 2011, 89, 451. [Google Scholar] [CrossRef]
- Chen, H.-L.; Borzileri, C. Laser induced fluorescence studies of U II produced by photoionization of uranium. J. Chem. Phys. 1981, 74, 6063–6069. [Google Scholar] [CrossRef]
- Corliss, C.H. Oscillator strengths for lines of ionized uranium (U II). J. Res. Nat. Bur. Stand. Sect. A 1976, 80, 429. [Google Scholar] [CrossRef]
- Nilsson, H.; Ivarsson, S.; Johansson, S.; Lundberg, H. Experimental oscillator strengths in U II of cosmological interest. Astron. Astrophys. 2002, 381, 1090–1093. [Google Scholar] [CrossRef][Green Version]
- Kurucz, R.L. Available online:. Available online: http://kurucz.harvard.edu/linelists/gfnew/ (accessed on 31 March 2017).


© 2017 by the authors. Licensee MDPI, Basel, Switzerland. This article is an open access article distributed under the terms and conditions of the Creative Commons Attribution (CC BY) license (http://creativecommons.org/licenses/by/4.0/).