
Status of CHIP-TRAP: The Central Michigan University High-Precision Penning Trap

 ,
, 
Abstract
1. Introduction
1.1. Background and Motivation for CHIP-TRAP
1.2. Penning Trap Mass Spectrometry and CHIP-TRAP
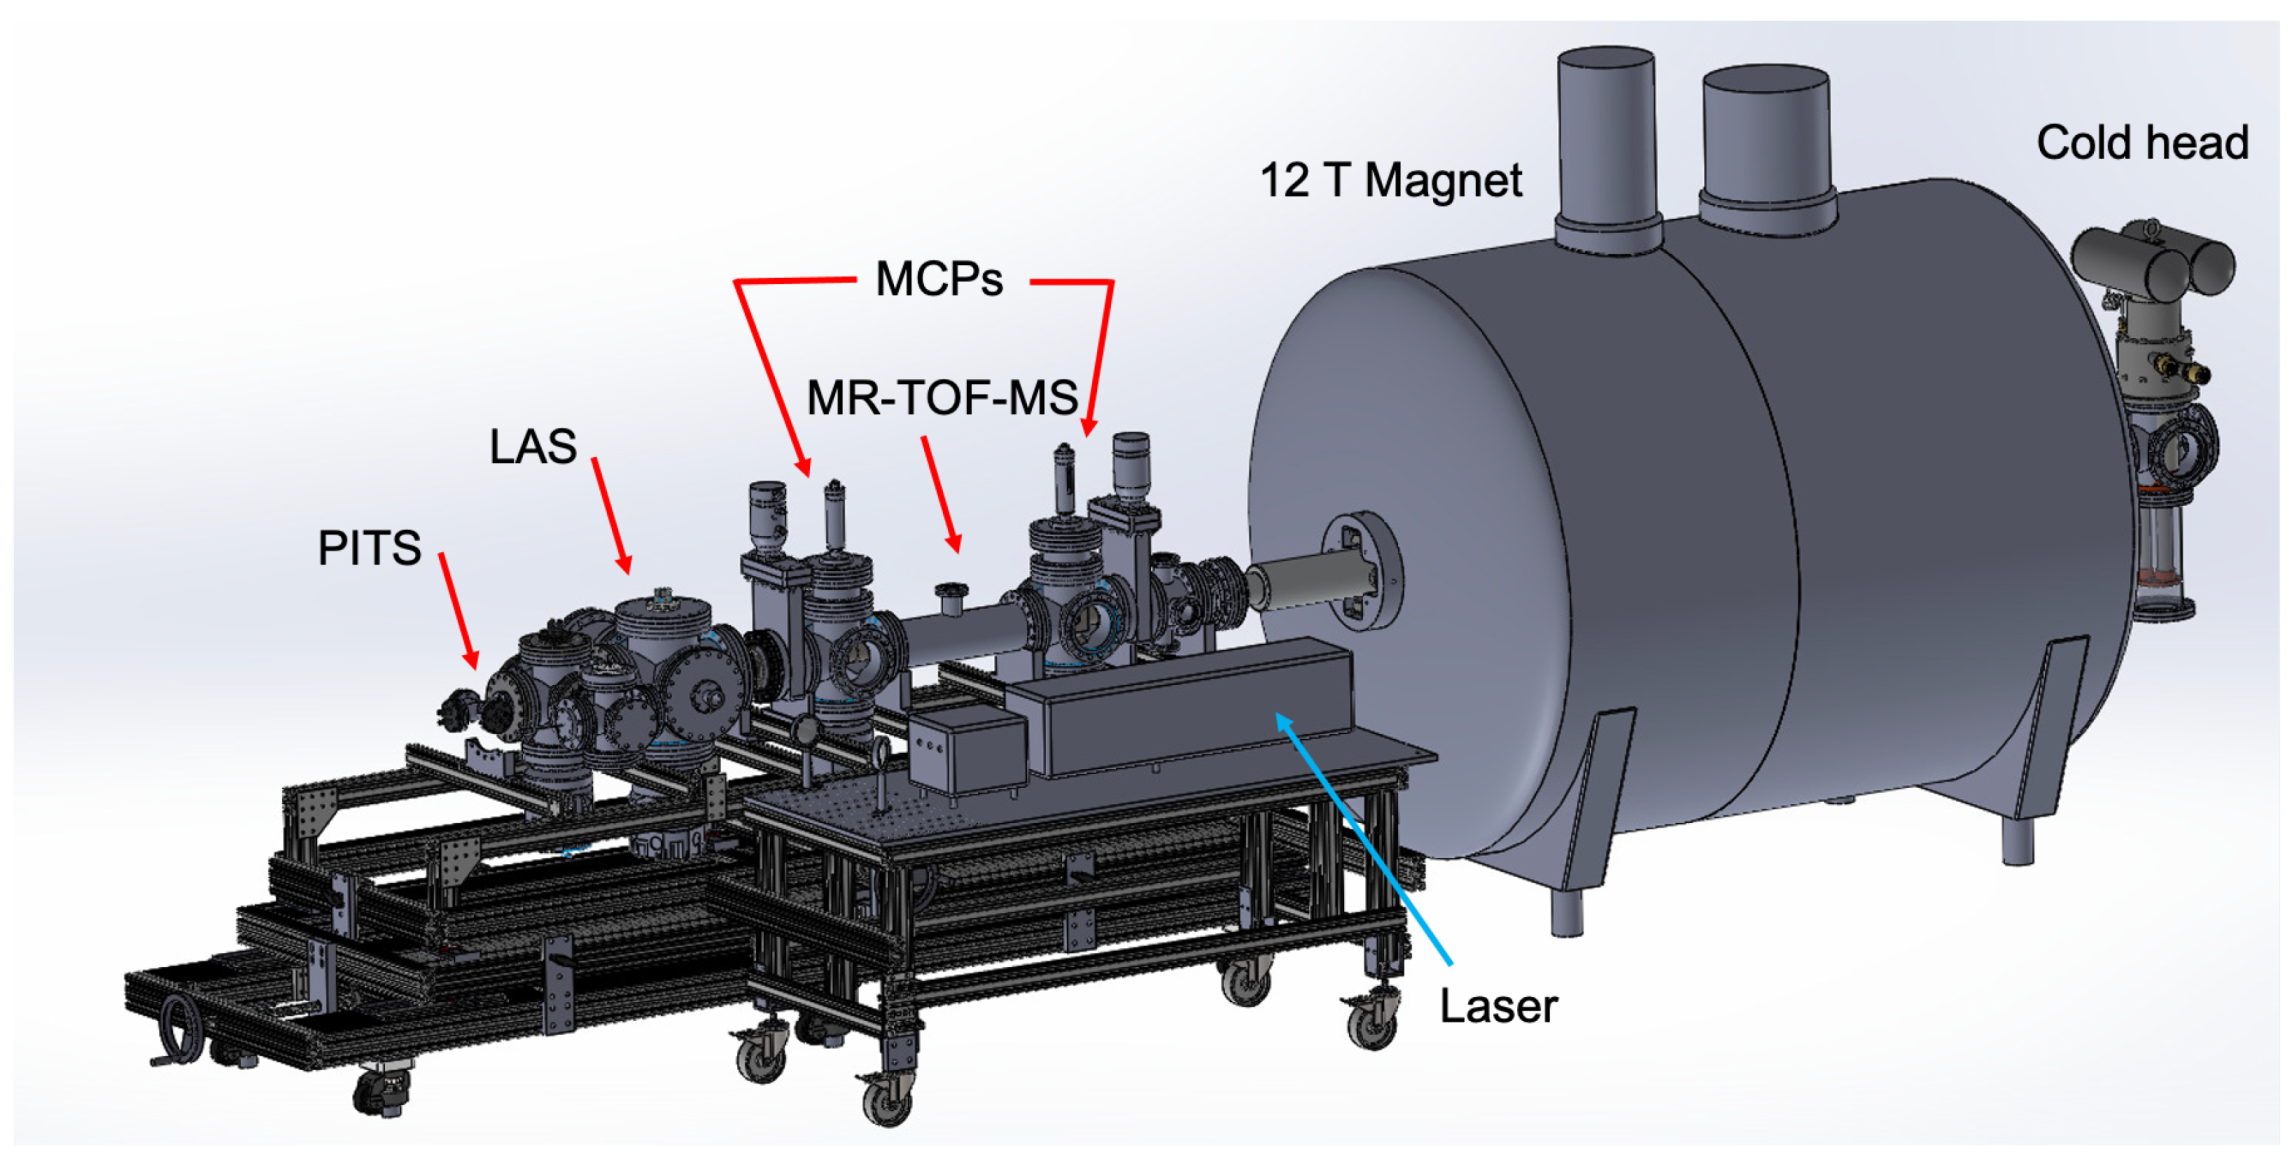
2. Materials and Methods
2.1. Ion Sources
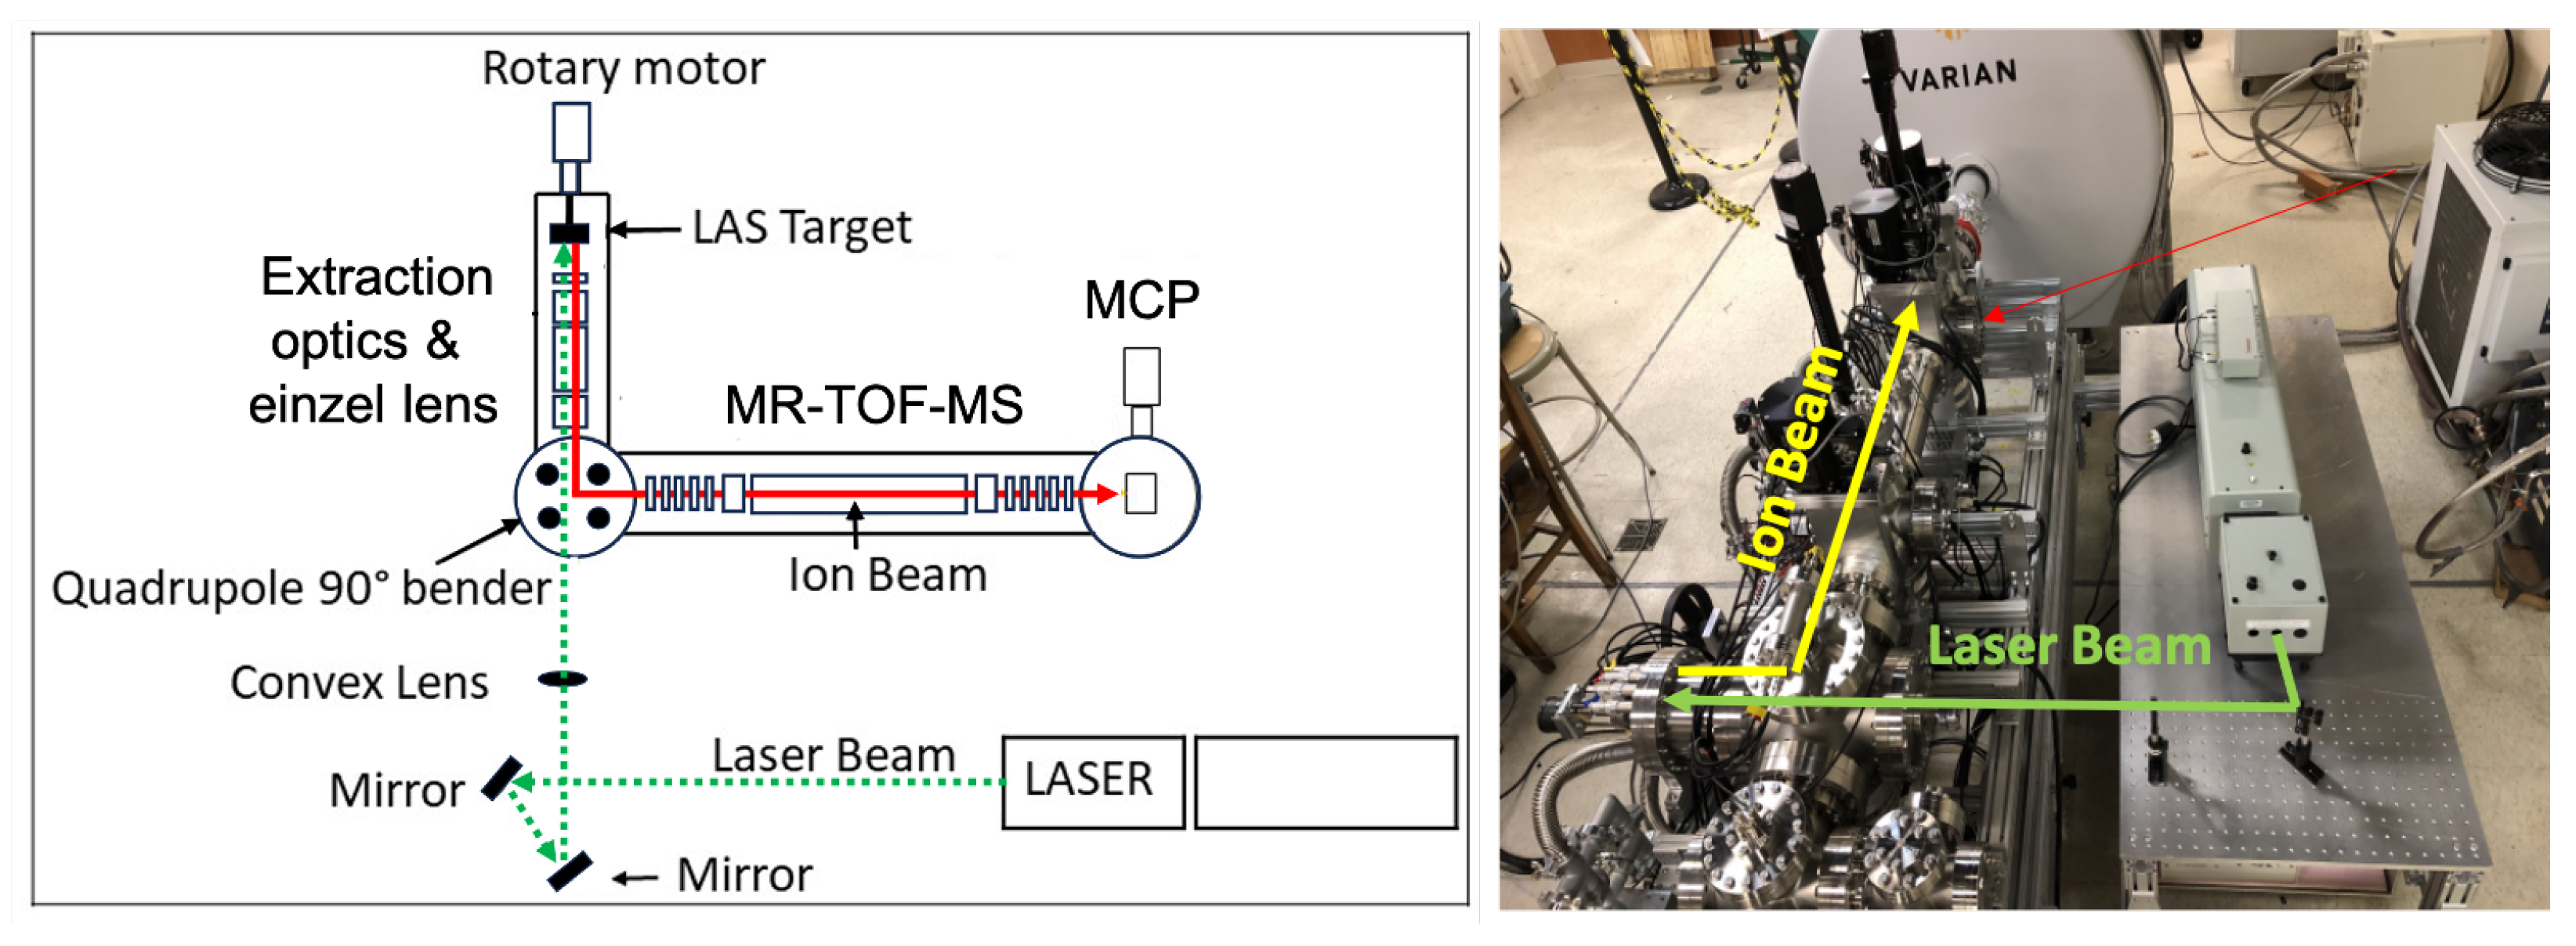
2.1.1. Laser Ablation Source (LAS)
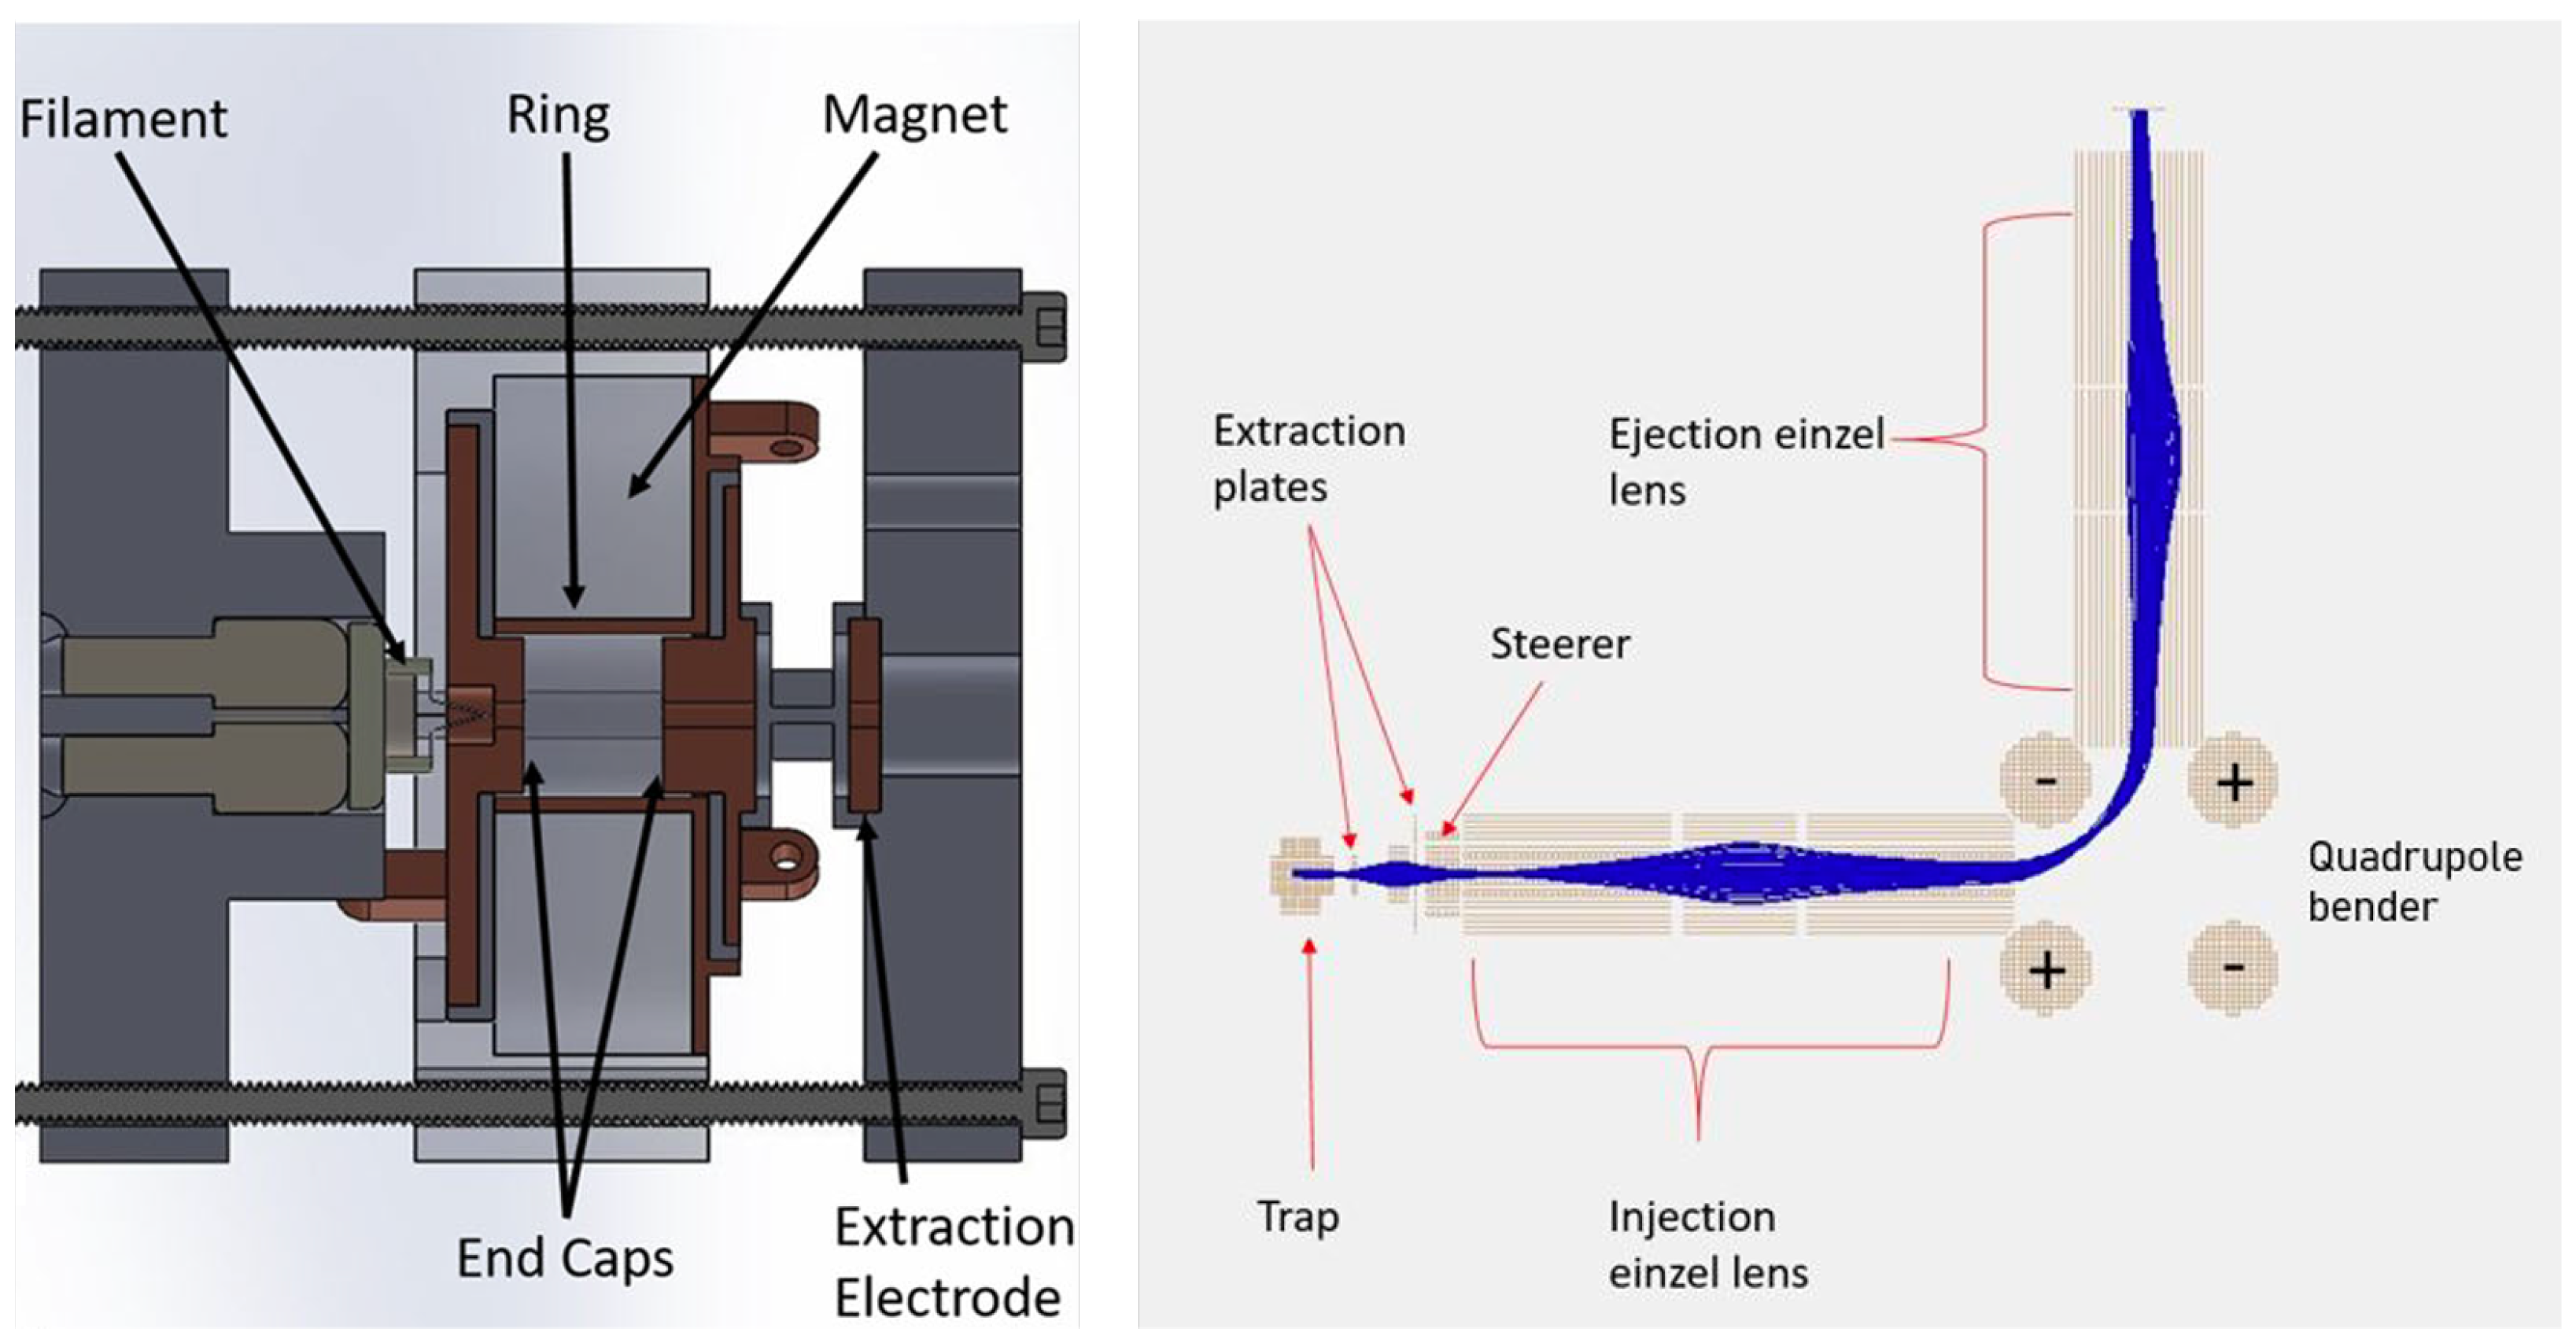
2.1.2. Penning Ion Trap Source (PITS)
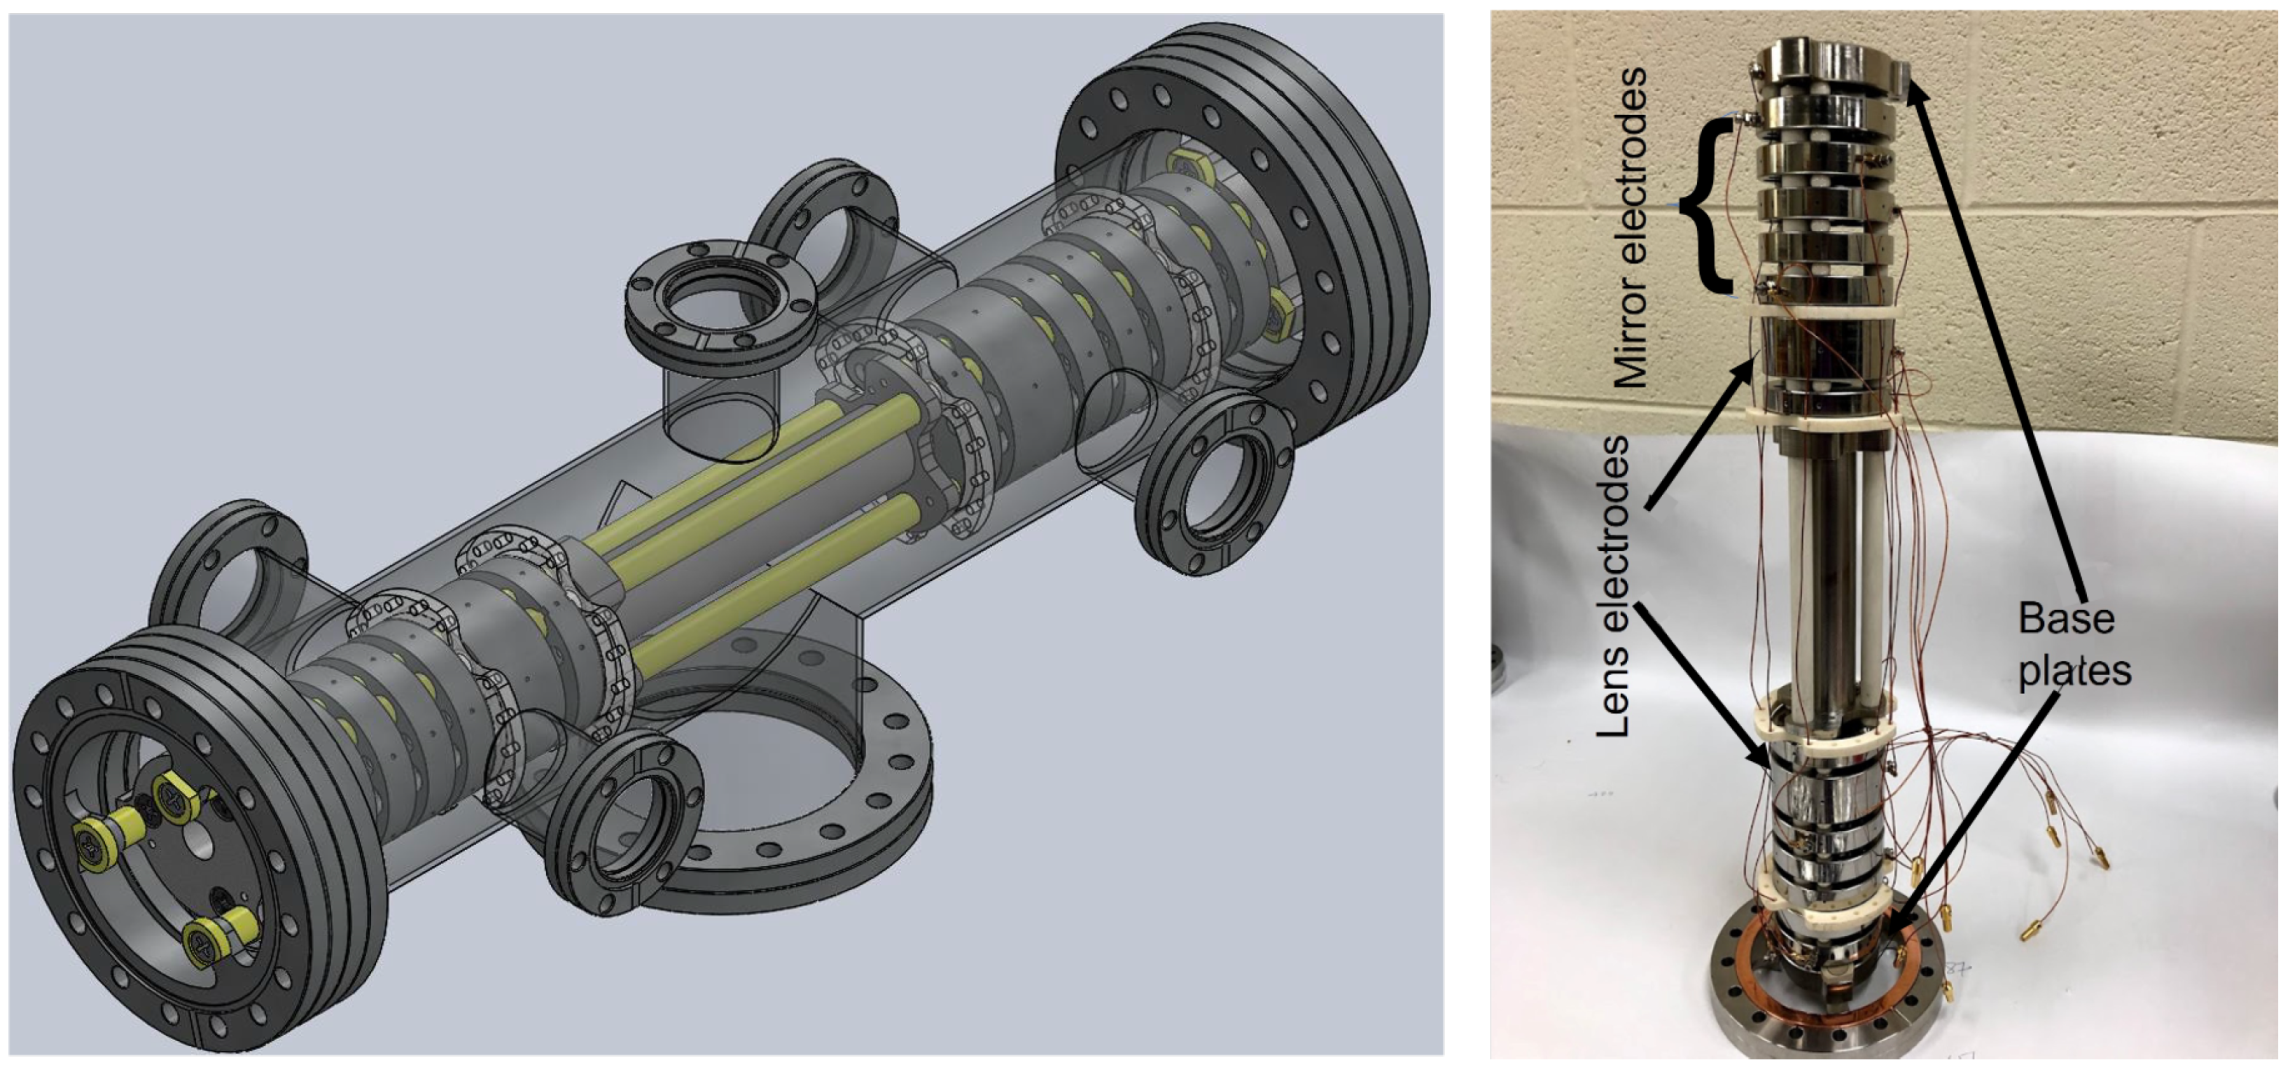
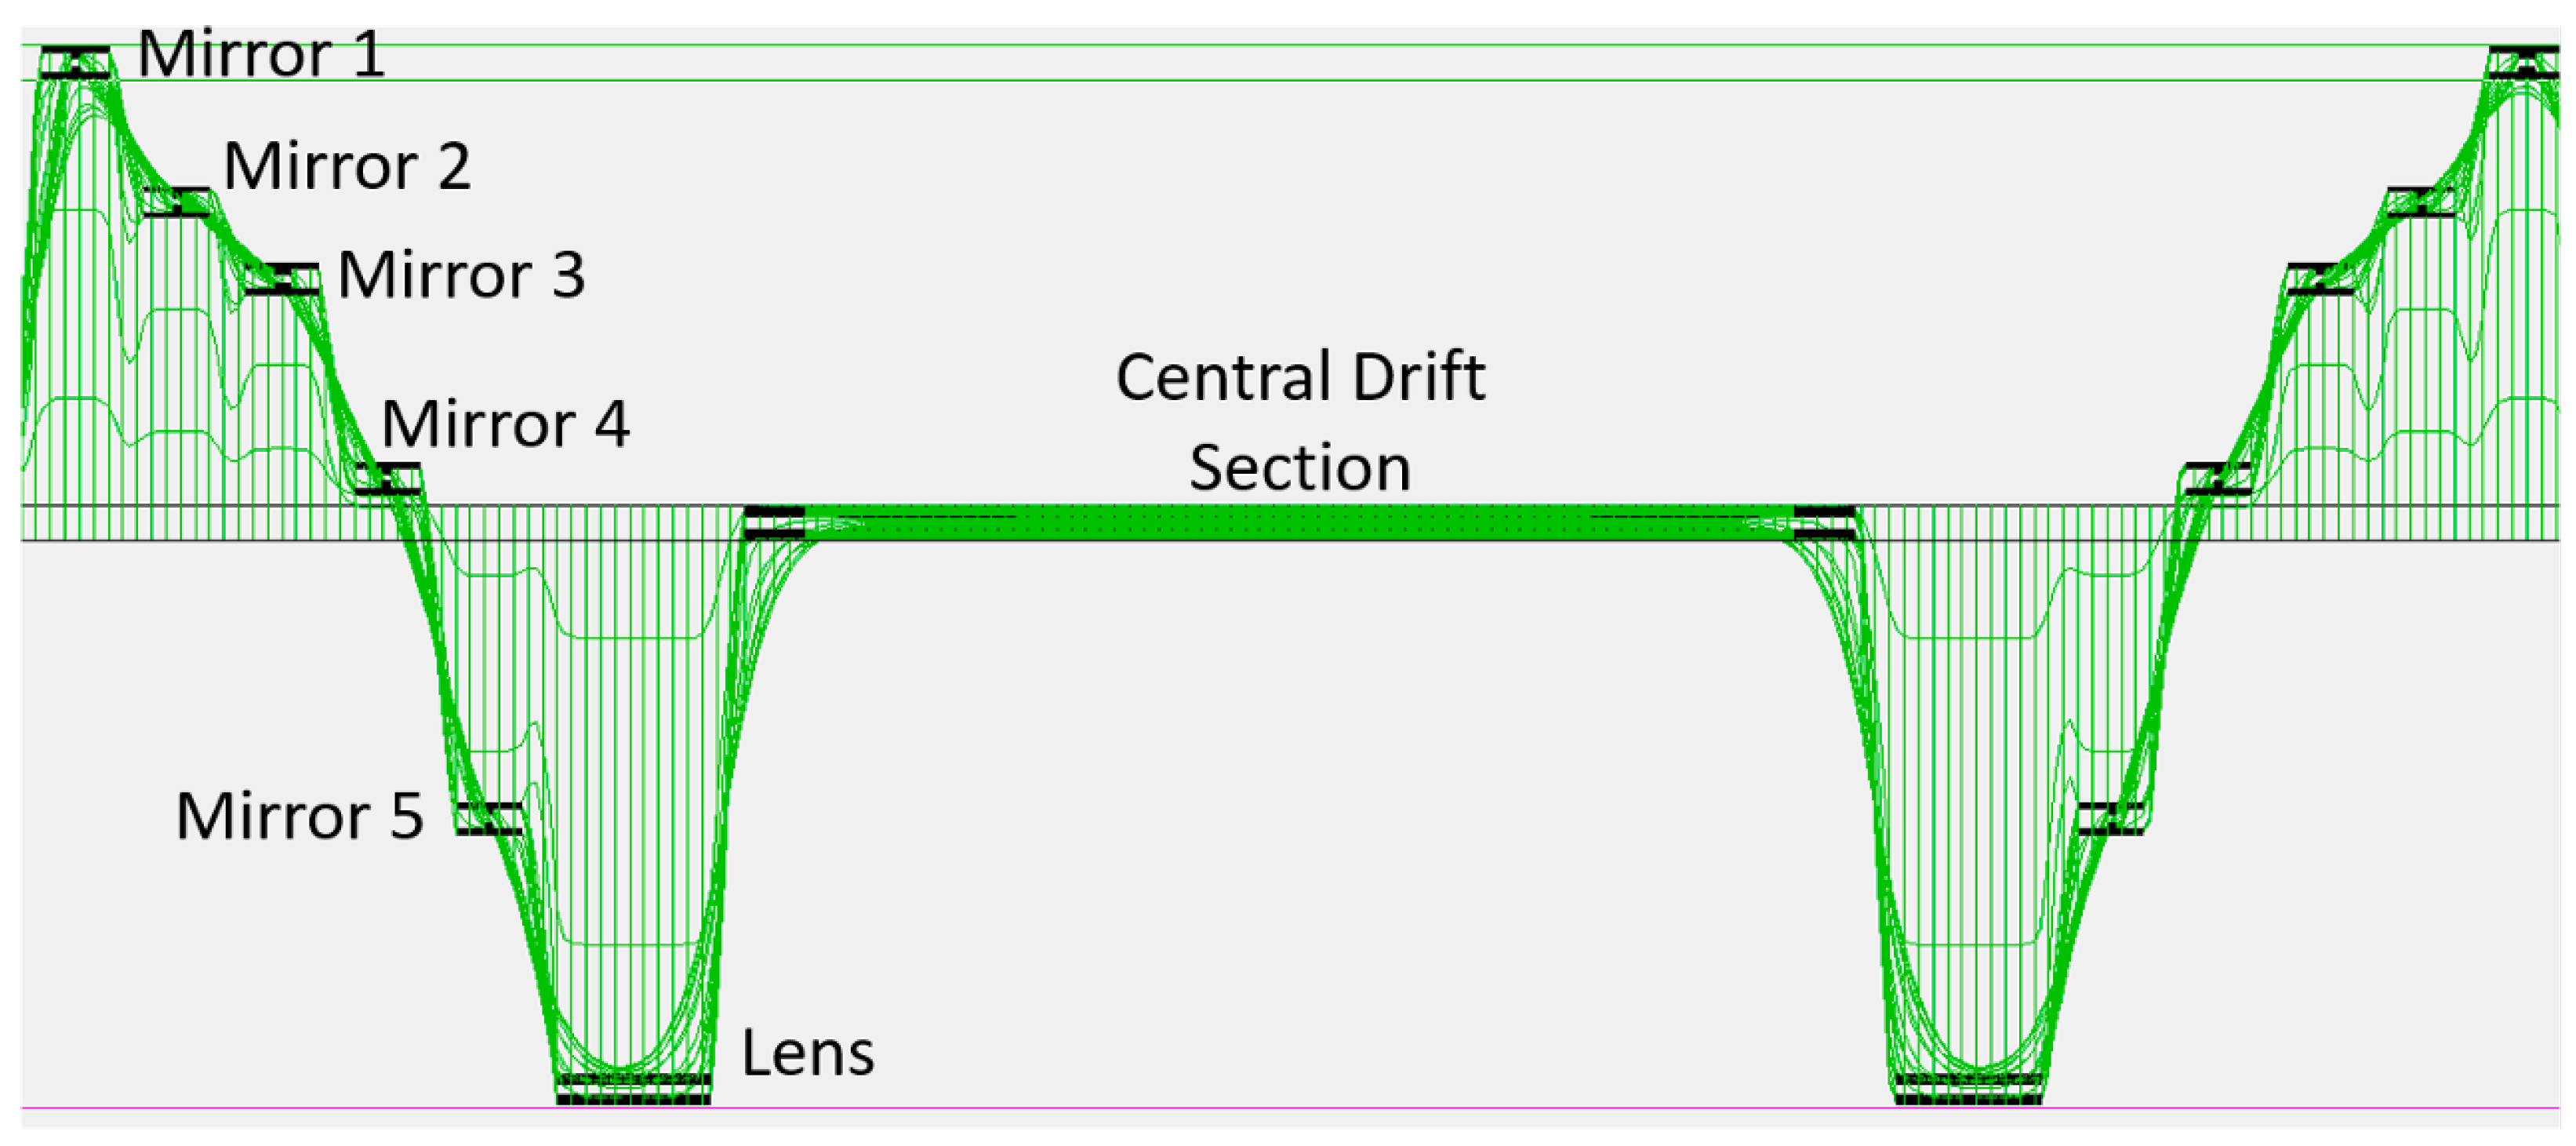
2.2. Multi-Reflection Time-of-Flight Mass Separator (MR-TOF-MS)
2.3. CHIP-TRAP Penning Traps
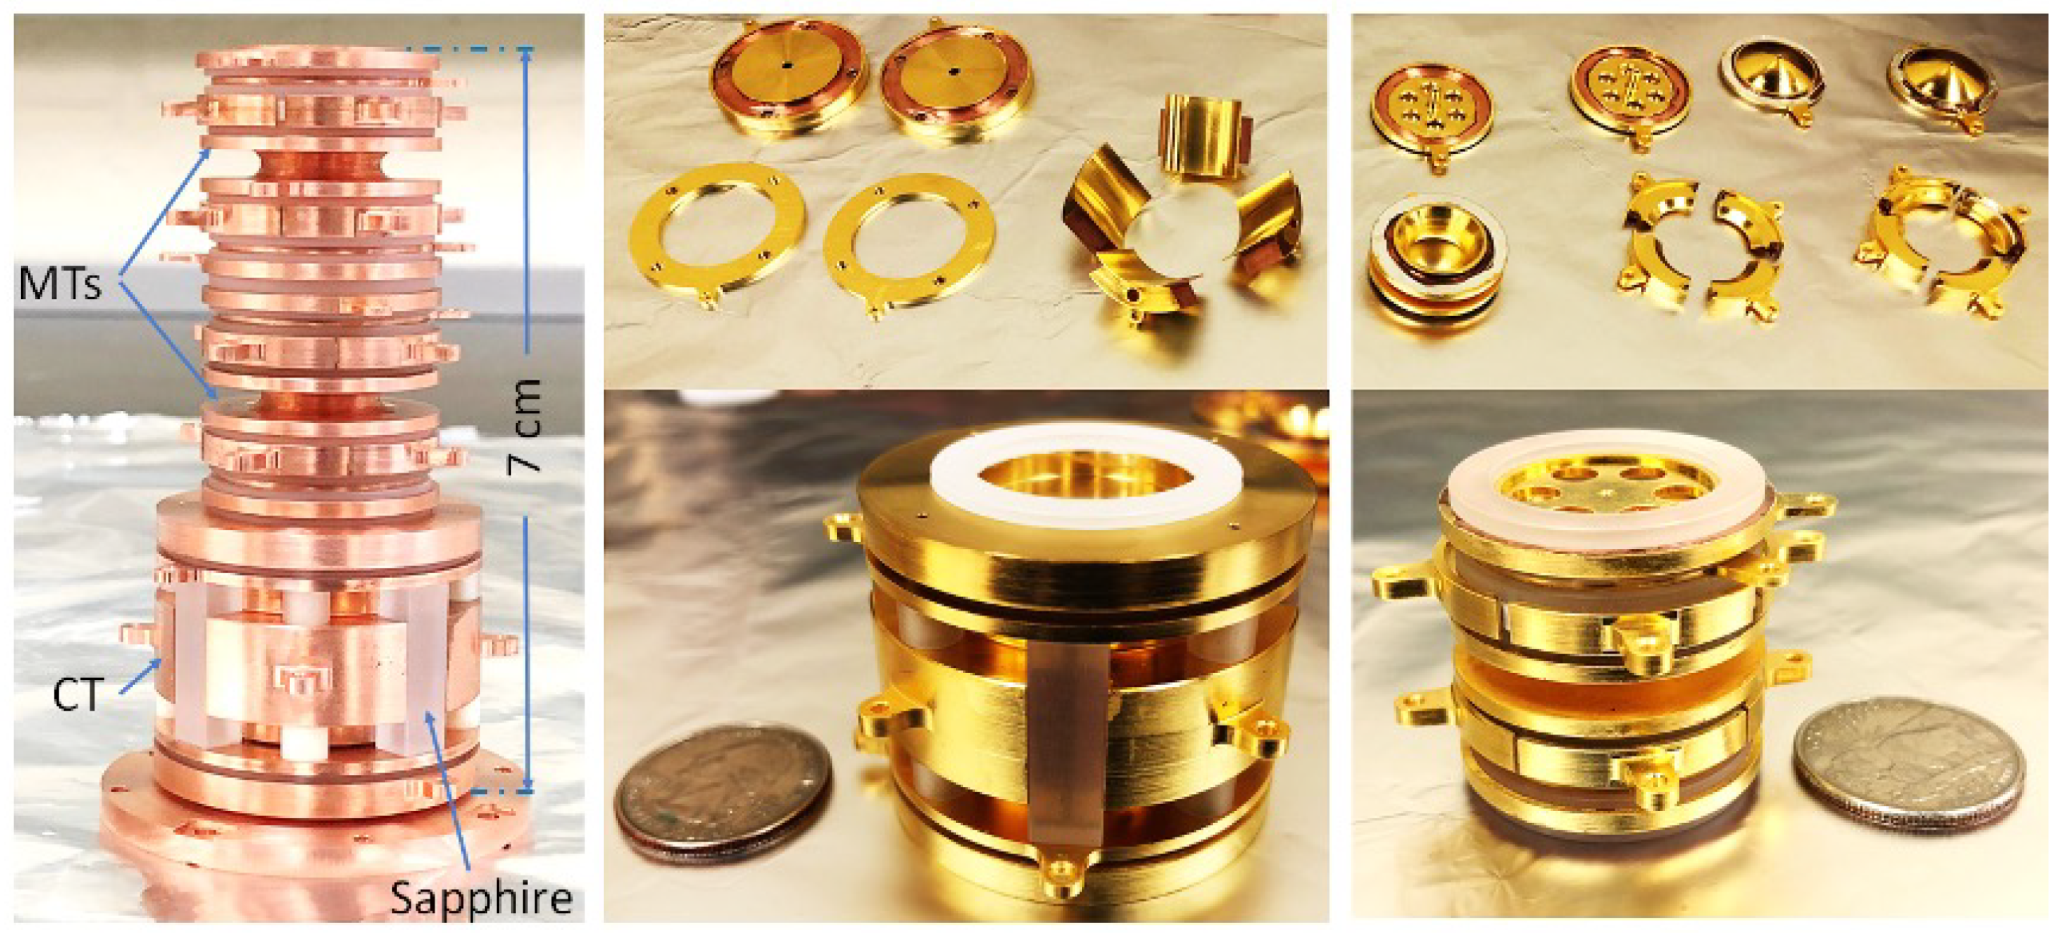
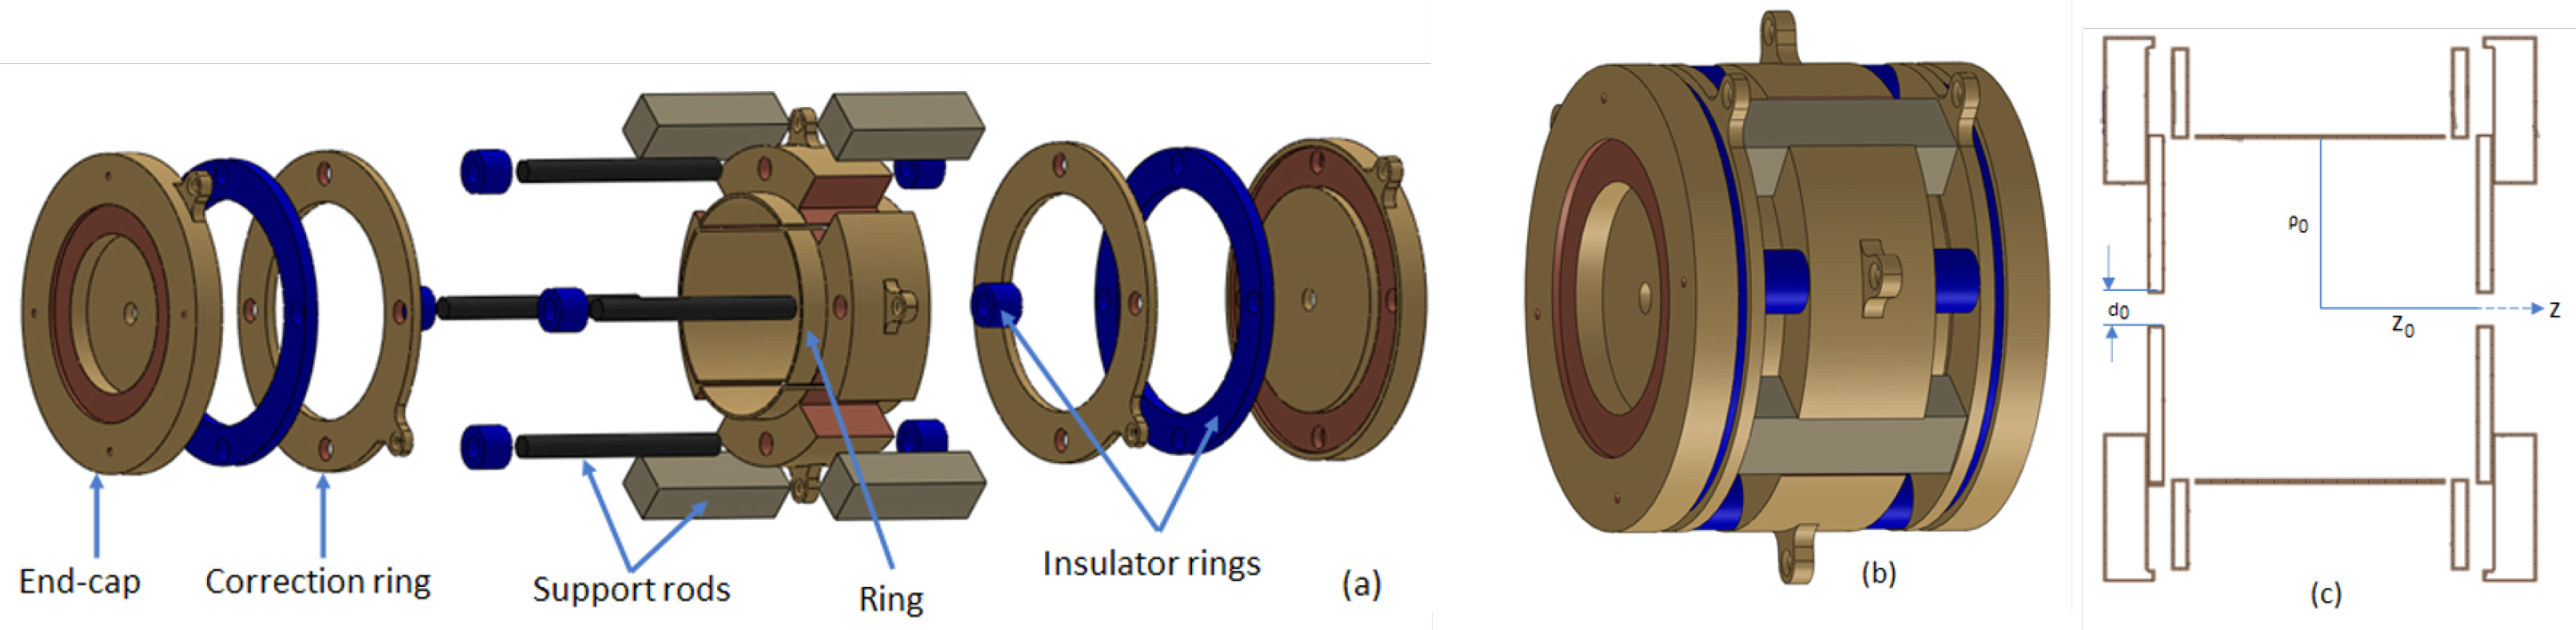
2.3.1. Capture Trap
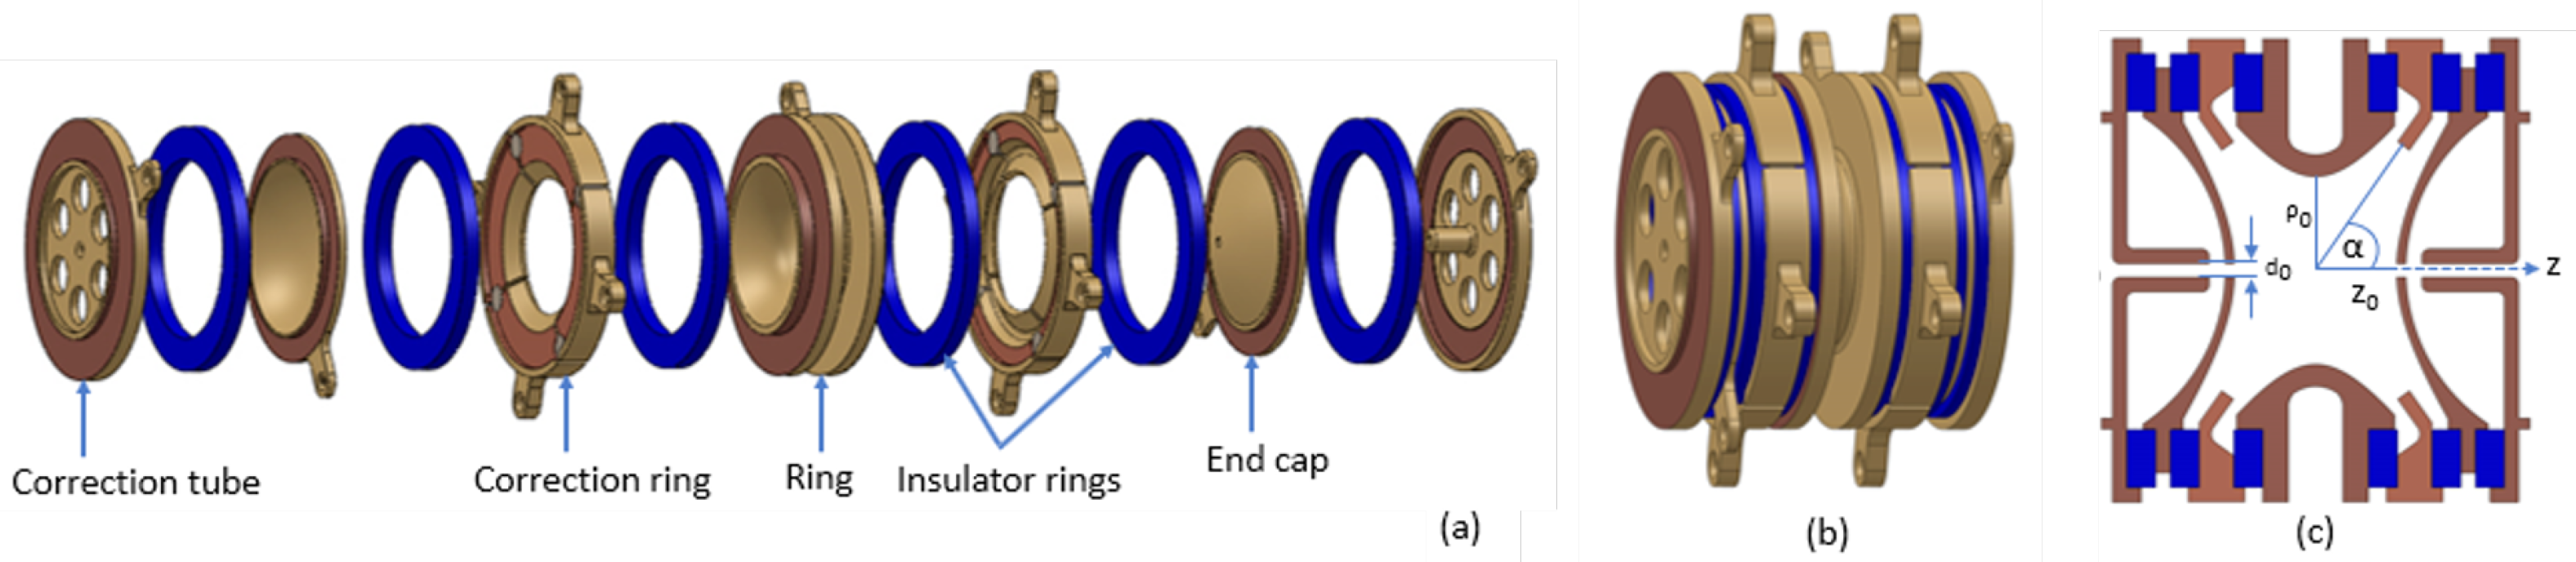
2.3.2. Measurement Traps
3. Results
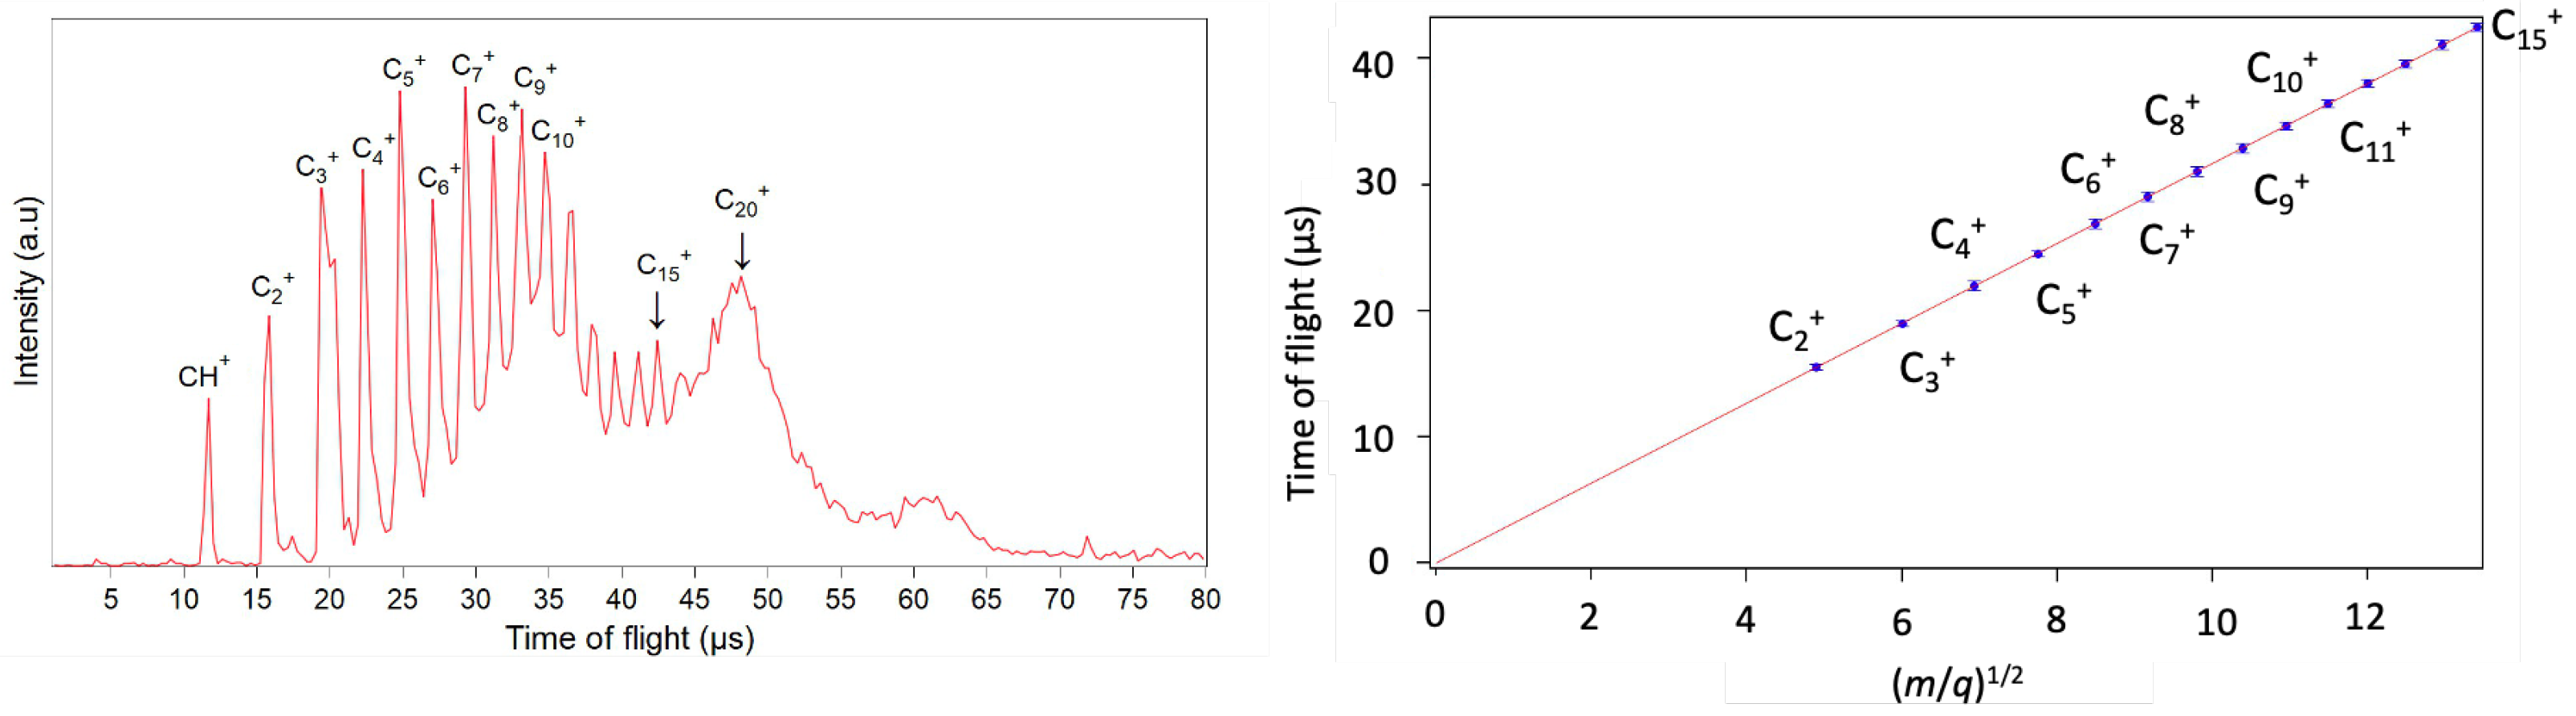
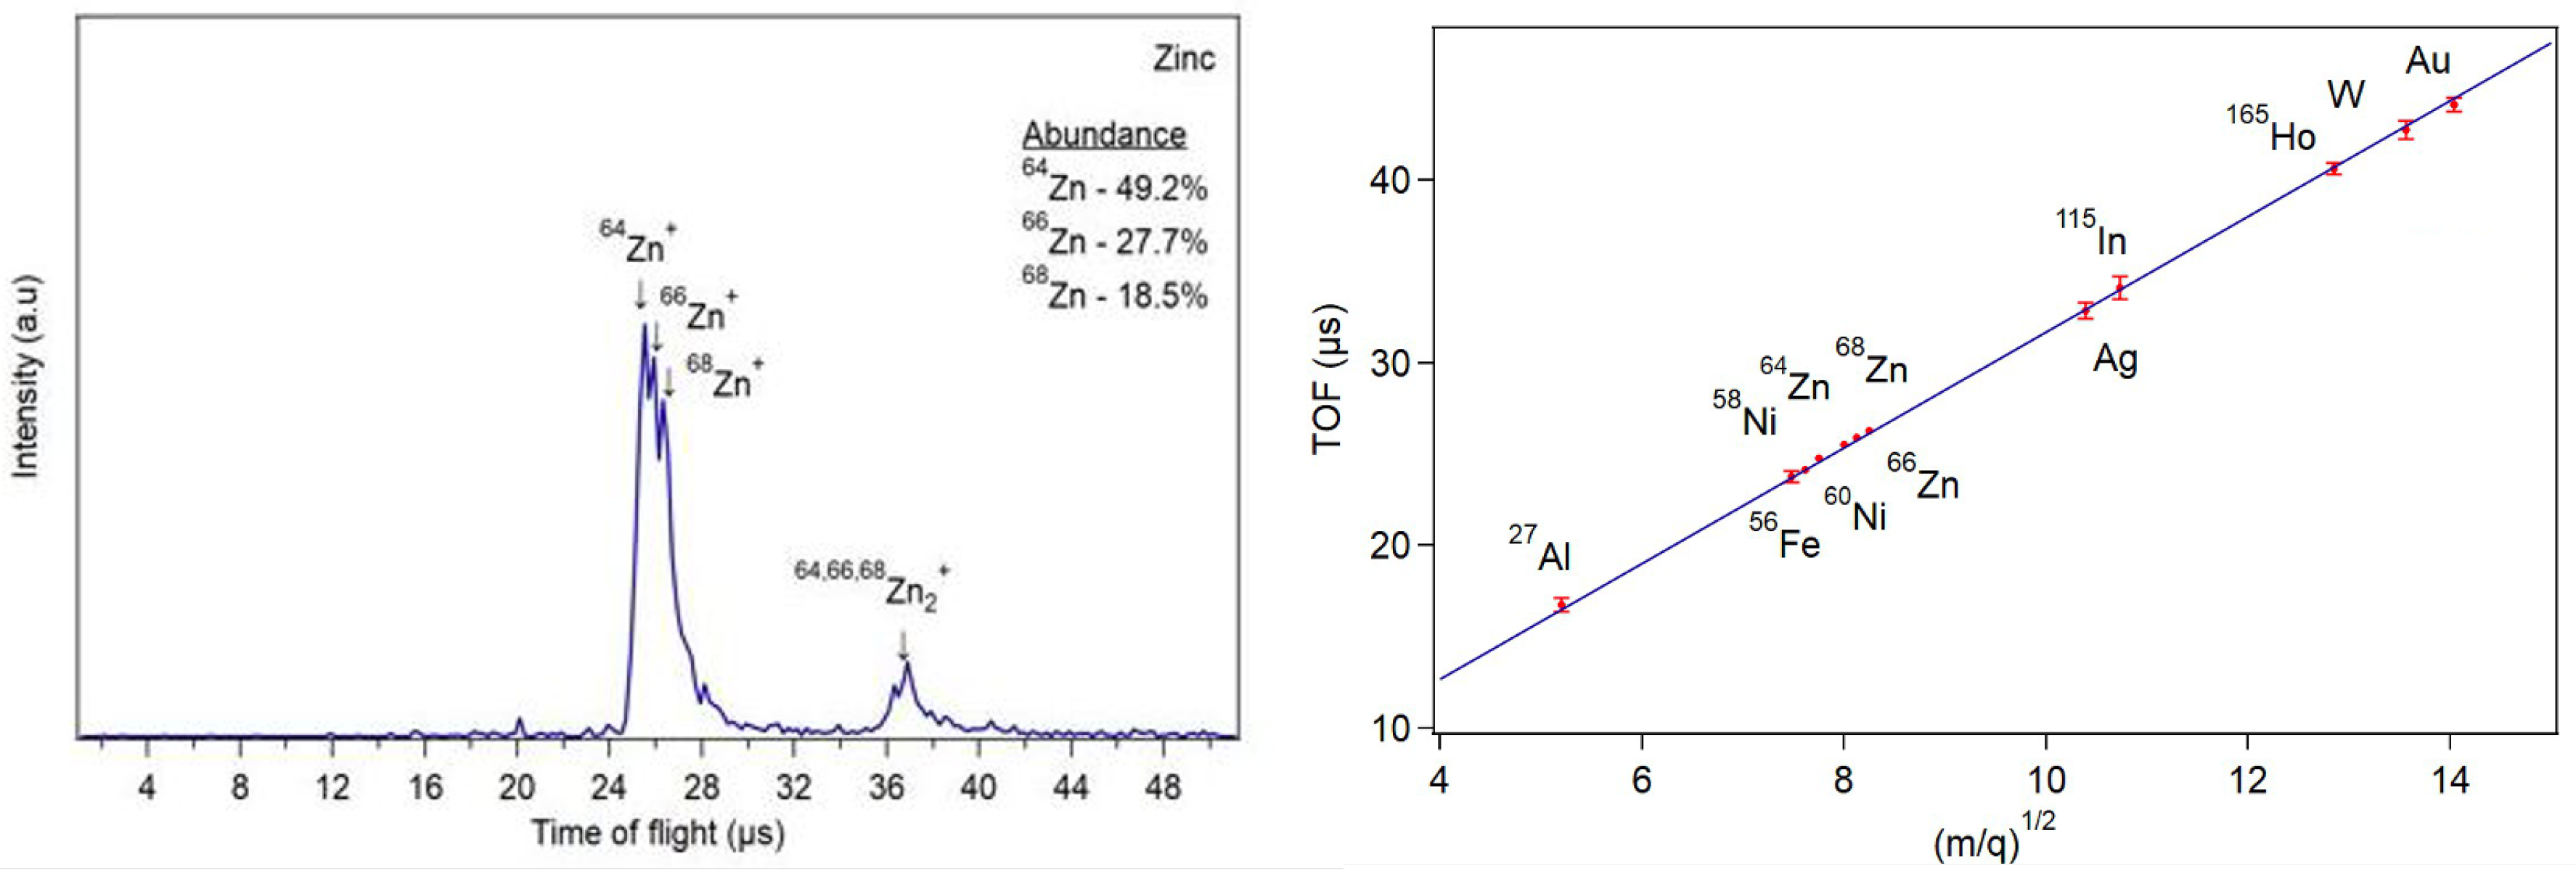
3.1. LAS
3.2. PITS
3.3. MR-TOF-MS
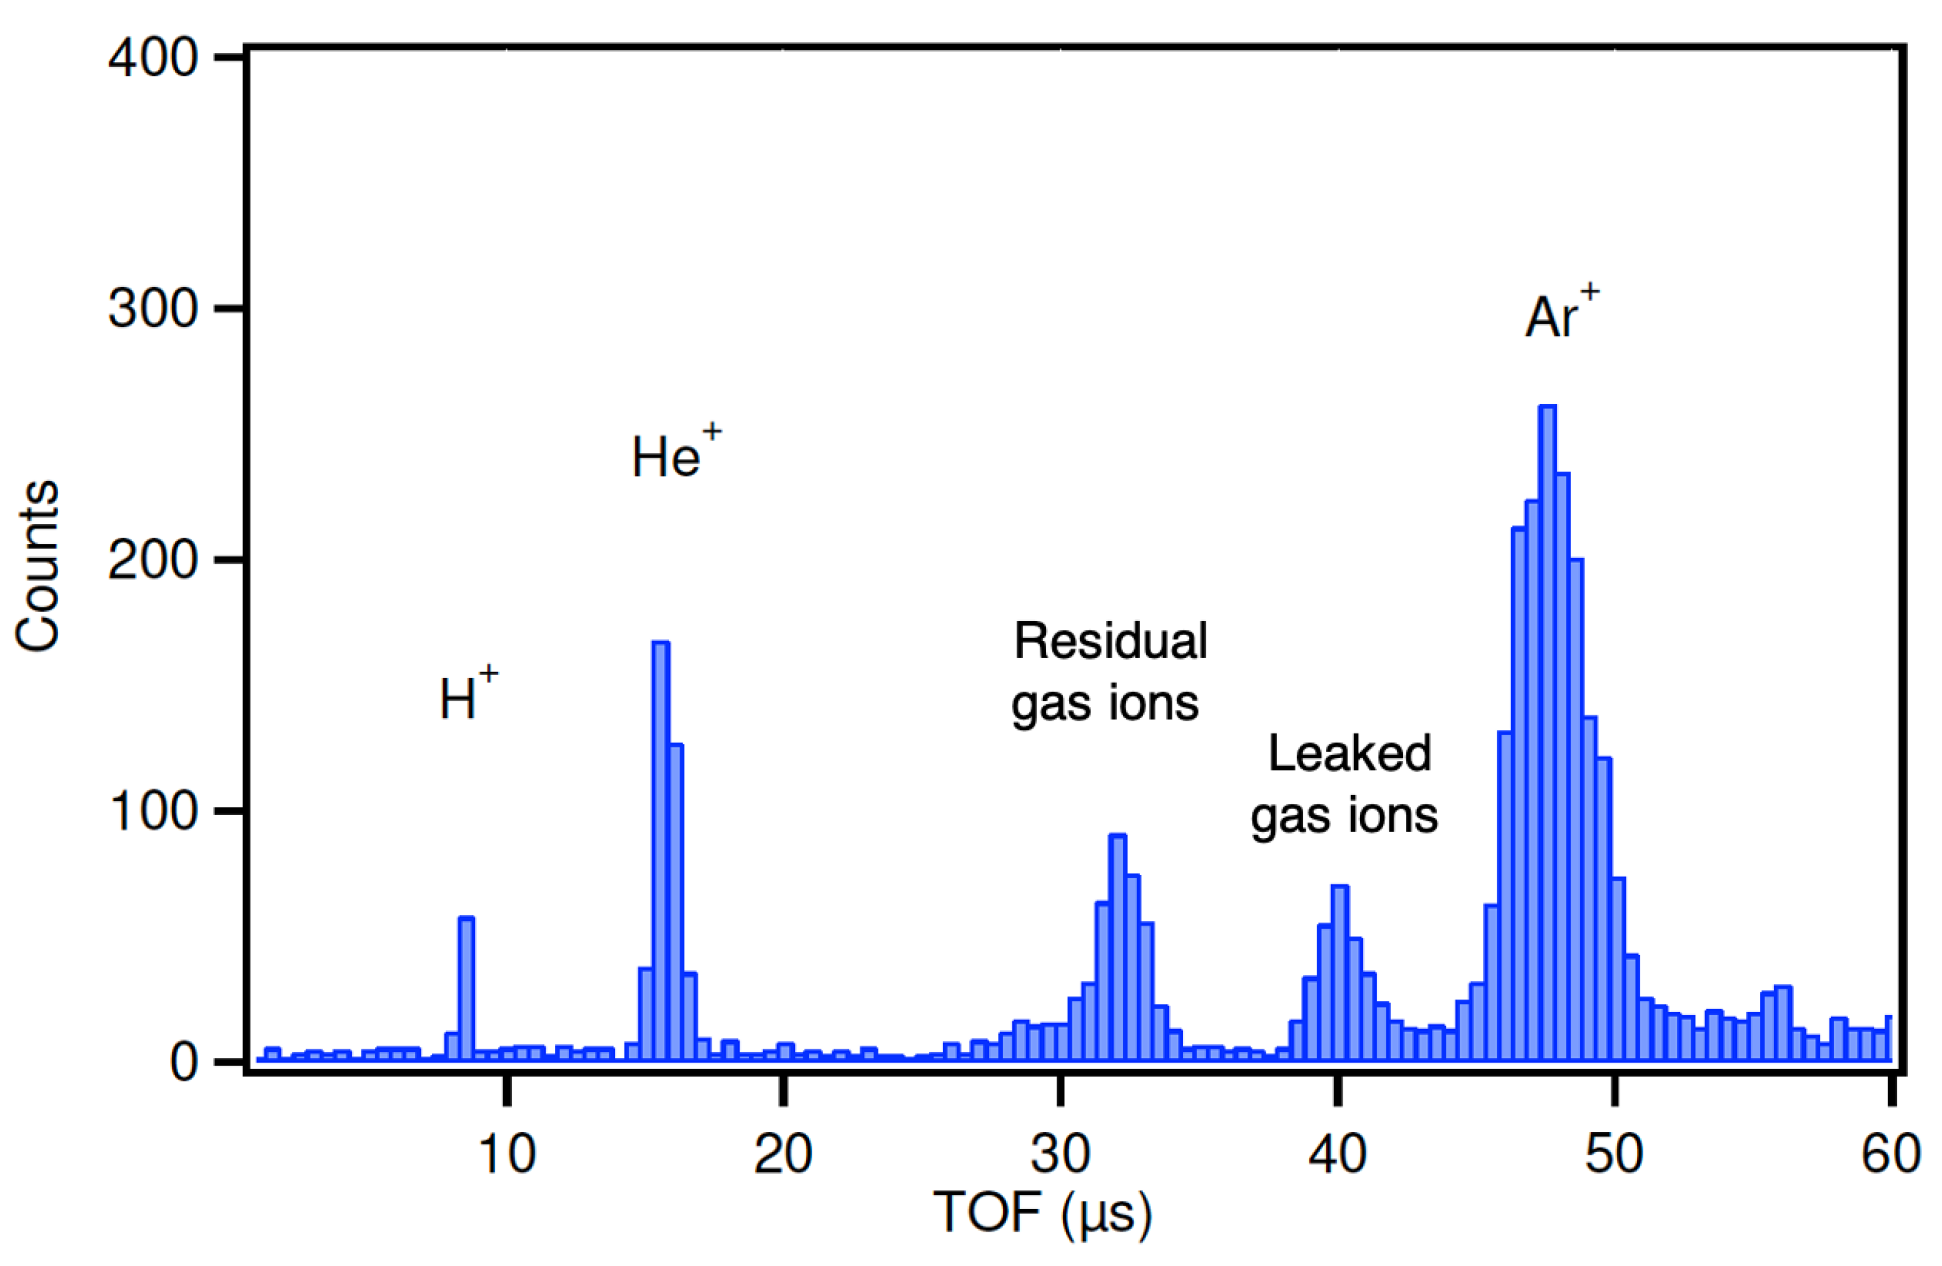
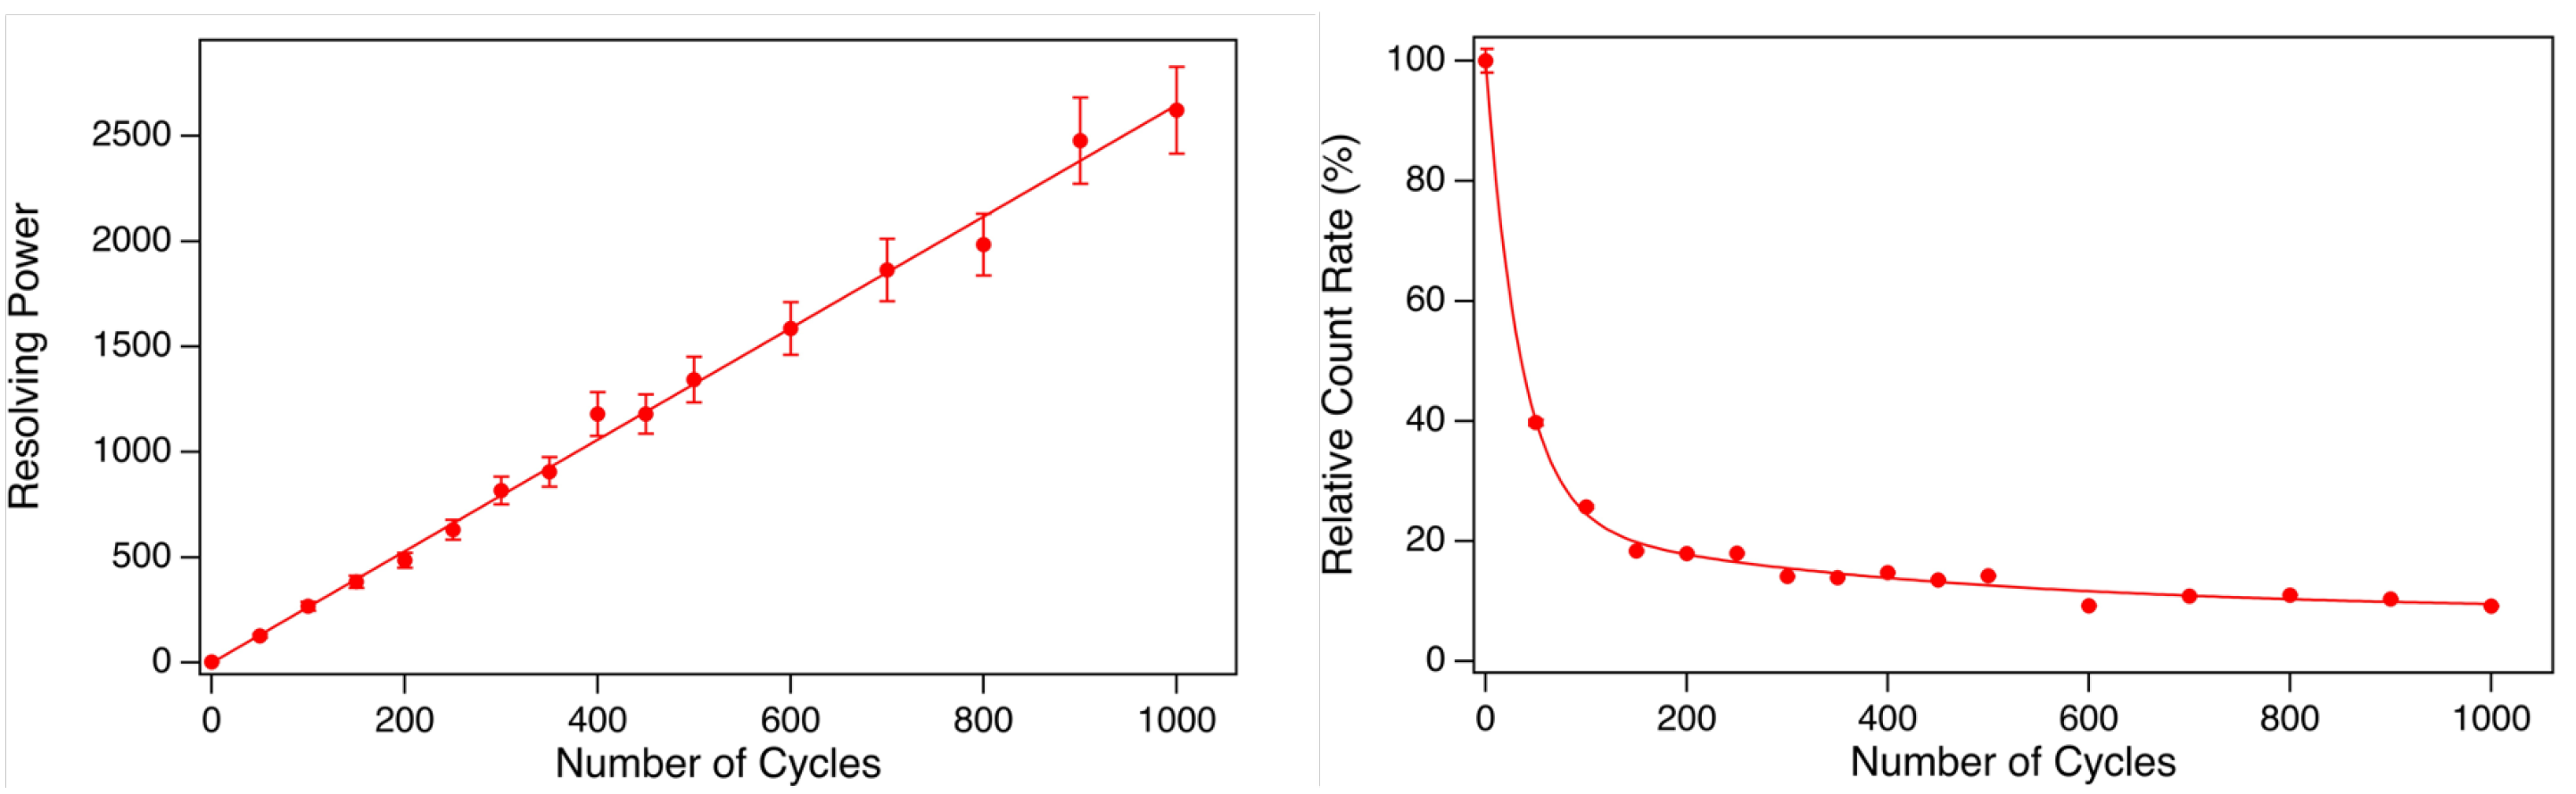
3.4. Capture Trap
4. Discussion
Author Contributions
Funding
Acknowledgments
Conflicts of Interest
| 1 | Here, we consider only positive ions, although negative ions and other charged particles can be trapped. |
References
- Blaum, K. High-accuracy mass spectrometry with stored ions. Phys. Rep. 2006, 425, 1–78. [Google Scholar] [CrossRef]
- Blaum, K.; Dilling, J.; Nörtershäuser, W. Precision atomic physics techniques for nuclear physics with radioactive beams. Phys. Scr. 2013, 2013, 014017. [Google Scholar] [CrossRef]
- Gastaldo, L.; Blaum, K.; Doerr, A.; Duellmann, C.E.; Eberhardt, K.; Eliseev, S.; Enss, C.; Faessler, A.; Fleischmann, A.; Kempf, S.; et al. The electron capture in 163Ho experiment—ECHo. Eur. Phys. J. Spec. Top. 2017, 226, 1623. [Google Scholar] [CrossRef]
- Faverzani, M.; Alpert, B.; Backer, D.; Bennet, D.; Biasotti, M.; Brofferio, C.; Ceriale, V.; Ceruti, G.; Corsini, D.; Day, P.K.; et al. The HOLMES Experiment. J. Low Temp. Phys. 2016, 184, 922. [Google Scholar] [CrossRef]
- Dewey, M.S.; Kessler, E.G.K., Jr.; Deslattes, R.D.; Börner, H.G.; Jentschel, M.; Doll, C.; Mutti, P. Precision measurement of the 29Si, 33S, and 36Cl binding energies. Phys. Rev. C 2006, 73, 044303. [Google Scholar] [CrossRef]
- Krempel, J. A New Spectrometer to Measure the Molar Planck Constant. Ph.D. Thesis, Ludwig-Maximilians-Universität, Munich, Germany, 2010. Available online: https://edoc.ub.uni-muenchen.de/13202/ (accessed on 8 August 2023).
- Brown, L.S.; Gabrielse, G. Precision spectroscopy of a charged particle in an imperfect Penning trap. Phys. Rev. A 1982, 25, 2423–2425. [Google Scholar] [CrossRef]
- Gabrielse, G. Why Is Sideband Mass Spectrometry Possible with Ions in a Penning Trap? Phys. Rev. Lett. 2009, 102, 172501. [Google Scholar] [CrossRef]
- Gräff, G.; Kalinowsky, H.; Traut, J. A direct determination of the proton electron mass ratio. Z. Phys. A Atoms Nucl. 1980, 297, 35–39. [Google Scholar] [CrossRef]
- König, M.; Bollen, G.; Kluge, H.J.; Otto, T.; Szerypo, J. Quadrupole excitation of stored ion motion at the true cyclotron frequency. Int. J. Mass Spectrom. Ion Process. 1995, 142, 95–116. [Google Scholar] [CrossRef]
- Bollen, G.; Kluge, H.J.; Otto, T.; Savard, G.; Stolzenberg, H. Ramsey technique applied in a Penning trap mass spectrometer. Nucl. Instrum. Methods Phys. Res. Sect. B Beam Interact. Mater. Atoms. 1992, 70, 490–493. [Google Scholar] [CrossRef]
- George, S.; Blaum, K.; Herfurth, F.; Herlert, A.; Kretzschmar, M.; Nagy, S.; Schwarz, S.; Schweikhard, L.; Yazidjian, C. The Ramsey method in high-precision mass spectrometry with Penning traps: Experimental results. Int. J. Mass Spectrom. 2007, 264, 110–121. [Google Scholar] [CrossRef]
- Kretzschmar, M. The Ramsey method in high-precision mass spectrometry with Penning traps: Theoretical foundations. Int. J. Mass Spectrom. 2007, 264, 122–145. [Google Scholar] [CrossRef]
- Eliseev, S.; Blaum, K.; Block, M.; Droese, C.; Goncharov, M.; Minaya Ramirez, E.; Nesterenko, D.A.; Novikov, Y.N.; Schweikhard, L. Phase-Imaging Ion-Cyclotron-Resonance Measurements for Short-Lived Nuclides. Phys. Rev. Lett. 2013, 110, 082501. [Google Scholar] [CrossRef]
- Eliseev, S.; Blaum, K.; Block, M.; Dörr, A.; Droese, C.; Eronen, T.; Goncharov, M.; Höcker, M.; Ketter, J.; Ramirez, E.M.; et al. A phase-imaging technique for cyclotron-frequency measurements. Appl. Phys. B 2014, 114, 107–128. [Google Scholar] [CrossRef]
- Moore, F.L.; Brown, L.S.; Farnham, D.L.; Jeon, S.; Schwinberg, P.B.; Van Dyck, R.S. Cyclotron resonance with 10−11 resolution: Anharmonic detection and beating a coherent drive with the noise. Phys. Rev. A 1992, 46, 2653–2667. [Google Scholar] [CrossRef]
- Cornell, E.A.; Weisskoff, R.M.; Boyce, K.R.; Flanagan, R.W.; Lafyatis, G.P.; Pritchard, D.E. Single-ion cyclotron resonance measurement of M(CO+)/M(N). Phys. Rev. Lett. 1989, 63, 1674–1677. [Google Scholar] [CrossRef]
- Shi, W.; Redshaw, M.; Myers, E.G. Atomic masses of 32,33S, 84,86Kr, and 129,132Xe with uncertainties ⩽0.1 ppb. Phys. Rev. A 2005, 72, 022510. [Google Scholar] [CrossRef]
- Heiße, F.; Rau, S.; Köhler-Langes, F.; Quint, W.; Werth, G.; Sturm, S.; Blaum, K. High-precision mass spectrometer for light ions. Phys. Rev. A 2019, 100, 022518. [Google Scholar] [CrossRef]
- Blaum, K.; Bollen, G.; Herfurth, F.; Kellerbauer, A.; Kluge, H.J.; Kuckein, M.; Sauvan, E.; Scheidenberger, C.; Schweikhard, L. Carbon clusters for absolute mass measurements at ISOLTRAP. Eur. Phys. J. A 2002, 15, 245–248. [Google Scholar] [CrossRef]
- Chaudhuri, A.; Block, M.; Eliseev, S.; Ferrer, R.; Herfurth, F.; Martín, A.; Marx, G.; Mukherjee, M.; Rauth, C.; Schweikhard, L.; et al. Carbon-cluster mass calibration at SHIPTRAP. Eur. Phys. J. D 2007, 45, 47–53. [Google Scholar] [CrossRef]
- Elomaa, V.V.; Eronen, T.; Hager, U.; Jokinen, A.; Kessler, T.; Moore, I.D.; Rahaman, S.; Weber, C.; Äystö, J. Development of a carbon-cluster ion source for JYFLTRAP. Nucl. Instrum. Methods Phys. Res. Sect. B Beam Interact. Mater. Atoms. 2008, 266, 4425–4428. [Google Scholar] [CrossRef]
- Scielzo, N.D.; Caldwell, S.; Savard, G.; Clark, J.A.; Deibel, C.M.; Fallis, J.; Gulick, S.; Lascar, D.; Levand, A.F.; Li, G.; et al. Double-β-decay Q values of 130Te, 128Te, and 120Te. Phys. Rev. C 2009, 80, 025501. [Google Scholar] [CrossRef]
- Smorra, C.; Blaum, K.; Eberhardt, K.; Eibach, M.; Ketelaer, J.; Ketter, J.; Knuth, K.; Nagy, S. A carbon-cluster laser ion source for TRIGA-TRAP. J. Phys. B At. Mol. Opt. Phys. 2009, 42, 154028. [Google Scholar] [CrossRef]
- Izzo, C.; Bollen, G.; Bustabad, S.; Eibach, M.; Gulyuz, K.; Morrissey, D.J.; Redshaw, M.; Ringle, R.; Sandler, R.; Schwarz, S.; et al. A laser ablation source for offline ion production at LEBIT. Nucl. Instrum. Methods Phys. Res. Sect. B Beam Interact. Mater. Atoms. 2016, 376, 60–63. [Google Scholar] [CrossRef]
- Eliseev, S.; Blaum, K.; Block, M.; Chenmarev, S.; Dorrer, H.; Düllmann, C.E.; Enss, C.; Filianin, P.E.; Gastaldo, L.; Goncharov, M.; et al. Direct Measurement of the Mass Difference of 163Ho and 163Dy Solves the Q-Value Puzzle for the Neutrino Mass Determination. Phys. Rev. Lett. 2015, 115, 062501. [Google Scholar] [CrossRef] [PubMed]
- Schneider, F.; Beyer, T.; Blaum, K.; Block, M.; Chenmarev, S.; Dorrer, H.; Düllmann, C.E.; Eberhardt, K.; Eibach, M.; Eliseev, S.; et al. Preparatory studies for a high-precision Penning-trap measurement of the 163Ho electron capture Q-value. Eur. Phys. J. A 2015, 51, 89. [Google Scholar] [CrossRef]
- Eibach, M.; Beyer, T.; Blaum, K.; Block, M.; Düllmann, C.E.; Eberhardt, K.; Grund, J.; Nagy, S.; Nitsche, H.; Nörtershäuser, W.; et al. Direct high-precision mass measurements on 241,243Am, 244Pu, and 249Cf. Phys. Rev. C 2014, 89, 064318. [Google Scholar] [CrossRef]
- Bhandari, R.; Horana Gamage, M.; Gamage, N.D.; Redshaw, M. Investigation of Ho ion production with a laser ablation ion source. J. Phys. Conf. Ser. 2022, 2244, 012076. [Google Scholar] [CrossRef]
- Bhandari, R.; Bollen, G.; Brunner, T.; Gamage, N.D.; Hamaker, A.; Hockenbery, Z.; Gamage, M.H.; Keblbeck, D.K.; Leach, K.G.; Puentes, D.; et al. First direct 7Be electron capture Q-value measurement towards high-precision BSM neutrino physics searches. Phys. Rev. Lett. 2023. to be submitted. [Google Scholar] [CrossRef]
- Gulyuz, K.; Ariche, J.; Bollen, G.; Bustabad, S.; Eibach, M.; Izzo, C.; Novario, S.J.; Redshaw, M.; Ringle, R.; Sandler, R.; et al. Determination of the direct double-β-decay Q value of 96Zr and atomic masses of 90-92,94,96Zr and 92,94-98,100Mo. Phys. Rev. C 2015, 91, 055501. [Google Scholar] [CrossRef]
- Eibach, M.; Bollen, G.; Gulyuz, K.; Izzo, C.; Redshaw, M.; Ringle, R.; Sandler, R.; Valverde, A.A. Double resonant enhancement in the neutrinoless double-electron capture of 190Pt. Phys. Rev. C 2016, 94, 015502. [Google Scholar] [CrossRef]
- Sandler, R.; Bollen, G.; Gamage, N.D.; Hamaker, A.; Izzo, C.; Puentes, D.; Redshaw, M.; Ringle, R.; Yandow, I. Investigation of the potential ultralow Q-value β-decay candidates 89Sr and 139Ba using Penning trap mass spectrometry. Phys. Rev. C 2019, 100, 024309. [Google Scholar] [CrossRef]
- Gamage, N.D.; Bollen, G.; Eibach, M.; Gulyuz, K.; Izzo, C.; Kandegedara, R.M.E.B.; Redshaw, M.; Ringle, R.; Sandler, R.; Valverde, A.A. Precise determination of the 113Cd fourth-forbidden non-unique β-decay Q value. Phys. Rev. C 2016, 94, 025505. [Google Scholar] [CrossRef]
- Kandegedara, R.M.E.B.; Bollen, G.; Eibach, M.; Gamage, N.D.; Gulyuz, K.; Izzo, C.; Redshaw, M.; Ringle, R.; Sandler, R.; Valverde, A.A. β-decay Q values among the A = 50 Ti-V-Cr isobaric triplet and atomic masses of 46,47,49,50Ti,50,51V, and 50,52--54Cr. Phys. Rev. C 2017, 96, 044321. [Google Scholar] [CrossRef]
- Sandler, R.; Bollen, G.; Dissanayake, J.; Eibach, M.; Gulyuz, K.; Hamaker, A.; Izzo, C.; Mougeot, X.; Puentes, D.; Quarati, F.G.A.; et al. Direct determination of the 138La β-decay Q value using Penning trap mass spectrometry. Phys. Rev. C 2019, 100, 014308. [Google Scholar] [CrossRef]
- Quarati, F.G.A.; Bollen, G.; Dorenbos, P.; Eibach, M.; Gulyuz, K.; Hamaker, A.; Izzo, C.; Keblbeck, D.K.; Mougeot, X.; Puentes, D.; et al. Measurements and computational analysis of the natural decay of 176Lu. Phys. Rev. C 2023, 107, 024313. [Google Scholar] [CrossRef]
- Amplitude-Laser: Surelite. Available online: https://amplitude-laser.com (accessed on 8 August 2023).
- Redshaw, M.; Bryce, R.A.; Hawks, P.; Gamage, N.D.; Hunt, C.; Kandegedara, R.M.E.B.; Ratnayake, I.S.; Sharp, L. Status and outlook of CHIP-TRAP: The Central Michigan University high precision Penning trap. Nucl. Instrum. Methods Phys. Res. Sect. B Beam Interact. Mater. Atoms. 2016, 376, 302–306. [Google Scholar] [CrossRef]
- Horana Gamage, M.; Arnold, A.L.; Bhandari, R.; Gamage, N.D.; Purcell, Z.; Sandler, R.; Redshaw, M. Design and characterization of Ion sources for CHIP-TRAP. Hyperfine Interact. 2019, 240, 93. [Google Scholar] [CrossRef]
- HTW Hochtemperatur- Werkstoffe GmbH. Available online: http://www.htw-germany.com (accessed on 8 August 2023).
- Horana Gamage, M.; Bhandari, R.; Gamage, N.D.; Keblbeck, D.; Redshaw, M. Design and simulations for a Penning Ion Trap Source for the CHIP-TRAP Mass Spectrometer. J. Phys. Conf. Ser. 2022, 2244, 012087. [Google Scholar] [CrossRef]
- K&J Magnetics, Inc. Part #RXC88. Available online: https://www.kjmagnetics.com (accessed on 8 August 2023).
- Gabrielse, G.; Mackintosh, F. Cylindrical Penning traps with orthogonalized anharmonicity compensation. Int. J. Mass Spectrom. Ion Process. 1984, 57, 1–17. [Google Scholar] [CrossRef]
- Ted Pella, Inc. Part #1403. Available online: https://www.tedpella.com (accessed on 8 August 2023).
- Gamage, M.H. High Precision Mass Measurement of 75As to Identify Potential Ultra-low Q value Electron Capture Decay Branch in 75Se and Commissioning of a Penning Ion Trap Source for CHIP-TRAP at CMU. Ph.D. Thesis, Central Michigan University, Mount Pleasant, MI, USA, 2023. Available online: https://scholar.google.com/scholar?cluster=3333153868775418497&hl=en&oi=scholarr (accessed on 8 August 2023).
- Wolf, R.N.; Eritt, M.; Marx, G.; Schweikhard, L. A multi-reflection time-of-flight mass separator for isobaric purification of radioactive ion beams. Hyperfine Interact. 2011, 199, 115–122. [Google Scholar] [CrossRef]
- Ito, Y.; Schury, P.; Wada, M.; Naimi, S.; Sonoda, T.; Mita, H.; Arai, F.; Takamine, A.; Okada, K.; Ozawa, A.; et al. Single-reference high-precision mass measurement with a multireflection time-of-flight mass spectrograph. Phys. Rev. C 2013, 88, 011306. [Google Scholar] [CrossRef]
- Schultz, B.E.; Kelly, J.M.; Nicoloff, C.; Long, J.; Ryan, S.; Brodeur, M. Construction and simulation of a multi-reflection time-of-flight mass spectrometer at the University of Notre Dame. Nucl. Instrum. Methods Phys. Res. Sect. B Beam Interact. Mater. Atoms. 2016, 376, 251–255. [Google Scholar] [CrossRef]
- Wolf, R.N.; Marx, G.; Rosenbusch, M.; Schweikhard, L. Static-mirror ion capture and time focusing for electrostatic ion-beam traps and multi-reflection time-of-flight mass analyzers by use of an in-trap potential lift. Int. J. Mass Spectrom. 2012, 313, 8–14. [Google Scholar] [CrossRef]
- Bradbury, N.E.; Nielsen, R.A. Absolute Values of the Electron Mobility in Hydrogen. Phys. Rev. 1936, 49, 388–393. [Google Scholar] [CrossRef]
- Comisarow, M.B.; Marshall, A.G. Theory of Fourier transform ion cyclotron resonance mass spectroscopy. I. Fundamental equations and low-pressure line shape. J. Chem. Phys. 1975, 64, 110. [Google Scholar] [CrossRef]
- Comisarow, M.B.; Marshall, A.G. Signal modeling for ion cyclotron resonance. J. Chem. Phys. 1978, 69, 4097. [Google Scholar] [CrossRef]
- Marshall, A.G.; Comisarow, M.B.; Parisod, G. Relaxation and spectral line shape in Fourier transform ion resonance spectroscopya. J. Chem. Phys. 1979, 71, 4434. [Google Scholar] [CrossRef]
- Stahl-Electronics. Available online: https://www.stahl-electronics.com (accessed on 8 August 2023).
- Marshall, A.G.; Wang, T.C.L.; Ricca, T.L. Tailored excitation for Fourier transform ion cyclotron mass spectrometry. J. Am. Chem. Soc. 1985, 107, 7893–7897. [Google Scholar] [CrossRef]
- Guan, S.; Marshall, A.G. Stored waveform inverse Fourier transform (SWIFT) ion excitation in trapped-ion mass spectometry: Theory and applications. Int. J. Mass Spectrom. Ion Process. 1996, 157–158, 5–37. [Google Scholar] [CrossRef]
- Kwiatkowski, A.A.; Bollen, G.; Redshaw, M.; Ringle, R.; Schwarz, S. Isobaric beam purification for high precision Penning trap mass spectrometry of radioactive isotope beams with SWIFT. Int. J. Mass Spectrom. 2015, 379, 9–15. [Google Scholar] [CrossRef]
- Hamaker, A.; Bollen, G.; Eibach, M.; Izzo, C.; Puentes, D.; Redshaw, M.; Ringle, R.; Sandler, R.; Schwarz, S.; Yandow, I. SIPT—An ultrasensitive mass spectrometer for rare isotopes. Hyperfine Interact. 2019, 240, 34. [Google Scholar] [CrossRef]
- Ringle, R.; Schwarz, S.; Bollen, G. Penning trap mass spectrometry of rare isotopes produced via projectile fragmentation at the LEBIT facility. Int. J. Mass Spectrom. 2013, 349–350, 87–93. [Google Scholar] [CrossRef]
- Cornell, E.A.; Weisskoff, R.M.; Boyce, K.R.; Pritchard, D.E. Mode coupling in a Penning trap: π pulses and a classical avoided crossing. Phys. Rev. A 1990, 41, 312–315. [Google Scholar] [CrossRef]
- Rainville, S. A Two-Ion Balance for High Precision Mass Spectrometry. Ph.D. Thesis, Massachusetts Institute of Technology, Cambridge, MA, USA, 2003. Available online: https://dspace.mit.edu/handle/1721.1/16934 (accessed on 8 August 2023).
- Thompson, J.K.; Rainville, S.; Pritchard, D.E. Cyclotron frequency shifts arising from polarization forces. Nature 2004, 430, 58–61. [Google Scholar] [CrossRef]
- Rainville, S.; Thompson, J.K.; Myers, E.G.; Brown, J.M.; Dewey, M.S.; Kessler, E.G.; Deslattes, R.D.; Börner, H.G.; Jentschel, M.; Mutti, P.; et al. A direct test of E = mc2. Nature 2005, 438, 1096–1097. [Google Scholar] [CrossRef]
- Lincoln, D.L.; Baker, R.; Benjamin, A.L.; Bollen, G.; Redshaw, M.; Ringle, R.; Schwarz, S.; Sonea, A.; Valverde, A.A. Development of a high-precision Penning trap magnetometer for the LEBIT facility. Int. J. Mass Spectrom. 2015, 379, 1–8. [Google Scholar] [CrossRef]
- Redshaw, M.; Benjamin, A.L.; Bollen, G.; Ferrer, R.; Lincoln, D.L.; Ringle, R.; Schwarz, S.; Valverde, A.A. Fabrication and characterization of field emission points for ion production in Penning trap applications. Int. J. Mass Spectrom. 2015, 379, 187–193. [Google Scholar] [CrossRef]
- Kimball Physics: LaB6. Available online: https://www.kimballphysics.com/product-category/cathodes-emitters/ (accessed on 8 August 2023).
- NF Corp: SA-421F5 Amplfier. Available online: https://www.nfcorp.co.jp/english/pro/mi/loc/pre/sa/index.html (accessed on 8 August 2023).
- Schweihard, L.; Lindinger, M.; Kluge, H.J. Quadrupole-detection FT-ICR mass spectrometry. Int. J. Mass Spectrom. Ion Process. 1990, 98, 25–33. [Google Scholar] [CrossRef][Green Version]
- Gamage, N.D. Design and Commissioning of the CHIP-TRAP Mass Spectrometer at CMU. Ph.D. Thesis, Central Michigan University, Mount Pleasant, MI, USA, 2021. Available online: https://scholarly.cmich.edu/ (accessed on 8 August 2023).


Disclaimer/Publisher’s Note: The statements, opinions and data contained in all publications are solely those of the individual author(s) and contributor(s) and not of MDPI and/or the editor(s). MDPI and/or the editor(s) disclaim responsibility for any injury to people or property resulting from any ideas, methods, instructions or products referred to in the content. |
© 2023 by the authors. Licensee MDPI, Basel, Switzerland. This article is an open access article distributed under the terms and conditions of the Creative Commons Attribution (CC BY) license (https://creativecommons.org/licenses/by/4.0/).
Share and Cite
Redshaw, M.; Bhandari, R.; Gamage, N.; Hasan, M.; Gamage, M.H.; Keblbeck, D.K.; Limarenko, S.; Perera, D. Status of CHIP-TRAP: The Central Michigan University High-Precision Penning Trap. Atoms 2023, 11, 127. https://doi.org/10.3390/atoms11100127
Redshaw M, Bhandari R, Gamage N, Hasan M, Gamage MH, Keblbeck DK, Limarenko S, Perera D. Status of CHIP-TRAP: The Central Michigan University High-Precision Penning Trap. Atoms. 2023; 11(10):127. https://doi.org/10.3390/atoms11100127
Chicago/Turabian StyleRedshaw, Matthew, Ramesh Bhandari, Nadeesha Gamage, Mehedi Hasan, Madhawa Horana Gamage, Dakota K. Keblbeck, Savannah Limarenko, and Dilanka Perera. 2023. "Status of CHIP-TRAP: The Central Michigan University High-Precision Penning Trap" Atoms 11, no. 10: 127. https://doi.org/10.3390/atoms11100127
APA StyleRedshaw, M., Bhandari, R., Gamage, N., Hasan, M., Gamage, M. H., Keblbeck, D. K., Limarenko, S., & Perera, D. (2023). Status of CHIP-TRAP: The Central Michigan University High-Precision Penning Trap. Atoms, 11(10), 127. https://doi.org/10.3390/atoms11100127