Abstract
Neutral beam injection is supposed to be the main source of high-energy particles, driving non-inductive current and generating primary neutrons in fusion neutron sources design based on tokamaks. Numerical simulation of high-energy particles’ thermalization in plasma and fusion neutron emission is calculated by novel dedicated software (NESTOR code). The neutral beam is reproduced statistically by up to 109 injected particles. The beam efficiency and contribution to primary neutron generation is shown to be dependent on the injection energy, input current, and plasma temperature profile. A beam-driven plasma operation scenario, specific for FNS design, enables the fusion rate and neutron generation in plasma volume to be controlled by the beam parameters; the resultant primary neutron yield can be efficiently boosted in plasma maintained at a relatively low temperature when compared to ‘pure’ fusion reactors. NESTOR results are applicable to high-precision nuclear and power balance estimations, neutron power loads distribution among tokamak components, tritium generation in hybrid reactors, and for many other tasks critical for FNS design.
Keywords:
fusion neutron source; neutron generation; neutral beam injection; fast ions; NBI; NESTOR; BTR; BTOR 1. Introduction
The interest in fusion neutron sources (FNSs) can be explained by their ability to address the specific problems of fission nuclear power engineering as well as fusion power plants. The top challenge here is the testing and validation of materials and structural components for future nuclear and thermonuclear reactor design, and FNSs are able to perform the material properties required. Furthermore, FNSs are expected to obtain experimental data in the fields of nuclear waste management, nuclear fuel breeding, and technologies for hybrid reactors [1]. Physical principles underlying efficient production of free neutrons and possibilities of FNSs’ creation and their application in hybrid systems are described in detail in the review [2].
Neutron sources based on tokamaks can provide high steady-state neutron flux density; they are compatible with fission blankets. They are more feasible in terms of plasma operation requirements as compared to plasma in ‘pure’ fusion reactors; hence they can be made in a compact size and at a lower cost [3].
FNSs’ basic concept is described in [4,5]. It is based on the possibility to reduce the requirements to plasma parameters (including lower power efficiency Q = Pfus/Pheat), the total facility size, and the confining magnetic field by high-energy neutral beam injection (NBI) serving as a main driver of non-inductive plasma current and the source of fast ions for efficient neutron generation [6]. The beam–plasma interaction is expected to deliver at least a half (~50–99%) of all fusion (primary) neutrons emitted in an FNS tokamak [7]. An NBI has to maintain a steady-state current drive and high fusion rates in a relatively cold plasma background. This task can be only performed by the beams with properties thoroughly tuned for given plasma target parameters and a toroidal spatial shape [8]. The paper shows the possibilities to control the fusion rates in a beam-driven tokamak and offers methods to boost the overall fusion neutron output, which are applicable to any tokamak-based FNS design: either conventional, ‘classical’ tokamaks, or low-aspect and spherical devices [9].
The numerical results discussed throughout this study were obtained by a novel computer code NESTOR (NEutron Source in TORoids) created in 2022, for the purposes of accurate evaluation and optimization of NBI efficiency in FNS systems. The code can either run independently or be a component of beam-plasma simulation workflow (BTOR suite of codes, 2019). In general, NESTOR code calculates the primary neutron emission in tokamak with an account of toroidal field geometry. The main feature of NESTOR is detailed injected beam statistics (up to 109 neutral particles with realistic angular distribution), which can be passed from other NBI codes, e.g., from BTR code ([10], 2005). The data on nuclear fusion cross-sections is taken from [11]. The beam ions initial deposition from NBI is reconstructed by applying the beam stopping cross-sections fitting model [12] to each ray constituting the NBI bunch. The fast ions deceleration (slowing-down) model and the methodology of fusion rates calculation are described in detail in the next section.
2. Beam Ions Deceleration
To achieve the maximum neutron yield in fusion reactions between the beam and the plasma thermal ions, the fast ions which are captured by plasma after the injected atoms’ ionization should circulate in dense plasma as long as possible to maximize their cumulative probability of interaction with plasma ions. However, the fast ions’ circulation path length is limited by their deceleration, or slowing-down, due to Coulomb collisions with plasma ions and electrons. A similar effect was studied in detail for 14 MeV neutron generators based on accelerated ion beams injected into gaseous deuterium or tritium targets [13,14], where the possibility of obtaining intense neutron generation in beam-plasma facilities was demonstrated. Furthermore, the research pointed the methodology of control for the total neutron irradiation flux, local flux density, and gradients by adjusting the injected beam parameters and/or gas target pressure. This approach can be beneficial for intense neutron sources based on beam-driven tokamak design as well. For numerical analyses of neutral beam (NB) efficiency in generating neutrons, NESTOR software implements light-weighted (‘lite’) models based on the classical slowing-down theory [15].
The fast ions slowing-down (deceleration, thermalization) model is founded on the following assumptions. The NB high-energy atomic particles become ionized in plasma; the resulting fast ions are decelerated by Coulomb collisions with plasma electrons and ions. At high NB energy, the electron heating is initially dominant; as the beam ions slow down, the heating is primarily transferred to plasma ions. For the typical NB energy used in FNS, the probability of fusion reaction between beam ions and plasma background is orders of times higher at the first stage of the slowing-down path, so for the NB-driven neutron generation we can assume all the drag force to the beam ions comes only from electrons. The collisions with electrons cause only a small scattering of the beam ions, and the drag force in the direction of the fast ion initial velocity is proportional to the ion velocity vb. Therefore, NB fast ions slowing-down time to thermal velocities, in cases when vb << vTe, is mainly governed by plasma electron temperature and density.
The fast ions velocity in toroidal magnetized plasma can be decomposed into two components with respect to the magnetic field line direction: parallel velocity is responsible for the ion circulation around the toroidal axis, while the orthogonal component is associated with Larmor rotation around the field line. For passing ions in tokamak, i.e., which are not immediately lost or trapped on the mirror (“banana”) orbits, the parallel velocity component dominates. As a result, the fast ions’ deceleration in plasma is considered to be applied along the magnetic field lines, with taking into account their helical shape. Assuming this, the fast ions’ thermalization time (τs) along the direction can be naturally expressed in the form of the following classical solution [15]:
where Eb is the initial (injected) beam energy, Ec is the critical beam energy, and τse is the characteristic Spitzer time; Te and ne are electron temperature and density, Ab and Ai are the atom mass of fast ions and plasma ions, respectively, and ∝ stands for direct proportionality.
The value Ec defines the fast ion energy, when the electron and ion heating rates are roughly equal. As it is clear from (2), the value of the critical energy Ec grows along with the mass ratio of the beam ions to background ions and with plasma temperature. For a deuterium beam in a deuterium plasma with Te = 5 keV, the critical energy is ~93 keV (Ec ≈ 19 × Te).
The DT fusion reaction cross-section reaches its top values at deuteron energies about E ~100 keV. For efficient neutron generation, the beam energy should be above this level. In the course of slowing-down, fast ion energy gradually falls, while the drag force at each time moment depends on the plasma local density and temperature. The DT fusion rate-dependence on energy and plasma parameters results in specific profiles of fusion reaction intensity in time. Some examples are shown in Figure 1a,b, where the fast ion fusion intensity profiles are plotted against time for beam energy Eb = 200 and 500 keV.
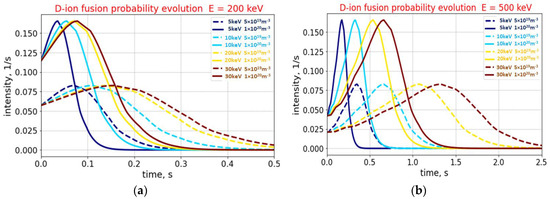
Figure 1.
Fast D+ ion fusion and neutron production rate along slowing-down path in plasma calculated for Te = 5, 10, 20, and 30 keV and for ne = 0.5 × 10²⁰ m−3 (dotted) and ne = 1 × 10²⁰ m−3 (solid): (a) beam energy Eb = 200 keV; (b) Eb = 500 keV. Note the difference in time scales for (a,b).
The plots in Figure 1 are consistent with 14 MeV neutron production profiles’ shape and variation with target density, which can be found in the neutron generators studies [13,14]. When deuterium ion initial energy is higher than ~100 keV, the ion burnout intensity (equal to fusion reaction probability per second) starts to grow in course of the ion slowing-down until the moment the ion energy reaches the optimum rate value. After this point, the fusion reaction rate continually decays with energy until the ion becomes thermal. The deceleration time, as well as the path, is almost proportional to the ion initial energy and to plasma temperature (Figure 2a). While the deceleration time is sensitive to plasma density, the fast ion total probability of interaction with target ions does not depend on the target density, and it is defined by the ion initial energy and plasma temperature, as shown in Figure 2b. It agrees well with the conclusions made in [13,14], which state the beam with a given energy should produce roughly the same number of neutrons along the deceleration path, while the local neutron rate increases proportionally to the target density.
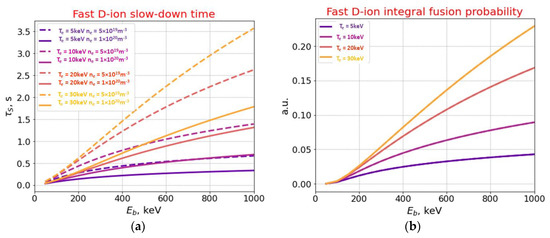
Figure 2.
Energy dependence of fast D+ ion slow-down time (a) and integral neutron production (b), calculated for Te = 5, 10, 20, and 30 keV and ne = 0.5 × 10²⁰ m−3 (dotted) and ne = 1 × 10²⁰ m−3 (solid).
Since the target conditions determine the slowing-down behavior, we can expect plasma temperature and density gradients across the plasma poloidal section to lead to a considerable variation in beam-induced fusion probability profiles between different radial layers. The example of fusion intensity evolution in time (similar to that shown in Figure 1) for various radial positions of ion circulation in DEMO-FNS tokamak plasma are plotted in Figure 3a, which corresponds to a uniform (unweighted) fast ion radial distribution across the plasma column. The plasma profiles are set parabolically with a maximum at plasma axis; the deuterium beam energy (equal to the fast ion start energy) is Eb = 500 keV. The characteristic plasma profiles are shown in Figure 3b.
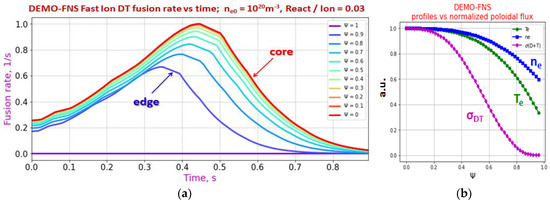
Figure 3.
Fast ion fusion (and neutron production) rate evolution in time for different plasma layers (a); plasma characteristic profiles (b). Electron temperature Te, electron density ne, and thermal DT-fusion cross-section σDT. Deuterium fast ion energy is Eb = 500 keV; maximum values at plasma column axis Te(0) = 15 keV, ne(0) = 1 × 10²⁰ m−3. Neutron emission rate grows while beam ions slow down, the peak in fusion reaction cross-section is achieved at different moments, defined by the local target density. The absolute neutron rate from a fast ion is proportional to the target density; this explains the rise of peak height from the plasma edge (Ψ = 1) towards the core (Ψ = 0).
Figure 4 illustrates the continuous distribution of weighted fusion rate evolution in time, which is obtained in DEMO-FNS plasma for real injected beam geometry. Unlike the uniform beam ions distribution case shown in Figure 3a, the contribution (weight) of Ψ-layers in Figure 4 is proportional to the fraction of beam ions deposited within a layer. For the adopted nominal off-axis NB-aiming in DEMO-FNS (Rt/Zt = 3.5 m/−0.5 m, where Rt and Zt are the beam axis-aiming point coordinates in the tokamak frame), the major parts of the beam ions are deposited and decelerated in a radial domain Ψ = 0.5–0.8, resulting in a higher intensity of neutron emission, clearly observed in this region in the color map.
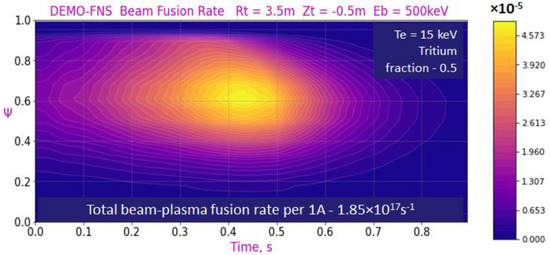
Figure 4.
Color map of weighted fusion rate (1/s) evolution in time, calculated with account of beam ions (Eb = 500 keV) actual deposition in DEMO-FNS plasma for external off-axis beam injection. Plasma profiles are the same as shown in Figure 3b, tritium fraction is 0.5. The evaluated neutron yield from 1A of NBI is 1.85 × 10¹⁷ 1/c.
The injected beam aiming with respect to the plasma axis allows the neutron emission profile to be changed through reshaping the fast ion radial deposition. It is clear from Figure 4 that the NB injected externally versus the plasma axis (i.e., at Rt > R0, where R0 is the plasma major radius) produces a hollow-shaped beam-plasma interaction profile across the poloidal plane, with a negligible neutron emission around the magnetic axis (Ψ = 0). If the same beam is aimed at the internal side of the plasma core (Rt < R0), a relatively uniform neutron emission profile can be created across the column under certain conditions (dependent on kinetic profiles shape), while on-axis NB-aiming (Rt = R0) can create a neutron emission profile peaked at the axis, as shown in [16].
3. Fast Ion Energy Distributions
The fast ions distribution in phase space can generally be obtained from the kinetic equation solved with a beam particles source and a collisional operator; its solution includes the account of fast ion slowing-down and pitch angle scattering. Within the slowing-down classical theory assumptions, the Fokker–Planck solution can be replaced by a faster method of direct computation of multiple particles tracks (“histories”), which allow one to obtain the statistics on particles energy distribution for any point or region in the volume [17]. Since the fast ions trajectories are supposed to follow the toroidal magnetic field lines, the ions’ periodic orbits can be mapped onto a poloidal (transversal) plane, and orbit cross-sections and velocities can be collected for any cell of phase space. This procedure, when applied to a large population of ions in the course of their slowing-down, results in a detailed energy spectra of the beam ions on each magnetic surface (more exactly, on their Poincaré section), while the spectra resolution can be naturally controlled by the number of the fast ions produced from NB rays. The examples of energy spectra obtained from considering ~105 fast ions from a deuterium beam with energy Eb = 100 keV injected along FNS-ST tokamak (R/a = 0.5 m/0.3 m) magnetic axis (Rt = 0.5 m, Zt = 0) are shown in Figure 5a,b. Thin colored lines in the plots denote the energy profiles calculated for different radial layers (magnetic surfaces labels Ψ), while the black thick line denotes the fast ions integral weighted distribution over the plasma poloidal cross-section resulting from the beam initial deposition. The plot in Figure 5a is calculated for nominal plasma temperature Te = 5 keV, Figure 5b is for Te = 1 keV.
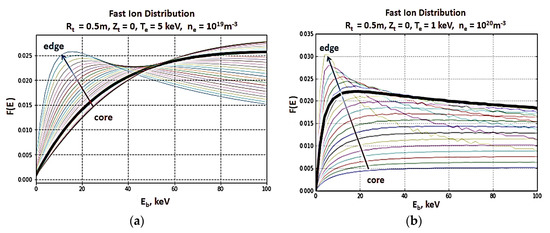
Figure 5.
Fast ion energy distribution (black) formed as a result of injection of deuterium beam along the magnetic axis of FNS-ST tokamak (Rt = 0.5 m, Zt = 0); plasma density ne = 1 × 10²⁰m−3, beam energy Eb = 100 keV: (a) plasma temperature Te = 5 keV; (b) Te = 1 keV. Thin colored lines correspond to partial distributions for different radial layers (Ψ).
Within each radial layer, the energy distribution function (EDF) shape is defined mainly by the ratio of the initial ion energy to the local temperature Eb/Te. Hence the EDF profiles strongly differ across ion circulation radii: the ions which are decelerating at plasma periphery (Ψ = 0.7–1) are more efficiently thermalized, and their EDF maximum is observed at low energies (cold ions are dominating). Within the plasma central region with a higher temperature, the slowing-down path is longer, and the “hot tail” ion fraction is high. From a comparison of Figure 5a,b, lower plasma average temperature results in higher value of the entire beam ratio Eb/Te, so the relative fraction of high-energy particles in the integrated distribution drops down. Since the fusion cross-section is highly dependent on energy, EDF with a higher fraction of hot-tail ions ensures a higher probability of fusion reactions between the beam fast ions and the target plasma ions. Moreover, for an accurate evaluation of hot-tail fraction across the entire beam bunch (with an account of beam envelope width), NB real geometry and steering must be considered, as earlier estimations have shown that, when considered in beam-plasma system realistic geometry, beam deposition and slowing-down can vary dramatically across plasma poloidal cross-sections [16,18].
4. Fusion Rate and Primary Neutron Emission
In FNS tokamak design it is assumed that, depending on the tritium content in plasma, about 50–99% of the primary neutrons are generated in fusion between the fast beam and thermal plasma background; the rest of the primary neutron emission comes from thermal plasma ions. The neutron source operation scenario assumes the beam ion slowing-down time exceeds the thermal energy confinement time, and the probability of a fusion reaction between fast ions and plasma background (i.e., the fast ion total burnup) is significantly higher if compared to the fusion probability between the thermal (slow) plasma ions.
The fast ion EDF illustrated in Figure 5a,b can be naturally applied to beam-plasma fusion rates’ calculation. The actual beam input to the fusion neutron generation will depend on the hot-tail fraction, slow-down time profiles, NB particles feed rate, and total amount of target ions in the area of potential fusion reactivity. Earlier it was shown [18] that the optimum neutron generation in FNS tokamak is achieved at the operation parameters which in general do not match with the best efficiency of beam current drive.
The fusion rate distributions in DEMO-FNS poloidal cross-section for nominal plasma parameters Te = 15 keV, ne = 1 × 10²⁰ m−3 are shown in Figure 6: NBI is aimed tangentially off-axis, as this geometry is adopted so far in DEMO-FNS design (Rinj/Zinj = 3.5/−0.5 m). The plots in Figure 6 represent thermal plasma fusion (a), beam-plasma fusion (b), and the overall primary neutron emission from fast and thermal plasma ions (c). A deuterium beam (Eb = 500 keV) was injected into plasma with a deuterium to tritium ratio of 0.5/0.5. It can be seen, for the given beam-aiming (shown by the colored footprint), most of the neutrons from NBI are emitted within a radial ring in the poloidal plane and form a hollow toroidal region of neutron generation.
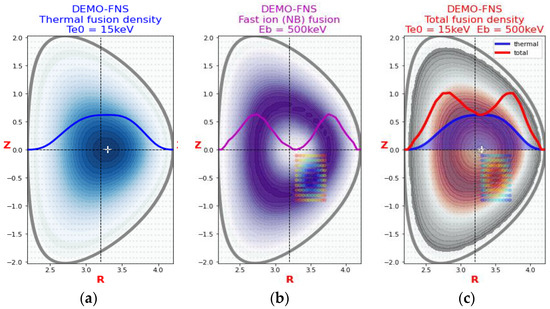
Figure 6.
Fusion rate profiles in DEMO-FNS tokamak: (a) thermal fusion; (b) beam-plasma fusion; (c) total fusion rate (red) with thermal part (blue). NB tangent position Rinj/Zinj = 3.5/−0.5 m; Te = 15 keV, ne = 1 × 10²⁰ m−3, Eb = 500 keV.
NB fast ion contribution to the primary neutron yield depends on the ratio Eb/Te and on thermal energy confinement time. The influence of plasma temperature on the neutron source profile in DEMO-FNS is shown in Figure 7, which was calculated for plasma temperatures Te = 10, 20, and 30 keV (off-axis NBI aiming). Thermal plasma fusion contribution increases essentially with plasma temperature: from 10% for Te = 10 keV up to 80% for 30 keV.
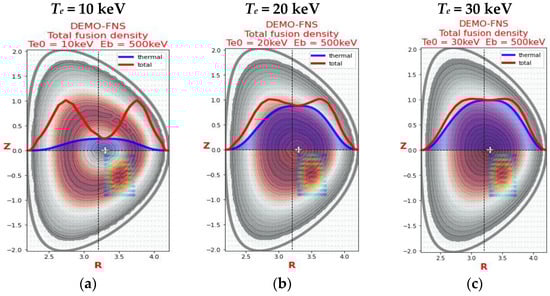
Figure 7.
Plasma temperature impact on thermal fusion rate share in DEMO-FNS plasma: (a) Te = 10 keV; (b) Te = 20 keV; (c) Te = 30 keV. NBI tangent position Rinj/Zinj = 3.5/−0.5 m; ne = 1 × 10²⁰ m−3, Eb = 500 keV. Thermal fusion reactivity profile (blue) and total fusion (red).
From Figure 7, it is clear the ratio of thermal to total fusion reactivity can be controlled so that the resuling total fusion reactivity profile can become almost uniform across the plasma poloidal plane. However, at higher temperatures (for DEMO-FNS, at Te > 20 keV) the beam contribution to fusion neutron generation becomes almost negligible, and the integral profile shape is completely defined by a bell-shaped profile of thermal fusion (shown blue in Figure 7).
5. Neutron Yield Comparison for DEMO-FNS and ITER Tokamaks
ITER plasma volume is ~7 times larger than in DEMO-FNS, and thermal energy confinement time exceeds the beam ions thermalization time several times [19,20], so the fusion rate growth due to NBI is relatively small. In contrast, for FNSs based on tokamak, the beam ions thermalization time is comparable to or exceeds several times the energy confinement time; this makes possible a beam-plasma operation scenario associated with enhanced primary neutron production [6].
Plasma temperature-dependence of DT-fusion rates from thermal and high-energy ions contributions are shown in Figure 8 for two different plasma configurations: DEMO-FNS (Figure 8a) and ITER (Figure 8b) tokamaks. For both machines, plasma profiles and content are taken similarly (parabolically); NBI parameters in DEMO-FNS are Eb = 500 keV, PNB = 30 MW, while in ITER they are Eb = 1 MeV, PNB = 33 MW. The contribution of injected beam to fusion neutron generation is shown in Figure 9. Plasma content D/T is 0.5/0.5 everywhere.
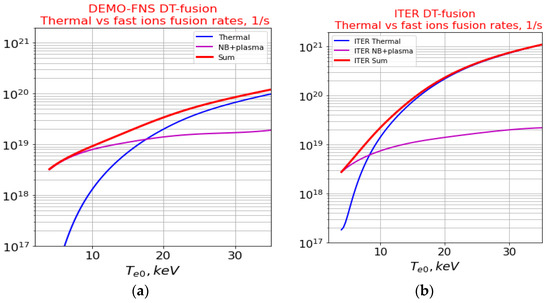
Figure 8.
DT fusion rates across plasma temperature: (a) DEMO-FNS (ne0 = 1 × 10²⁰ m −3, Eb = 500 keV); (b) ITER (ne0 = 1.2 × 10²⁰ m −3, Eb = 1 MeV).
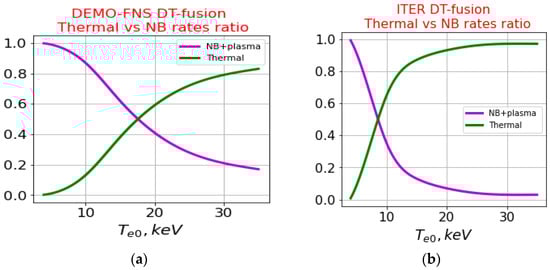
Figure 9.
NBI contribution to DT fusion rates across plasma temperature: (a) DEMO-FNS (ne0 = 1 × 10²⁰ m −3, Eb = 500 keV); (b) ITER (ne0 = 1.2 × 10²⁰ m −3, Eb = 1 MeV).
The analysis clearly shows that the fusion rate enhancement due to NBI in DEMO-FNS and ITER are almost identical (for an equal plasma temperature), while the beam relative contribution to the overall neutron generation in ITER is low. A similar level of total beam reactivity between the devices can be explained by the following simplified estimations. High-energy ion reactivity during thermalization roughly depends on the ratio Eb/Te, and it almost linearly increases with energy at a given temperature (see Figure 2b). The beam ion initial energy in ITER (1 MeV) is twice as high as NB energy in DEMO-FNS (500 keV), but the total injected power is almost the same (33 MW vs 30 MW), which means the beam current in ITER is half the value of the beam current in DEMO-FNS. Therefore, the result of beam fusion probability should be roughly the same in both cases.
The thermal fusion rate in Maxwell plasma is defined by the total amount of thermal ions’ population and by temperature and density distributions. Since ITER plasma volume exceeds that of DEMO-FNS several times, and plasma density is 20% higher, the thermal fusion rate in ITER is about ~10 times the fusion rate in DEMO-FNS at the same temperature. This explains a considerable difference in the neutral beam contribution between the two devices, even though the amount of beam-plasma neutrons in both plasmas will be roughly the same.
6. Conclusions
Fusion neutron sources based on tokamaks can provide high steady-state neutron flux density. Detailed modelling of primary neutron emission is a necessary step in high-accuracy nuclear and thermal analysis which must be performed to ensure the steady-state operation of hybrid devices and experimental work planning. For this purpose, a dedicated software package, NESTOR code, was developed in 2022. The code calculates the fusion rate distribution in plasma volume with an account of the neutral beam injection as an external source of high-energy particles.
NESTOR models are straightforward and mostly analytical, so the data are processed efficiently, within several seconds, even on average laptops, and the results are naturally interpreted. NESTOR code is capable of accepting the detailed geometry of magnetic surfaces and massive data on input beam statistics, which can be represented by up to 109 injected particles.
The actual neutron production rate in plasma will also depend on the plasma content and dilution due to impurities and helium ash [21]. The beam ionization rate and the slow-down time affected by the plasma effective charge (Zeff) will lead to the fast ion profile shifting towards the plasma edge and redistribution in energy space. These changes cause a decrease in beam-plasma fusion rates. Furthermore, the fast particles are known to interact with plasma instabilities [22]; these effects will cause the beam ions’ redistribution and additionally decrease the neutron generation. We also note that the beam fast ions reactions with impurity ions will deliver a very small number of additional neutrons, less than 1% from the fusion neutron yield. The effect of plasma rotation is not expected to reduce the neutron yield much, since the plasma rotation velocity is evaluated to be low (~0.01) when compared to the energetic beam particles’ velocity [23].
The injected beam contribution to the primary neutron generation highly depends on the beam energy and plasma temperature profile; the fast ion energy distribution is governed by the local ratio Eb/Te. The analysis has shown that for the beam-driven plasma operation scenario suggested in FNS, the total fusion rate can be efficiently managed, and the neutron production from low temperature plasmas (5–15 keV) can be multiplied by the high-energy beam particles.
The results obtained from NESTOR calculations can be applied to high-precision nuclear and power balance estimations, neutron power loads distribution among structural components, tritium generation in hybrid reactors, and many other design issues, which are not necessarily relevant to FNS devices.
Author Contributions
Conceptualization, E.D.; methodology, E.D.; software, E.D. and M.S.; validation, M.S. and B.K.; formal analysis, M.S.; investigation, E.D.; resources, B.K.; data curation, M.S.; writing—original draft preparation, E.D.; writing—review and editing, E.D. and M.S.; visualization, E.D.; supervision, B.K.; project administration, B.K.; funding acquisition, B.K. All authors have read and agreed to the published version of the manuscript.
Funding
This research received no external funding.
Institutional Review Board Statement
Not applicable.
Informed Consent Statement
Not applicable.
Data Availability Statement
Not applicable.
Acknowledgments
The work was partially supported by the National Research Center “Kurchatov Institute”. The software testing was performed using the computing resources of the federal collective usage center Complex for Simulation and Data Processing for Mega-science Facilities at NRC “Kurchatov Institute”, http://ckp.nrcki.ru/.
Conflicts of Interest
The authors declare no conflict of interest.
References
- Stacey, W.M. Transmutation Missions for Fusion Neutron Sources. Fusion Eng. Des. 2007, 82, 11–20. [Google Scholar] [CrossRef]
- Kuteev, B.V.; Goncharov, P.R.; Sergeev, V.Y.; Khripunov, V.I. Intense fusion neutron sources. Plasma Phys. Rep. 2010, 36, 281–317. [Google Scholar] [CrossRef]
- Kuteev, B.V.; Goncharov, P.R. Fusion–Fission Hybrid Systems: Yesterday, Today, and Tomorrow. Fusion Sci. Technol. 2020, 76, 836–847. [Google Scholar] [CrossRef]
- Leonard, B.R. A Review of Fusion-Fission (Hybrid) Concepts. Nucl. Technol. 1973, 20, 161–178. [Google Scholar] [CrossRef]
- Wu, Y.; Jiang, J.; Wang, M.; Jin, M. FDS Team A Fusion-Driven Subcritical System Concept Based on Viable Technologies. Nucl. Fusion 2011, 51, 103036. [Google Scholar] [CrossRef]
- Jassby, D.L. Optimization of fusion power density in the two-energy-component tokamak reactor. Nucl. Fusion 1975, 15, 453. [Google Scholar] [CrossRef]
- Goncharov, P.R.; Kuteev, B.V.; Golikov, A.A.; Lukash, V.E. Comparison between neutron yields of classical and spherical tokamaks. VANT Fusion Ser. 2011, 2, 36–43. [Google Scholar]
- Okano, K. Beam Driven Tokamak Fusion Reactors. J. Nucl. Sci. Technol. 1990, 27, 689–699. [Google Scholar] [CrossRef]
- Gryaznevich, M.; Chuyanov, V.A.; Takase, Y. Pulsed Spherical Tokamak—A New Approach to Fusion Reactors. Plasma 2022, 5, 247–257. [Google Scholar] [CrossRef]
- Dlougach, E.D. BTR code for NBI design and study. VANT Fusion Ser. 2021, 44, 68–79. [Google Scholar] [CrossRef]
- IAEA’s Nuclear Data Section. Available online: https://www-nds.iaea.org/ (accessed on 22 February 2022).
- Janev, R.K.; Boley, C.D.; Post, D.E. Penetration of energetic neutral beams into fusion plasmas. Nucl. Fusion 1989, 29, 2125. [Google Scholar] [CrossRef]
- Kulcinski, G.L.; Radel, R.F.; Davis, A. Near term, low cost, 14 MeV fusion neutron irradiation facility for testing the viability of fusion structural materials. Fusion Eng. Des. 2016, 109–111, 1072–1076. [Google Scholar] [CrossRef]
- Kulcinski, G.L.; Radel, R.F.; Davis, A. An Improved Near Term 14 MeV Neutron Test Facility for Fusion Power Plant Materials. Fusion Sci. Technol. 2017, 72, 248–254. [Google Scholar] [CrossRef]
- Wesson, J. Tokamaks, 4th ed.; Oxford University Press: Oxford, UK, 2011. [Google Scholar]
- Dlougach, E.D.; Panasenkov, A.; Kuteev, B.; Serikov, A. Neutral beam coupling with plasma in a compact fusion neutron source. Appl. Sci. 2022, 12, 8404. [Google Scholar] [CrossRef]
- Asunta, O.; Govenius, J.; Budny, R.; Gorelenkova, M.; Tardini, G.; Kurki-Suonio, T.; Salmi, A.; Sipilä, S.; The ASDEX Upgrade Team; The JET EFDA Contributors. Modelling neutral beams in fusion devices: Beamlet-based model for fast particle simulations. Comput. Phys. Commun. 2015, 188, 33–46. [Google Scholar] [CrossRef]
- Dlougach, E.D.; Kuteev, B.V. Impact of Neutral Beam Parameters on Current Drive and Neutron Yield in Compact Tokamak. Plasma Phys. Rep. 2022, 48, 1033–1041. [Google Scholar] [CrossRef]
- ITER Final Design Report; DDD 5.3; International Atomic Energy Agency: Vienna, Austria, 2001.
- Polevoi, A.R.; Loarte, A.; Bilato, R.; Gorelenkov, N.; Kazakov, Y.O.; Polunovskiy, E.; Tchistiakov, A.; Fable, E.; Kiptily, V.; Krasilnikov, A.V.; et al. Impact of suprathermal ions on neutron yield in the pre-DT phase of ITER operation. Nucl. Fusion 2021, 61, 076008. [Google Scholar] [CrossRef]
- Pinches, S.D.; Chapman, I.T.; Lauber, P.W.; Oliver, H.J.C.; Sharapov, S.E.; Shinohara, K.; Tani, K. Energetic ions in ITER plasmas. Phys. Plasmas 2015, 22, 021807. [Google Scholar] [CrossRef]
- Heidbrink, W.W. Basic physics of Alfvén instabilities driven by energetic particles in toroidally confined plasmas. Phys. Plasmas 2008, 15, 055501. [Google Scholar] [CrossRef]
- ITER EDA. Plasma auxiliary heating and current drive. Nucl. Fusion 1999, 39, 2495–2539. [Google Scholar] [CrossRef]
Publisher’s Note: MDPI stays neutral with regard to jurisdictional claims in published maps and institutional affiliations. |
© 2022 by the authors. Licensee MDPI, Basel, Switzerland. This article is an open access article distributed under the terms and conditions of the Creative Commons Attribution (CC BY) license (https://creativecommons.org/licenses/by/4.0/).