
Polarization Spectroscopy Applied to Electromagnetically Induced Transparency in Hot Rydberg Atoms Using a Laguerre–Gaussian Beam

 ,
,  , and
, and 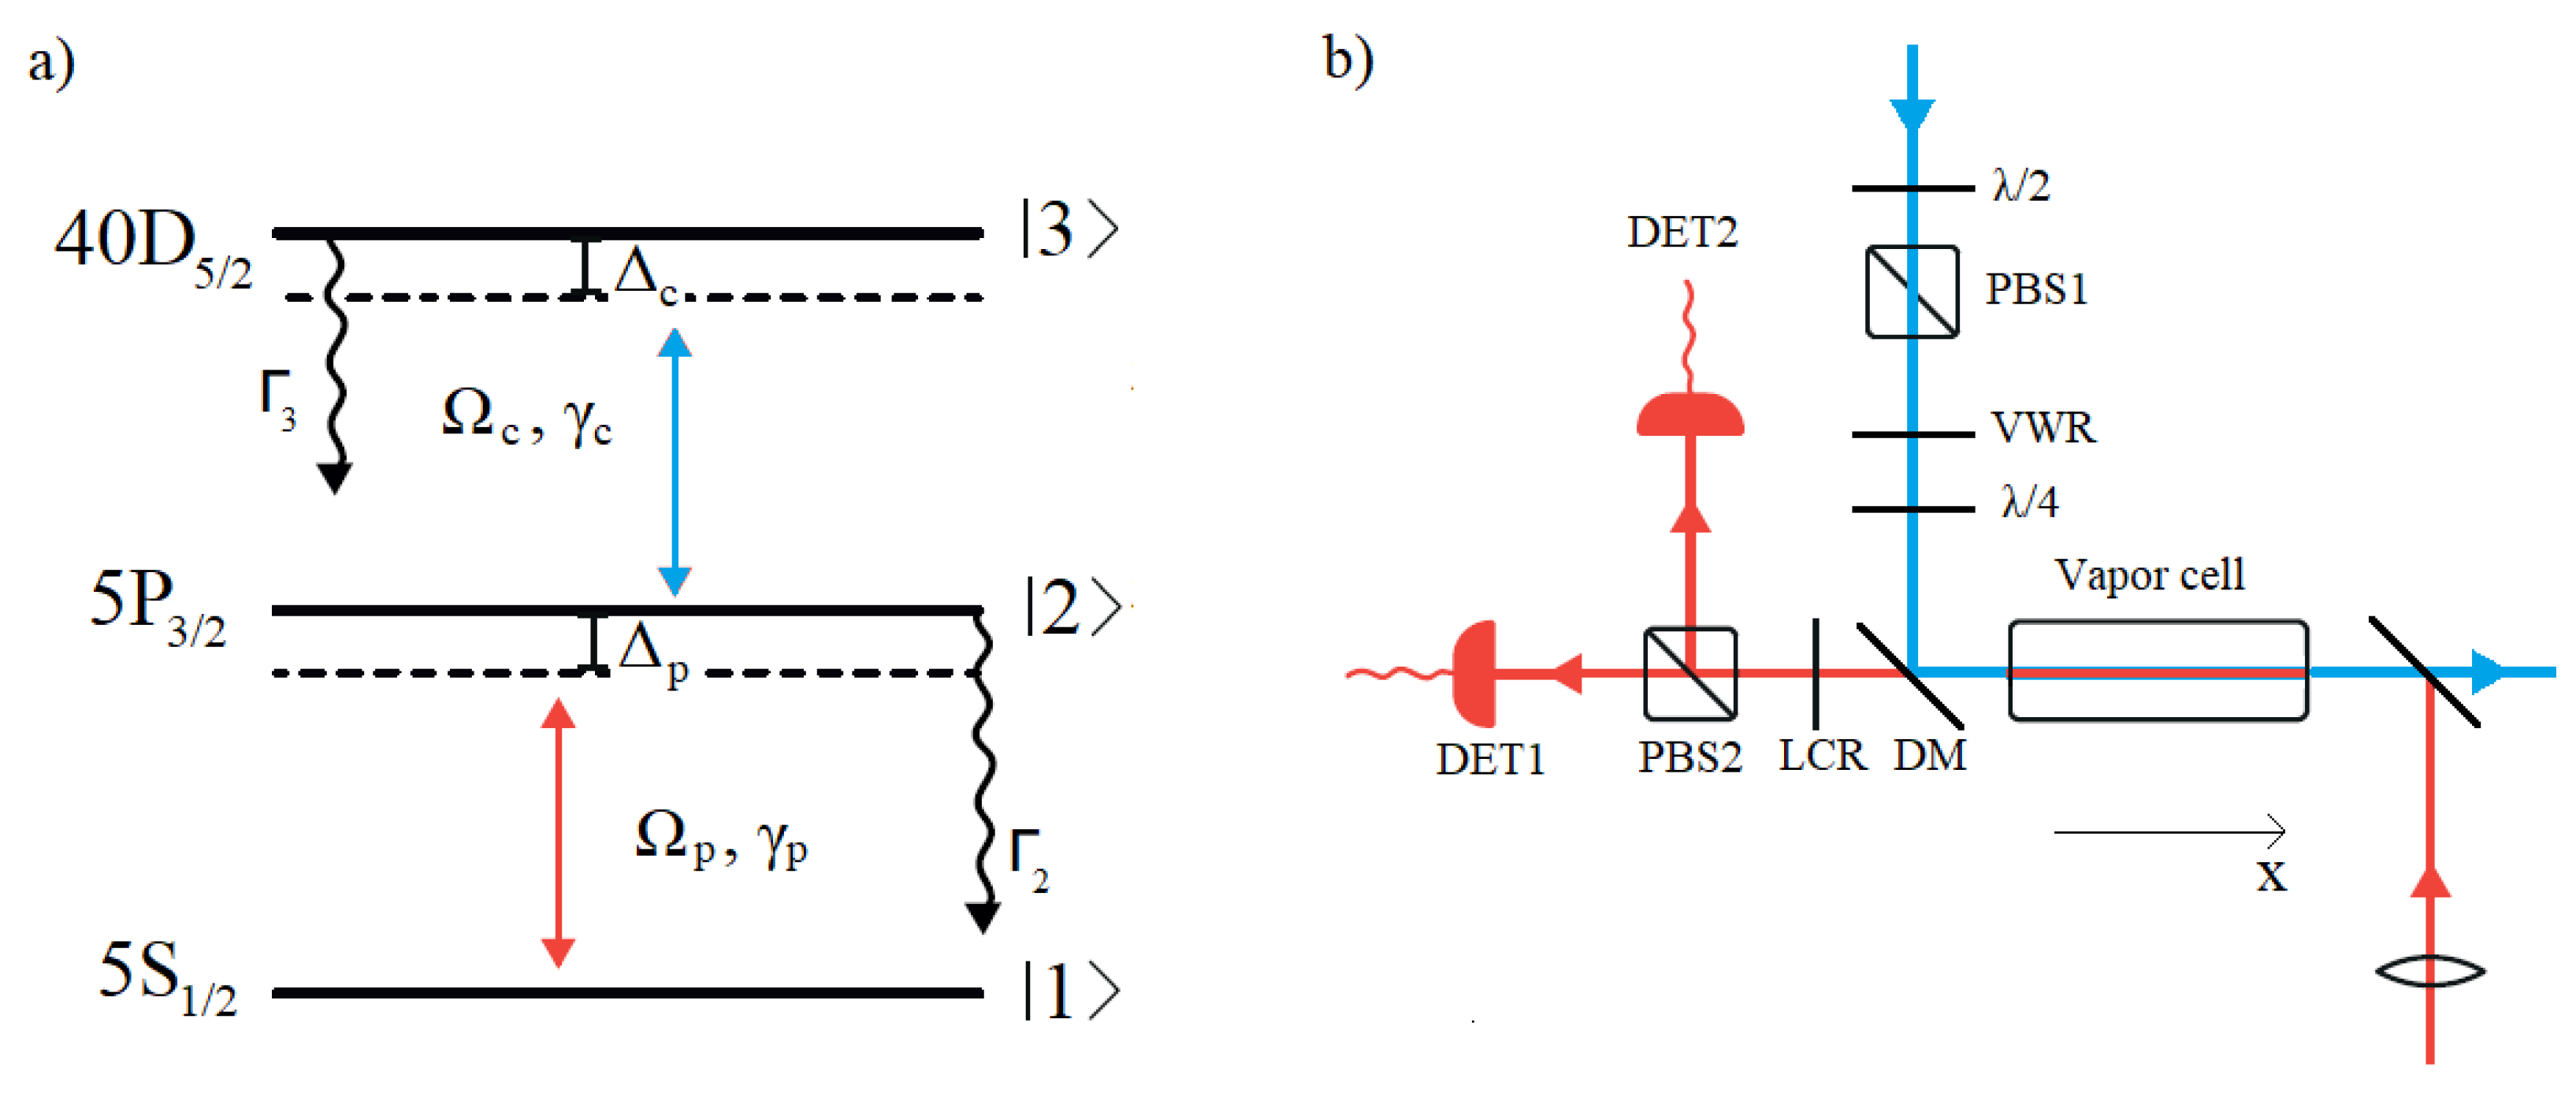
Abstract
:1. Introduction
2. Materials and Methods
3. Theoretical Model
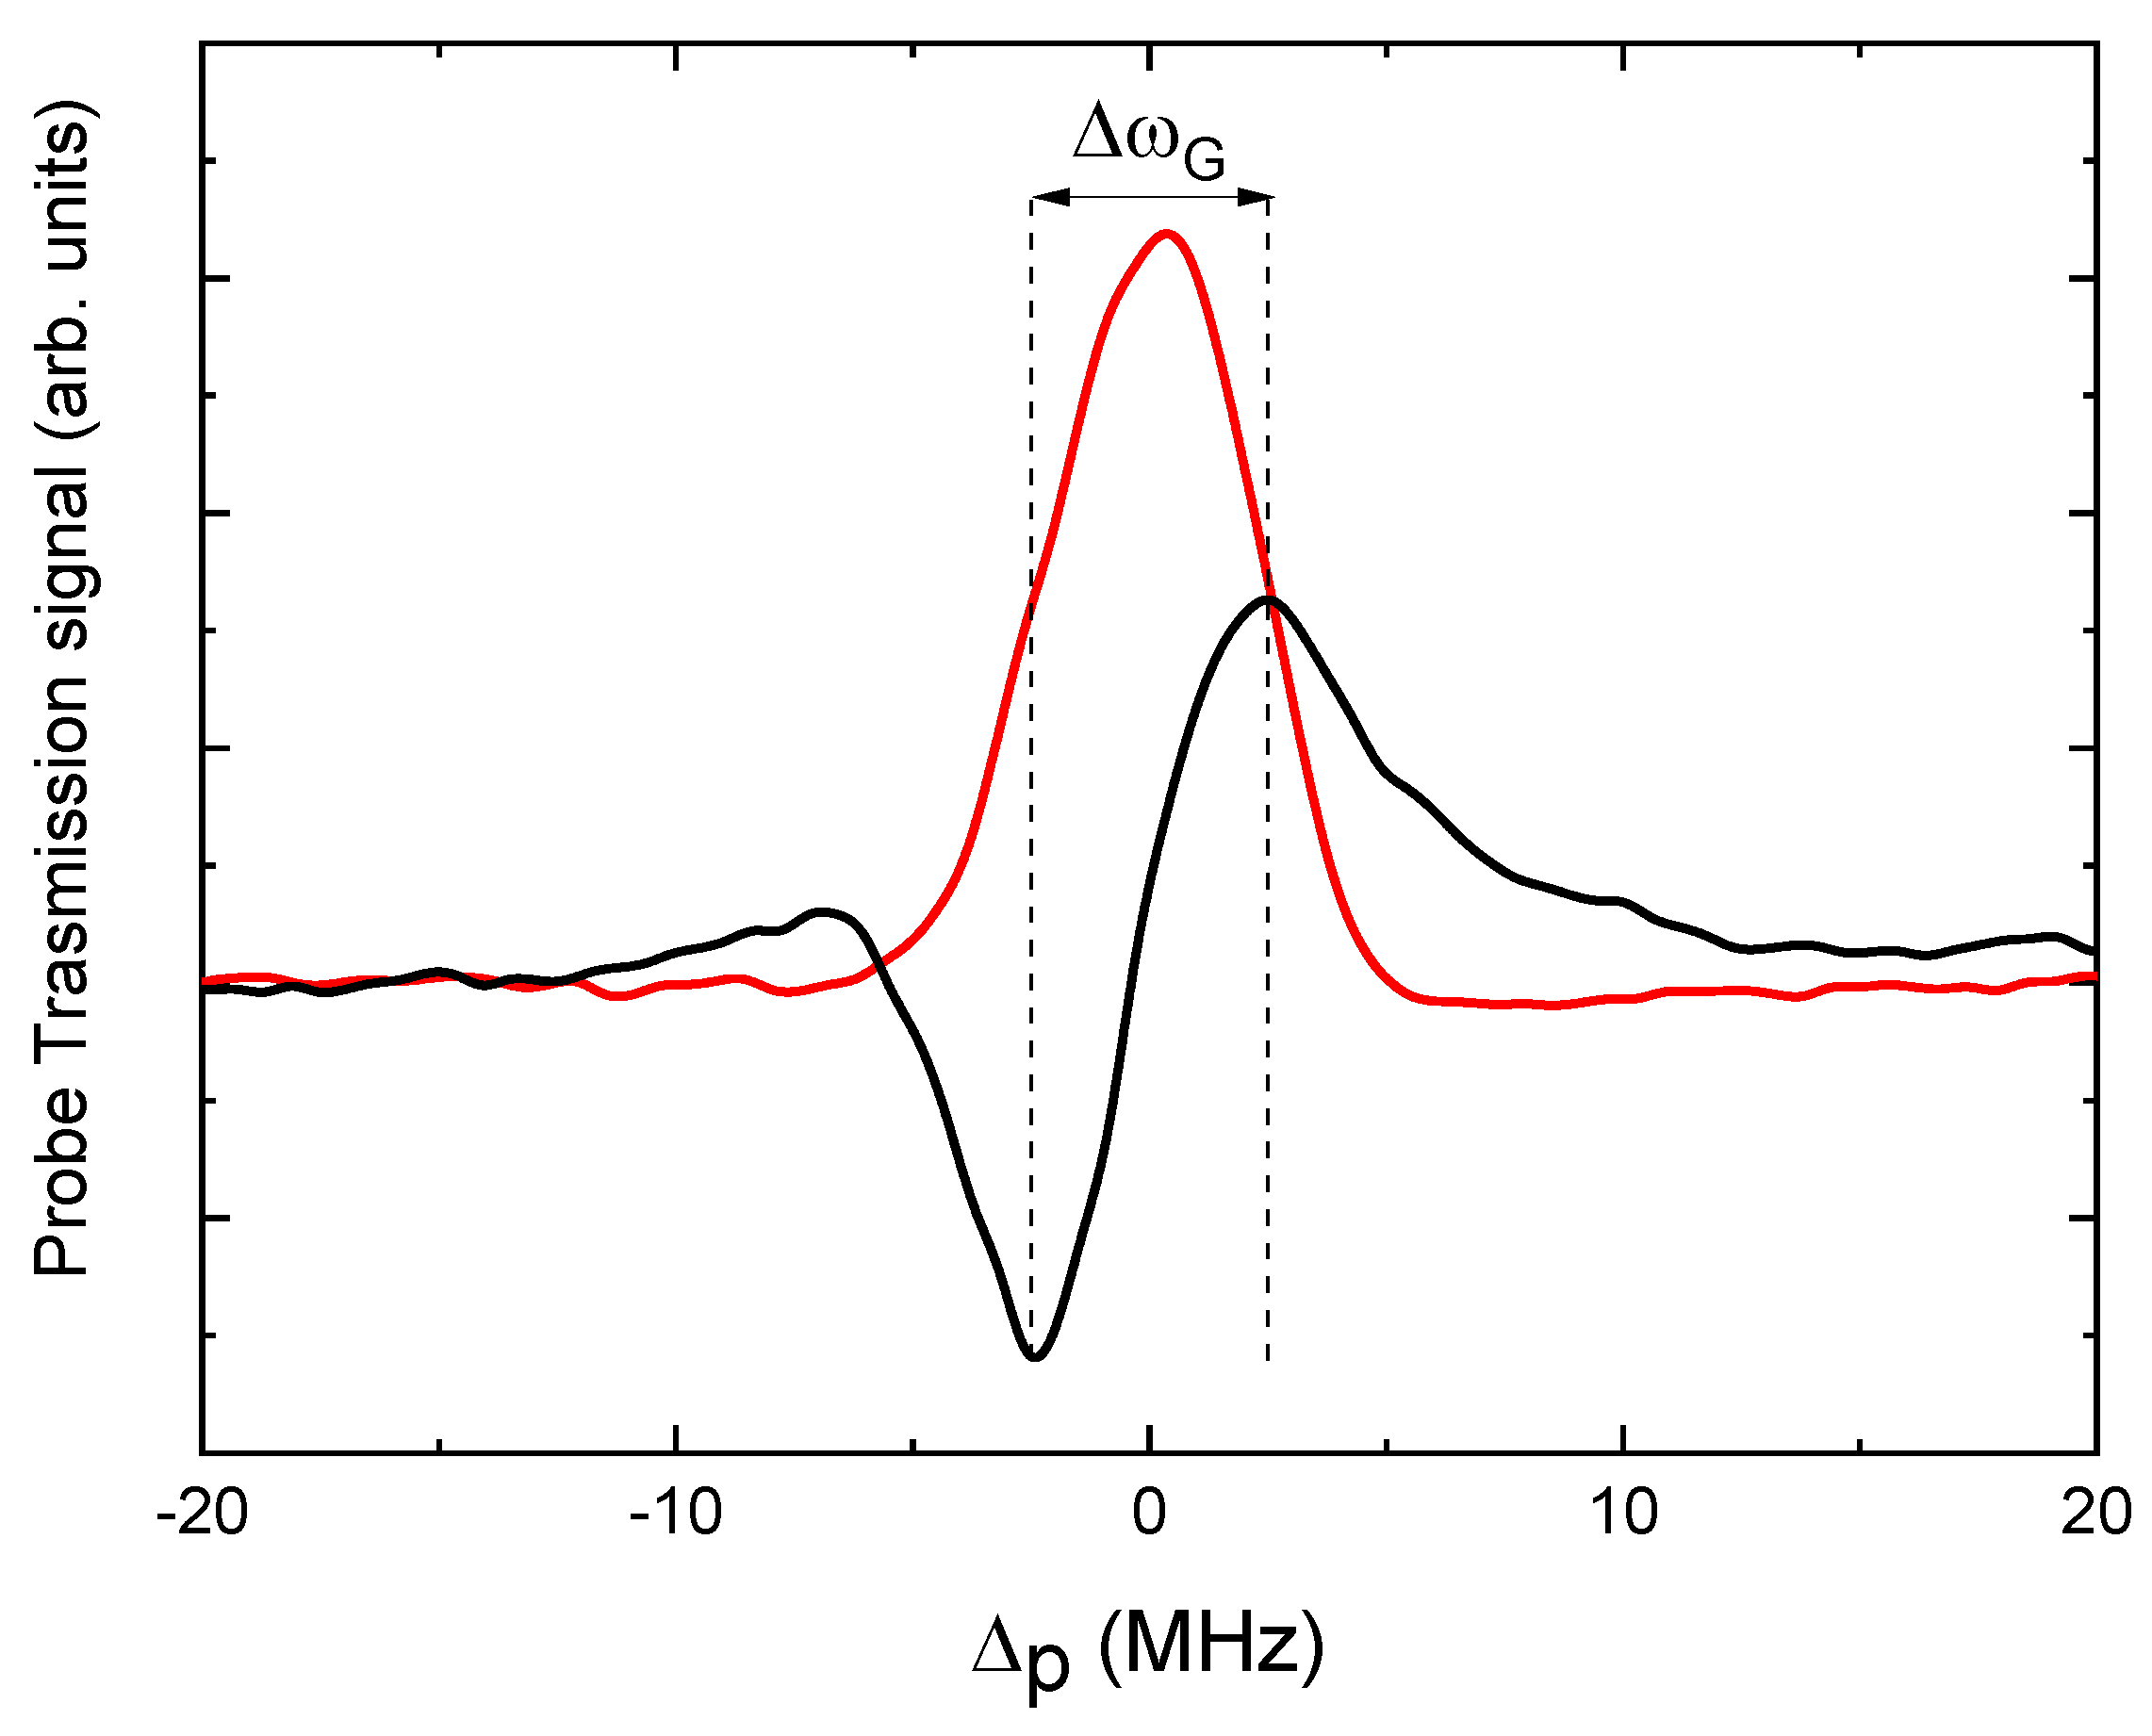
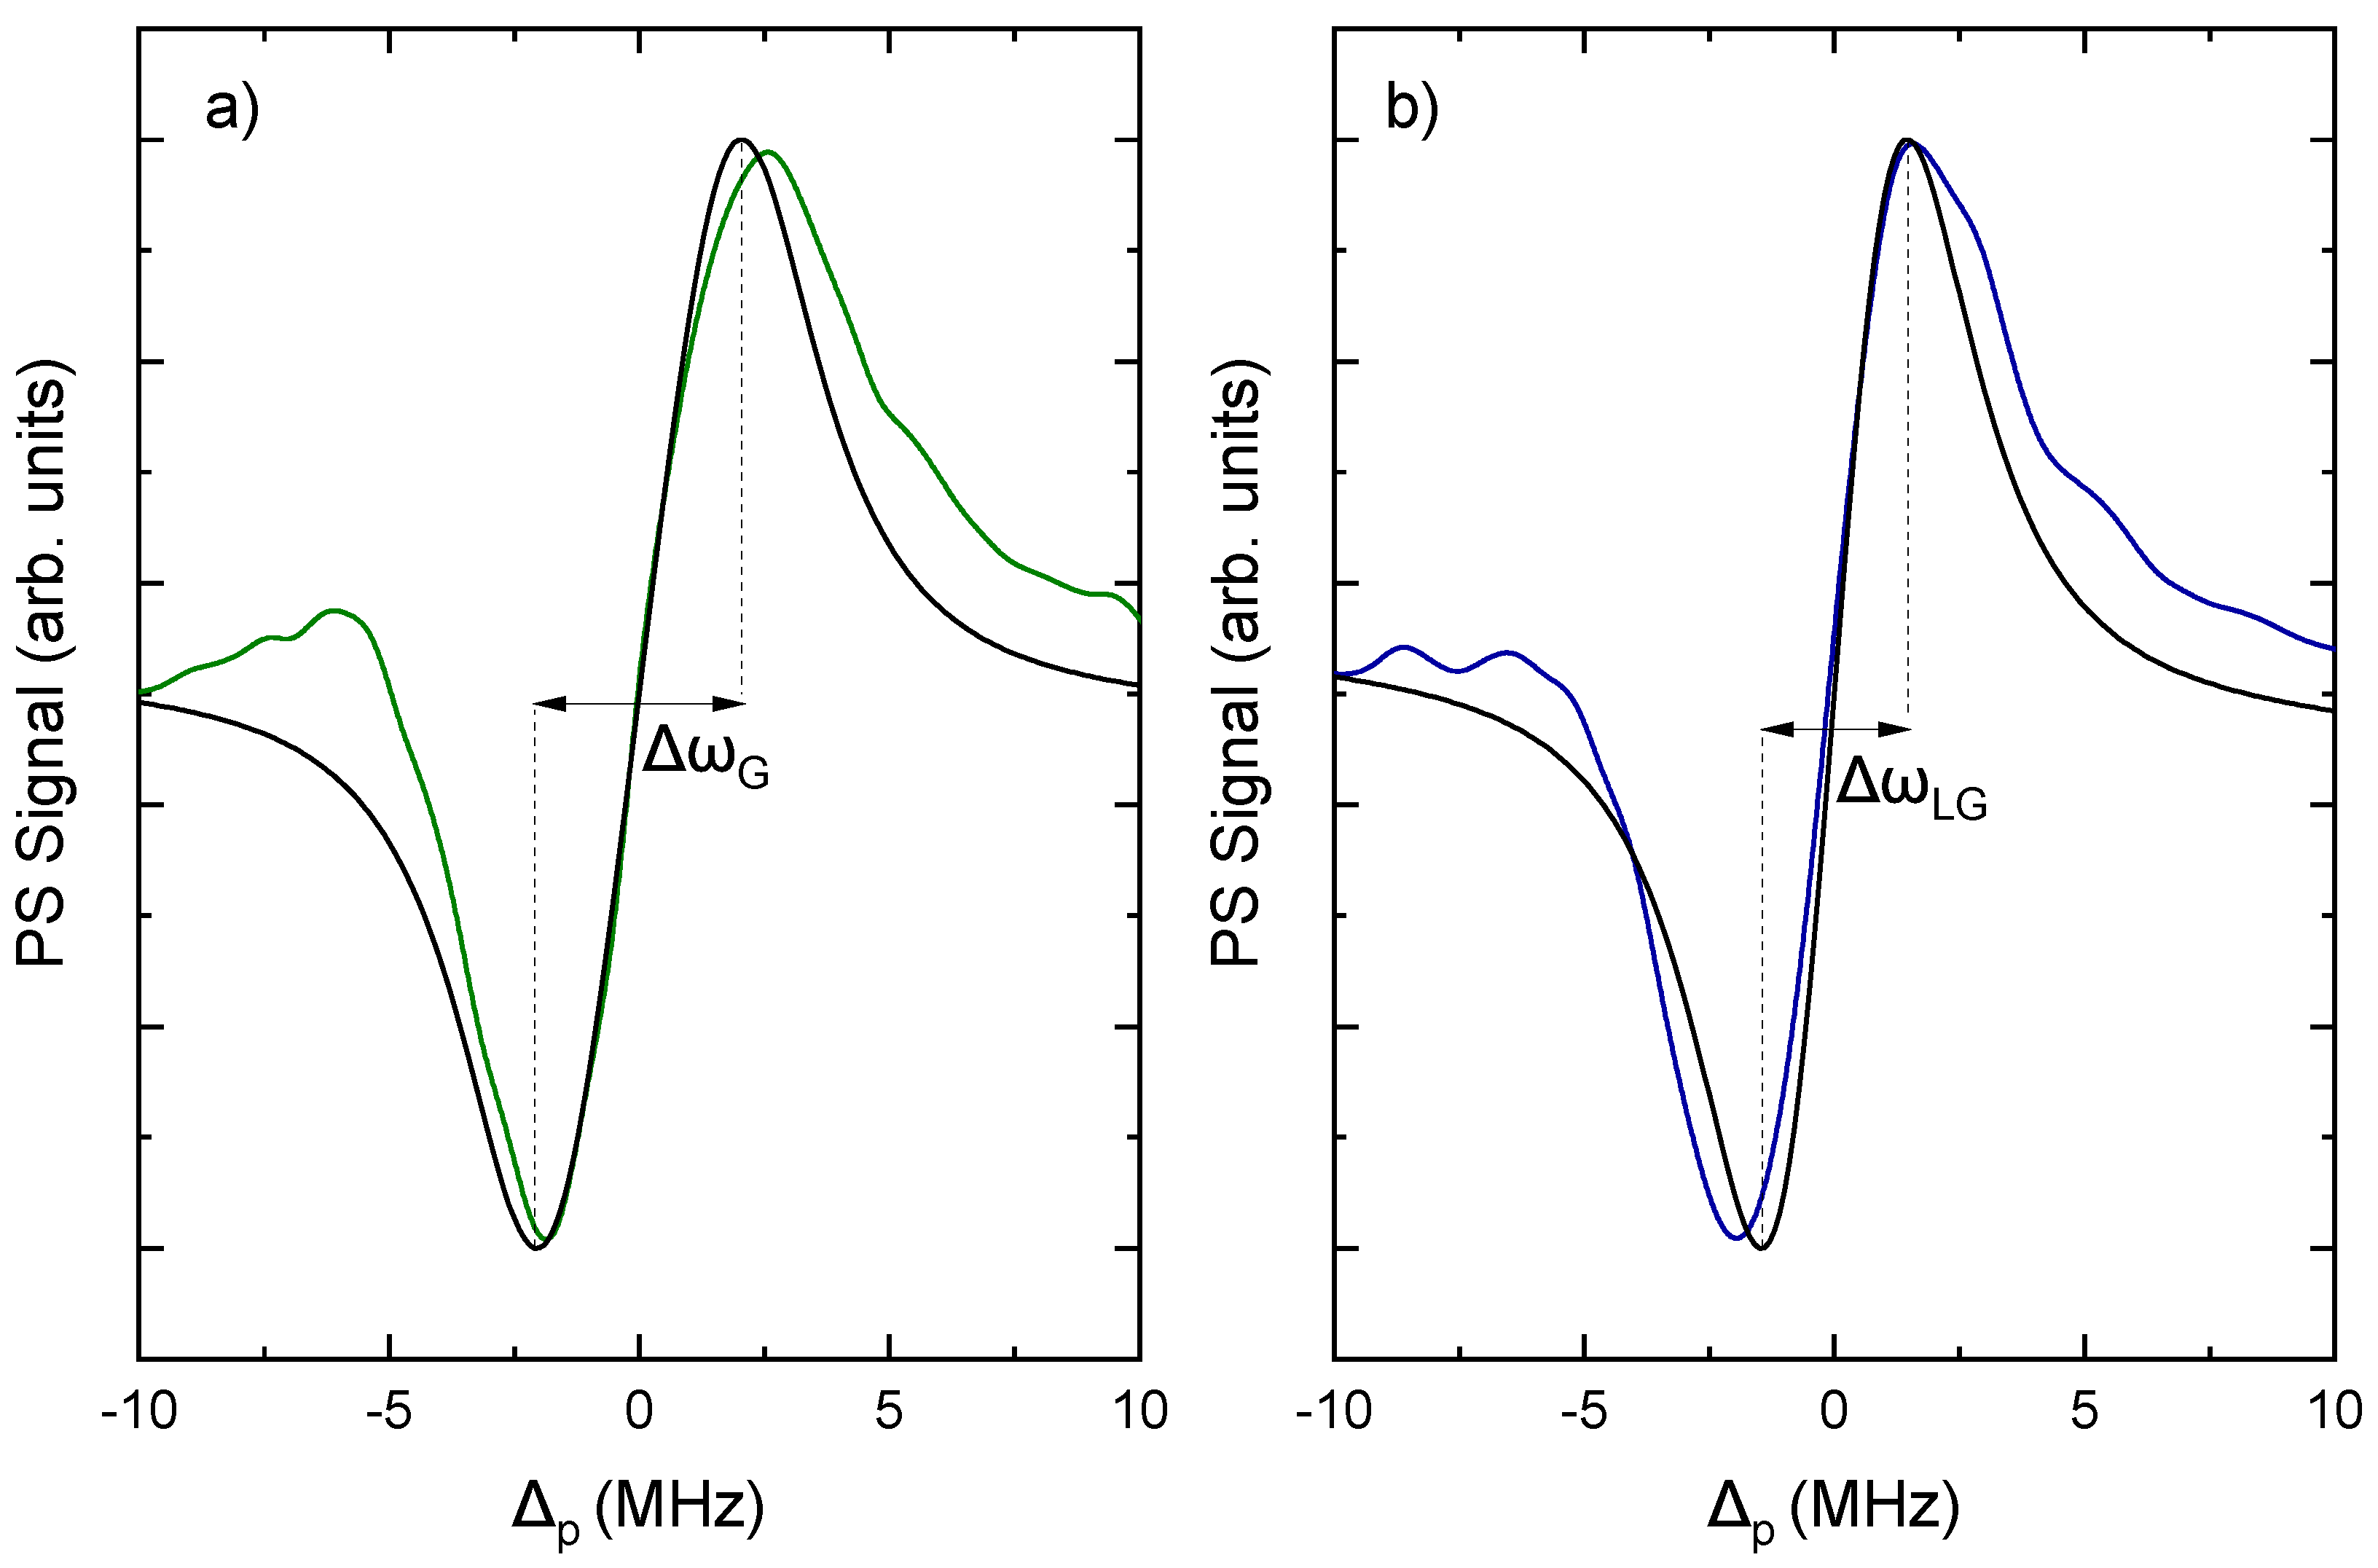
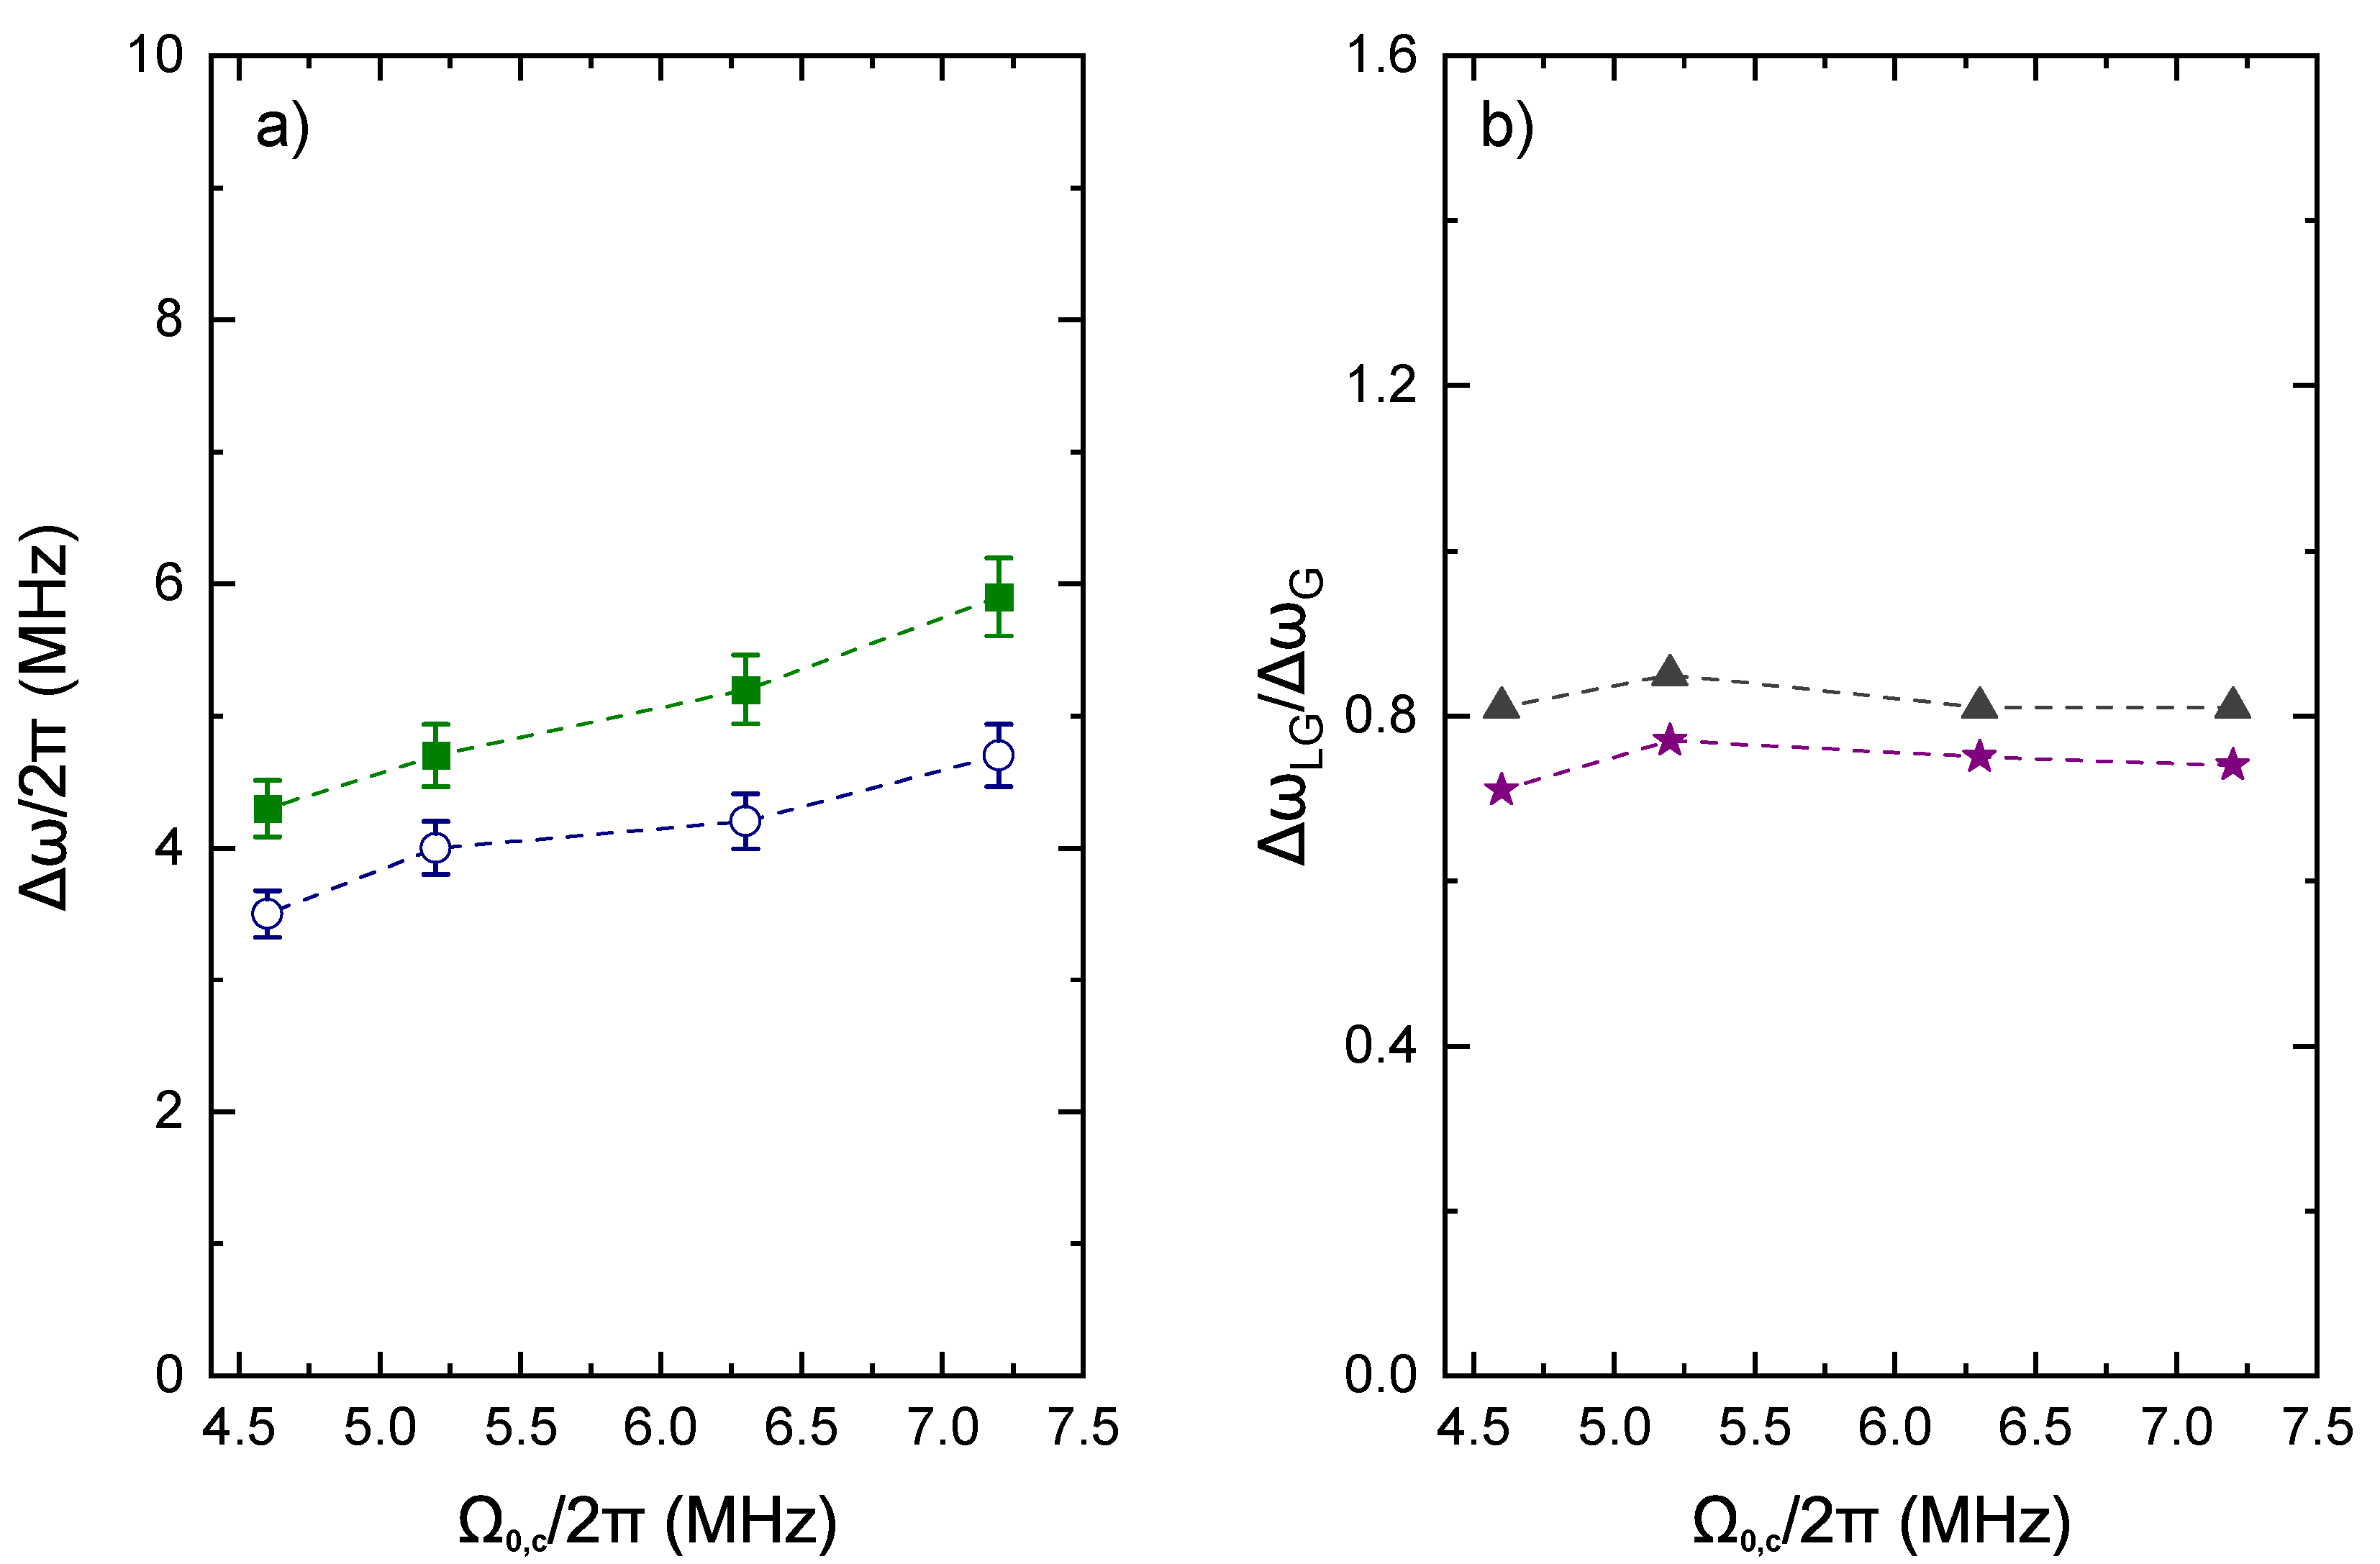
4. Results and Discussions
5. Conclusions
Author Contributions
Funding
Institutional Review Board Statement
Informed Consent Statement
Data Availability Statement
Conflicts of Interest
Abbreviations
| EIT | Electromagnetically induced transparency |
| LG | Laguerre–Gaussian |
| OAM | Orbital Angular Momentum |
| PS | Polarization Spectroscopy |
| FWHM | Full width at half maximum |
| DAVS | Dichroic Atomic Vapor Spectroscopy |
| PSB | Polarizing beam splitter |
| LCR | Liquid crystal retarder |
| OBE | Optical Bloch Equations |
| DM | dichroic mirror |
| VWR | Zero-order vortex half wave retarder |
References
- Fleischhauer, M.; Imamoglu, A.; Marangos, J.P. Electromagnetically induced transparency: Optics in coherent media. Rev. Mod. Phys. 2005, 77, 633–673. [Google Scholar] [CrossRef] [Green Version]
- Marangos, J.P. Electromagnetically induced transparency. J. Mod. Opt. 1998, 45, 471–503. [Google Scholar] [CrossRef]
- Hau, L.V.H.; Harris, S.E.; Dutton, Z.; Behroozi, C.H. Light speed reduction to 17 metres per second in an ultracold atomic gas. Nature 1999, 397, 594–598. [Google Scholar] [CrossRef]
- Gallagher, T.F. Rydberg Atoms; Cambridge University Press: Cambridge, UK, 2005; Number 3. [Google Scholar]
- Gallagher, T.F. Rydberg atoms. Rep. Prog. Phys. 1988, 51, 143–188. [Google Scholar] [CrossRef]
- Marcassa, L.G.; Shaffer, J.P. Advances in Atomic, Molecular and Optical Physics, Advances in Atomic, Molecular, and Optical Physics; Arimondo, E., Berman, P.R., Lin, C.C., Eds.; Academic: New York, NY, USA, 2014; Volume 63, p. 47. [Google Scholar]
- Jones, M.P.; Marcassa, L.G.; Shaffer, J. Special issue on cold Rydberg atoms. J. Phys. At. Mol. Opt. Phys. 2015, 48, 180201. [Google Scholar] [CrossRef]
- Clarke, J.; Chen, H.; van Wijngaarden, W.A. Electromagnetically induced transparency and optical switching in a rubidium cascade system. Appl. Opt. 2001, 40, 2047–2051. [Google Scholar] [CrossRef]
- Mohapatra, A.K.; Jackson, T.R.; Adams, C.S. Coherent Optical Detection of Highly Excited Rydberg States Using Electromagnetically Induced Transparency. Phys. Rev. Lett. 2007, 98, 113003. [Google Scholar] [CrossRef] [Green Version]
- Mohapatra, A.K.; Bason, M.G.; Butscher, B.; Weatherill, K.J.; Adams, C.S. A giant electro-optic effect using polarizable dark states. Nat. Phys. 2008, 4, 890–894. [Google Scholar] [CrossRef] [Green Version]
- Tauschinsky, A.; Thijssen, R.M.T.; Whitlock, S.; van Linden van den Heuvell, H.B.; Spreeuw, R.J.C. Spatially resolved excitation of Rydberg atoms and surface effects on an atom chip. Phys. Rev. A 2010, 81, 063411. [Google Scholar] [CrossRef] [Green Version]
- Petrosyan, D.; Otterbach, J.; Fleischhauer, M. Electromagnetically Induced Transparency with Rydberg Atoms. Phys. Rev. Lett. 2011, 107, 213601. [Google Scholar] [CrossRef] [PubMed]
- Firstenberg, O.; Adams, C.S.; Hofferberth, S. Nonlinear quantum optics mediated by Rydberg interactions. J. Phys. B At. Mol. Opt. Phys. 2016, 49, 152003. [Google Scholar] [CrossRef]
- Kim, B.; Chen, K.-T.; Hsiao, S.-S.; Wang, S.-Y.; Li, K.-B.; Ruseckas, J.; Juzeliūnas, G.; Kirova, T.; Auzinsh, M.; Chen, Y.-C.; et al. A weakly-interacting many-body system of Rydberg polaritons based on electromagnetically induced transparency. Commun. Phys. 2021, 4, 101. [Google Scholar] [CrossRef]
- Gorshkov, A.V.; Otterbach, J.; Fleischhauer, M.; Pohl, T.; Lukin, M.D. Photon-Photon Interactions via Rydberg Blockade. Phys. Rev. Lett. 2011, 107, 133602. [Google Scholar] [CrossRef] [PubMed] [Green Version]
- Petrosyan, D.; Fleischhauer, M. Quantum Information Processing with Single Photons and Atomic Ensembles in Microwave Coplanar Waveguide Resonators. Phys. Rev. Lett. 2008, 100, 170501. [Google Scholar] [CrossRef] [PubMed] [Green Version]
- Sedlacek, J.A.; Schwettmann, A.; Kübler, H.; Löw, R.; Pfau, T.; Shaffer, J.P. Microwave electrometry with Rydberg atoms in a vapour cell using bright atomic resonances. Nat. Phys. 2012, 8, 819–824. [Google Scholar] [CrossRef]
- Sedlacek, J.; Schwettmann, A.; Kübler, H.; Shaffer, J. Atom-based vector microwave electrometry using rubidium Rydberg atoms in a vapor cell. Phys. Rev. Lett. 2013, 111, 063001. [Google Scholar] [CrossRef] [Green Version]
- Fan, H.; Kumar, S.; Sedlacek, J.; Kübler, H.; Karimkashi, S.; Shaffer, J.P. Atom based RF electric field sensing. J. Phys. B At. Mol. Opt. Phys. 2015, 48, 202001. [Google Scholar] [CrossRef]
- Kumar, S.; Fan, H.; Kübler, H.; Sheng, J.; Shaffer, J.P. Atom-based sensing of weak radio frequency electric fields using homodyne readout. Sci. Rep. 2017, 7, 42981. [Google Scholar] [CrossRef] [PubMed]
- Chopinaud, A.; Pritchard, J. Optimal State Choice for Rydberg-Atom Microwave Sensors. Phys. Rev. Appl. 2021, 16, 024008. [Google Scholar] [CrossRef]
- Anderson, D.; Sapiro, R.; Gonçalves, L.; Cardman, R.; Raithel, G. Optical Radio-Frequency Phase Measurement with an Internal-State Rydberg Atom Interferometer. Phys. Rev. Appl. 2022, 17, 044020. [Google Scholar] [CrossRef]
- Kimel, I.; Elias, L. Relations between Hermite and Laguerre Gaussian modes. IEEE J. Quantum Electron. 1993, 29, 2562–2567. [Google Scholar] [CrossRef]
- Nicolas, A.; Veissier, L.; Giner, L.; Giacobino, E.; Maxein, D.; Laurat, J. A quantum memory for orbital angular momentum photonic qubits. Nat. Photonics 2014, 8, 234–238. [Google Scholar] [CrossRef] [Green Version]
- Trichili, A.; Rosales-Guzmán, C.; Dudley, A.; Ndagano, B.; Ben Salem, A.; Zghal, M.; Forbes, A. Optical communication beyond orbital angular momentum. Sci. Rep. 2016, 6, 27674. [Google Scholar] [CrossRef] [Green Version]
- Rodrigues, J.D.; Marcassa, L.G.; Mendonça, J.T. Excitation of high orbital angular momentum Rydberg states with Laguerre–Gauss beams. J. Phys. B At. Mol. Opt. Phys. 2016, 49, 074007. [Google Scholar] [CrossRef] [Green Version]
- Hamedi, H.R.; Kudriašov, V.; Jia, N.; Qian, J.; Juzeliūnas, G. Ferris wheel patterning of Rydberg atoms using electromagnetically induced transparency with optical vortex fields. Opt. Lett. 2021, 46, 4204–4207. [Google Scholar] [CrossRef]
- Anupriya, J.; Ram, N.; Pattabiraman, M. Hanle electromagnetically induced transparency and absorption resonances with a Laguerre Gaussian beam. Phys. Rev. A 2010, 81, 043804. [Google Scholar] [CrossRef]
- Chanu, S.R.; Natarajan, V. Narrowing of resonances in electromagnetically induced transparency and absorption using a Laguerre–Gaussian control beam. Opt. Commun. 2013, 295, 150–154. [Google Scholar] [CrossRef] [Green Version]
- Chauhan, V.S.; Kumar, R.; Manchaiah, D.; Kumar, P.; Easwaran, R.K. Narrowing of electromagnetically induced transparency by using structured coupling light in 85Rb atomic vapor medium. Laser Phys. 2020, 30, 065203. [Google Scholar] [CrossRef]
- Akin, T.; Krzyzewski, S.; Marino, A.; Abraham, E. Electromagnetically induced transparency with Laguerre–Gaussian modes in ultracold rubidium. Opt. Commun. 2015, 339, 209–215. [Google Scholar] [CrossRef] [Green Version]
- Akin, T.; Krzyzewski, S.; Holtfrerich, M.; Abraham, E. Optimization of electromagnetically induced transparency by changing the radial size of Laguerre–Gaussian laser modes. JOSA B 2017, 34, 1286–1293. [Google Scholar] [CrossRef]
- Carr, C.; Adams, C.S.; Weatherill, K.J. Polarization spectroscopy of an excited state transition. Opt. Lett. 2012, 37, 118–120. [Google Scholar] [CrossRef] [PubMed] [Green Version]
- Meyer, D.H.; Kunz, P.D.; Solmeyer, N. Nonlinear polarization spectroscopy of a Rydberg state for laser stabilization. Appl. Opt. 2017, 56, B92–B96. [Google Scholar] [CrossRef] [PubMed]
- Corwin, K.L.; Lu, Z.T.; Hand, C.F.; Epstein, R.J.; Wieman, C.E. Frequency-stabilized diode laser with the Zeeman shift in an atomic vapor. Appl. Opt. 1998, 37, 3295–3298. [Google Scholar] [CrossRef] [PubMed]
- Becerra, F.E.; Willis, R.T.; Rolston, S.L.; Orozco, L.A. Two-photon dichroic atomic vapor laser lock using electromagnetically induced transparency and absorption. J. Opt. Soc. Am. B 2009, 26, 1315–1320. [Google Scholar] [CrossRef]
- Pritchard, J.D. Cooperative Optical Non-Linearity in a Blockaded Rydberg Ensemble; Springer Science & Business Media: Berlin/Heidelberg, Germany, 2012. [Google Scholar]
- Virtanen, P.; Gommers, R.; Oliphant, T.E.; Haberland, M.; Reddy, T.; Cournapeau, D.; Burovski, E.; Peterson, P.; Weckesser, W.; Bright, J.; et al. SciPy 1.0: Fundamental algorithms for scientific computing in Python. Nat. Methods 2020, 17, 261–272. [Google Scholar] [CrossRef] [PubMed] [Green Version]
- Harris, M.; Adams, C.; Cornish, S.; McLeod, I.; Tarleton, E.; Hughes, I. Polarization spectroscopy in rubidium and cesium. Phys. Rev. A 2006, 73, 062509. [Google Scholar] [CrossRef] [Green Version]
- Do, H.D.; Moon, G.; Noh, H.R. Polarization spectroscopy of rubidium atoms: Theory and experiment. Phys. Rev. A 2008, 77, 032513. [Google Scholar] [CrossRef]
- Su, H.J.; Liou, J.Y.; Lin, I.C.; Chen, Y.H. Optimizing the Rydberg EIT spectrum in a thermal vapor. Opt. Express 2022, 30, 1499–1510. [Google Scholar] [CrossRef]


Publisher’s Note: MDPI stays neutral with regard to jurisdictional claims in published maps and institutional affiliations. |
© 2022 by the authors. Licensee MDPI, Basel, Switzerland. This article is an open access article distributed under the terms and conditions of the Creative Commons Attribution (CC BY) license (https://creativecommons.org/licenses/by/4.0/).
Share and Cite
Duarte Gomes, N.; da Fonseca Magnani, B.; Massayuki Kondo, J.D.; Marcassa, L.G. Polarization Spectroscopy Applied to Electromagnetically Induced Transparency in Hot Rydberg Atoms Using a Laguerre–Gaussian Beam. Atoms 2022, 10, 58. https://doi.org/10.3390/atoms10020058
Duarte Gomes N, da Fonseca Magnani B, Massayuki Kondo JD, Marcassa LG. Polarization Spectroscopy Applied to Electromagnetically Induced Transparency in Hot Rydberg Atoms Using a Laguerre–Gaussian Beam. Atoms. 2022; 10(2):58. https://doi.org/10.3390/atoms10020058
Chicago/Turabian StyleDuarte Gomes, Naomy, Bárbara da Fonseca Magnani, Jorge Douglas Massayuki Kondo, and Luis Gustavo Marcassa. 2022. "Polarization Spectroscopy Applied to Electromagnetically Induced Transparency in Hot Rydberg Atoms Using a Laguerre–Gaussian Beam" Atoms 10, no. 2: 58. https://doi.org/10.3390/atoms10020058
APA StyleDuarte Gomes, N., da Fonseca Magnani, B., Massayuki Kondo, J. D., & Marcassa, L. G. (2022). Polarization Spectroscopy Applied to Electromagnetically Induced Transparency in Hot Rydberg Atoms Using a Laguerre–Gaussian Beam. Atoms, 10(2), 58. https://doi.org/10.3390/atoms10020058