
Resolution Characterizations of JetRIS in Mainz Using 164Dy

 ,
,  , , and
Abstract
:1. Introduction
2. Experimental Procedure
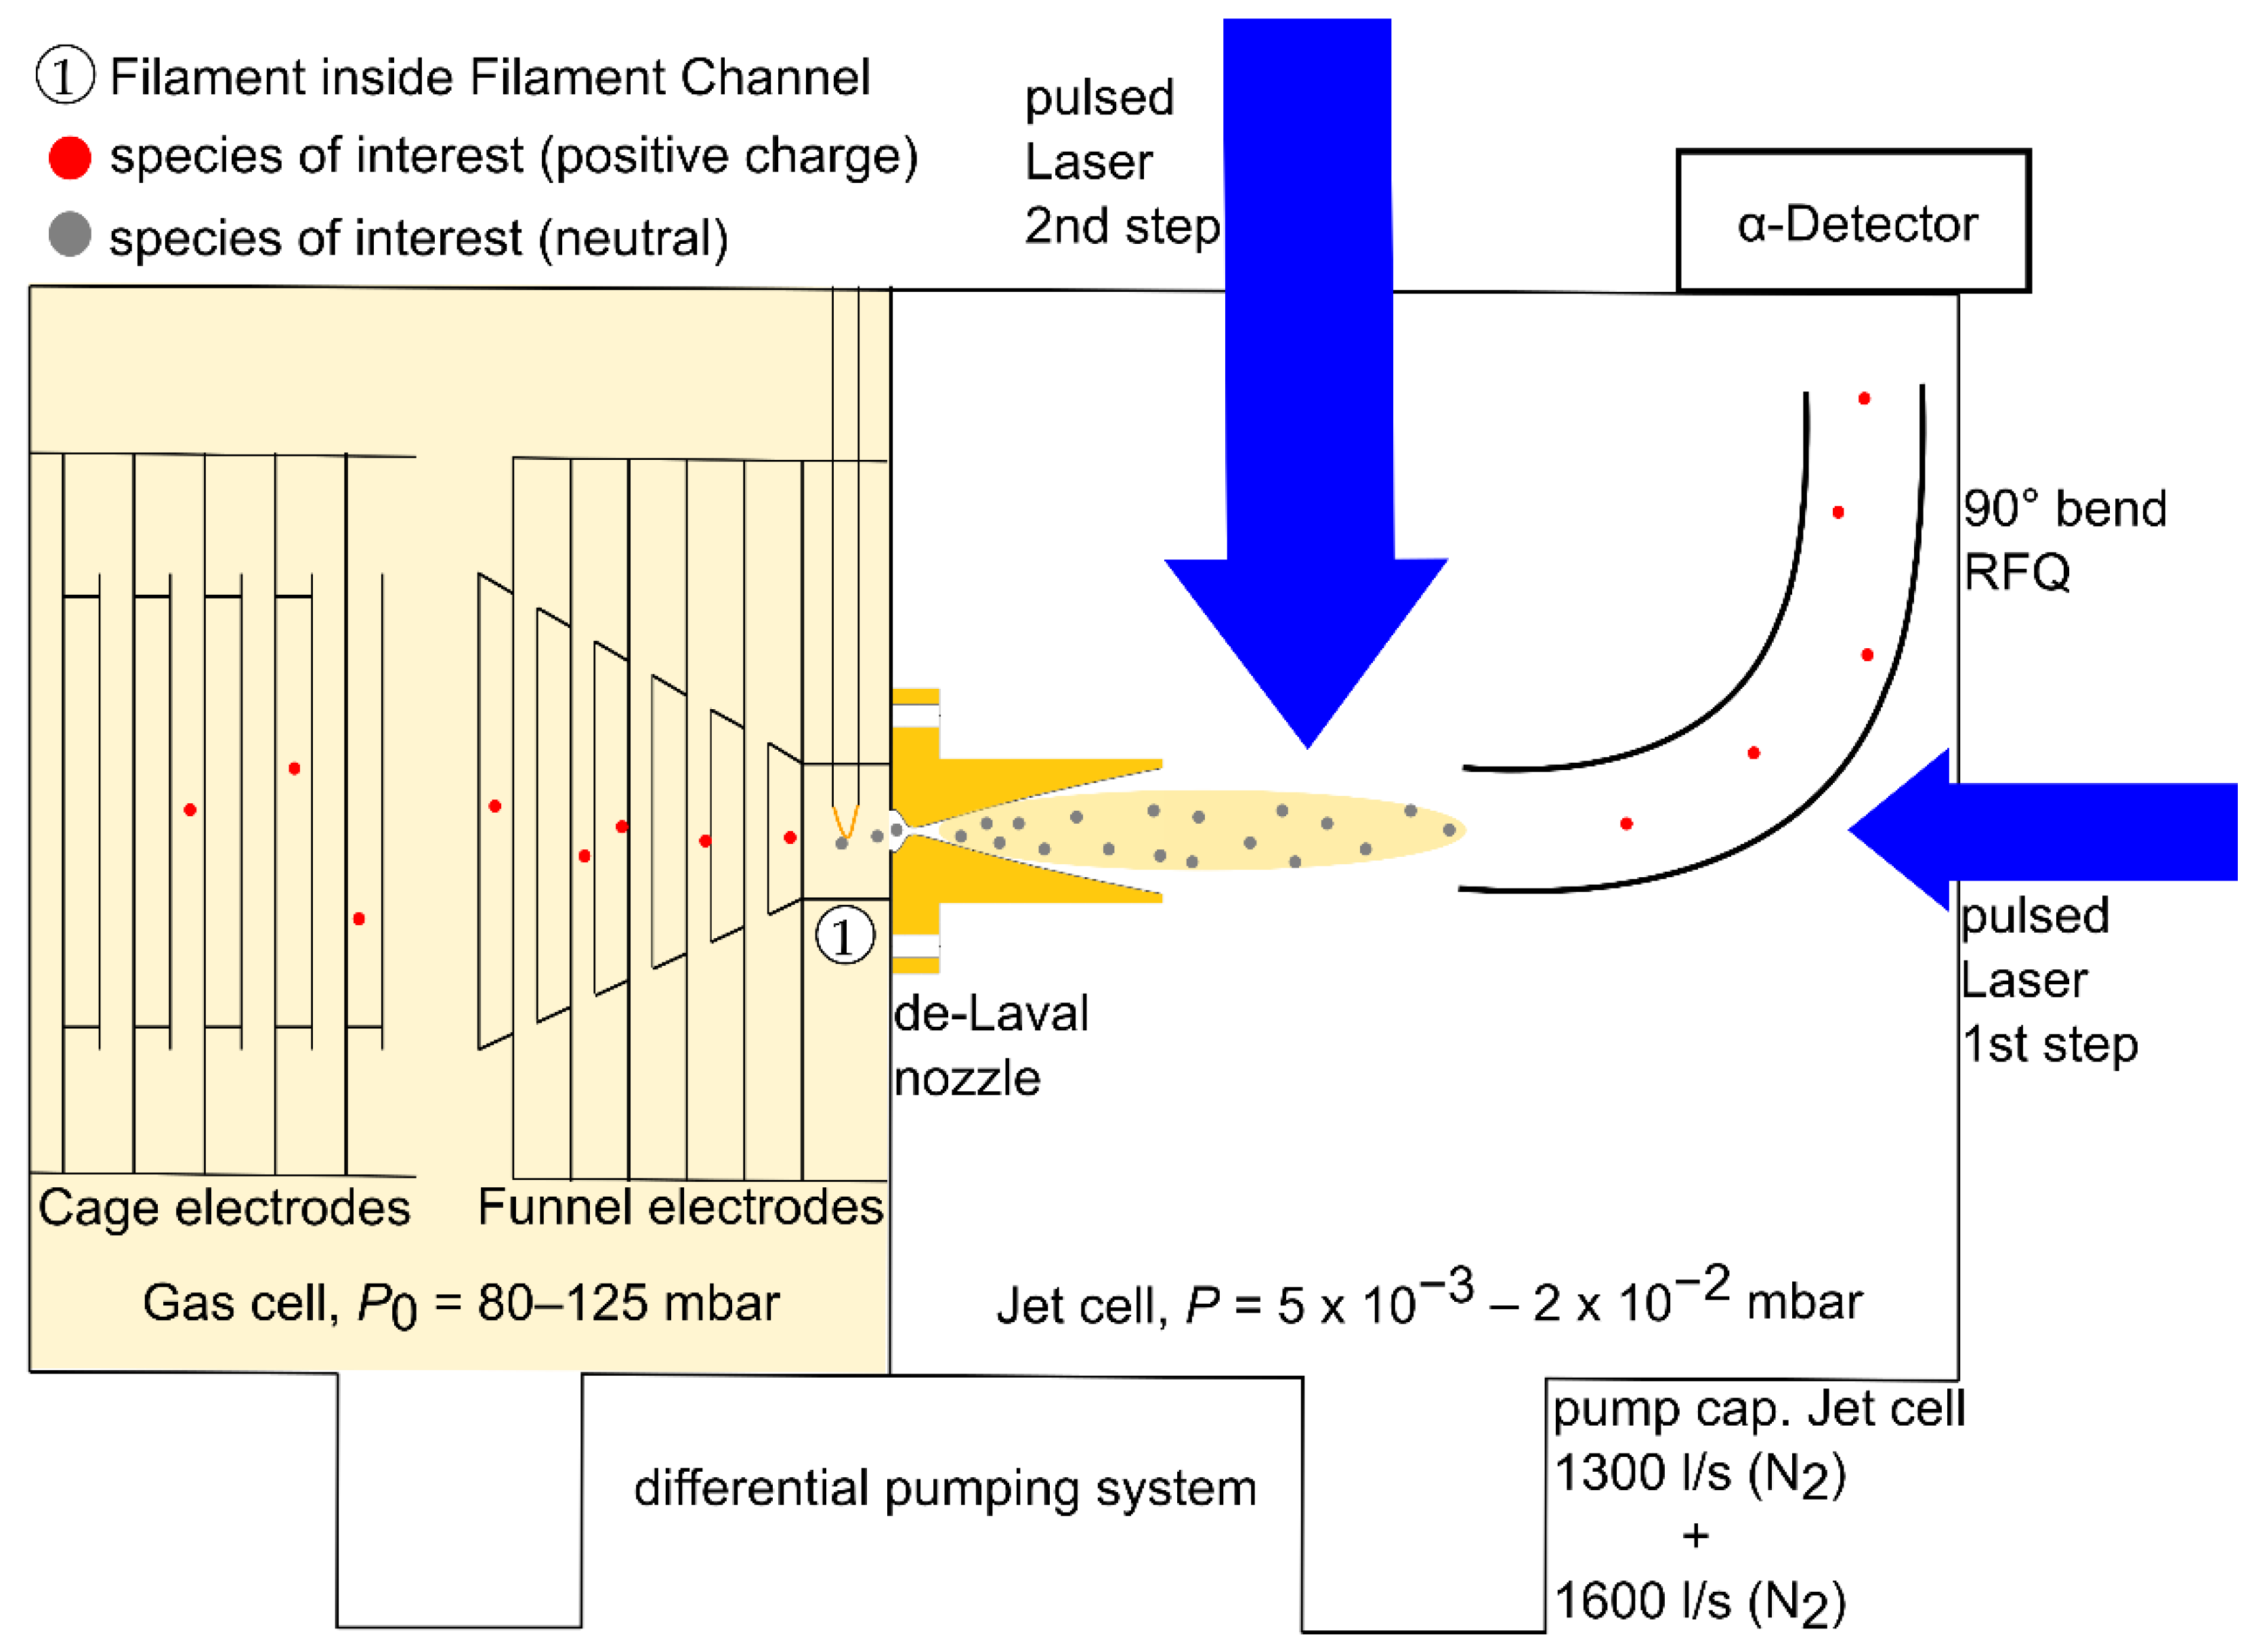
2.1. A Technical Overview of JetRIS
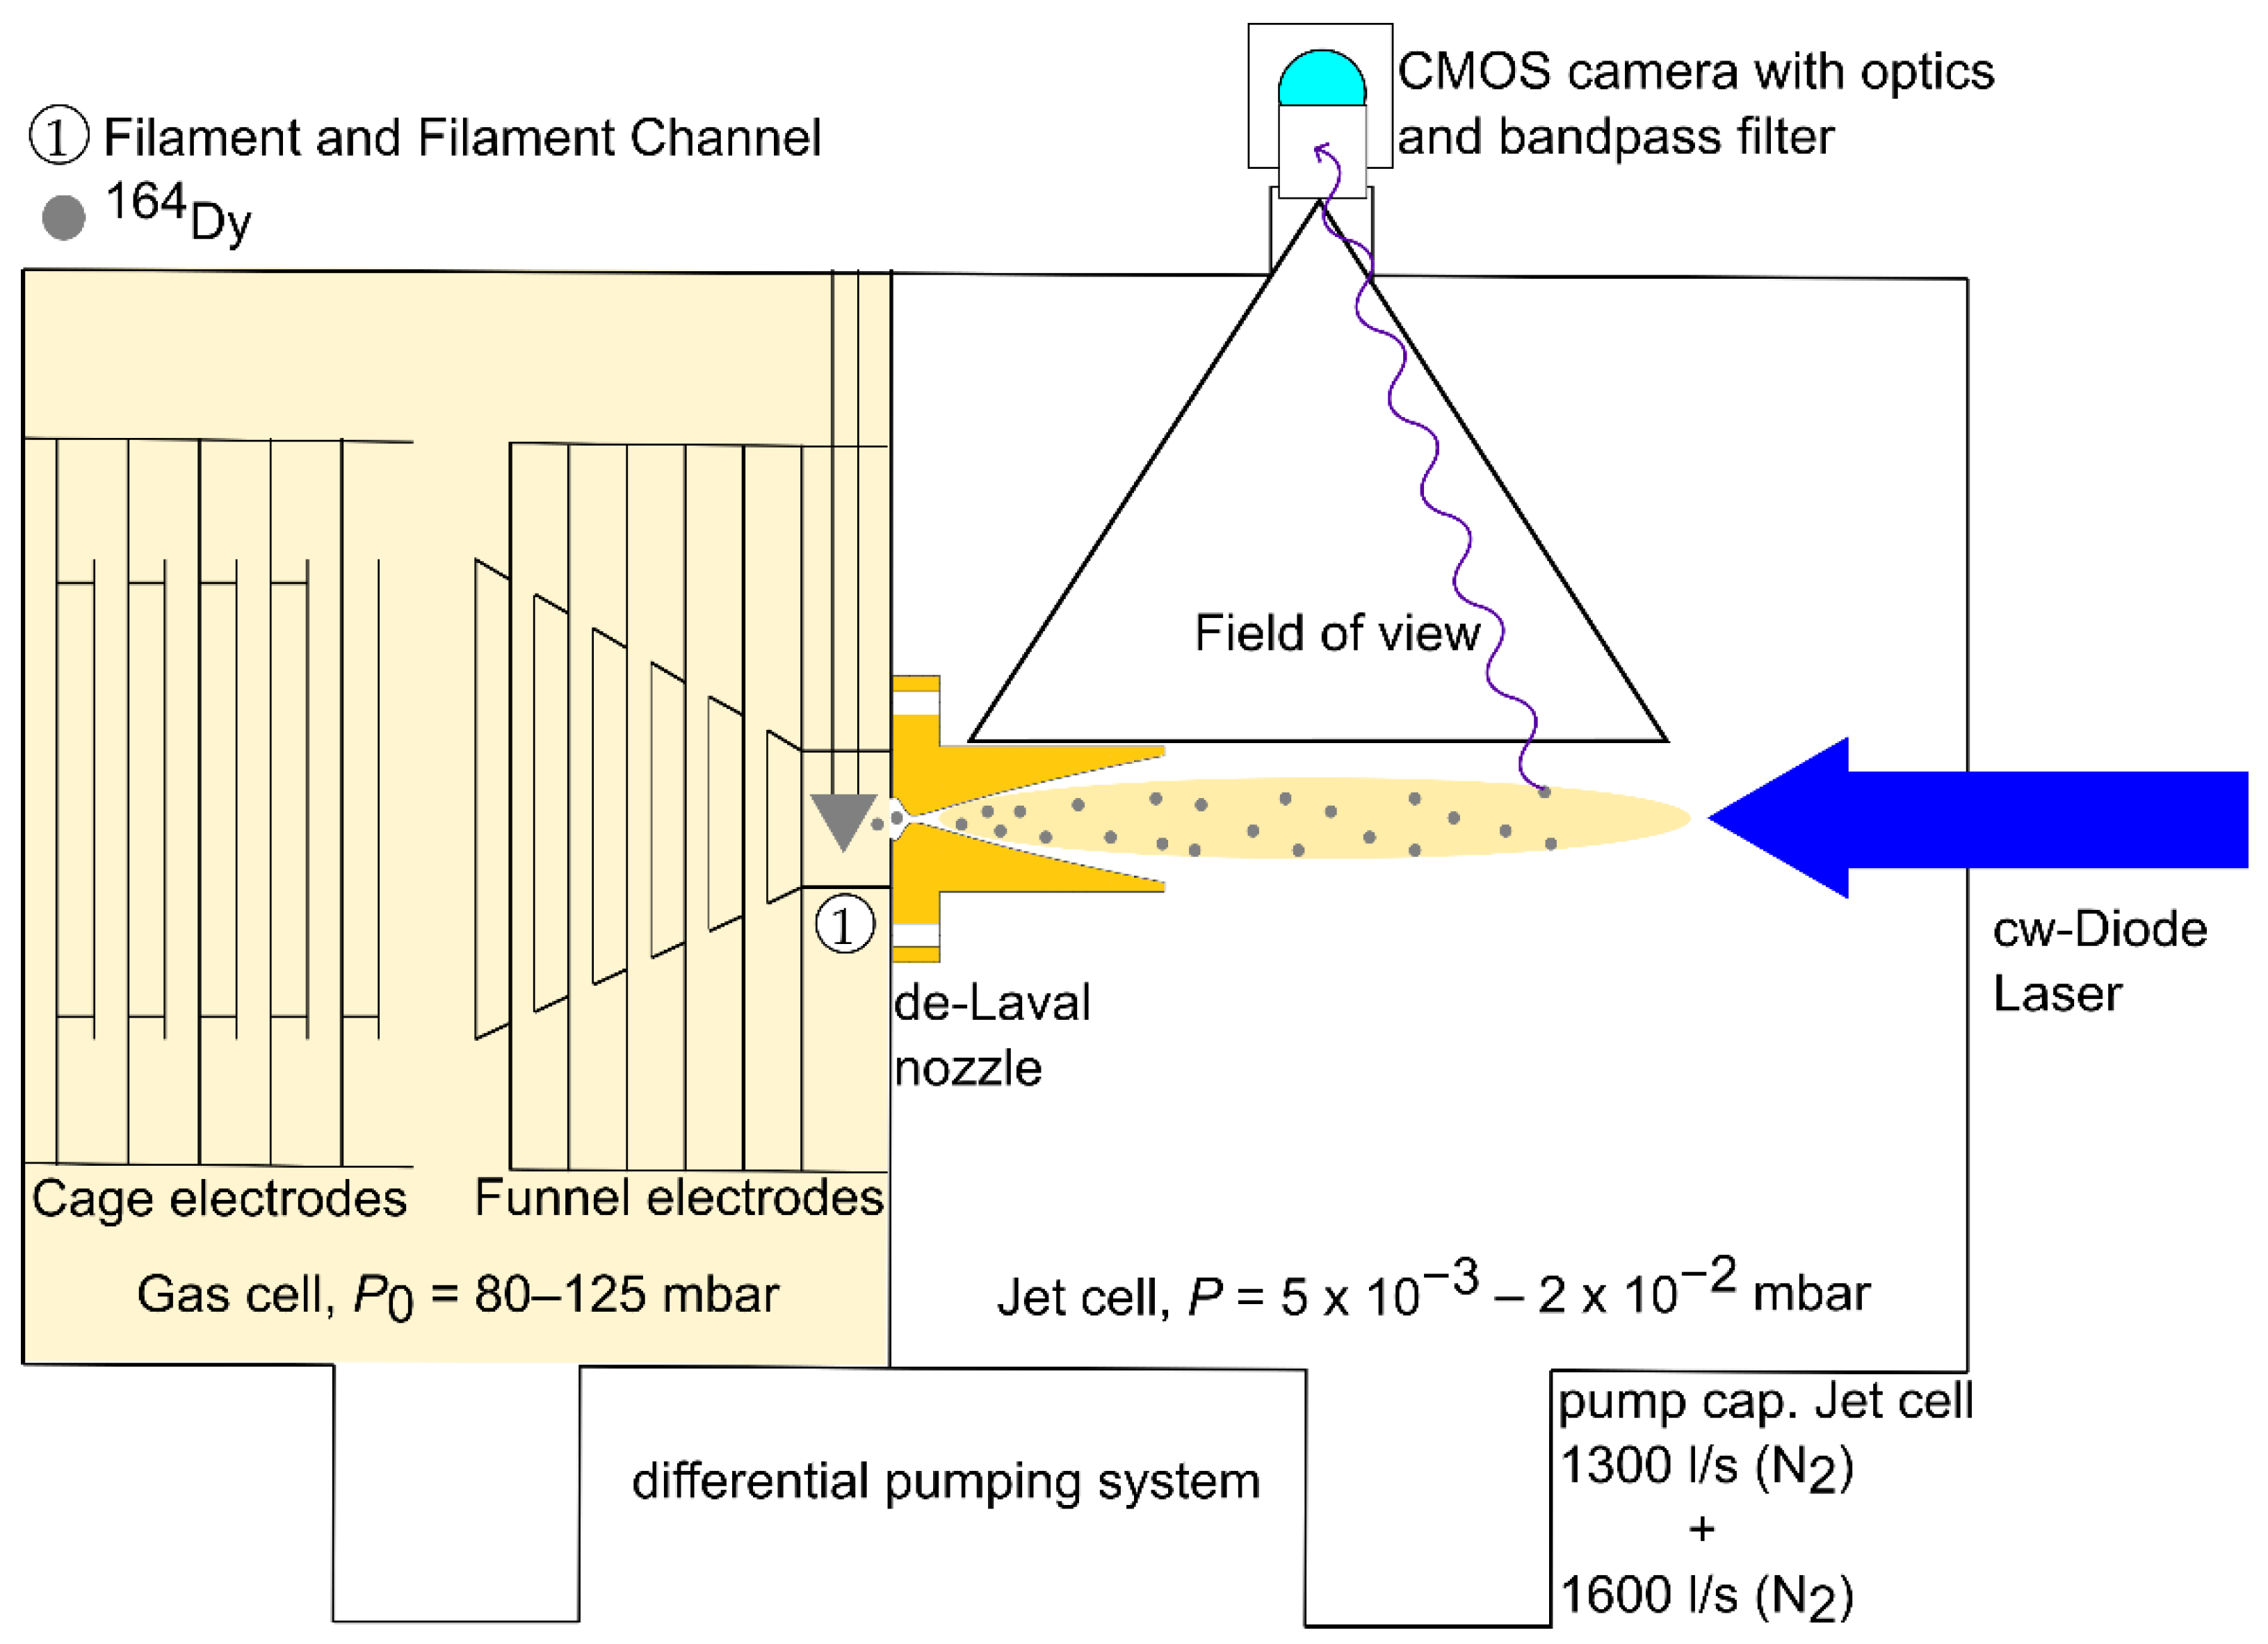
2.2. Fluorescence Characterization
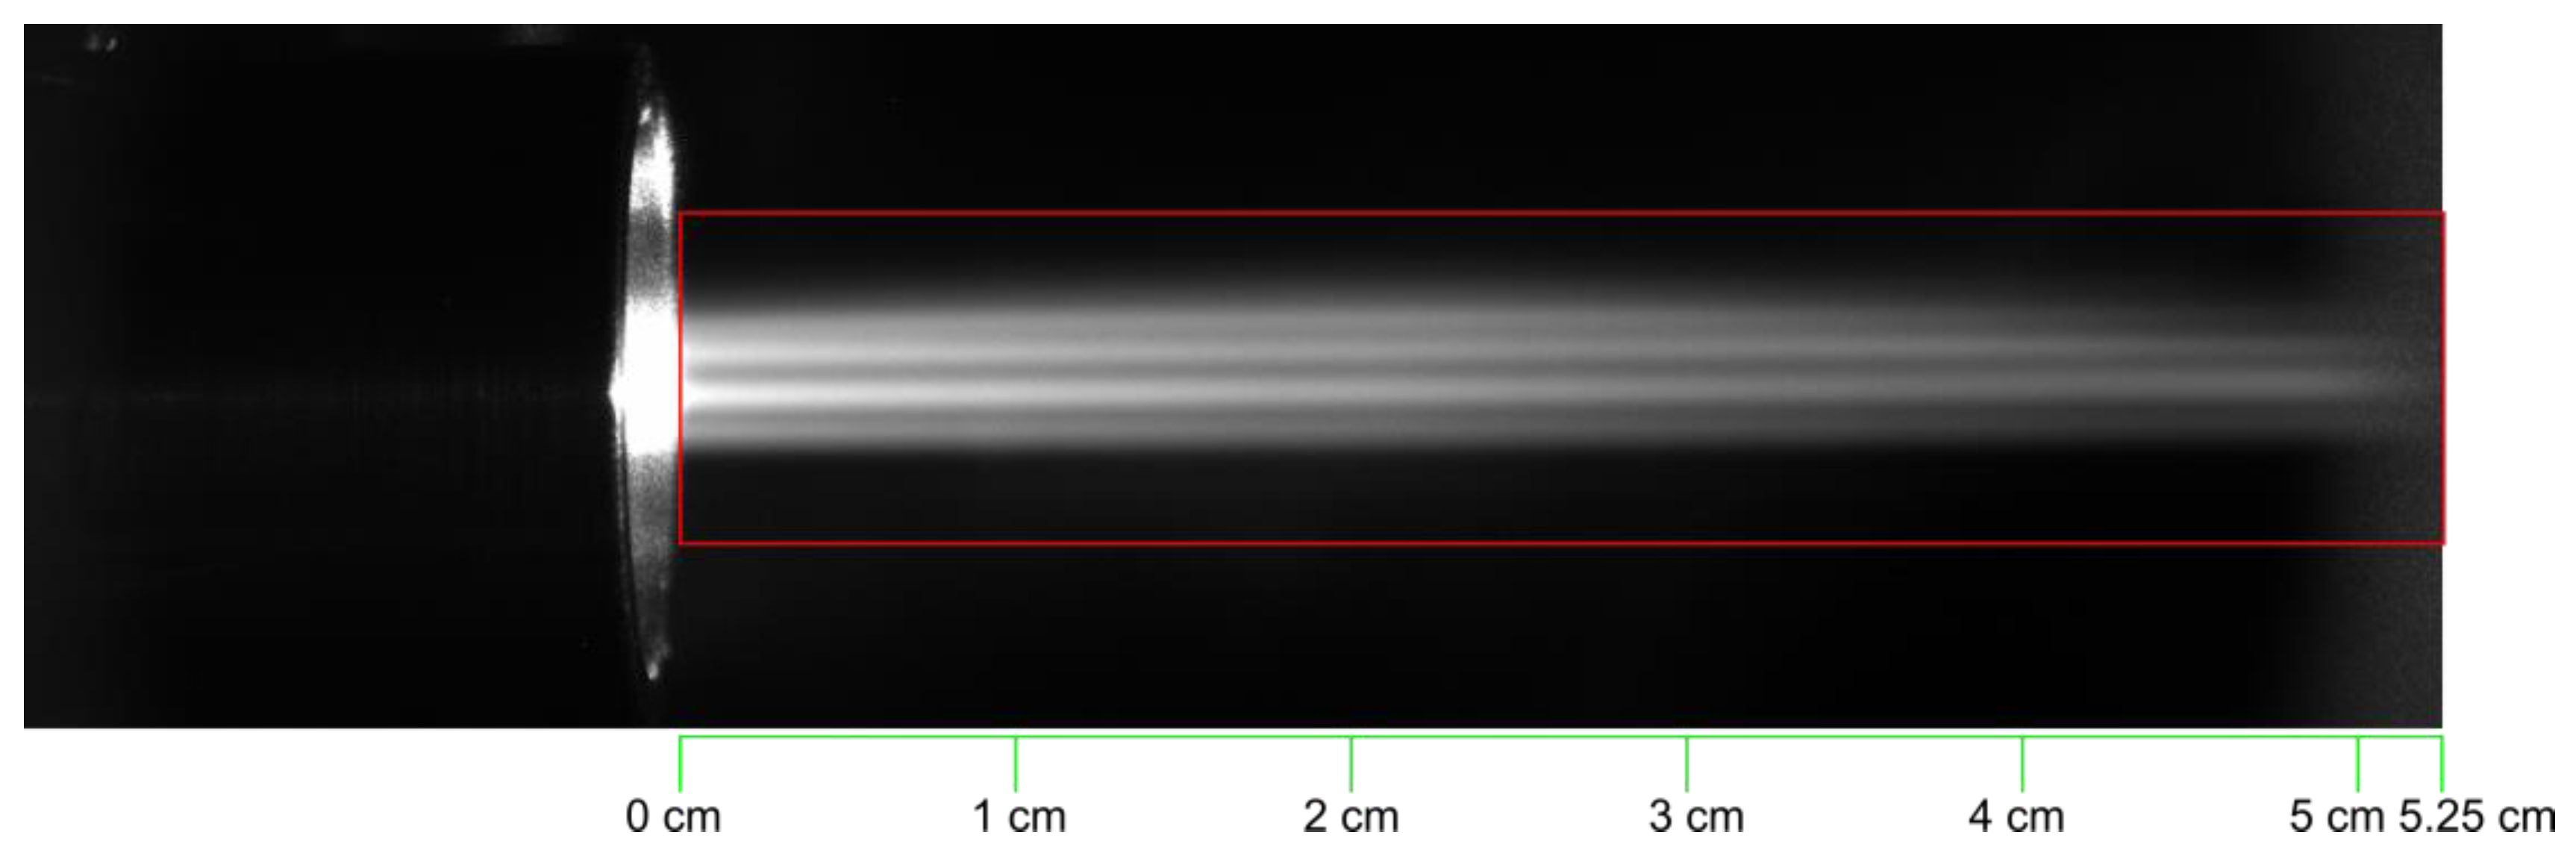
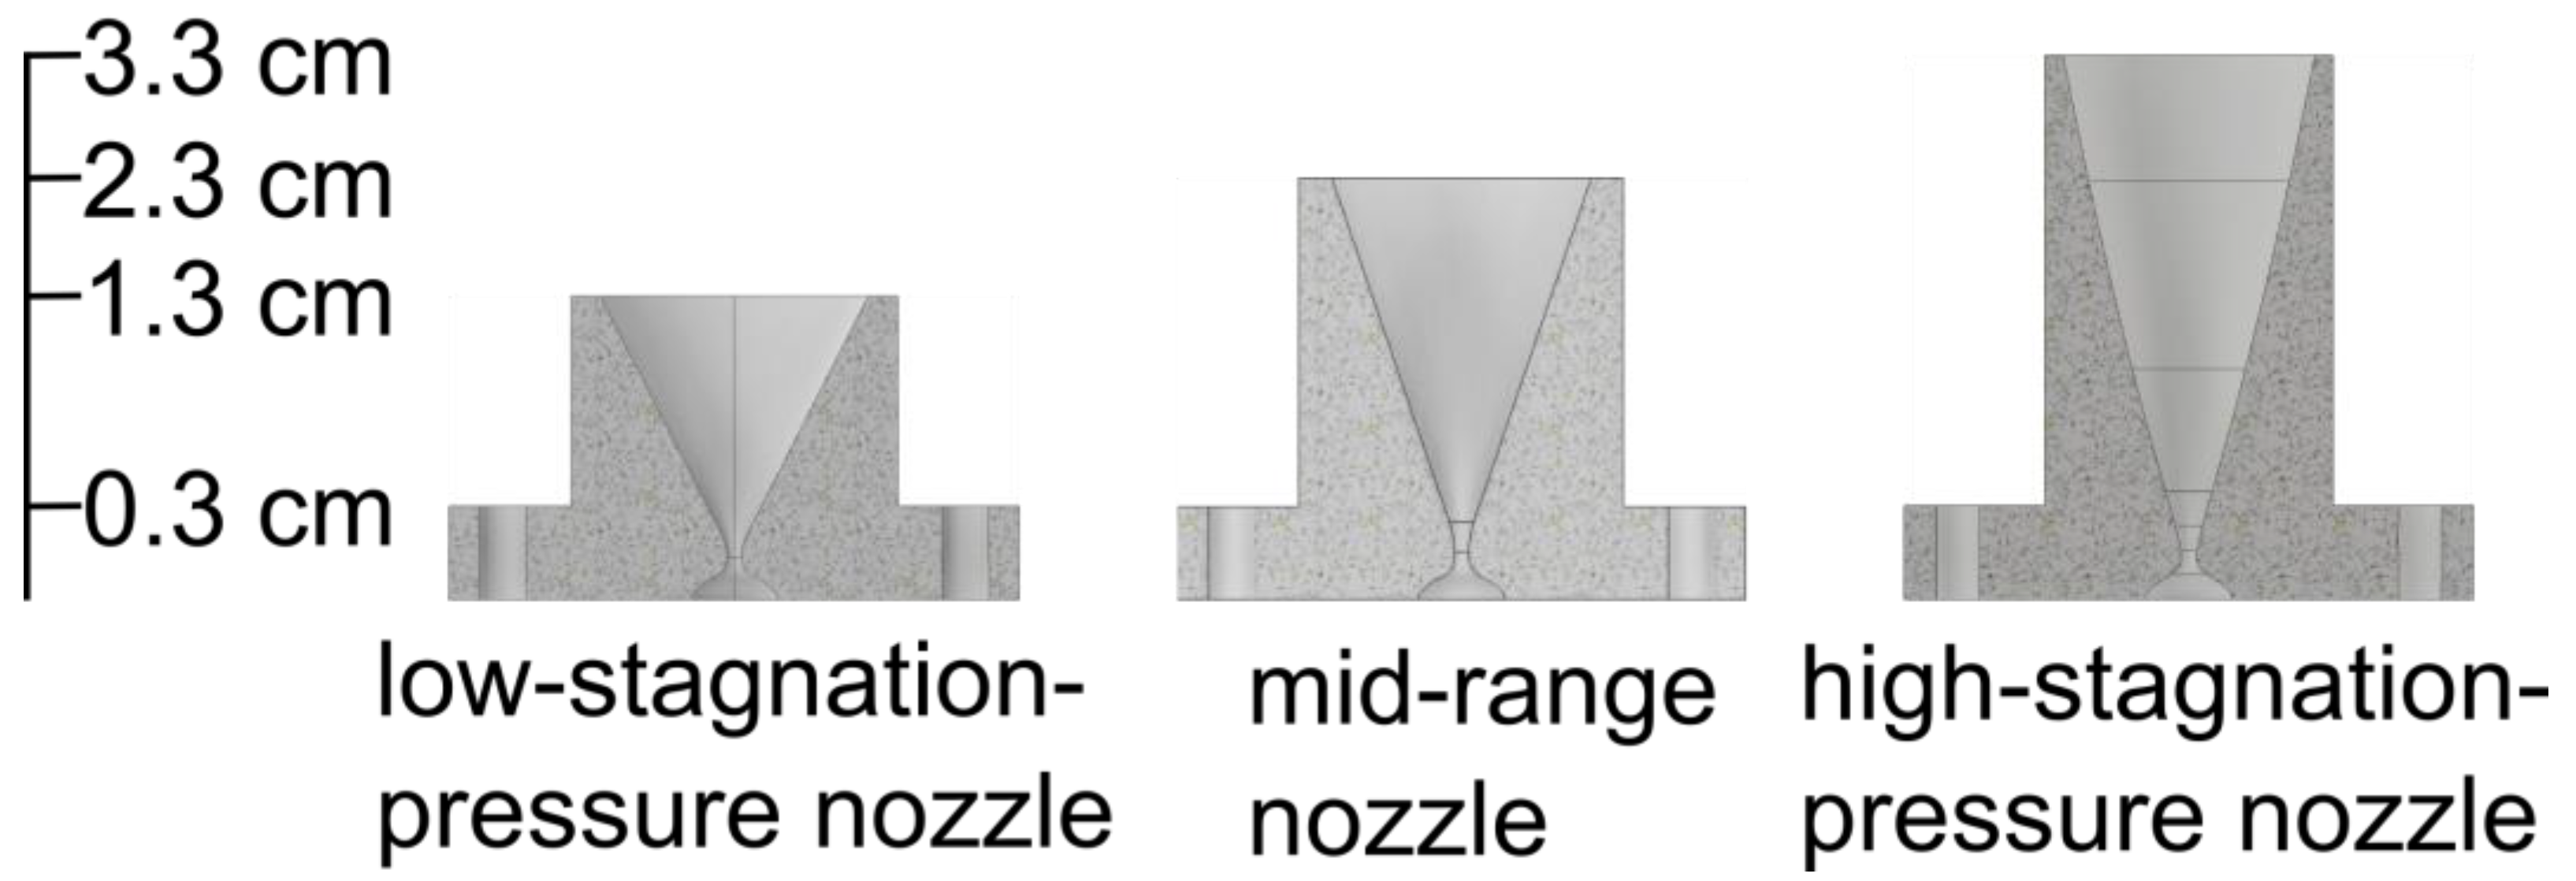
2.3. Characterization of the Gas-Jet
3. Results
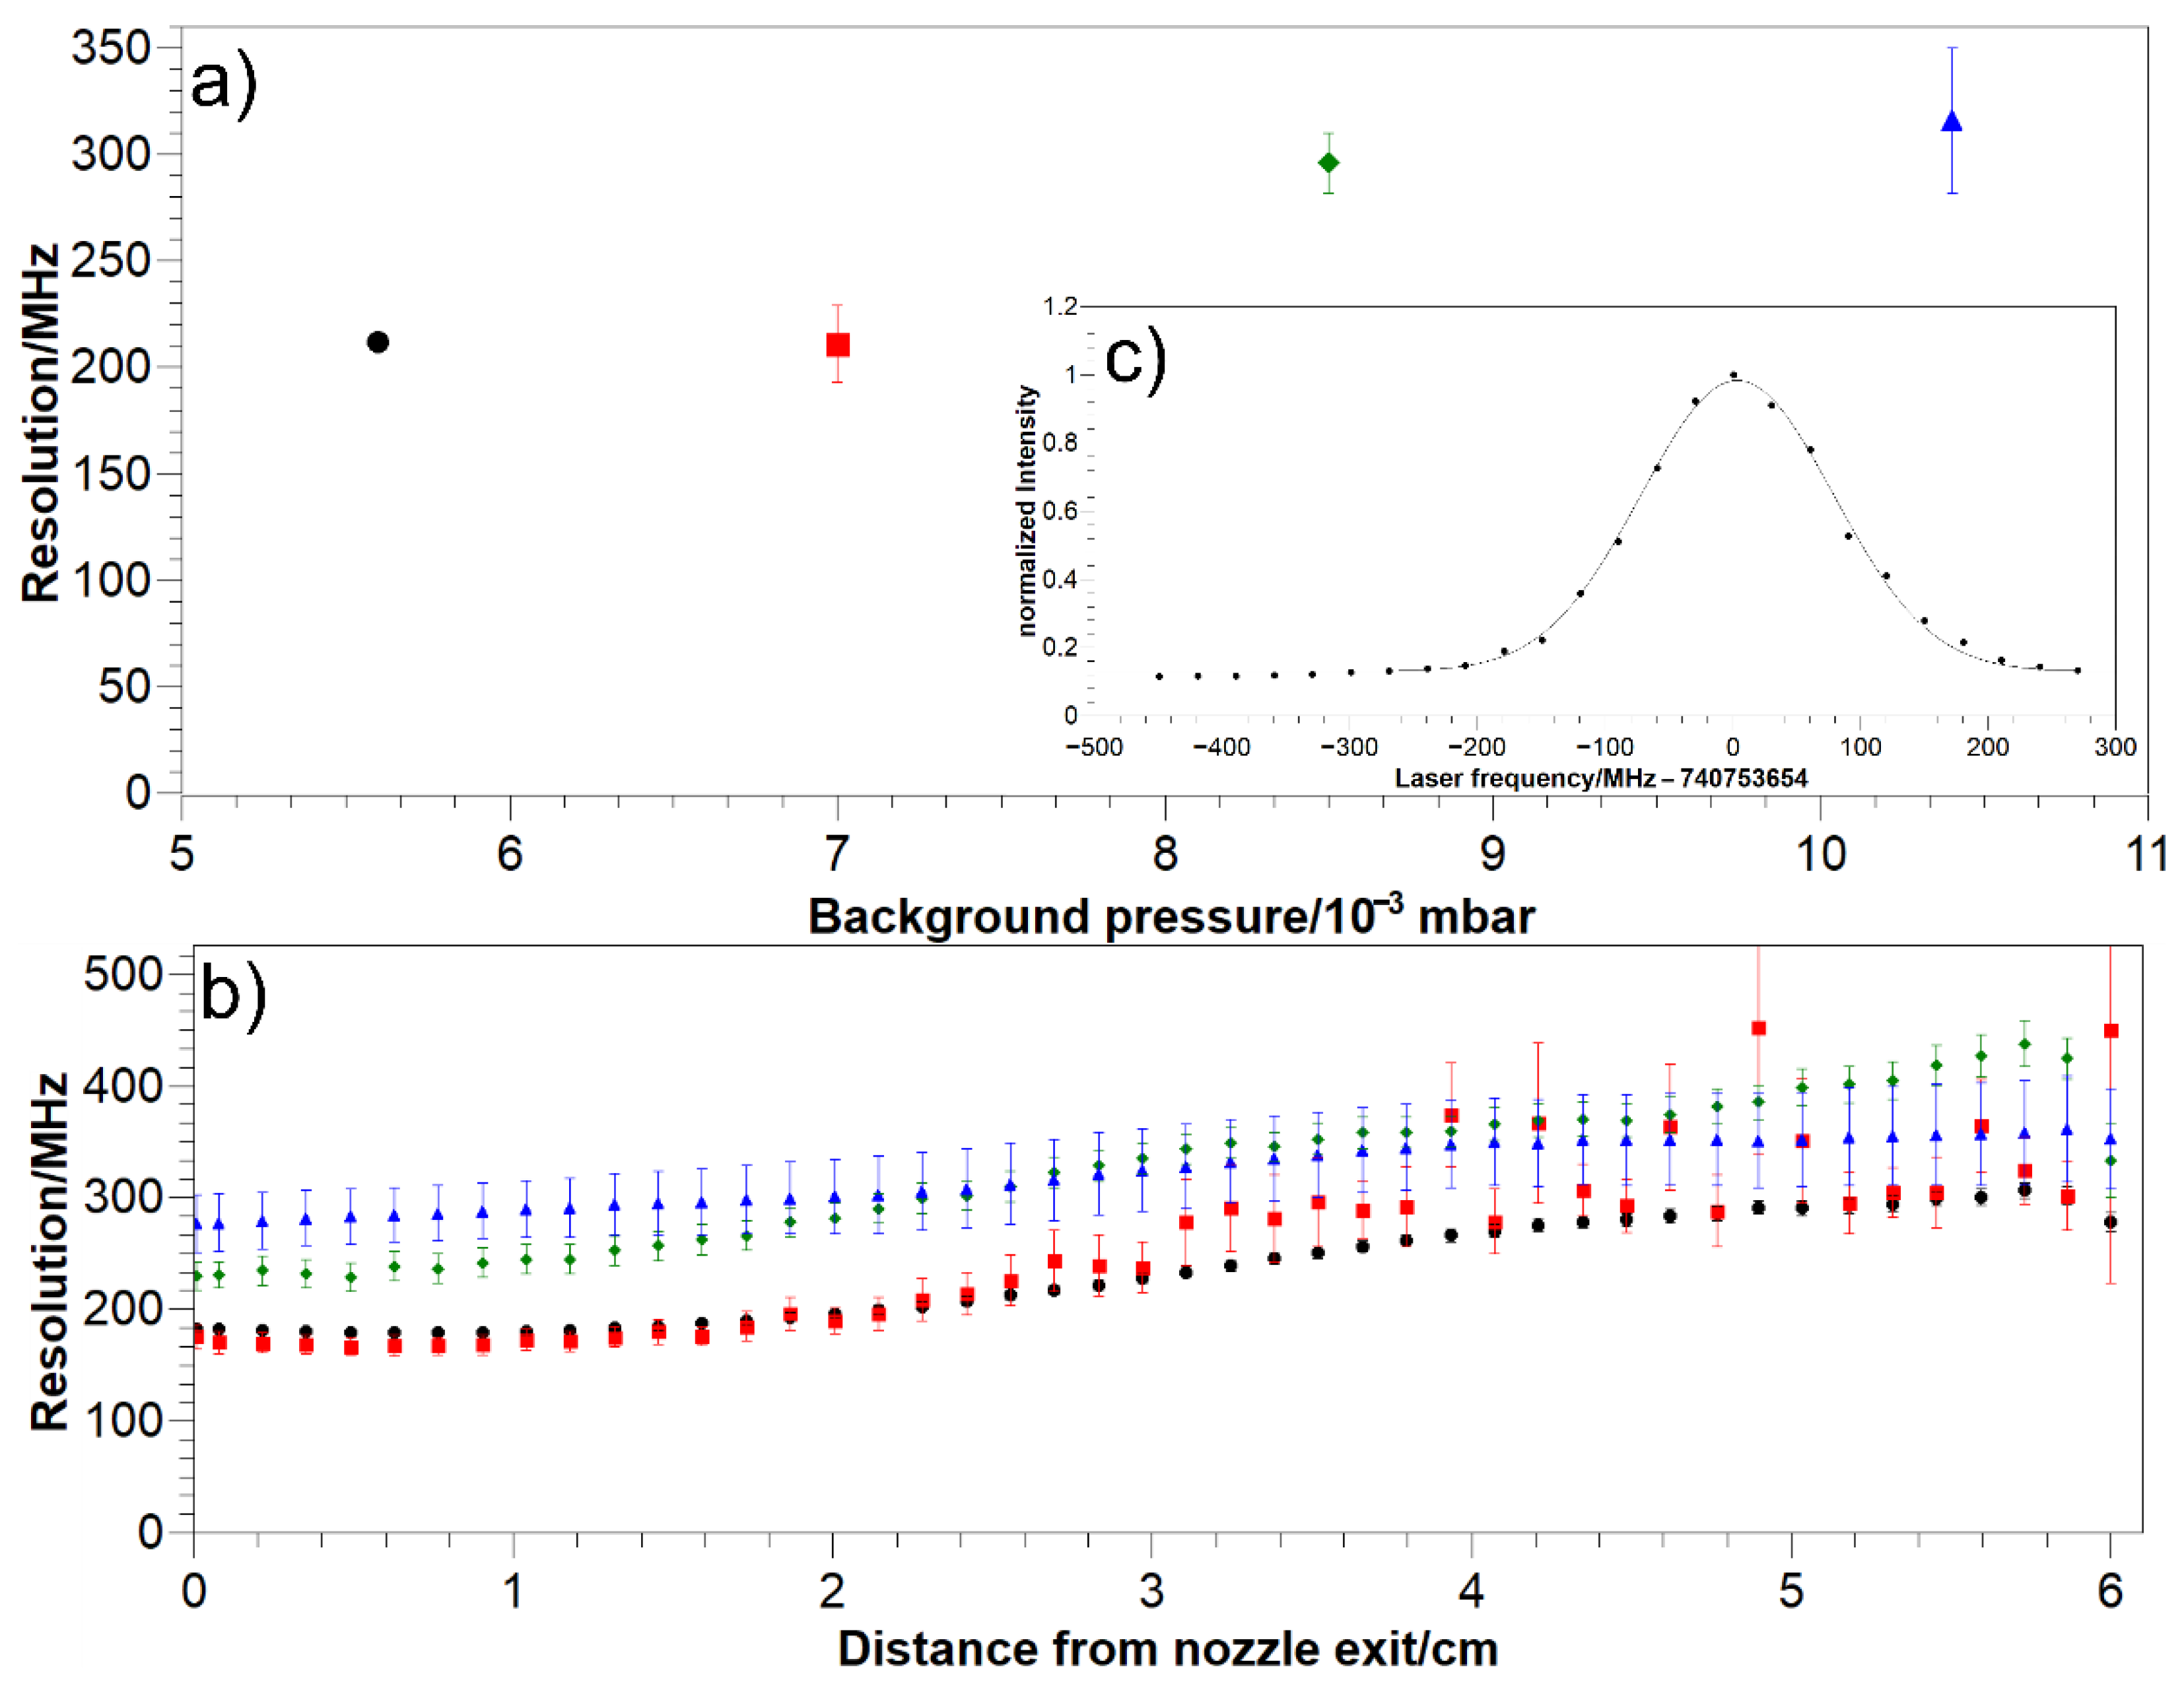
3.1. Resolution
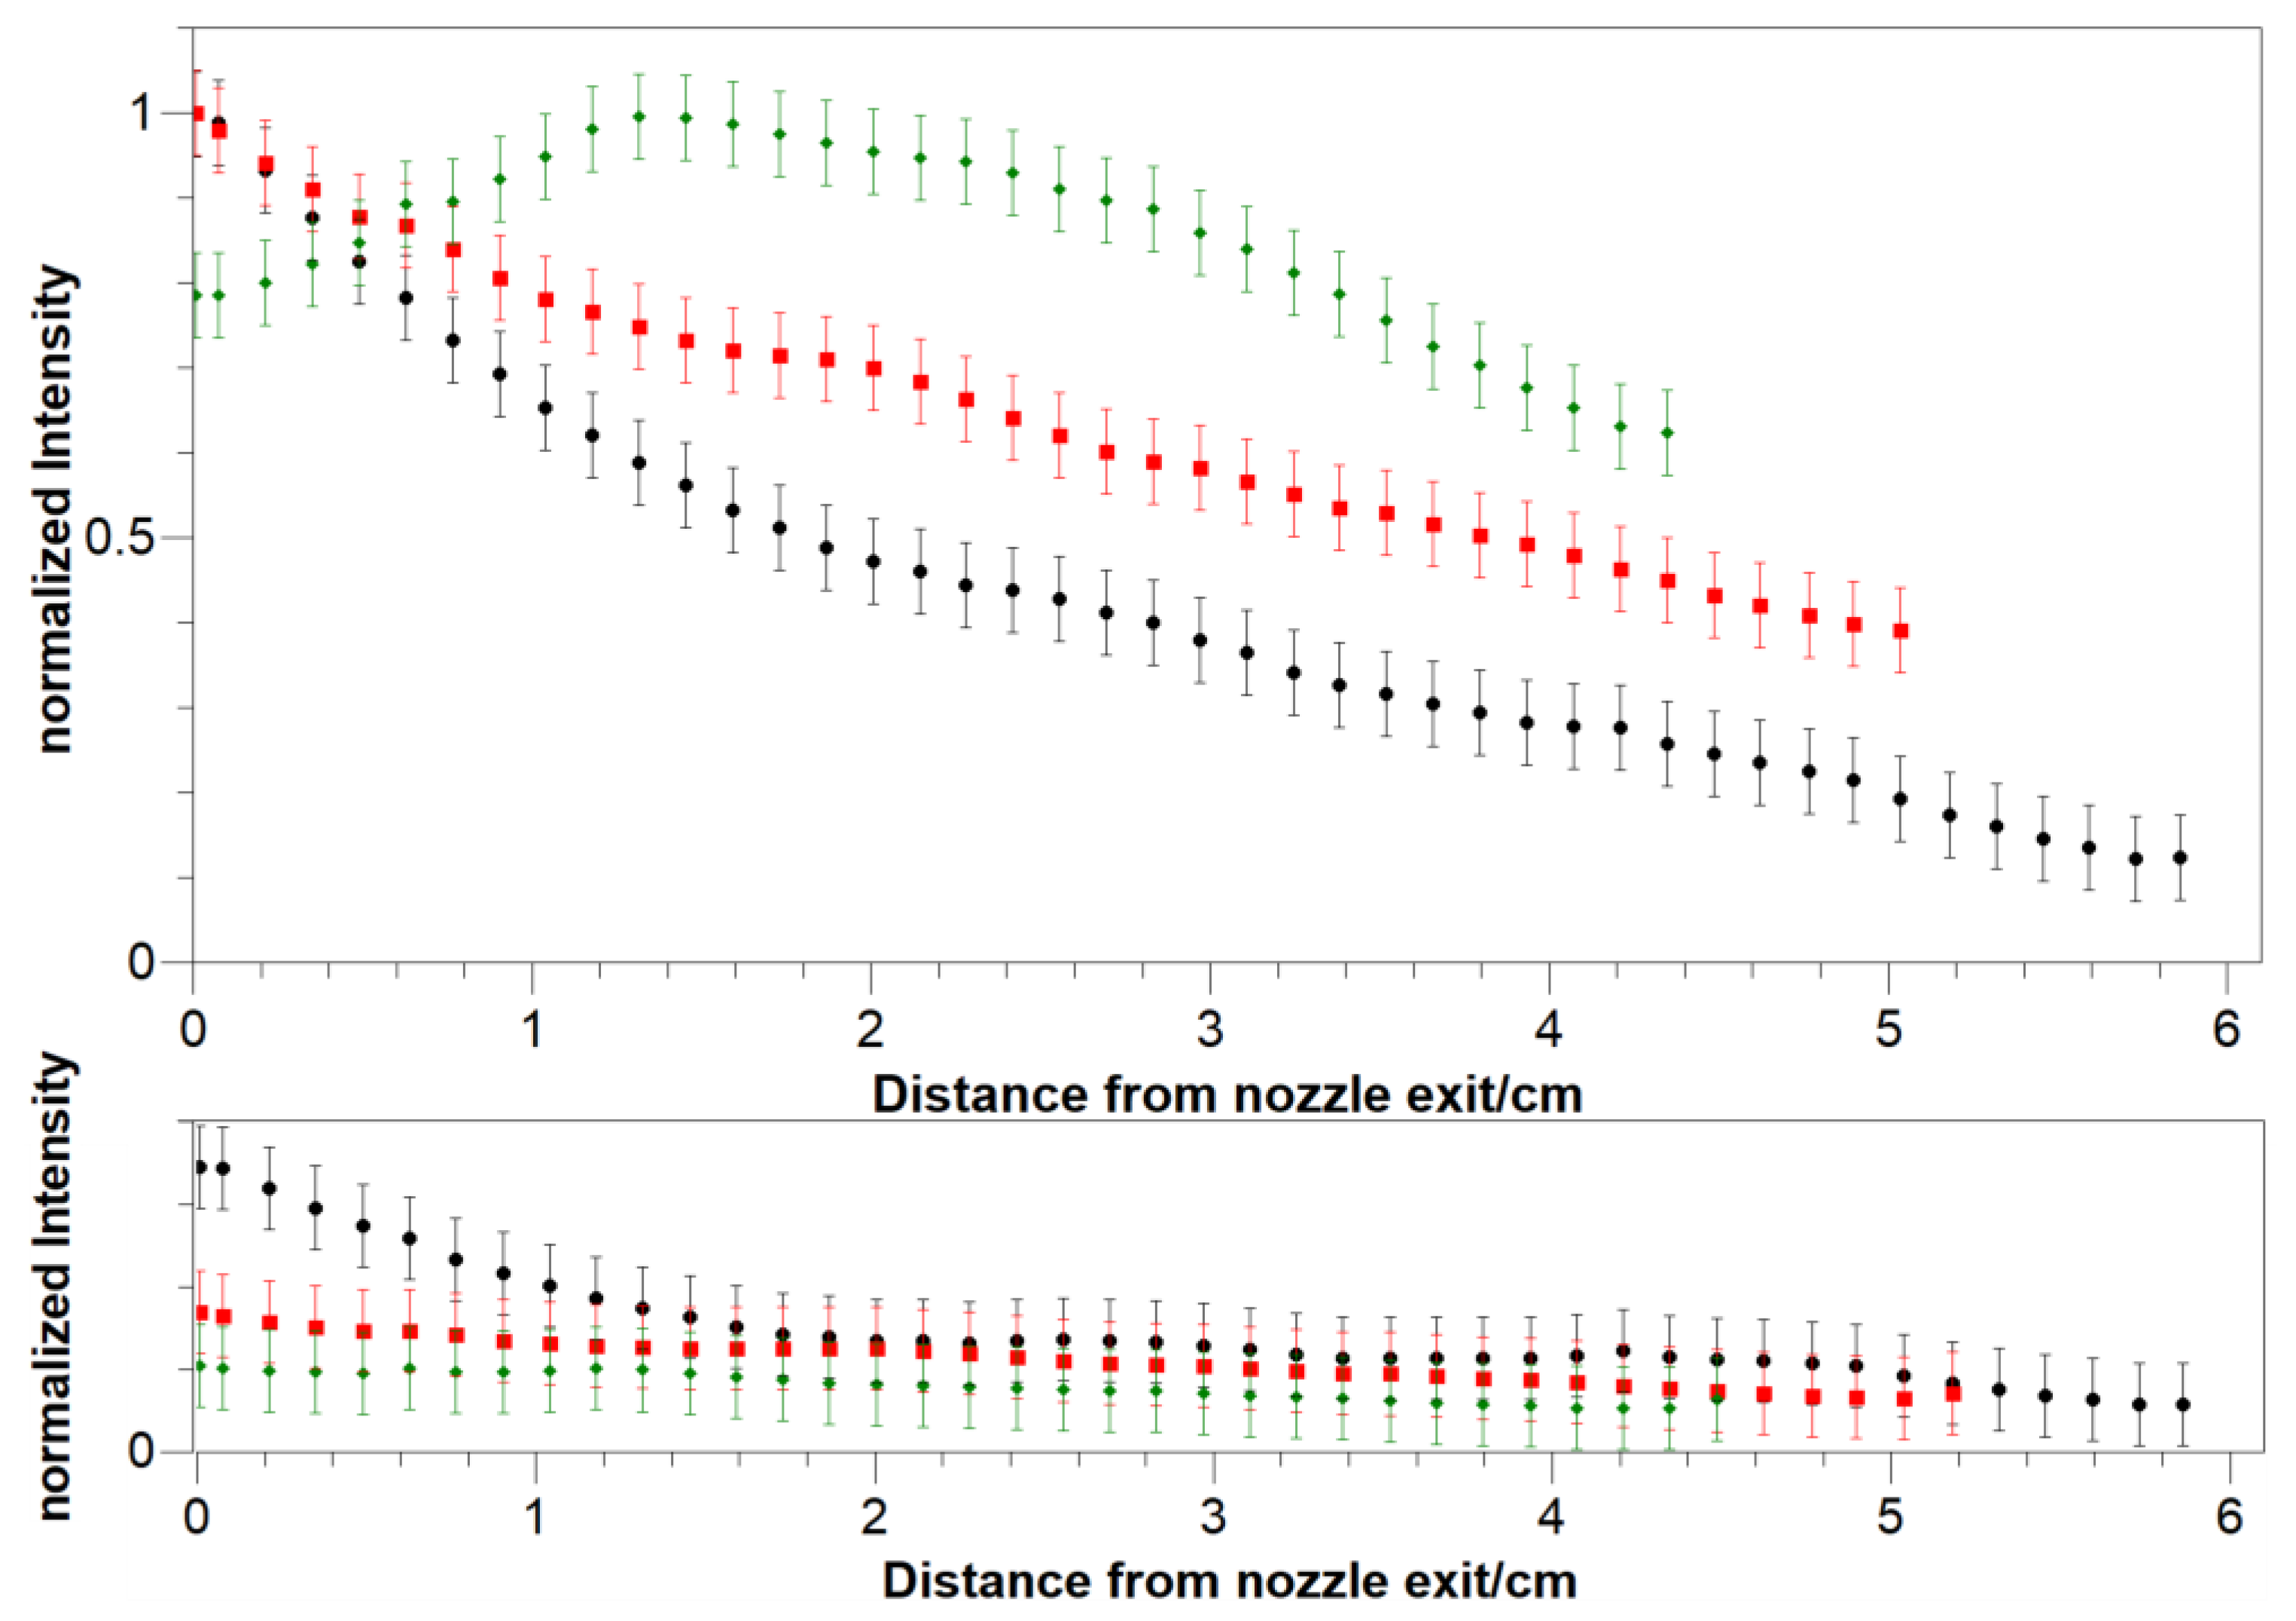
3.2. Mach Number
3.3. Homogeneity Factor
4. Summary and Outlook
Author Contributions
Funding
Data Availability Statement
Acknowledgments
Conflicts of Interest
References
- Kluge, H.-J.; Nörtershäuser, W. Lasers for nuclear physics. Spectrochim. Acta B 2003, 58, 1031–1045. [Google Scholar] [CrossRef]
- Cheal, B.; Flanagan, K.T. Progress in laser spectroscopy at radioactive ion beam facilities. J. Phys. G Nucl. Part. Phys. 2010, 37, 113101. [Google Scholar] [CrossRef]
- Campbell, P.; Moore, I.; Pearson, M. Laser spectroscopy for nuclear structure physics. Prog. Part. Nucl. Phys. 2016, 86, 127–180. [Google Scholar] [CrossRef]
- Block, M.; Laatiaoui, M.; Raeder, S. Raeder. Recent progress in laser spectroscopy of the actinides. Prog. Part. Nucl. Phys. 2021, 116, 103834. [Google Scholar] [CrossRef]
- Hofmann, S.; Münzenberg, G. The discovery of the heaviest elements. Rev. Mod. Phys. 2000, 72, 733–767. [Google Scholar] [CrossRef]
- Münzenberg, G.; Faust, W.; Hofmann, S.; Armbruster, P.; Güttner, K.; Ewald, H. The velocity filter SHIP, a separator of unslowed heavy ion fusion products. Nucl. Instrum. Methods 1979, 161, 65–82. [Google Scholar] [CrossRef]
- Laatiaoui, M.; Lauth, W.; Backe, W.L.H.; Block, M.; Ackermann, D.; Cheal, B.; Chhetri, P.; Düllmann, C.; Van Duppen, P.; Even, J.; et al. Atom-at-a-time laser resonance ionization spectroscopy of nobelium. Nature 2016, 538, 495–498. [Google Scholar] [CrossRef] [PubMed]
- Backe, H.; Lauth, W.; Block, M.; Laatiaoui, M. Prospects for laser spectroscopy, ion chemistry and measurements of superheavy elements in buffer-gas traps. Nucl. Phys. A 2015, 944, 492–517. [Google Scholar] [CrossRef]
- Lauth, W.; Backe, H.; Dahlinger, M.; Klaft, I.; Schwamb, P.; Schwickert, G.; Trautmann, N.; Othmer, U. Resonance Ionization spectroscopy in a buffer gas cell with radioactive decay detection, demonstrated using 208Tl. Phys. Rev. Lett. 1992, 68, 1675–1678. [Google Scholar] [CrossRef] [PubMed]
- Raeder, S.; Block, M.; Chhetri, P.; Ferrer, R.; Kraemer, S.; Kron, T.; Laatiaoui, M.; Nothhelfer, S.; Schneider, F.; Van Duppen, P.; et al. A gas-jet apparatus for high-resolution laser spectroscopy on the heaviest elements at SHIP. Nucl. Instrum. Methods Phys. Res. Sect. B Beam Interact. Mater. At. 2020, 463, 272–276. [Google Scholar] [CrossRef]
- Kudryavtsev, Y.; Ferrer, R.; Huyse, M.; Bergh, P.V.D.; Van Duppen, P. The in-gas-jet laser ion source: Resonance ionization spectroscopy of radioactive atoms in supersonic gas jets. Nucl. Instrum. Methods Phys. Res. Sect. B Beam Interact. Mater. B Beam Interact. Mater. At. 2013, 297, 7–22. [Google Scholar] [CrossRef] [Green Version]
- Raeder, S.; Bastin, B.; Block, M.; Creemers, P.; Delahaye, P.; Ferrer, R.; Fléchard, X.; Franchoo, S.; Ghys, L.; Gaffney, L.P.; et al. Developments towards in-gas-jet laser spectroscopy studies of actinium isotopes at LISOL. Nucl. Instrum. Methods Phys. Res. Sect. B Beam Interact. Mater. At. 2016, 376, 382–387. [Google Scholar] [CrossRef]
- Ferrer, R.; Barzakh, A.; Bastin, B.; Beerwerth, R.; Block, M.; Creemers, P.; Grawe, H.; de Groote, R.; Delahaye, P.; Fléchard, X.; et al. Towards high- resolution laser ionization spectroscopy of the heaviest elements in supersonic gas jet expansion. Nat. Commun. 2017, 8, 14520. [Google Scholar] [CrossRef] [PubMed] [Green Version]
- Laatiaoui, M.; Backe, H.; Block, M.; Chhetri, P.; Lautenschläger, F.; Lauth, W.; Walther, T. Perspectives for laser spectroscopy of the element nobelium. Hyperfine Interact 2013, 227, 69–75. [Google Scholar] [CrossRef]
- Lautenschläger, F.; Chhetri, P.; Ackermann, D.; Backe, H.; Block, M.; Cheal, B.; Clark, A.; Droese, C.; Ferrer, R.; Giacoppo, F.; et al. Developments for resonance ionization laser spectroscopy of the heaviest elements at SHIP. Nucl. Instrum. Methods Phys. Res. Sect. B Beam Interact. Mater. At. 2016, 383, 115–122. [Google Scholar] [CrossRef]
- Ferrer, R.; Verlinde, M.; Verstraelen, E.; Claessens, A.; Huyse, M.; Kraemer, S.; Kudryavtsev, Y.; Romans, J.; Bergh, P.V.D.; Van Duppen, P.; et al. Hypersonic nozzle for laser-spectroscopy studies at 17 K characterized by resonance-ionization-spectroscopy-based flow mapping. Phys. Rev. Res. 2021, 3, 043041. [Google Scholar] [CrossRef]
- Zadvornaya, A.; Creemers, P.; Dockx, K.; Ferrer, R.; Gaffney, L.P.; Gins, W.; Granados, C.; Huyse, M.; Kudryavtsev, Y.; Laatiaoui, M.; et al. Characterization of Supersonic Gas Jets for High-Resolution Laser Ionization Spectroscopy of Heavy Elements. Phys. Rev. X 2018, 8, 041008. [Google Scholar] [CrossRef] [Green Version]
- Wickliffe, M.; Lawler, J.; Nave, G. Atomic transition probabilities for Dy I and Dy II. J. Quant. Spectrosc. Radiat. Transf. 2000, 66, 363–404. [Google Scholar] [CrossRef]
- Sansonetti, J.E.; Martin, W.C. Handbook of Basic Atomic Spectroscopic Data. J. Phys. Chem. Ref. Data 2005, 34, 1559–2259. [Google Scholar] [CrossRef] [Green Version]
- Roelens, S. Characterization of a Hypersonic Nozzle for Laser Spectroscopy of Singly-Charged Thorium Ions. Master’s Thesis, KU Leuven, Leuven, Belgium, 2021. [Google Scholar]
- Verstraelen, E. Laser Spectroscopy of Actinides: Octupole Deformation and Gas-Jet Characterization. Ph.D. Thesis, Ku Leuven, Leuven, Belgium, 2021. [Google Scholar]
- Verlinde, M.; Ferrer, R.; Claessens, A.; Granados, C.A.; Kraemer, S.; Kudryavtsev, Y.; Li, D.; Bergh, P.V.D.; Van Duppen, P.; Verstraelen, E. Single-longitudinal-mode pumped pulsed-dye amplifier for high-resolution laser spectroscopy. Rev. Sci. Instrum. 2020, 91, 103002. [Google Scholar] [CrossRef] [PubMed]


| Nozzle | P0/mbar | P/10−3 mbar | M | Δν/MHz | H |
|---|---|---|---|---|---|
| Low-stagnation-pressure nozzle | 80.6 | 5.6 | 7.2 ± 1.0 | 212 ± 30 | 0.40 |
| 80.6 | 7.0 | 7.4 ± 1.0 | 211 ± 35 | 0.26 | |
| 80.0 | 8.5 | 5.0 ± 0.5 | 296 ± 33 | 0.43 | |
| 82.2 | 10.4 | 5.1 ± 0.7 | 316 ± 45 | 0.61 | |
| Mid-range nozzle | 100 | 6.47 | 6.7 ± 0.9 | 250 ± 32 | 0.60 |
| 125 | 7.35 | 7.2 ± 1.0 | 239 ± 33 | 0.67 | |
| 149 | 10.0 | 6.6 ± 0.9 | 259 ± 33 | 0.69 | |
| High-stagnation-pressure nozzle | 125 | 9.3 | 4.2 ± 0.5 | 335 ± 31 | 0.84 |
| 131 | 8.5 | 3.8 ± 0.3 | 352 ± 30 | 0.79 | |
| 154 | 12.2 | 4.6 ± 0.5 | 311 ± 34 | 0.78 |
Publisher’s Note: MDPI stays neutral with regard to jurisdictional claims in published maps and institutional affiliations. |
© 2022 by the authors. Licensee MDPI, Basel, Switzerland. This article is an open access article distributed under the terms and conditions of the Creative Commons Attribution (CC BY) license (https://creativecommons.org/licenses/by/4.0/).
Share and Cite
Münzberg, D.; Block, M.; Claessens, A.; Ferrer, R.; Laatiaoui, M.; Lantis, J.; Nothhelfer, S.; Raeder, S.; Van Duppen, P. Resolution Characterizations of JetRIS in Mainz Using 164Dy. Atoms 2022, 10, 57. https://doi.org/10.3390/atoms10020057
Münzberg D, Block M, Claessens A, Ferrer R, Laatiaoui M, Lantis J, Nothhelfer S, Raeder S, Van Duppen P. Resolution Characterizations of JetRIS in Mainz Using 164Dy. Atoms. 2022; 10(2):57. https://doi.org/10.3390/atoms10020057
Chicago/Turabian StyleMünzberg, Danny, Michael Block, Arno Claessens, Rafael Ferrer, Mustapha Laatiaoui, Jeremy Lantis, Steven Nothhelfer, Sebastian Raeder, and Piet Van Duppen. 2022. "Resolution Characterizations of JetRIS in Mainz Using 164Dy" Atoms 10, no. 2: 57. https://doi.org/10.3390/atoms10020057
APA StyleMünzberg, D., Block, M., Claessens, A., Ferrer, R., Laatiaoui, M., Lantis, J., Nothhelfer, S., Raeder, S., & Van Duppen, P. (2022). Resolution Characterizations of JetRIS in Mainz Using 164Dy. Atoms, 10(2), 57. https://doi.org/10.3390/atoms10020057