Article

Characterizing Low-Energy Charged Particles in the Magnetosphere with the LEM CubeSat Spectrometer Project: Detector Concept and Hardware Characterisation †

by
Riccardo Nicolaidis
1,2,*,‡,
Francesco Nozzoli
1,2,‡,
Giancarlo Pepponi
3,‡,
Pierluigi Bellutti
3,‡,
Evgeny Demenev
3,‡,
Francesco Maria Follega
1,2,‡,
Roberto Iuppa
1,2,‡ and
Veronica Vilona
1,2,‡
1
Department of Physics, University of Trento, 38123 Trento, Italy
2
INFN—Trento Institute for Fundamental Physics and Applications, 38123 Trento, Italy
3
Fondazione Bruno Kessler, 38123 Trento, Italy
*
Author to whom correspondence should be addressed.
This paper is an extended version from the proceeding paper: Nicolaidis, R.; Nozzoli, F.; Pepponi, G.; Bellutti, P.; Demenev, E.; Follega, F.M.; Iuppa, R.; Vilona, V. The Low Energy Module (LEM): Development of a CubeSat spectrometer for sub-MeV particles and Gamma Ray Burst detection. In Proceedings of the 2nd Electronic Conference on Universe, Online, 16 February–2 March 2023.
These authors contributed equally to this work.
Universe 2023, 9(7), 331; https://doi.org/10.3390/universe9070331
Submission received: 8 June 2023 / Revised: 5 July 2023 / Accepted: 6 July 2023 / Published: 11 July 2023

Abstract

:
An accurate flux measurement of low-energy charged particles trapped in the magnetosphere is necessary for space weather characterization and to study the coupling between the lithosphere and magnetosphere, which allows for the investigation of the correlations between seismic events and particle precipitation from Van Allen belts. In this work, the project of a CubeSat space spectrometer, the low-energy module (LEM), is shown. The detector will be able to perform an event-based measurement of the energy, arrival direction, and composition of low-energy charged particles down to 0.1 MeV. Moreover, thanks to a CdZnTe mini-calorimeter, the LEM spectrometer also allows for photon detection in the sub-MeV range, joining the quest for the investigation of the nature of gamma-ray bursts (GRBs) and terrestrial gamma-ray flashes (TGFs). The particle identification of the LEM relies on the Δ E E technique performed by thin silicon detectors. This multipurpose spectrometer will fit within a 10 × 10 × 10 cm 3 CubeSat frame, and it will be constructed as a joint project between the University of Trento, FBK, and INFN-TIFPA. To fulfil the size and mass requirements, an innovative approach, based on active particle collimation, was designed for the LEM; this avoids the heavy/bulky passive collimators of previous space detectors. In this paper, we will present the LEM geometry, its detection concept, the results from the developed GEANT4 simulation, and some characterisations of a candidate silicon detector for the instrument payload.

1. Introduction

The low-energy module (LEM) will be a compact spectrometer able to perform an event-based measurement of the energy, direction, and composition of low-energy charged particles, in particular, down to 0.1 MeV for electrons. The physics goal of this detector is the monitoring of the magnetosphere and ionosphere environment. It is known that the measurements of the fluxes of low energetic particles may allow for the characterisation of the coupling between the lithosphere, atmosphere, ionosphere, and magnetosphere. In particular, earthquakes are dynamic processes caused by continuous and slow strain accumulation. From studies on fault rupture mechanics, seismic wave propagation, and geophysical parameters measured in the ionosphere and the low magnetosphere, some anomalies correlated with catastrophic events were discovered. Moreover, statistical evidence of a temporal correlation between particle precipitations from Van Allen belts and strong seismic events has been pointed out [1]. These observations motivate interest in further detailed measurements of electron fluxes in the energy window 0.1–7 MeV, which may be a promising channel for identifying possible seismic precursors. Another interesting case study for the LEM instrument is its application to space weather. Severe space weather storms can cause power outages and telecommunication alterations. For this reason, the construction of new instruments to monitor and (possibly) predict the effects of solar activity on Earth is crucial.
The LEM will be a particle telescope performing an event-based measurement of the energy, direction, and composition of low-energy charged particles, in particular, electrons down to 0.1 MeV. This capability is not possible with the existing detectors, for which the possibility of an event-based PID or the possibility of monitoring the particle flux from different directions at the same time fails or are not able to measure the directions of low-energy particles because of the multiple scattering occurring in the first layer of a particle-tracking configuration.

2. Investigation of the Magnetosphere: Correlation between Particle Precipitations and Seismic Events

The magnetosphere [2] is the complex environment surrounding the Earth’s atmosphere in which the magnetic field generated by Earth’s core is dominant. Earth’s fused core, with its continuously flowing currents, generates a relatively weak magnetic field (of about 6 × 10 5 T at Earth’s surface near the poles) well described by a dipolar field. However, at several Earth’s radii, the magnetic dipole field is strongly deformed by the presence of the solar wind, a plasma of electrons and ions moving outward from the sun. Van Allen radiation belts inside the magnetosphere contain energetic ions and electrons that experience long-term magnetic trapping. However, near magnetopause, particle trapping is prevented since the magnetic field is not stable in time. Therefore, radiation belts are located below about 7 Earth’s radii at the equator. On the other hand, at low altitudes, the atmosphere prevents particle trapping. The main reason is that charged particles, like protons or electrons, lose energy during collisions. Consequently, the region in which radiation belts are located is above 200–1000 km. Particles’ dynamics in the radiation belts are characterised by a superposition of three different motions acting on different time scales. A charged particle will rotate in a dipolar field following a helicoidal trajectory with a high rotation frequency. On slower time scales, the particle travels along the field lines, bouncing between the two mirror points. Again, on slower time scales, the particles, while revolving about the field lines and bouncing, also follow a longitudinal drift motion. Proton energies extend up to several hundred MeV, even in the LEO. This aspect makes protons one of the most critical hazards for satellites at these altitudes. Energetic electrons are the other most abundant population of particles lying in the radiation belts. Their energy extends up to several MeV, and their average fluxes experience time variations related to geomagnetic activities and the succession of solar cycles. There are several processes that can cause a precipitation of the trapped charged particles from the radiation belts. These processes are not fully understood yet, but the primary cause is thought to be electromagnetic fluctuations in the radiation belt. These electromagnetic fluctuations can be produced through solar-magnetic storms, lightning storms, man-made electromagnetic emissions, and seismic activity.
There are many literature models trying to describe the coupling between the lithosphere–atmosphere–ionosphere–magnetosphere (LAIM). An extensive review can be found in reference [3]. However, since the lithosphere is a very complex and heterogeneous system, there is the need to find a very general model, avoiding the introduction of assumptions that are valid only in some specific cases. For monitoring seismic phenomena, in particular, space is a privileged point from which it is possible to measure many observable quantities. Indeed, satellites and satellite constellations provide remote sensing of variables within the atmosphere, ionosphere, and magnetosphere. Improving data quality will allow for a better comprehension of such systems, particularly their motions, energy exchanges, and dynamics.
The monitoring of trapped particle precipitations is a channel to study the LAIM coupling. Indeed, among the many LAIM coupling models, the the magnetosphere–ionosphere– lithosphere coupling (MILC) model is notable, described in [4]. Some observations corroborate the presence of co-seismic perturbations of the magnetosphere [4,5]. Observations of co-seismic alterations of the magnetosphere environment and the consequent observation of particle precipitations are crucial points for validating such models.

3. The Current Landscape of Space-Based Particle Detectors

Extensive literature exists about particle detectors in space using silicon technologies for Δ E − E measurements. Here, an inexhaustive list of existing detectors will be discussed as an example. The instruments under examination are the instrument for the detection of particles (IDP) on the DEMETER microsatellite [6,7,8], the high-energy particle package (HEPP-H and HEPP-L) on CSES [9,10,11,12], the Mars energetic particle analyzer (Mars-EPA) on the Tianwen-1 mission [13,14,15], and the radiation assessment detector on the curiosity rover [16,17,18,19,20].
Some of the most important features of these instruments are listed in Table 1. Even though all of these experiments have different scientific purposes and goals, their detection concepts and schemes are very similar, allowing for a comparison between their structure, size, components, and performances. By comparing the four detectors mentioned in Table 1, we can conclude that the larger the number of layers inserted into the design, the better the performances in detecting energetic particles and particle identification. On the other hand, to minimise the low-energy threshold, one has to minimise the thickness of the Δ E layer. For instance, the Mars-EPA can detect electrons in the energy range of 0.1–2 MeV by adopting a Δ E layer made of passivated implanted planar silicon (PIPS) detectors with a thickness of 15 μ m . Finally, the use of an inorganic scintillator as a calorimeter could be problematic. In particular, many scintillator crystals, such as sodium iodide or caesium iodide, are very fragile and hygroscopic. These aspects will unavoidably result in the introduction of mechanical supports or metallic wrapping, providing additional dead layers in which particles can deposit part of their energy.
Furthermore, it is required that the LEM is compact (within 10 × 10 × 10 cm 3 ) and that it can monitor the particle flux in a large field of view from different directions at the same time. These capabilities are not simultaneously fulfilled by the past detectors. Therefore, a different and innovative design is required for the LEM.

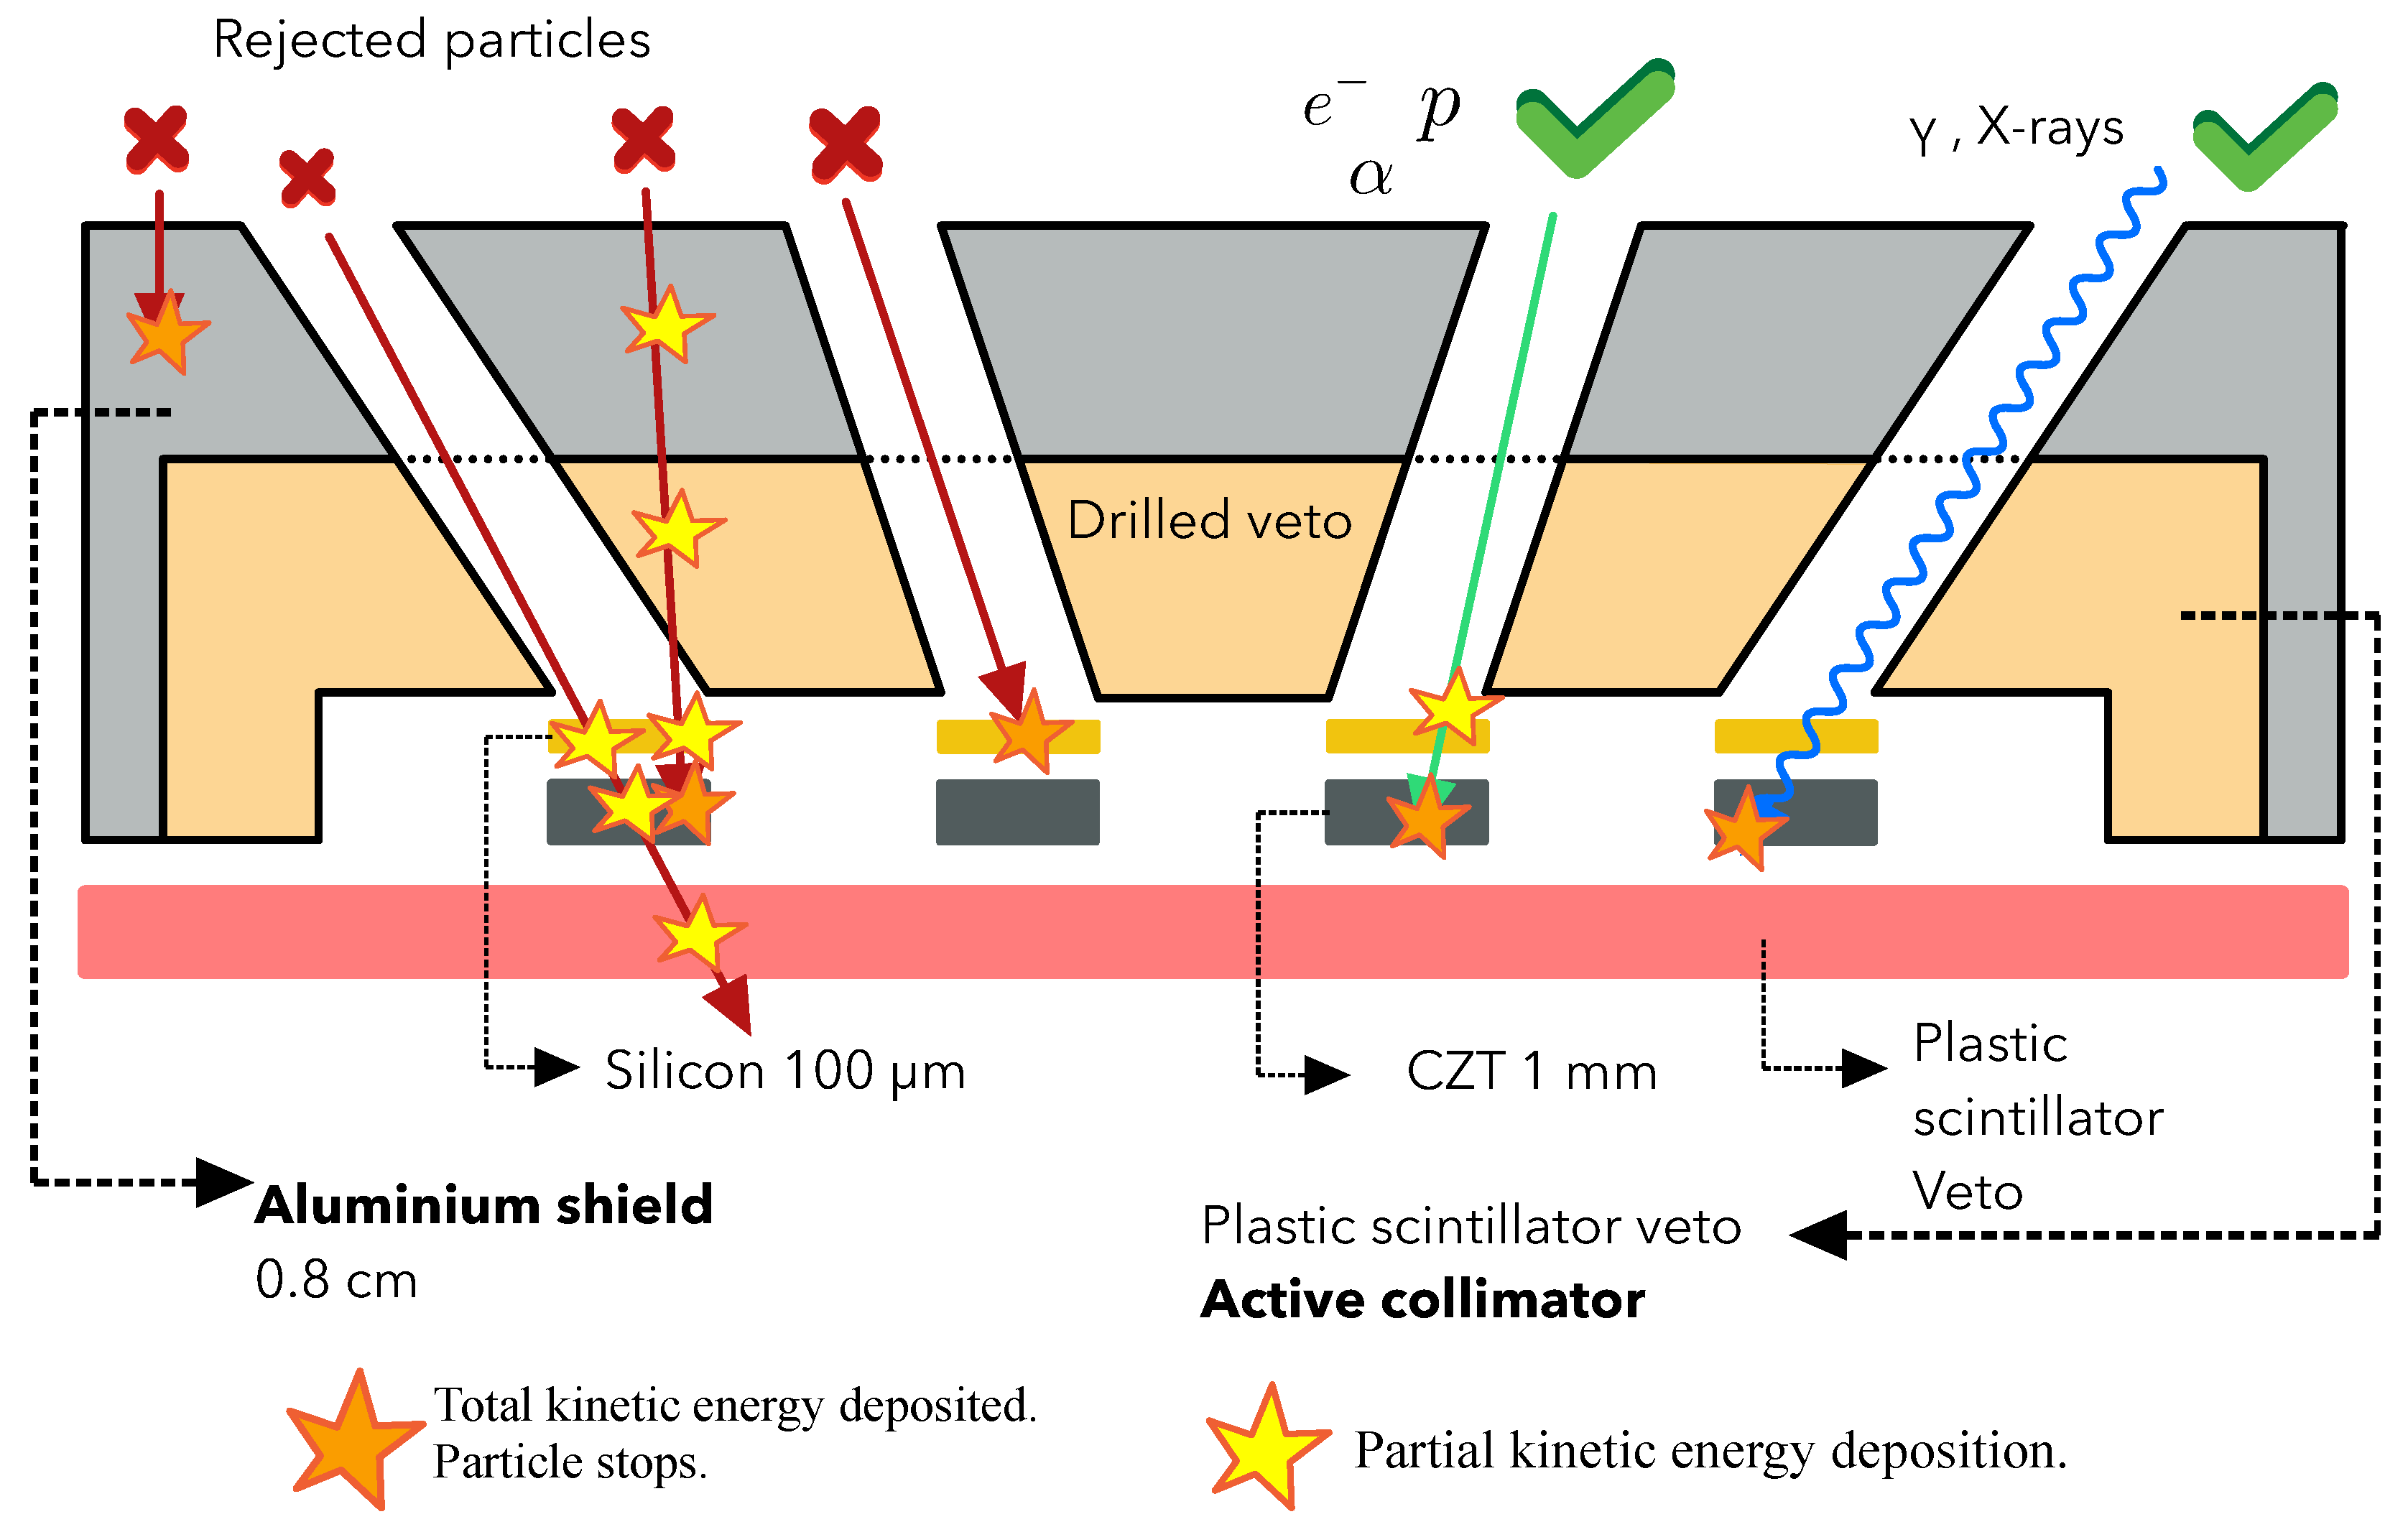
4. The LEM Concept: The Active Collimation Technique

The idea of allowing for a reduction in the weight and size of the LEM detector relies on the active collimation technique. More precisely, a drilled plastic scintillator is acting as a veto. Only particles with the directions aligned with 1 of the 16 channels are detected by 1 of the 16 silicon sensor pairs. Thus, the direction information is obtained. Particles with different/unknown directions are stopped in the aluminium shield or will release a signal in the drilled plastic scintillator veto. This technique is an alternative to the tracking one affected by the multiple scattering problem. On the other hand, the low density of the plastic scintillator veto avoids the significant weight required by a totally passive metallic collimator. However, the price to pay is a relatively high veto rate. This high veto rate will unavoidably result in an enhancement of the dead time of the detector. For this reason, a small drilled aluminium shield is still necessary to suppress very low-energy particles.
In Figure 1, the detection concept and a schematised cross-section of the instrument are shown. In Figure 2, the LEM geometry is displayed within the developed GEANT4 simulation. From the top, we can see the drilled aluminium mask, in transparent grey, suppressing the flux of very low energetic particles. Below the aluminium shield, the active anti-coincidence is obtained by using a drilled plastic scintillator, displayed in transparent blue, (polyvinyl toluene). The aluminium drilled mask and the drilled anti-coincidence detector (ACD) define the so-called active collimator. For an LEM operating in low Earth orbit (LEO), an aluminium thickness larger than 0.5 cm is necessary to reduce the veto rate from several MHz to the affordable rate of ∼kHz. Below the active collimation system, we place the 16 independent Δ E E modules. These Δ E E modules will measure the angular flux of particles crossing the veto channels ( 1 cm × 1.3 cm), determining one specific solid angle in the sky with a resolution of about 7 . The sizes of the commercially available PIPS detectors (50 mm 2 –⊘8 mm each) have been considered to define a realistic geometry in the detector simulation. The Δ E detector consists of a 100 μ m -thick PIPS detector, while the E detector is a CdZnTe (or CZT) detector with 1 mm thickness. These two Δ E E layers allow for good particle identification in the energy ranges of approximately 0.1–10 MeV for electrons, 3–30 MeV for protons, and 10–100 MeV for alpha particles. A bottom plastic scintillator (ACD), not shown in Figure 2, is added at the very end of the LEM to ensure that the energy release is confined within the above layers. A plastic scintillator (ACD), displayed in cyan, is inserted on all four sides to ensure lateral confinement. In particular, particle identification (PID) is not possible for the energetic particles crossing the ACD nor for slow particles stopped in the front PIPS. Events with an undefined direction are rejected thanks to a signal released in the active veto/collimator. Finally, events that are fully contained within the LEM are selected. In this very last case, the direction is well defined, and it is also possible to perform an accurate PID. Thanks to the high density and high averaged atomic number of CZT [21,22], the LEM can identify low-energy γ -rays converting in the CdZnTe (CZT) mini-calorimeter using all the surrounding low-Z sensors as anticoincidence. The ability to observe energetic photons will allow for the additional use of this compact particle spectrometer as a gamma-ray burst (GRB) monitor [23].

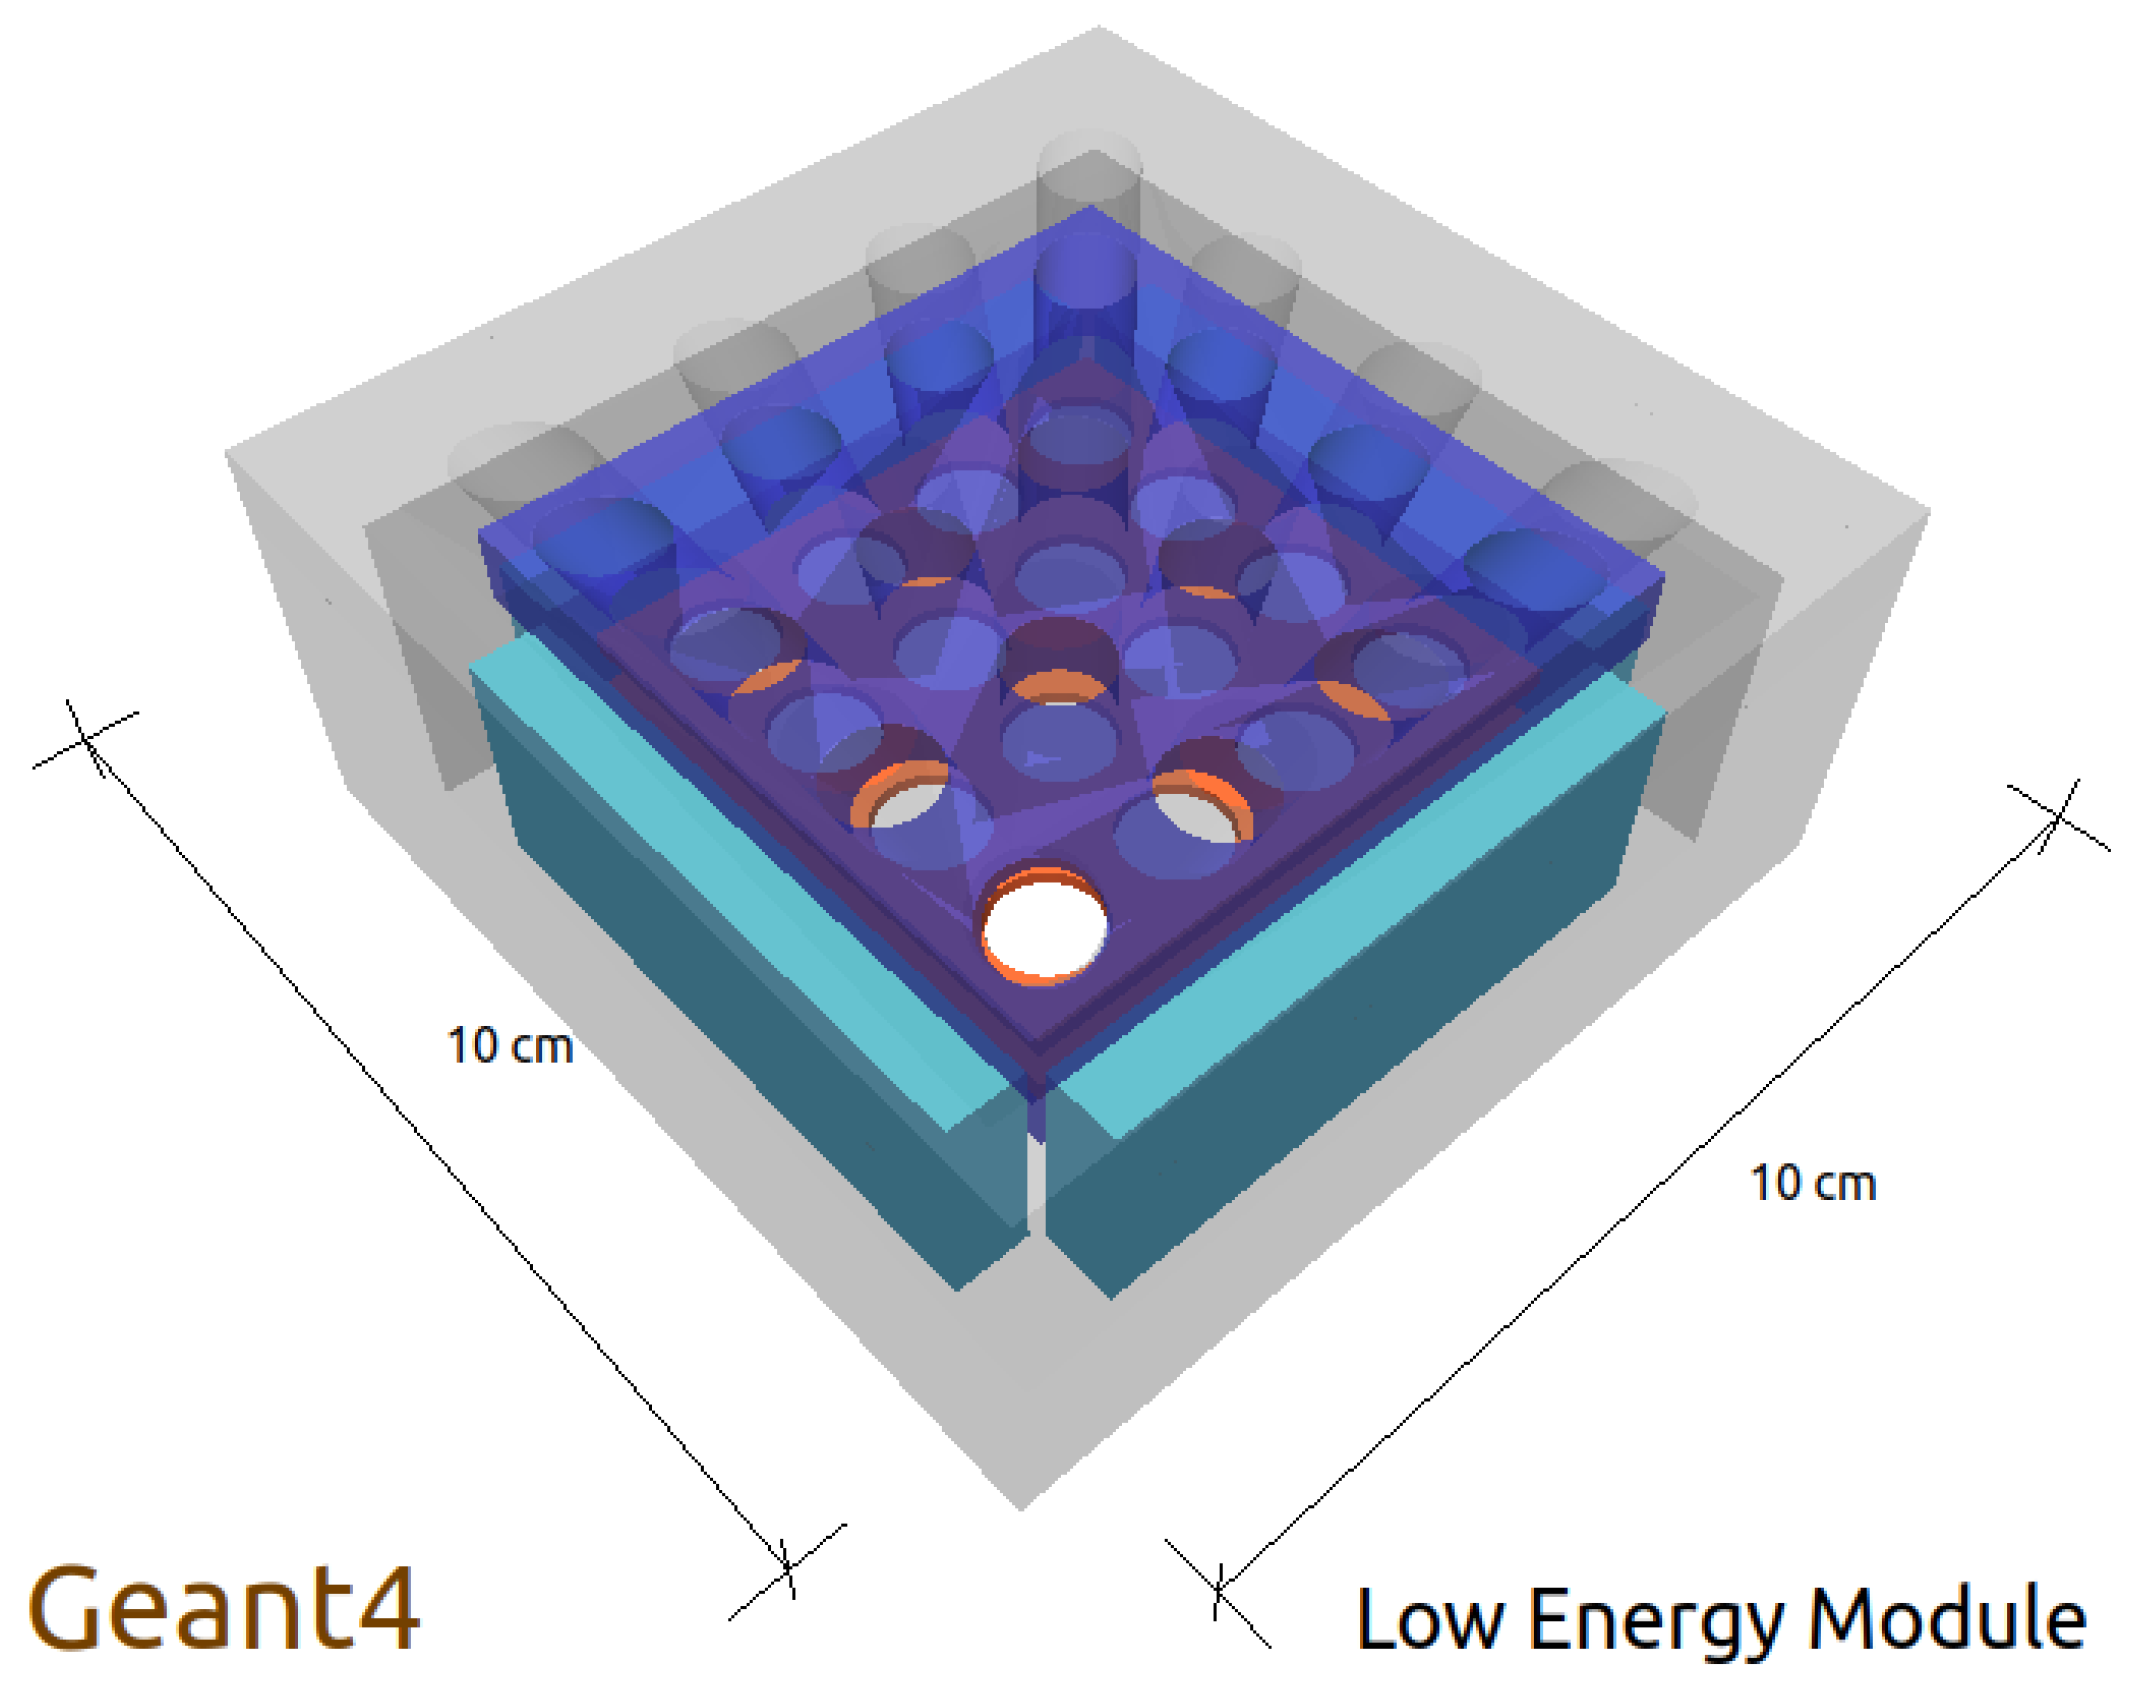
5. Performance Characterisation with GEANT 4 Simulation

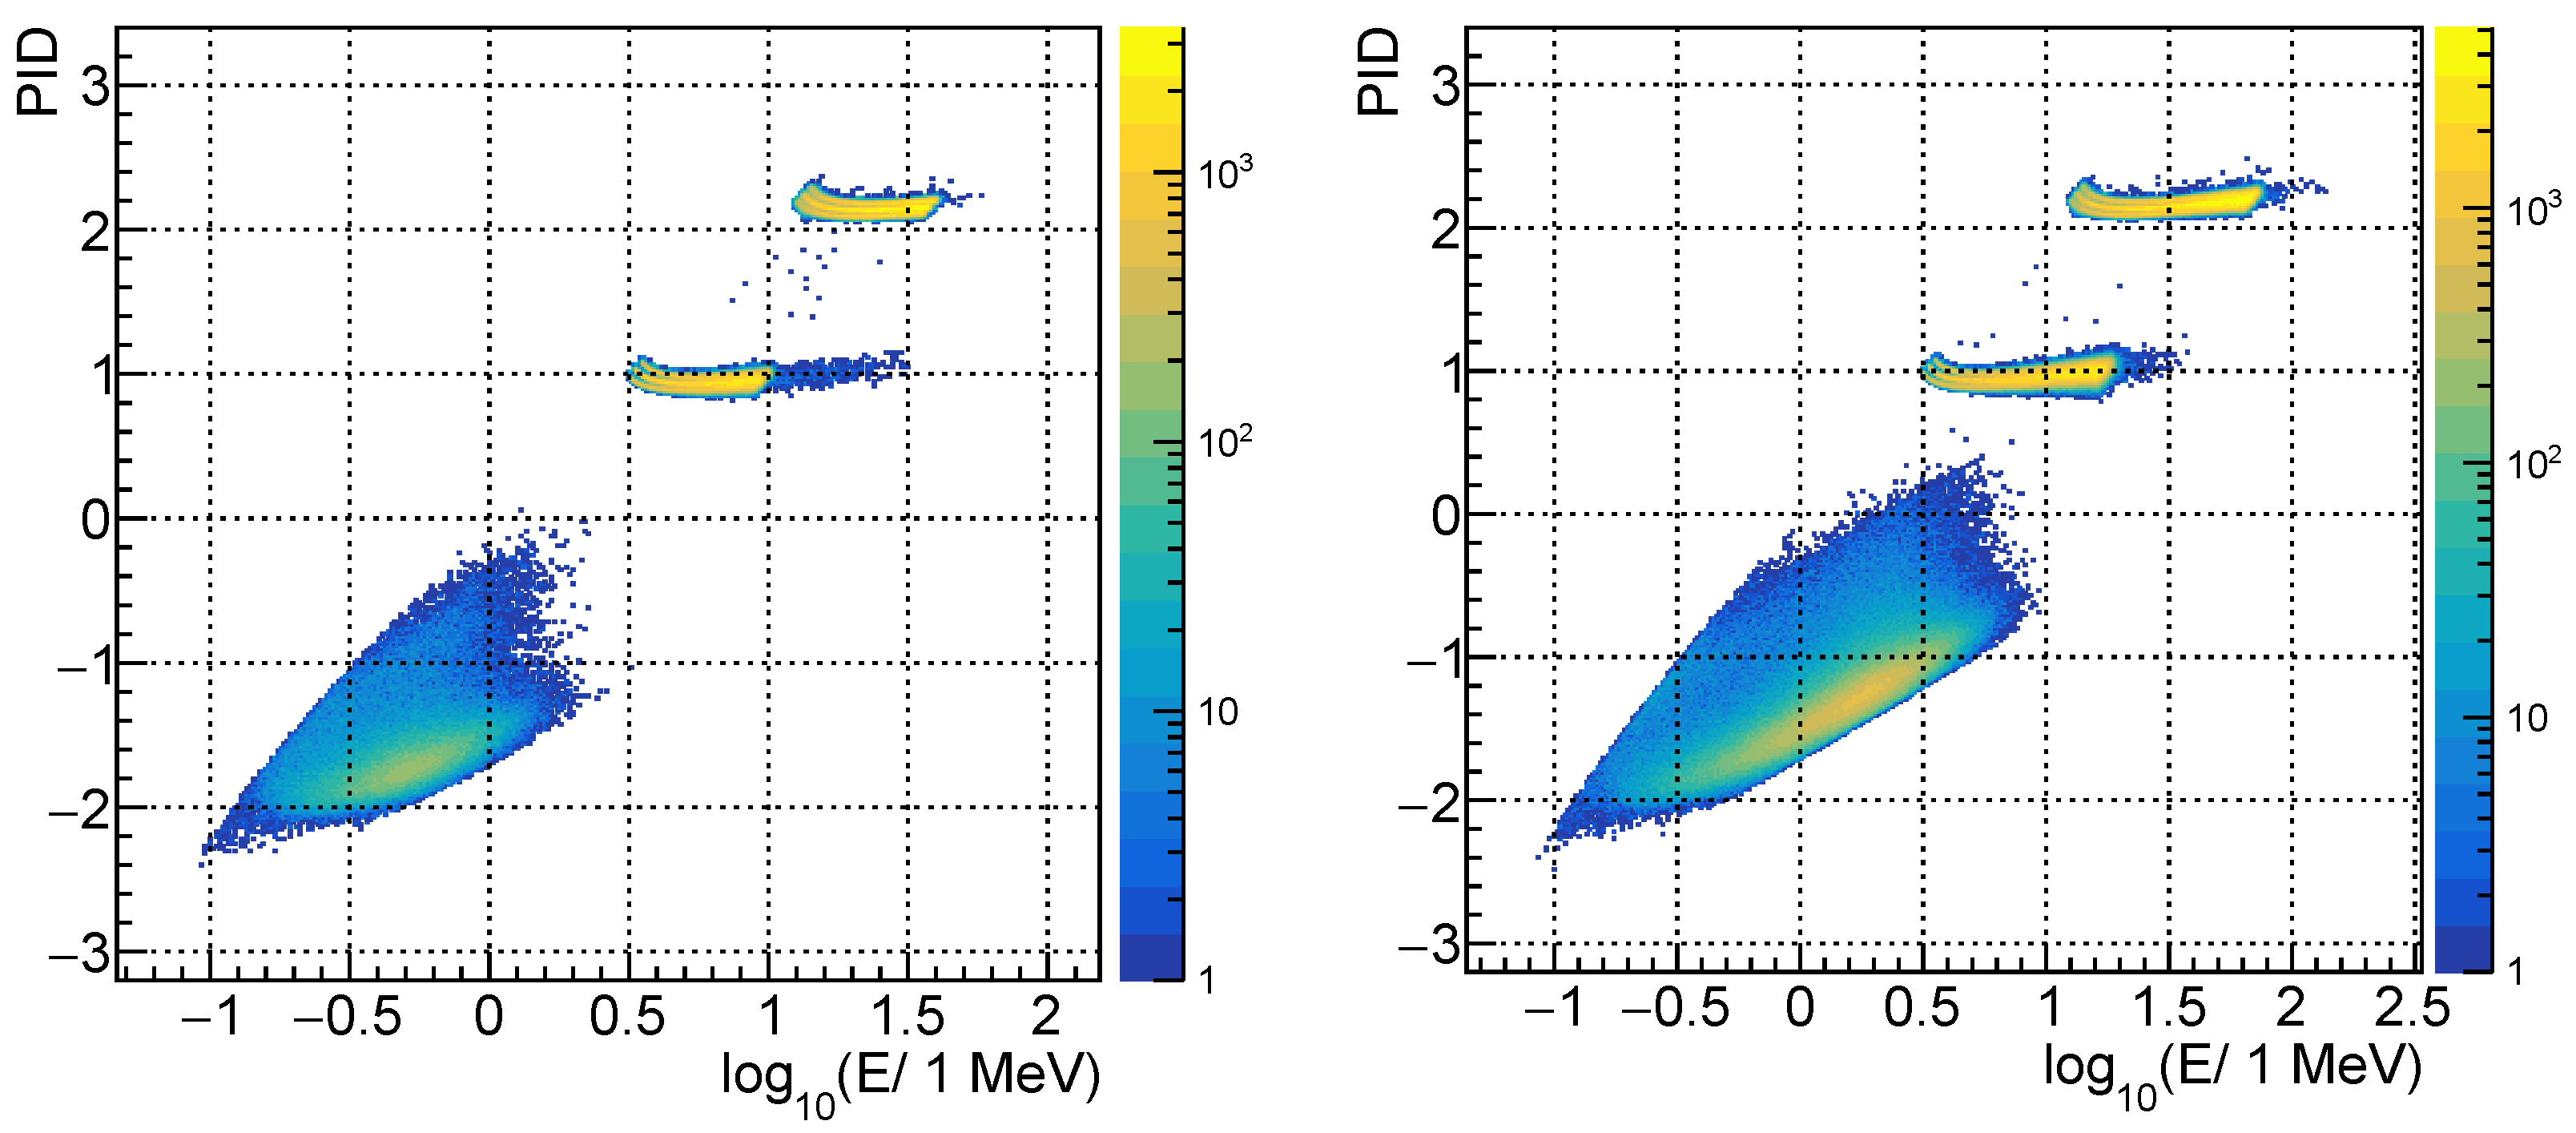
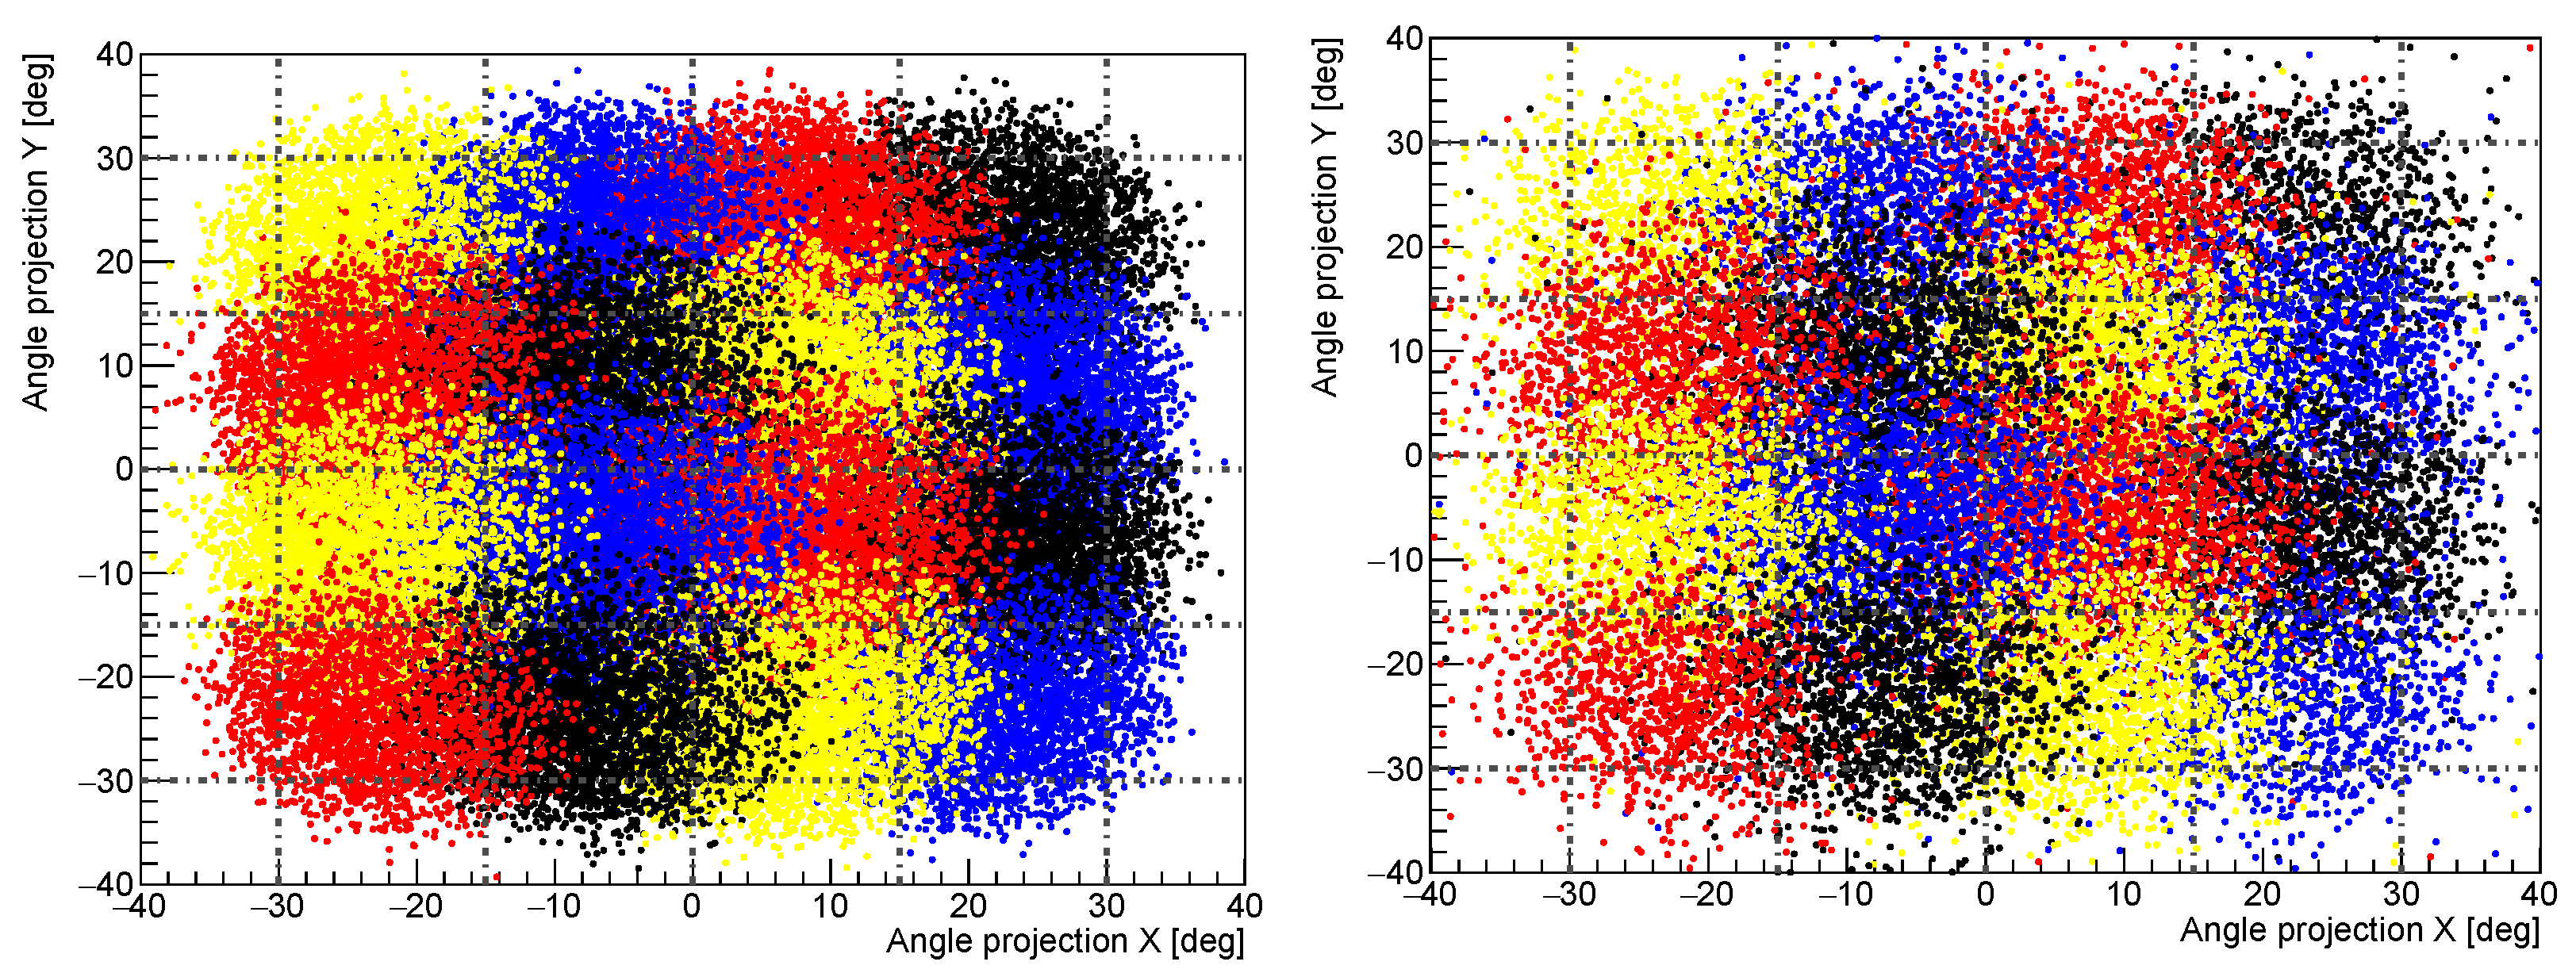
5.1. Expected Performance for Low-Energy Charged Particles

The detection concept adopted in the LEM is a consolidated technique denominated Δ E E [25,26,27]. Basically, a Δ E E particle spectrometer is composed of a thin detection layer and a thicker one behind. When a particle impinges on the spectrometer, if the kinetic energy is enough, the particle can cross the first layer, releasing a part of its kinetic energy Δ E . Then, the residual kinetic energy E can be deposited entirely within a second, thicker layer. This experimental layout allows for particle identification by measuring the energy deposited in the thinner layer, the Δ E energy, as well as the energy deposited in the thick sensor, the E energy. If a non-relativistic particle passes through a thin detector layer, the energy deposited, Δ E , will be velocity-dependent:
Δ E Z 2 β 2
where Z is the projectile’s charge and β is its velocity in natural units. On the other hand, the residual kinetic energy, E, of a non-relativistic particle stopping in a subsequent thick detector is also velocity-dependent:
E = m c 2 ( γ 1 ) 1 2 m ( β c ) 2
Therefore, in a Δ E E spectrometer, a useful PID classifier can be defined in the following way:
PID classifier = log 10 Δ E 1 MeV E 1 MeV constant + log 10 Z 2 m c 2 1 MeV
Thus, for non-relativistic particles, this PID classifier is mainly dependent only on the particle’s mass and charge. For the LEM detector, this approximation is very good for protons, alpha, and other nuclei, but for electrons in the LEM kinetic energy range, the non-relativistic approximation fails, and the PID classifier for electrons will grow roughly according to log 10 E 1 MeV . However, a good identification of the electrons from the protons, based on this classifier, is still achieved thanks to the fact that the proton mass is 2000 times larger than the electron mass. In Figure 3, the results from a GEANT4 [24] simulation are shown. In particular, the PID vs. the energy identification capability for the case of a mini-calorimeter made of 500 μ m of silicon (left plot) is compared with the case of a mini-calorimeter composed of a 1 mm-thick CZT. Using the results from a long run of the simulation where particles are isotropically generated, it is possible to quantify the angular resolution of the detector.
The results are reported in Figure 4. In the notation used, PIPS CZT detectors are lying in the x y plane. To represent, on a two-dimensional plane, the vectors lying on the unitary sphere, encoding the incident direction of the projectile particle, a polar projection has been adopted on which X = θ cos ϕ , while Y = θ sin ϕ . The z direction, perpendicular to the plane of the graph, corresponds to the zenith direction. To understand which portion of the sky is subtending each collimator, events detected by adjacent PIPS-CZT pairs are visualised with different colours. Therefore, each cluster of particles corresponds to a class of events detected by the same Δ E E module. For each channel, the angular resolution for protons and alpha particles is ∼6 , whereas it is ∼ 7 . 5 for electrons. Angular resolution has been estimated with the standard deviation of the distributions describing the angular projections of the particles’ directions (data displayed in Figure 4). The worst angular resolution of electrons is mostly due to a larger effect of particle multiple scattering crossing the collimator edges. The overall FOV for the LEM is ∼ 60 .

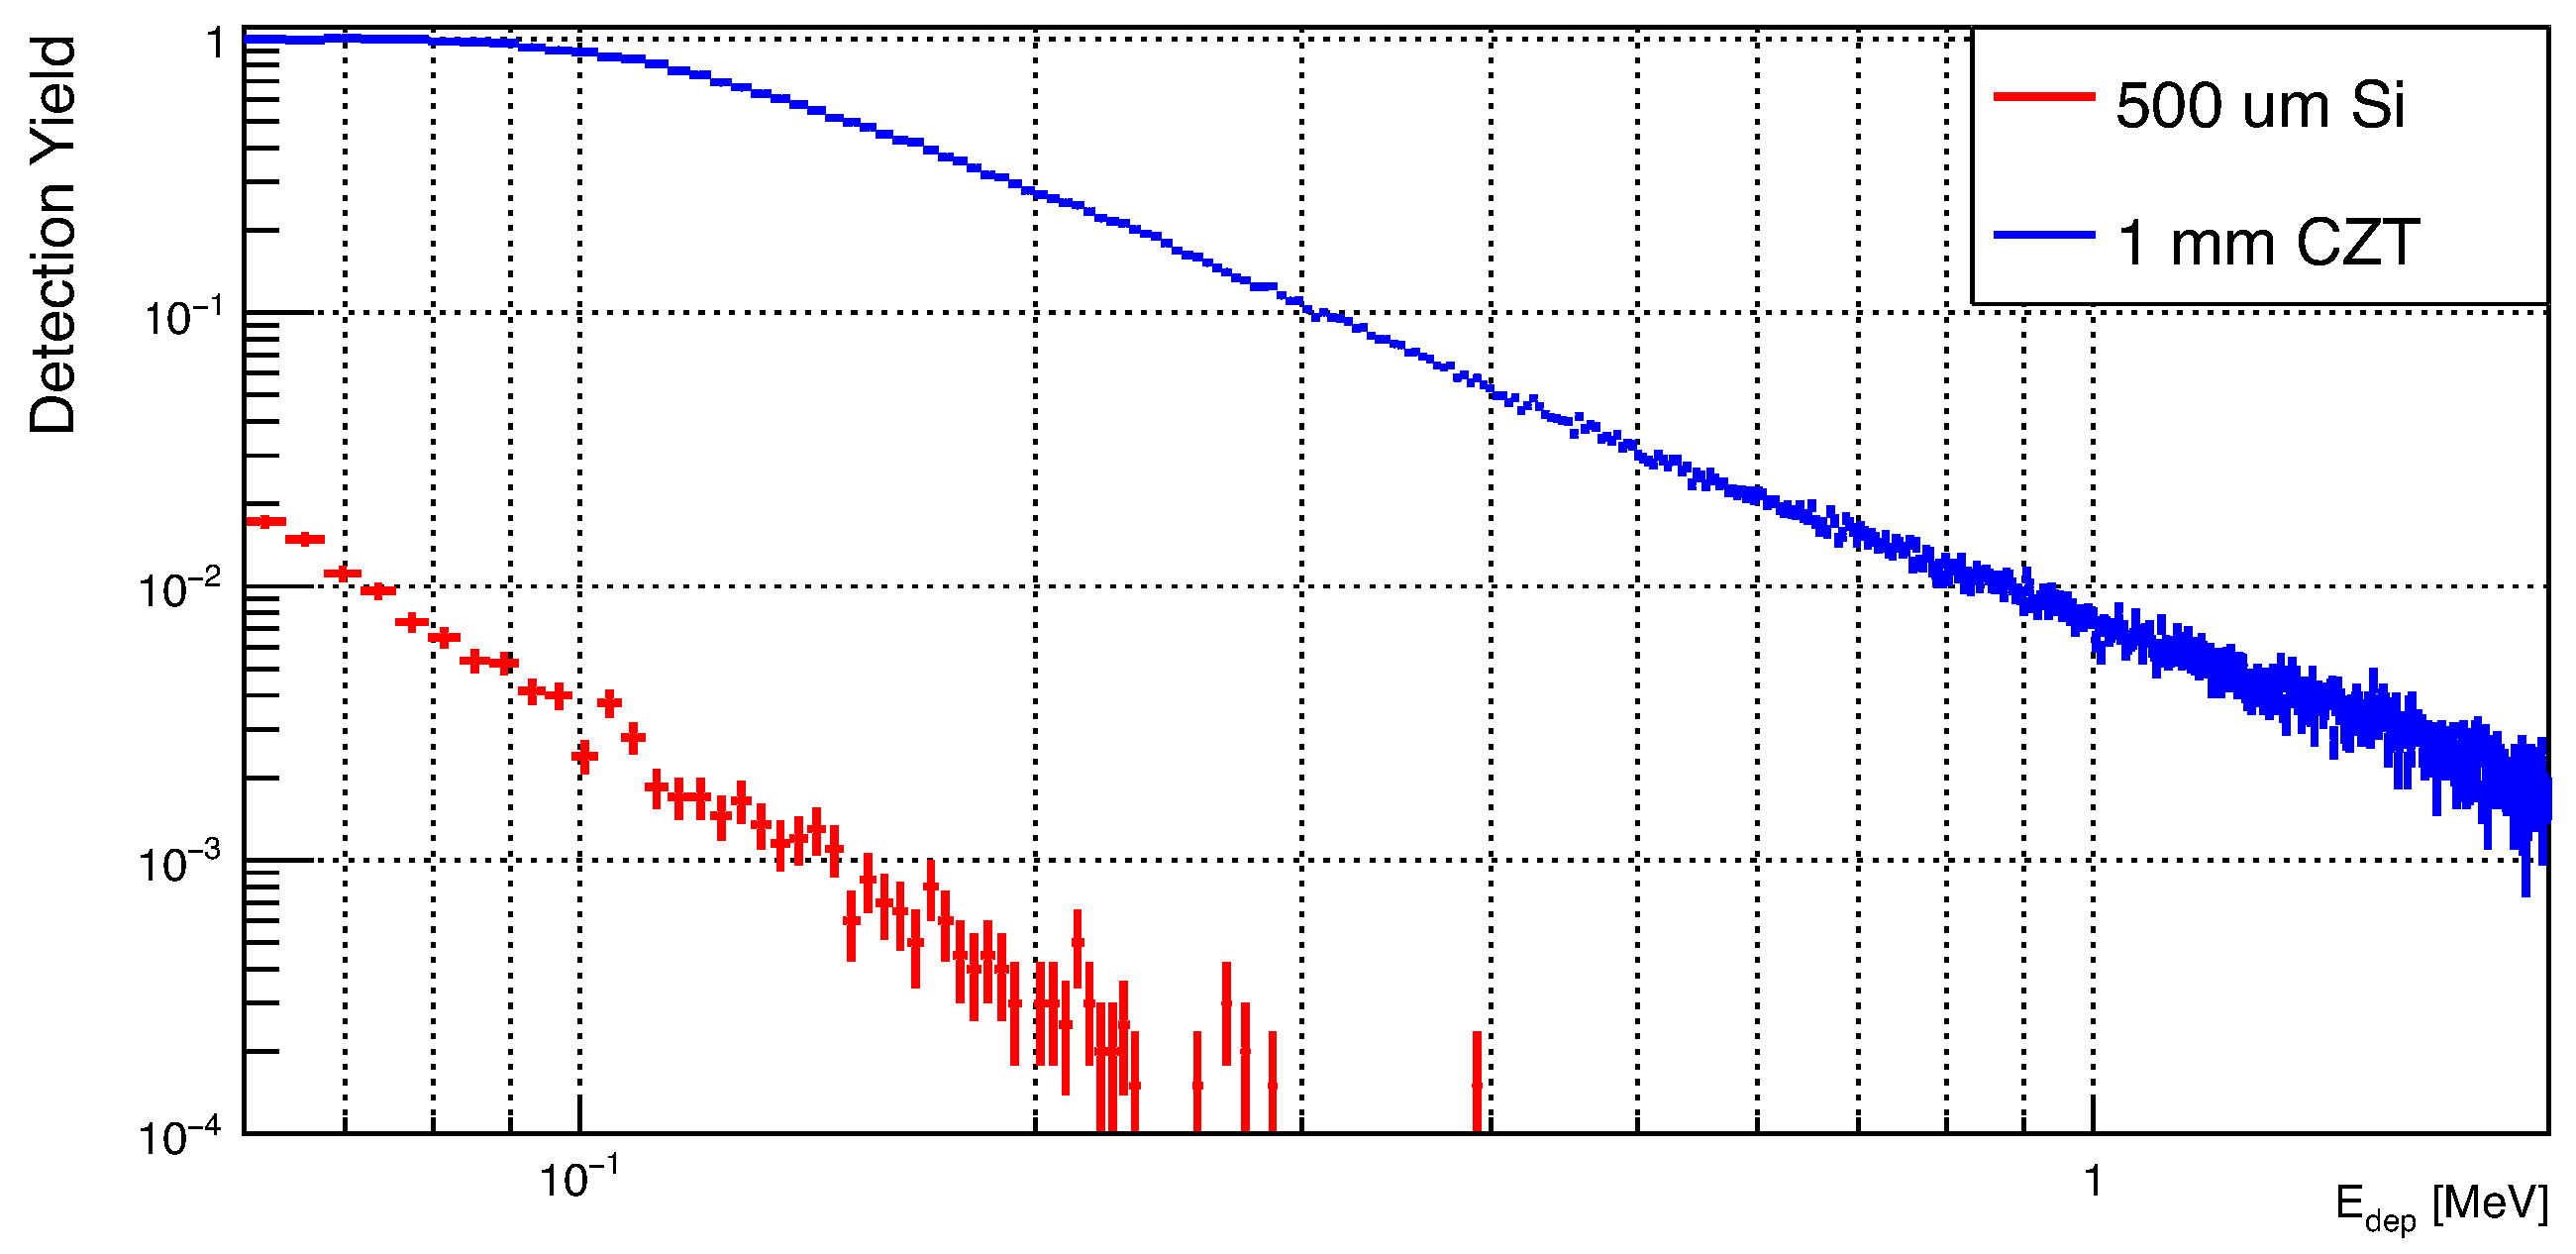
5.2. Expected Performance for Gamma Rays

Gamma ray bursts (GRBs) are one of the most extreme and violent phenomena in the universe. GRBs [23], by definition, are short and very intense bursts of gamma rays and lower-energies photons sometimes accompanied by optical afterglows. GRBs represent the most luminous object in the sky, reaching luminosity of 10 51 10 52 ergs s 1 . They offer the possibility to explore the early universe, study star formation, and validate fundamental theories and principles [28,29,30]. Studies on the hardness-duration ( T 90 ) of the detected GRBs by several space-based instruments determined the presence of two populations of GRB: long ( T 90 > 2 s ), associated with super novae explosions, and short ( T 90 < 2 s ), associated with binary neutron star mergers. Nevertheless, there are hints for additional populations/sub-classes of GRBs [31]. Increasing the number of available GRB monitors will allow one to cover a bigger portion of the sky, allowing one to obtain better statistics, better coverage, and improve the multimessenger astronomy capabilities such as in the case of the GW170817 observation [32]. Nevertheless, up to now, no coincidences between GRBs and neutrino events have been observed [33]. Distributed architectures for GRB monitoring [34] will allow for improvement limits on the neutrino fluxes emitted from GRBs.
Recently, GRB20221009A, the strongest GRB event observed until now, was also detected by particle detectors such as HEPP-L onboard the CSES-01 satellite [35], and by electron and proton detectors on board the four spacecraft of the NASA THEMIS mission [36]. In both cases, the GRB was detected due to the secondary production in the interaction between soft gamma rays with the passive materials of the collimators.
Even though GRB221009-like events could be rare, LEM detector would be able to catch GRBs both monitoring charged particle fluxes and with the standard calorimetric technique (with CdZnTe mini-calorimeters).
In addition, the capability of detecting soft γ -rays and X-rays could allow for the study and characterisation of terrestrial gamma-ray flashes (TGFs) [37]. TGFs consist of emission of γ -rays and X-rays during strong thunderstorms accompanied by lightning. They are believed to be generated by accelerated electrons during electric discharges, subsequently emitting bremsstrahlung radiation [38].
The use of CZT sensors is promising to monitor the sub-MeV part of the GRB spectrum with very good energy resolution.
To quantify the advantage of the use of CZT sensors in the LEM, and as a monitor for GRBs, a comparison of the relative photon detection efficiency for the two mini-calorimeter configurations is shown in Figure 5.

6. Characterisation of Fully Depleted Silicon Detector Prototypes
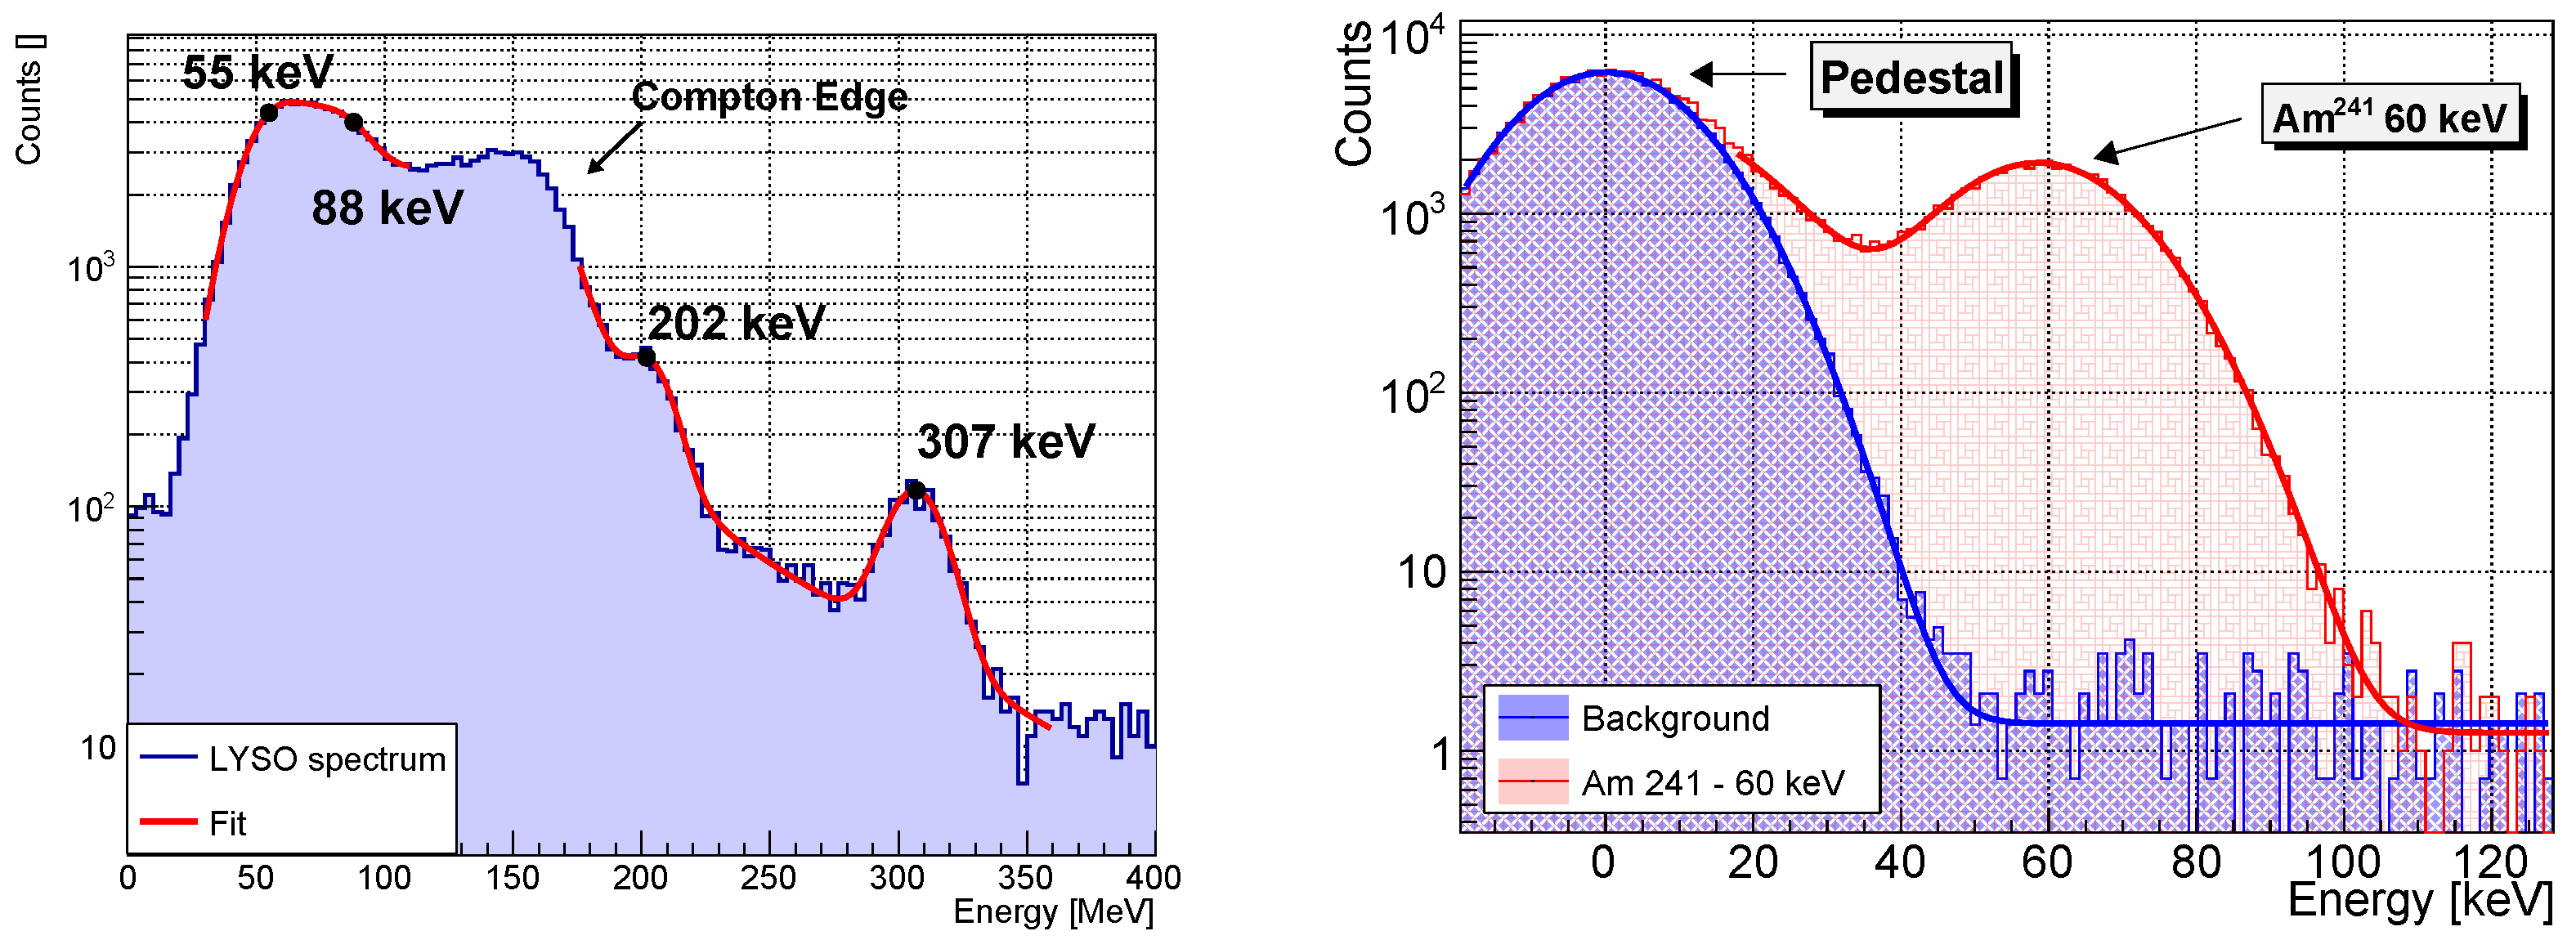
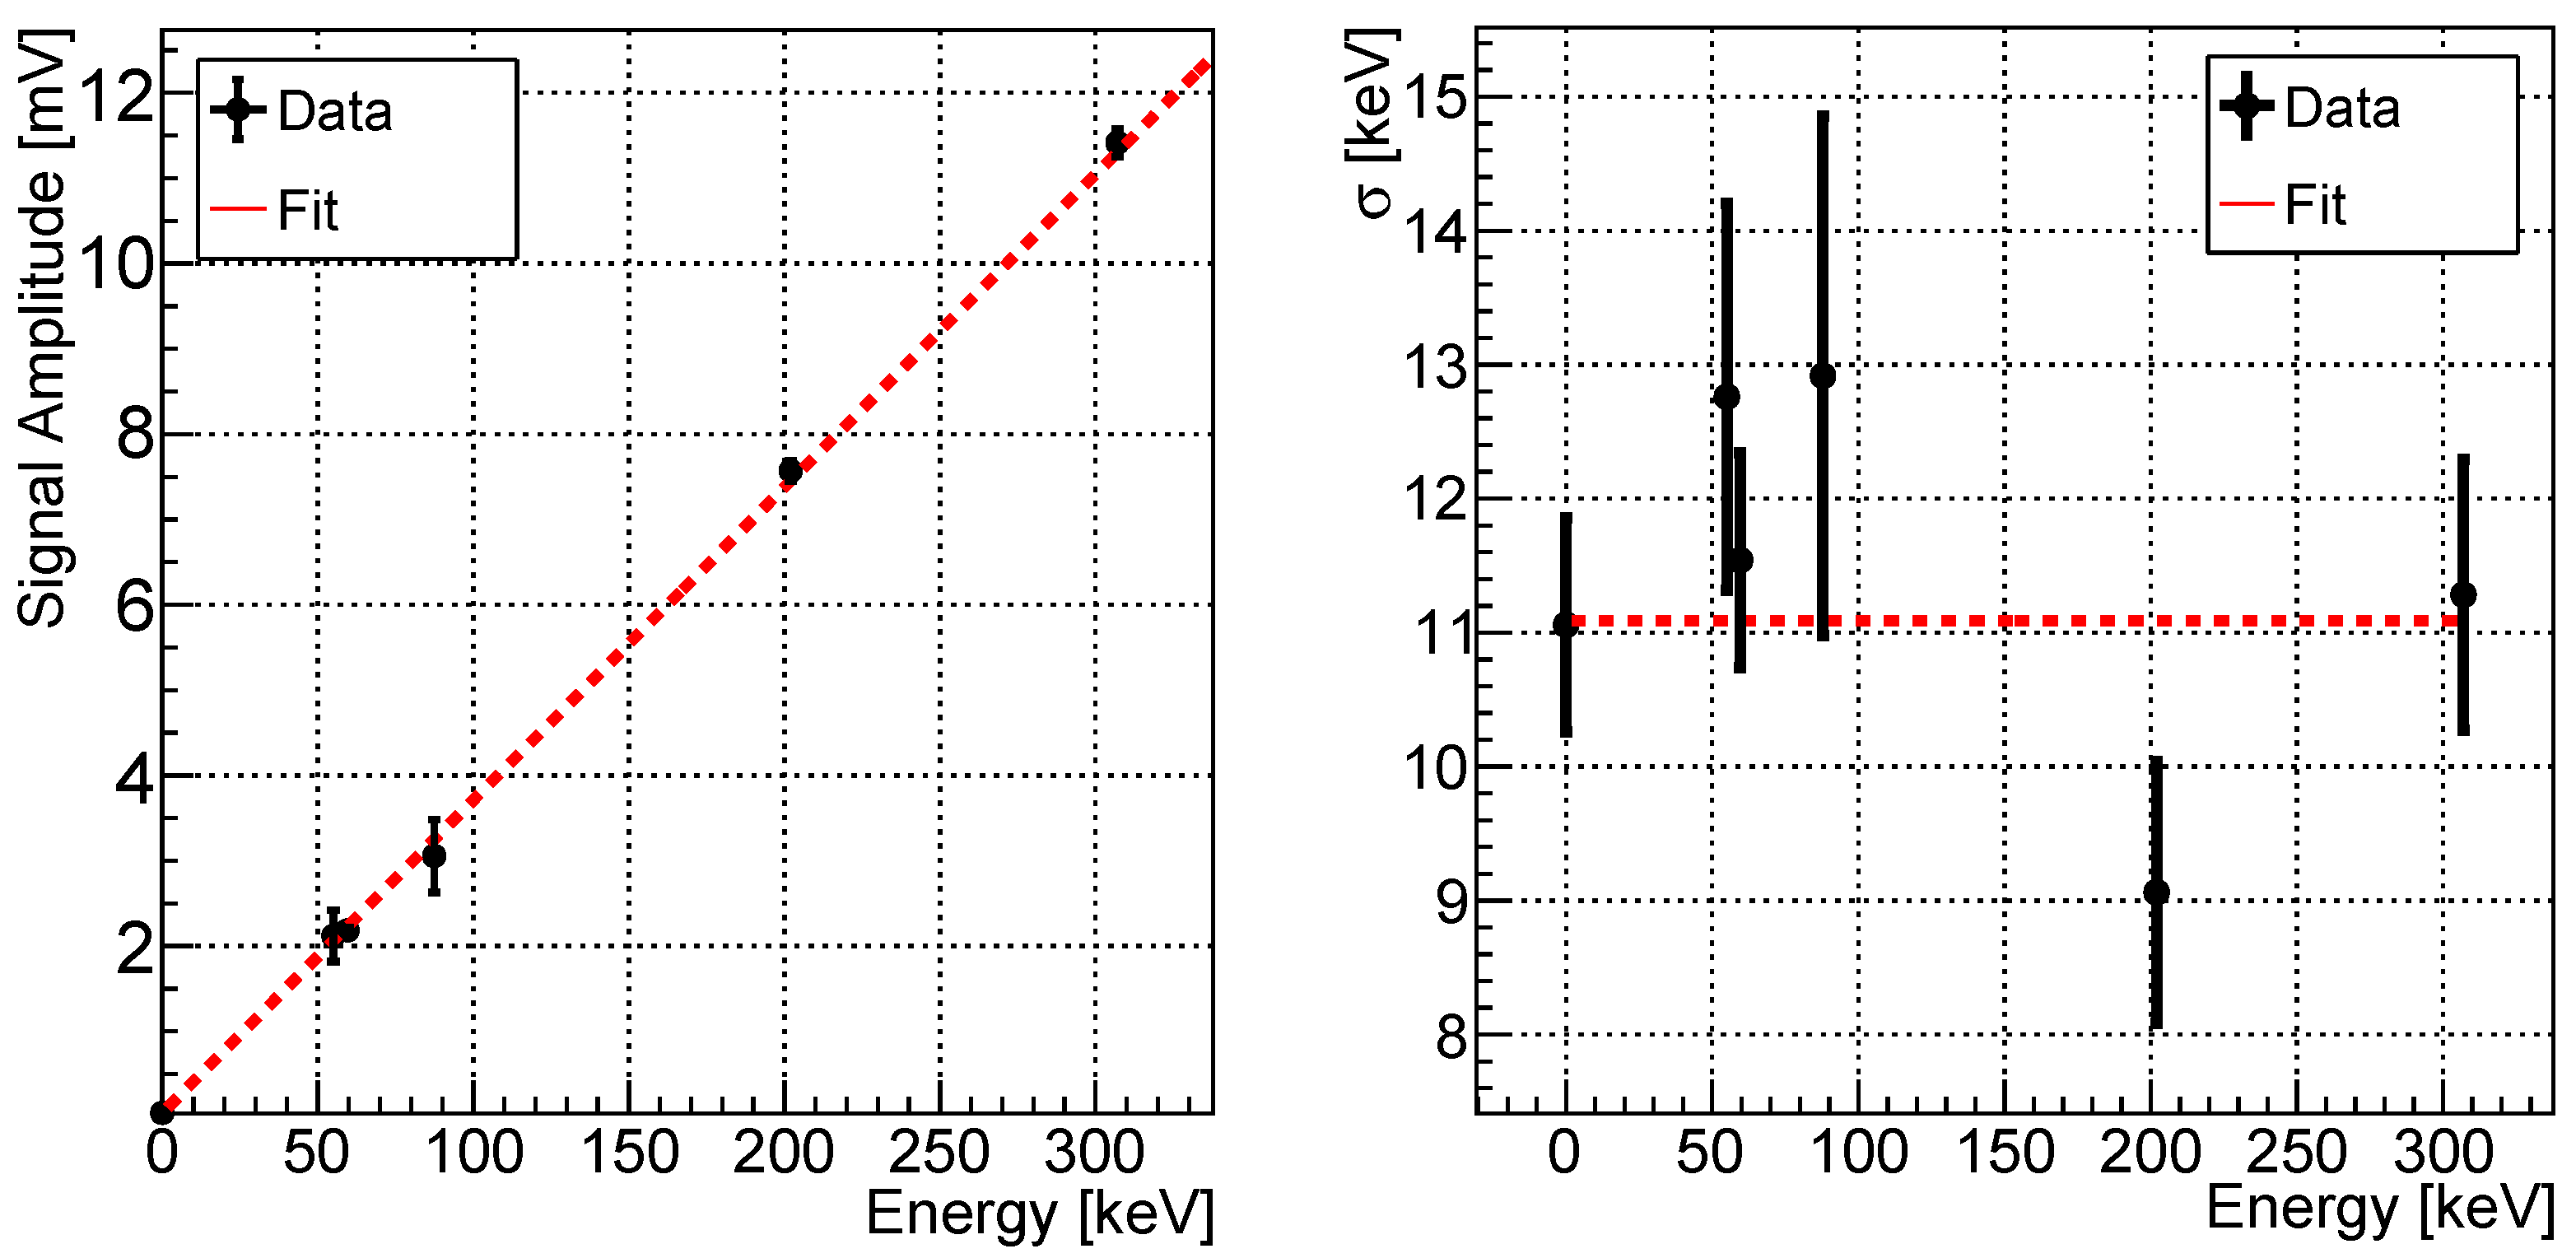
This chapter will be devoted to the activities regarding the hardware R&D, which is accomplished at INFN-TIFPA for the LEM project. Currently, we have carried out the characterisation of the passivated implanted planar silicon (PIPS) detector 500 μ m , AP-CAM25 manufactured by MIRION, with a built-in preamplifier. The goal of these measurements was the tuning of the LEM simulation and the test of the silicon response to detected particles having very different dE/dx.
From the electrical point of view, the working principle of a fully depleted silicon detector is basically the same as that of a reverse biased pn-junction. A particle entering and releasing some energy in the depletion region forms electron–hole pairs. In the case of silicon, the energy required for forming one pair is about ε 3.6 eV . As a result, the number of electron–hole pairs generated inside the depletion layer will be N e h = η E i n / ε , where η is the quantum efficiency and E i n is the energy deposited within the detector depletion region. The thickness of the depletion region depends on the bias voltage applied. The higher the bias voltage, the more extensive the region over which a strong electric field will separate electron–hole pairs. Electrons and holes are then accelerated towards the cathode and the anode, where they are collected. However, the thickness is limited by the dimensions of the wafer. As a result, the depletion layer will remain constant above the depletion voltage.

6.1. Calibration with γ -Ray Sources

To calibrate the response of silicon detector in low-energy range, two γ -ray external sources were used: an 241 Am standard calibration source and a LYSO (lutetium–yttrium oxyorthosilicate) crystal scintillator.
In particular, 176 Lu is one of the constituents of the LYSO crystal scintillator. 176 Lu is a naturally available (2.6%) and long-lived ( 40 Gyr ) isotope of lutetium. It decays β to 176 Hf . The decay chain involves the emission of three γ rays with energy, respectively, 307 keV , 202 keV , and 88 keV [39]. In addition, there is a peak at ∼ 55 keV due to the K α emission line. The expected activity of LYSO material is ∼ 40 Bq / g . A thin LYSO scintillator (8 g) was coupled to an Hamamatsu R5946 PMT in order to tag the 176 Lu β decay with 100 ns coincidence with the silicon detector. In Figure 6 (left), it is possible to see the energy spectrum measured by the silicon detector exposed to the LYSO radioactivity. To verify the calibration curve at low energy, we used the 59.5 keV gamma line emitted by the 241 Am calibration source. Moreover, by removing the source we also measured the “pedestal”, which is the signal detected by the detector, due to the electronic noise, in the absence of energy deposition. Figure 6 (right) shows the results from the measurements with the Americium source. As it is possible to see, the pedestal measurement allows for the characterisation of the electronic noise and background in the detector.
Figure 7 shows the calibration curve and the detector’s resolution estimation. On the right-hand side of the plot, the detector’s resolution estimation is reported. This calibration procedure provides a calibration constant: ( 36.7 ± 0.3 ) mV / MeV and an energy resolution of: ( 11.1 ± 0 . 4 stat ± 1 . 2 syst ) keV .

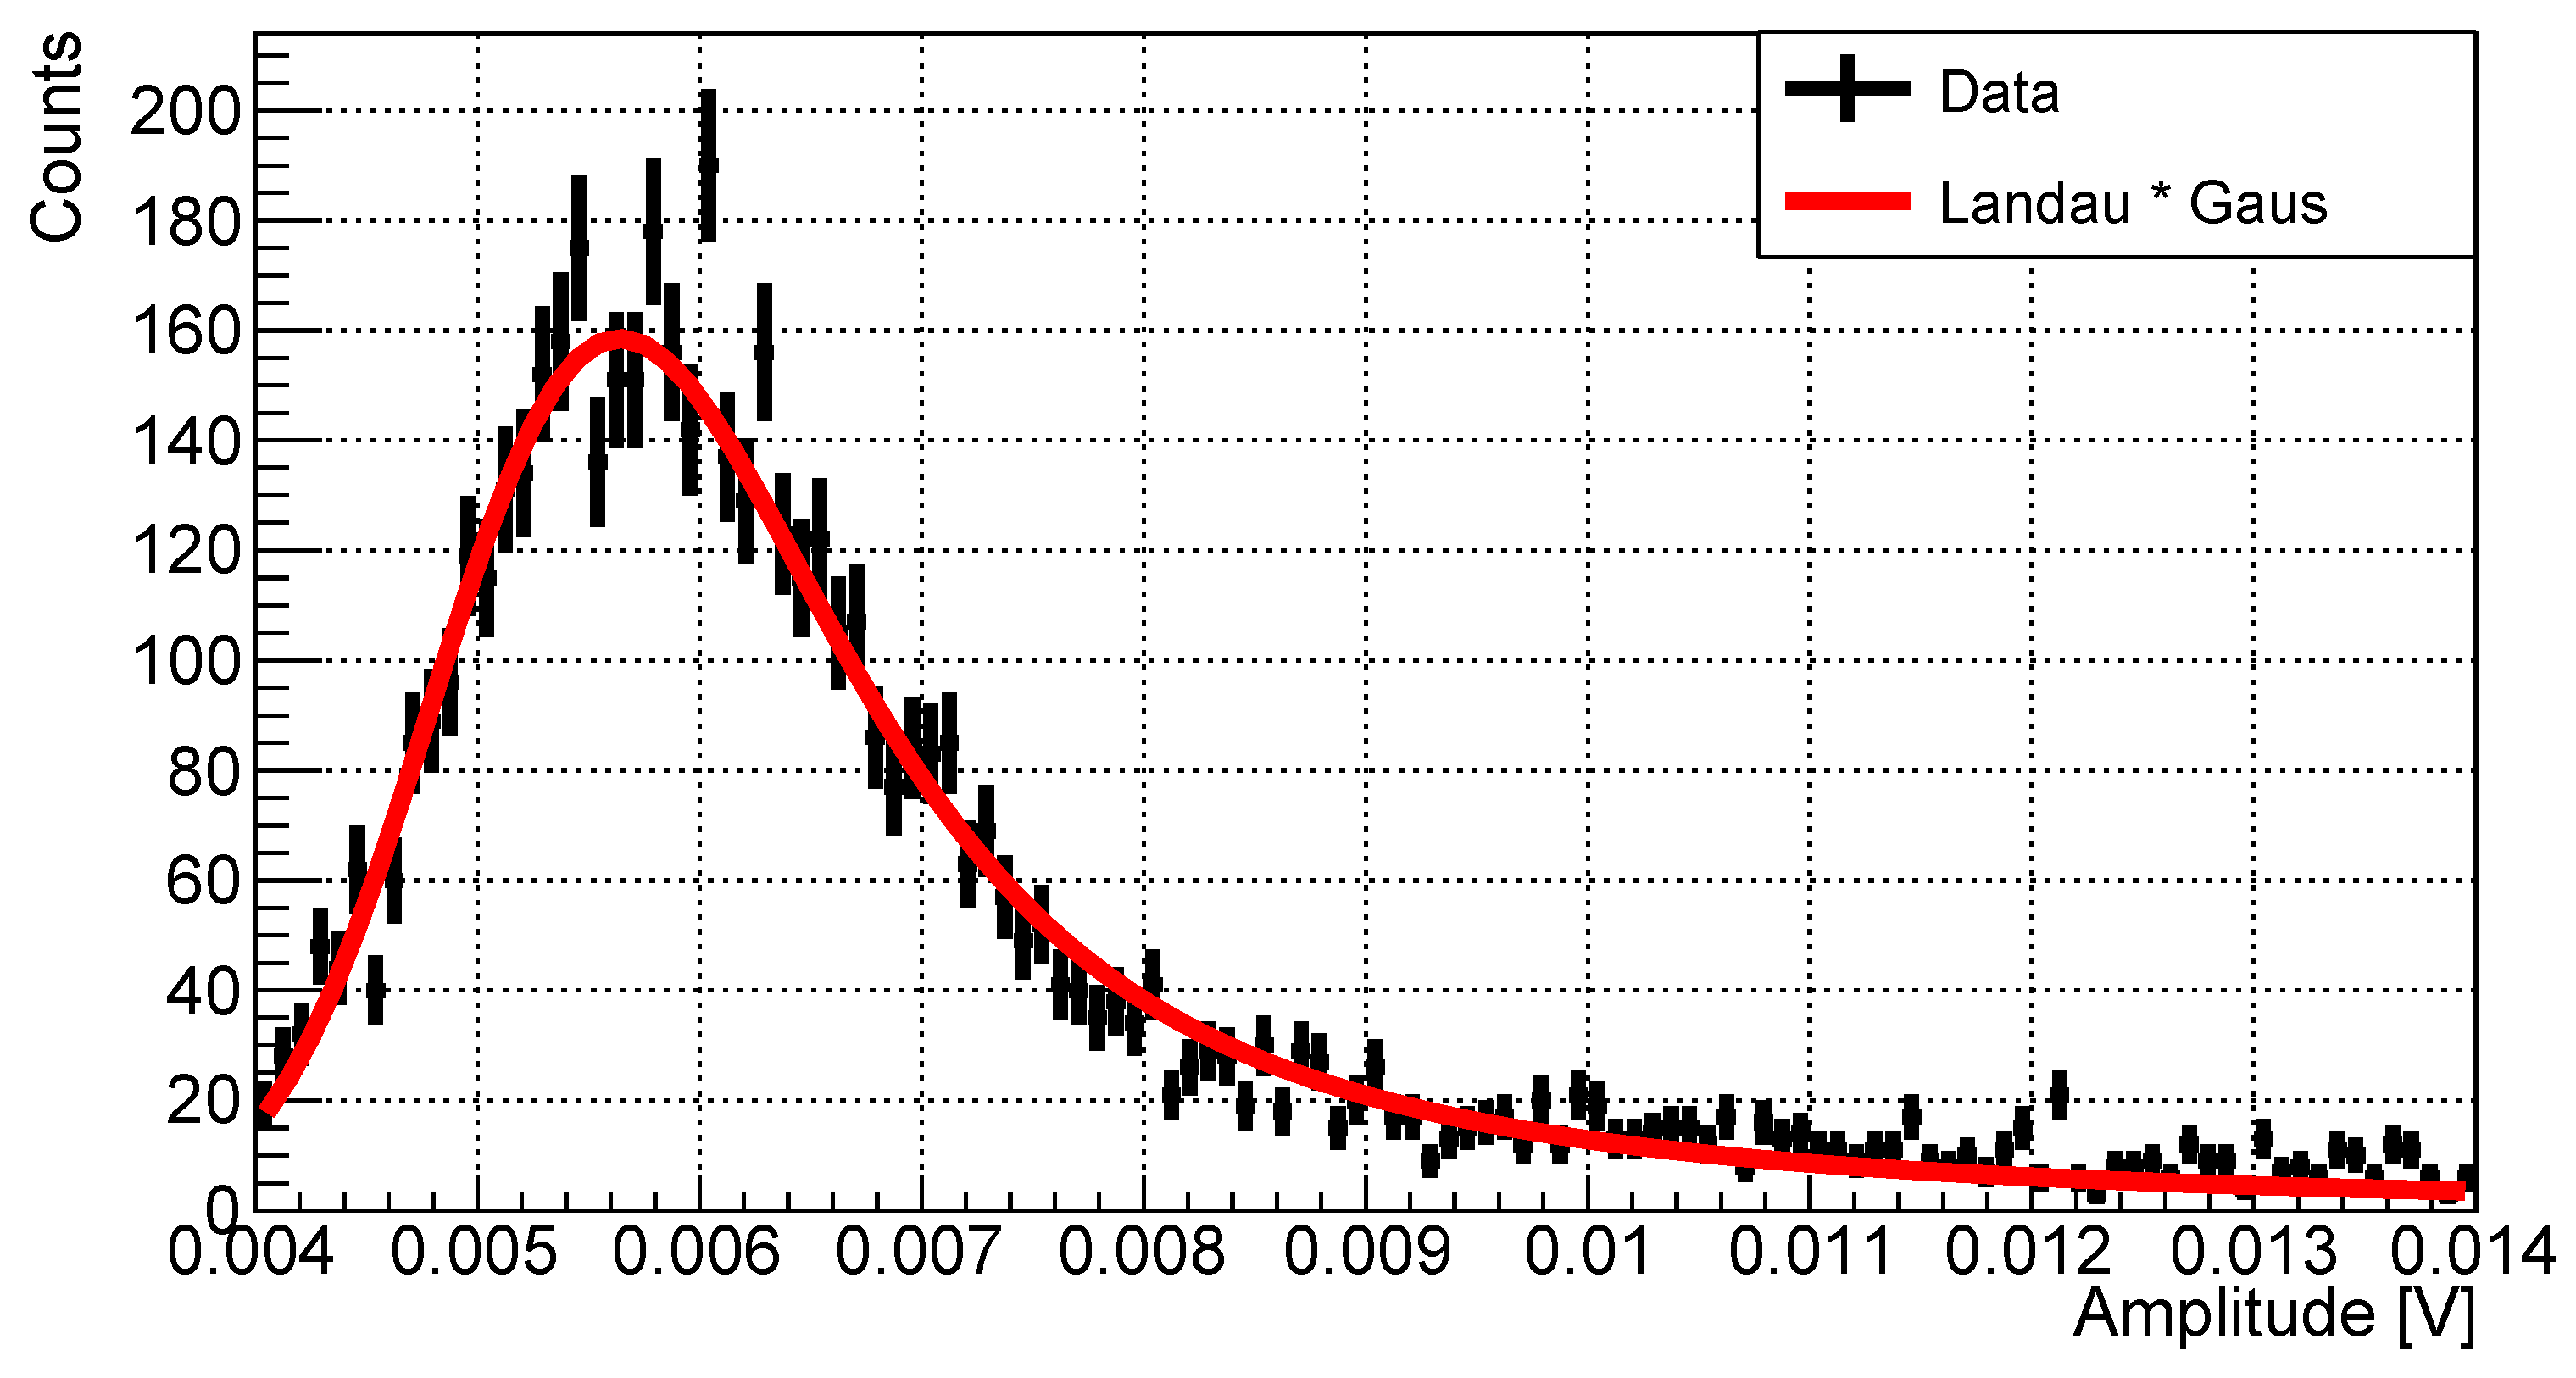
6.2. Calibration with Cosmic Muons (MIP)
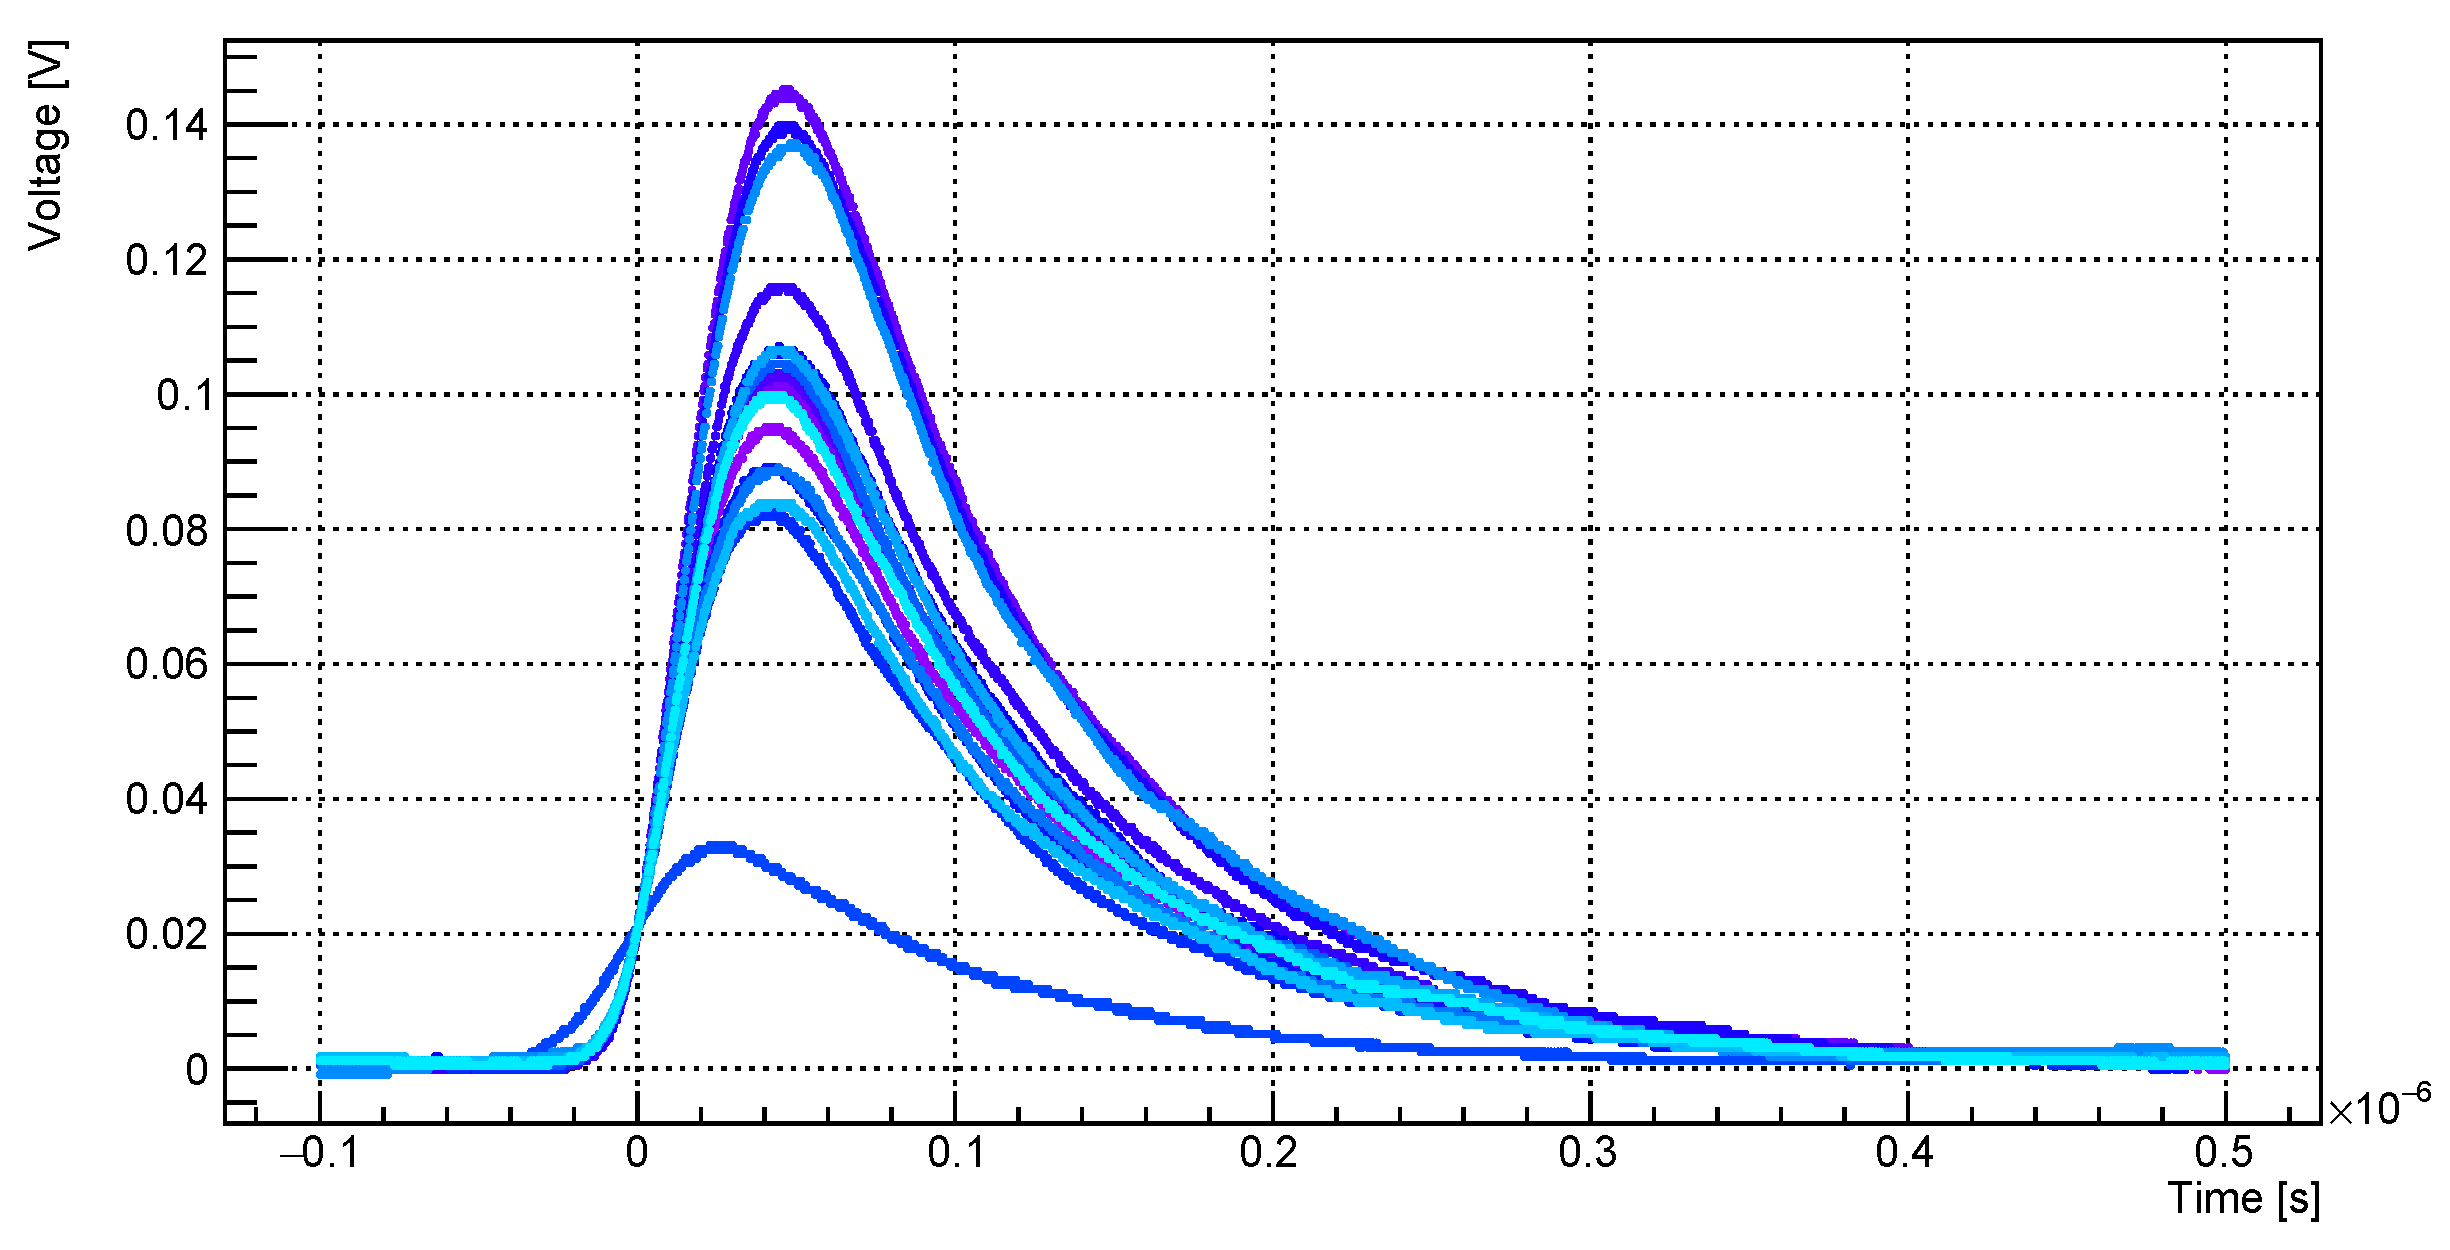
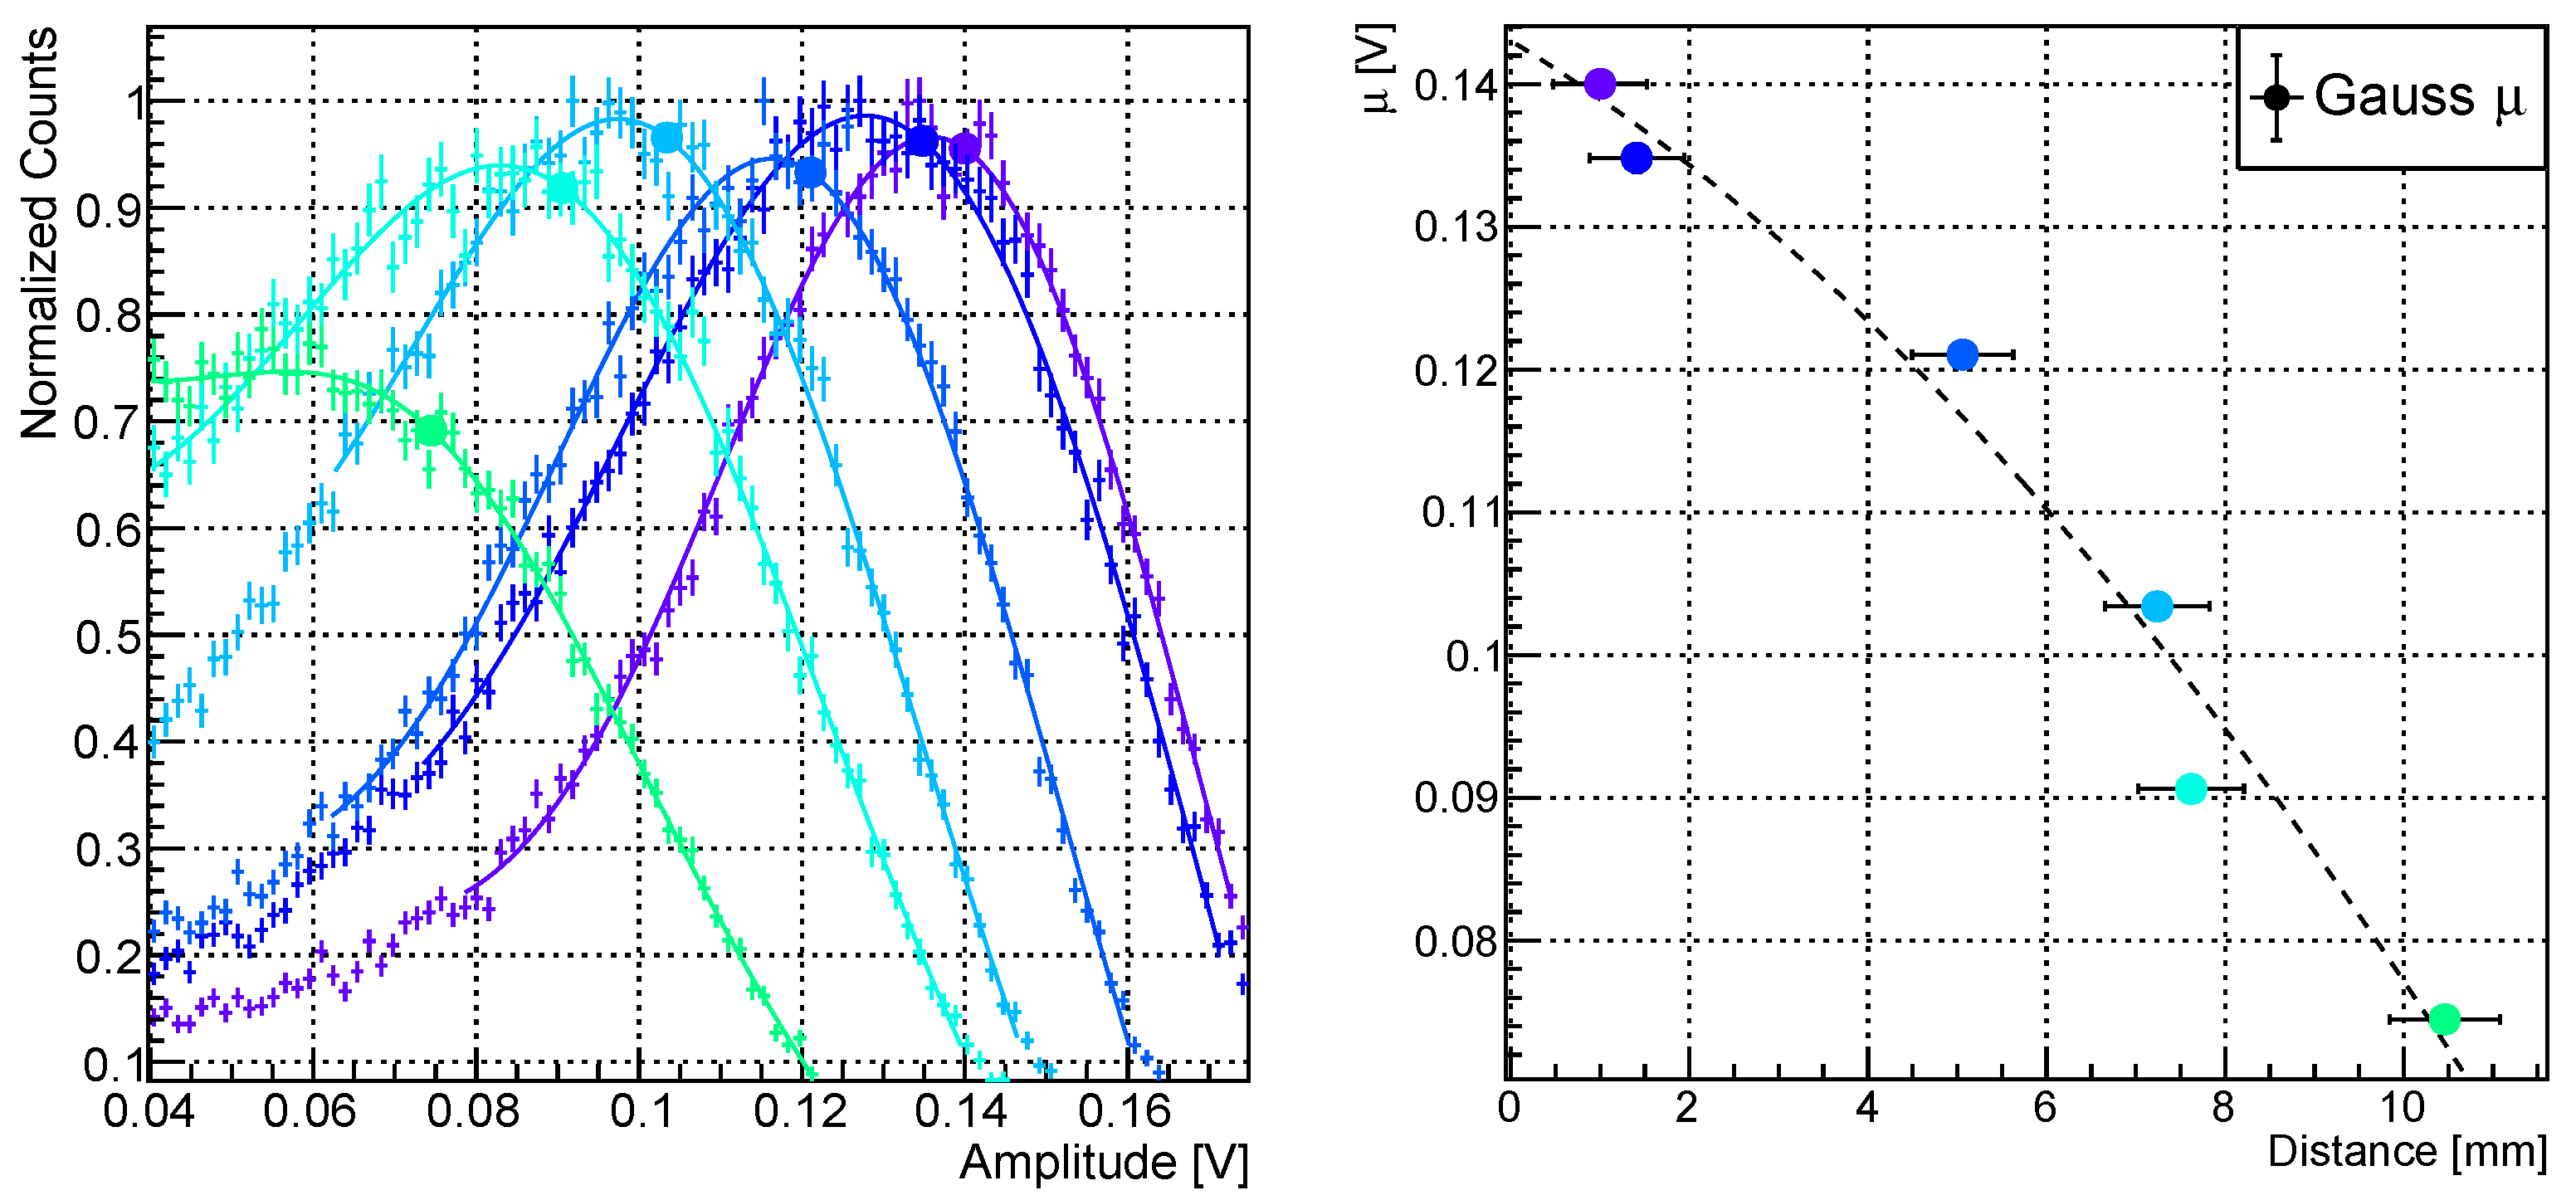
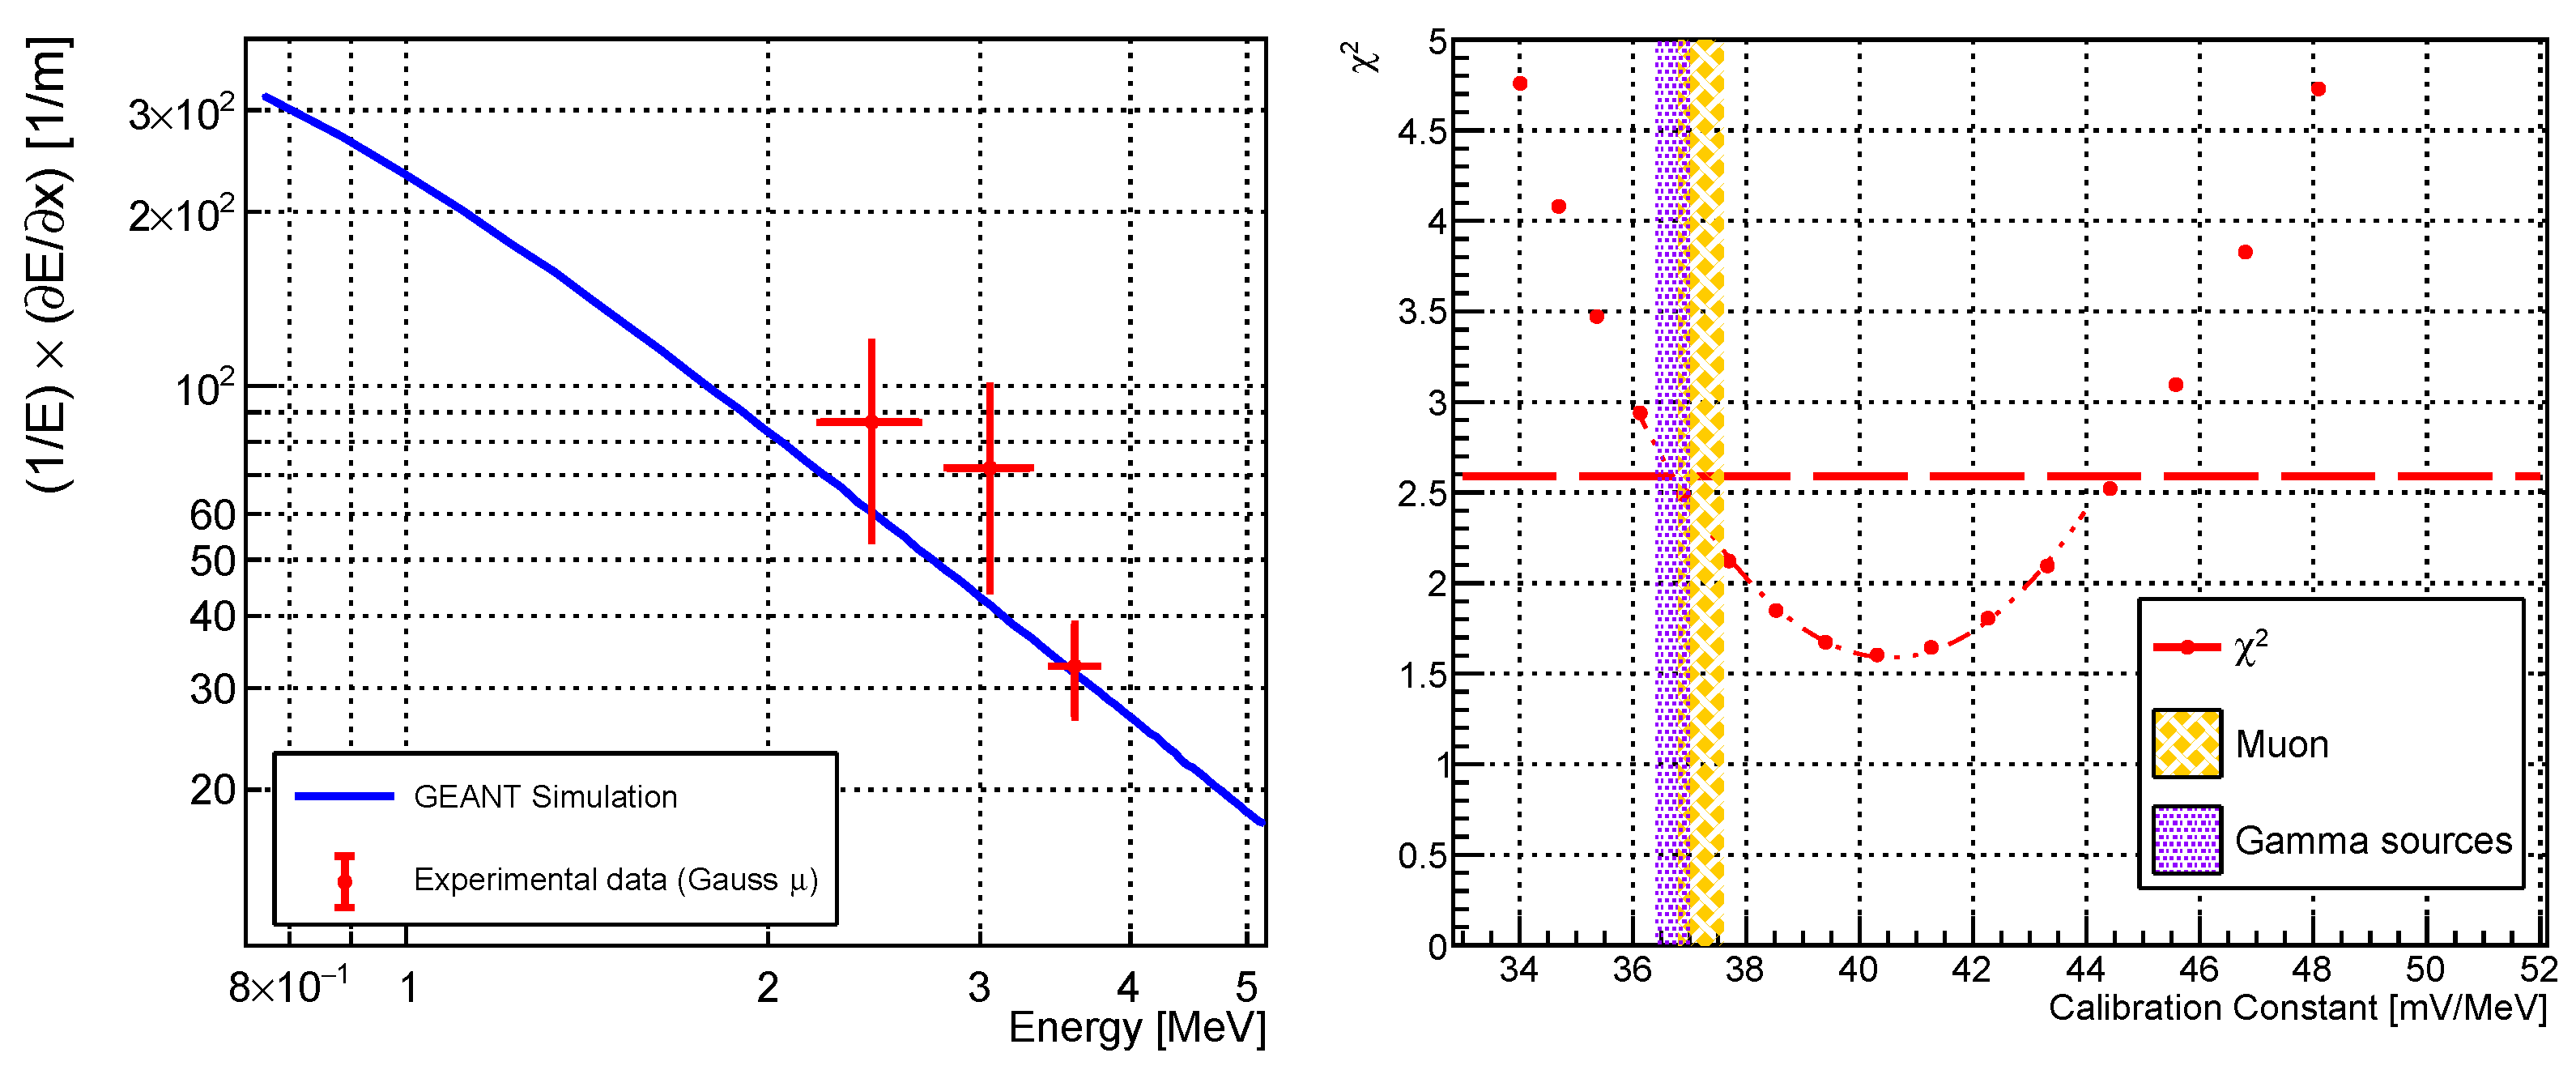
To test the PIPS response to minimum ionising particles (MIPs), natural atmospheric muons (∼ 100 Hz m 2 ) [40] have been acquired to obtain a coincidence of the PIPS detector with two plastic scintillators placed in a telescopic configuration.
In Figure 8, the data from the calibration with muons and the results from the curve fitting procedure are reported. The MPV was found to be MPV = ( 5.626 ± 0.016 ) mV , while the Gaussian resolution was σ = ( 0.53 ± 0.03 ) mV . From the comparison with a MonteCarlo GEANT4 simulation, it has been possible to measure the calibration constant ( 37.2 ± 0 . 1 stat ± 0 . 3 syst ) mV / MeV , where the systematic error takes into account the uncertainty in the telescope acceptance and in the fitting model. Thus, the response of PIPS detector to muons is compatible with the one obtained with γ -rays, and the measured energy resolution, σ 14 keV , is compatible with previous measurements.

6.3. Characterisation with α -Particles Emitted by 241 Am

Calibration with gamma-rays (producing recoiling electrons) is obtained with particles with a relatively small d E / d x , near the MIP (minimum ionising particle) point.
An important test for LEM silicon detectors is the calibration with slow alpha particles, having a much larger d E / d x . In particular, we use the alpha particles emitted by the calibration source of 241 Am . The alpha particles emitted by 241 Am have an energy 5.49 / 5.44 / 5.4 MeV (mostly). Our 241 Am calibration source is manufactured with a very thin layer holding the Am isotope; therefore, alpha particles can escape the source while losing just a fraction of their energy within the source and in the air; the resulting energy distribution has a spread in angle and energy. However, exploiting that few MeV alpha particles lose roughly ∼ 1 MeV / cm in air, it is possible to measure the variation of the residual alpha particle energy as a function of the distance between the ion-implanted silicon detector and the source. In Figure 9, signals induced by alpha particles are displayed. Signals are acquired with the LeCroy WaveSurfer 3000 oscilloscope. The silicon detector is porvided by the manufacturer with a built-in charge-sensitive amplifier (CSA) and a shaper. As we can deduce, the width of the signal at 50 % of the peak value is about 100 ns . This allows us to say that the maximum particle rate that is possible to acquire with this detector, without a pile-up occurring, is below a few MHz .
In Figure 10, it is possible to see different alpha particle amplitude spectra measured for different distances from the 241 Am source. To minimise the alpha particle angular spread, we apply a collimator made by a tape with a small central hole in front of the source. Unfortunately, the exact thickness (a few mm) of the air gap within the source itself is not known (we did not exactly measure it to avoid damaging the thin source). Moreover, the source material composition and exact geometry of the Am isotope distribution within the source material are also unknown. This adds an unknown, positive, air-equivalent offset to our measured distance. The measured alpha particle energy distributions are not Gaussian and present long tails at low energies; this is due to different energy losses in air and source due to different inclinations and multiple scattering, but detector effects can also contribute [41]. For this reason, we fitted those spectra with a Gaussian curve modified with the addition of a linear tail function. After the fitting procedure, we provided an estimation of mean value of the Gaussian μ . From Figure 10, it is also possible to estimate the derivative of the signal amplitude as a function of the distance, which is a quantity proportional to the stopping power E / x . However, the stopping power is a function of the particle’s energy. As a consequence, a quantitative calibration from Figure 10 is challenging because of the unknown air-equivalent distance offset. Thus, by measuring 1 E E x , we can remove the dependence on the calibration constant from voltage to energy. This quantity is still dependent on the true particle kinetic energy. Therefore, by assuming an hypothesis on the alpha particle calibration constant, it is possible to compare the measurement 1 E E x with the expectation from a Monte Carlo simulation of alpha particles crossing the air.
As an example, in Figure 11, the (x-axis) energy estimation adopts the calibration constant measured with gamma sources (described in Section 6.1). Finally, scanning different values for the calibration constant, we can measure this parameter for alpha particles by the computation of the χ 2 for each hypothesis, as shown in the right panel of Figure 11. We obtain that χ m i n 2 1.6 is reached at 40.5 mV / MeV . From the standard confidence interval evaluation, we deduce that the obtained result is compatible with the calibration constant obtained for gamma-ray and muons. Thus, the detector behaves as expected/desired and no evidence for a detector response depending on particle dE/dx is found. Summarising the result of this analysis, the measured calibration constant for alpha particles is ( 42 ± 4 ) mV / MeV .

7. Conclusions and Outlooks

In this work, we described the low-energy module (LEM): a compact particle spectrometer, suitable for a CubeSat, for the measurement of the differential flux of low-energy particles in the lower magnetosphere. Here, it is worth summarising the structure of the LEM. To avoid a bulky and heavy detector, we designed an active collimator based on a thin aluminium shield followed by an anti-coincidence detector. The drilled aluminium shield protects the drilled ACD, made of a plastic scintillator, from the large flux of very low energetic electrons in LEO. The holes in the aluminium and in the ACD are used to select a known direction of the particles with an angular resolution of 6 –7 . The LEM field of view is 60 × 60 , monitoring 16 directions in the sky at the same time. The particle identification relies on a series of 16 Δ E E modules, based on the PIPS and CdZnTe detectors, placed below each collimator channel. An additional layer of plastic scintillator at the bottom is added as a veto to identify non-contained particles. This detection concept seems to be promising for particle identification (PID) at low energies and for gamma/X-ray detection.
In the last part of this work, we provided the characterisation procedure we adopted for testing one candidate sensor: the PIPS-APCAM25 500 μ m fully depleted silicon detector manufactured by Mirion. The sensors came with an embedded preamplifier, also the object of this study. The calibration and characterisation procedure is essential for tuning the MonteCarlo simulation and deducing the performances of the instrument payload.
We calibrated the sensor by exploiting γ -ray sources and determining the energy resolution of ( 11.1 ± 0 . 4 stat ± 1 . 2 syst ) keV . The signal amplitude calibration constant determined was ( 36.7 ± 0.3 ) mV / MeV , and no dependence from the particle nature was observed. In particular, the result determined by this traditional calibration is compatible with the result obtained with muon detection ( 37.2 ± 0 . 1 stat ± 0 . 3 syst ) mV / MeV and alpha particles ( 42 ± 4 ) mV / MeV . The characterisation also confirmed the absence of a signal’s dependence on the reverse-bias voltage applied (above the depletion voltage).
Additional tests on prototypes of CZT detectors are planned in the future at the INFN-TIFPA laboratory.

Author Contributions

Conceptualization, F.N. and R.I.; methodology, F.N., R.N. and E.D.; software, R.N. and F.M.F.; validation, F.N. and R.N.; formal analysis, R.N.; investigation, F.N. and R.N.; resources, F.N., R.N. and R.I.; data curation, R.N. and F.N.; writing—original draft preparation, R.N. and F.N.; writing—review and editing, R.N., F.N., P.B., E.D., F.M.F., R.I. and V.V.; visualization, R.N., F.N. and F.M.F.; supervision, F.N., R.I. and G.P.; project administration, F.N., R.I., and V.V.; and funding acquisition, F.N., R.I., G.P. and P.B. All authors have read and agreed to the published version of the manuscript.

Funding

This research was funded by the Istituto Nazionale di Fisica Nucleare grant number 23682 and by the Ph.D. grant “Development of a payload for differential flux measurement of low-energy particles in space” financed by University of Trento, Fondazione Bruno Kessler, and INFN-TIFPA.

Institutional Review Board Statement

Not applicable.

Informed Consent Statement

Not applicable.

Data Availability Statement

Not applicable.

Conflicts of Interest

The authors declare no conflict of interest.

Abbreviations

The following abbreviations are used in this manuscript:
ACDAnti-coincidence detector
CSACharge sensitive amplifier
CSESChina seismo-electromagnetic satellite
CZTCadmium zing telluride (CdZnTe)
DSSSDDouble-sided silicon strip detector
GEANTGeometrty and tracking
GRBGamma-ray burst
LAIMLithosphere atmosphere ionosphere magnetosphere
EMLow-energy module
LEOLow earth orbit
LYSOLutetium–yttrium oxyorthoSilicate
MILCMagnetosphere ionosphere lithosphere coupling
MIPMinimum ionising particle
MPVMost probable value
PIDParticle identification
PIPSPassivated implanted planar silicon
TGFTerrestrial gamma-ray flash

References

  1. Battiston, R.; Vitale, V. First evidence for correlations between electron fluxes measured by NOAA-POES satellites and large seismic events. Nucl. Phys. Proc. Suppl. 2013, 243, 249–257. [Google Scholar] [CrossRef]
  2. Walt, M. Introduction to geomagnetically trapped radiation. Camb. Atmos. Space Sci. Ser. 1994, 10, 1–10. [Google Scholar]
  3. De Santis, A.; De Franceschi, G.; Spogli, L.; Perrone, L.; Alfonsi, L.; Qamili, E.; Cianchini, G.; Di Giovambattista, R.; Salvi, S.; Filippi, E.; et al. Geospace perturbations induced by the Earth: The state of the art and future trends. Phys. Chem. Earth Parts A/B/C 2015, 85, 17–33. [Google Scholar] [CrossRef] [Green Version]
  4. Piersanti, M.; Materassi, M.; Battiston, R.; Carbone, V.; Cicone, A.; D’Angelo, G.; Diego, P.; Ubertini, P. Magnetospheric–ionospheric–lithospheric coupling model. 1: Observations during the 5 August 2018 Bayan Earthquake. Remote Sens. 2020, 12, 3299. [Google Scholar] [CrossRef]
  5. D’Angelo, G.; Piersanti, M.; Battiston, R.; Bertello, I.; Carbone, V.; Cicone, A.; Diego, P.; Papini, E.; Parmentier, A.; Picozza, P.; et al. Haiti Earthquake (Mw 7.2): Magnetospheric–Ionospheric–Lithospheric Coupling during and after the Main Shock on 14 August 2021. Remote Sens. 2022, 14, 5340. [Google Scholar] [CrossRef]
  6. Parrot, M.; Li, M. Demeter results related to seismic activity. Ursi Radio Sci. Bull. 2015, 2015, 18–25. [Google Scholar]
  7. Sauvaud, J.; Moreau, T.; Maggiolo, R.; Treilhou, J.P.; Jacquey, C.; Cros, A.; Coutelier, J.; Rouzaud, J.; Penou, E.; Gangloff, M. High-energy electron detection onboard DEMETER: The IDP spectrometer, description and first results on the inner belt. Planet. Space Sci. 2006, 54, 502–511. [Google Scholar] [CrossRef]
  8. Dubourg, V.; Kainov, V.; Thoby, M.; Silkin, O.; Solovey, V. The DEMETER micro satellite launch campaign: A cheap access to space. Adv. Space Res. 2006, 37, 754–760. [Google Scholar] [CrossRef]
  9. Xu, Y.B.; Wang, H.Y.; Meng, X.C.; Wang, H.; Lu, H.; Ma, Y.Q.; Li, X.Q.; Shi, F.; Wang, P.; Zhao, X.Y.; et al. Design and simulations for the detector based on DSSSD. Chin. Phys. C 2010, 34, 1846. [Google Scholar] [CrossRef]
  10. Wu, F.; Wang, H.Y.; Zhao, X.Y.; Meng, X.C.; Xu, Y.B.; Wang, H.; Ma, Y.Q.; Lu, H.; Wang, P.; Shi, F.; et al. Design and performance study of the LEPD silicon tracker onboard the CSES satellite. Chin. Phys. C 2013, 37, 026004. [Google Scholar] [CrossRef]
  11. Li, X.; Xu, Y.; An, Z.; Liang, X.; Wang, P.; Zhao, X.; Wang, H.; Lu, H.; Ma, Y.; Shen, X.; et al. The high-energy particle package onboard CSES. Radiat. Detect. Technol. Methods 2019, 3, 22. [Google Scholar] [CrossRef]
  12. Nan, Y.F.; An, Z.H.; Li, H.X.; Zhao, X.Y.; Wen, X.Y.; Zhang, D.L.; Cheng, S.G.; Li, X.Q.; Wang, H.; Liang, X.H.; et al. Design and performance study of the HEPP-H calorimeter onboard the CSES satellite. Res. Astron. Astrophys. 2018, 18, 154. [Google Scholar] [CrossRef]
  13. Li, C.; Tang, S.; Hu, X.; Qian, Y.; Wang, Y.; Zhao, H.; Fu, Q.; Sun, Z.; He, H.; Yu, Y.; et al. Design and realization of China Tianwen-1 energetic particle analyzer. Space Sci. Rev. 2021, 217, 26. [Google Scholar] [CrossRef]
  14. Tang, S.; Wang, Y.; Zhao, H.; Fang, F.; Qian, Y.; Zhang, Y.; Yang, H.; Li, C.; Fu, Q.; Kong, J.; et al. Calibration of Mars energetic particle analyzer (MEPA). Earth Planet. Phys. 2020, 4, 355–363. [Google Scholar] [CrossRef]
  15. Zou, Y.; Zhu, Y.; Bai, Y.; Wang, L.; Jia, Y.; Shen, W.; Fan, Y.; Liu, Y.; Wang, C.; Zhang, A.; et al. Scientific objectives and payloads of Tianwen-1, China’s first Mars exploration mission. Adv. Space Res. 2021, 67, 812–823. [Google Scholar] [CrossRef]
  16. Hassler, D.M.; Zeitlin, C.; Wimmer-Schweingruber, R.; Böttcher, S.; Martin, C.; Andrews, J.; Böhm, E.; Brinza, D.; Bullock, M.; Burmeister, S.; et al. The radiation assessment detector (RAD) investigation. Space Sci. Rev. 2012, 170, 503–558. [Google Scholar] [CrossRef]
  17. Zeitlin, C.; Hassler, D.; Wimmer-Schweingruber, R.; Ehresmann, B.; Appel, J.; Berger, T.; Böhm, E.; Böttcher, S.; Brinza, D.; Burmeister, S.; et al. Calibration and characterization of the radiation assessment detector (RAD) on curiosity. Space Sci. Rev. 2016, 201, 201–233. [Google Scholar] [CrossRef]
  18. Ehresmann, B.; Zeitlin, C.; Hassler, D.M.; Wimmer-Schweingruber, R.F.; Böhm, E.; Böttcher, S.; Brinza, D.E.; Burmeister, S.; Guo, J.; Köhler, J.; et al. Charged particle spectra obtained with the Mars Science Laboratory Radiation Assessment Detector (MSL/RAD) on the surface of Mars. J. Geophys. Res. Planets 2014, 119, 468–479. [Google Scholar] [CrossRef]
  19. Ehresmann, B.; Hassler, D.M.; Zeitlin, C.; Guo, J.; Köhler, J.; Wimmer-Schweingruber, R.F.; Appel, J.K.; Brinza, D.E.; Rafkin, S.C.; Böttcher, S.I.; et al. Charged particle spectra measured during the transit to Mars with the Mars Science Laboratory Radiation Assessment Detector (MSL/RAD). Life Sci. Space Res. 2016, 10, 29–37. [Google Scholar] [CrossRef]
  20. Guo, J.; Zeitlin, C.; Wimmer-Schweingruber, R.F.; Hassler, D.M.; Ehresmann, B.; Köhler, J.; Böhm, E.; Böttcher, S.; Brinza, D.; Burmeister, S.; et al. MSL-RAD radiation environment measurements. Radiat. Prot. Dosim. 2015, 166, 290–294. [Google Scholar] [CrossRef]
  21. Takahashi, T.; Watanabe, S. Recent progress in CdTe and CdZnTe detectors. IEEE Trans. Nucl. Sci. 2001, 48, 950–959. [Google Scholar] [CrossRef] [Green Version]
  22. Sordo, S.D.; Abbene, L.; Caroli, E.; Mancini, A.M.; Zappettini, A.; Ubertini, P. Progress in the development of CdTe and CdZnTe semiconductor radiation detectors for astrophysical and medical applications. Sensors 2009, 9, 3491–3526. [Google Scholar] [CrossRef] [Green Version]
  23. Piran, T. The physics of gamma-ray bursts. Rev. Mod. Phys. 2005, 76, 1143. [Google Scholar] [CrossRef] [Green Version]
  24. Agostinelli, S.; Allison, J.; Amako, K.a.; Apostolakis, J.; Araujo, H.; Arce, P.; Asai, M.; Axen, D.; Banerjee, S.; Barrand, G.; et al. GEANT4—A simulation toolkit. Nucl. Instruments Methods Phys. Res. Sect. A Accel. Spectrometers Detect. Assoc. Equip. 2003, 506, 250–303. [Google Scholar] [CrossRef] [Green Version]
  25. Scarduelli, V.; Gasques, L.; Chamon, L.; Lépine-Szily, A. A method to optimize mass discrimination of particles identified in ΔEE silicon surface barrier detector systems. Eur. Phys. J. A 2020, 56, 24. [Google Scholar] [CrossRef]
  26. Evensen, L.; Westgaard, T.; Avdeichikov, V.; Carlen, L.; Jakobsson, B.; Murin, Y.; Martensson, J.; Oskarsson, A.; Siwek, A.; Whitlow, H.; et al. Thin detectors for the CHICSi/spl Delta/EE telescope. IEEE Trans. Nucl. Sci. 1997, 44, 629–634. [Google Scholar] [CrossRef]
  27. Carboni, S.; Barlini, S.; Bardelli, L.; Le Neindre, N.; Bini, M.; Borderie, B.; Bougault, R.; Casini, G.; Edelbruck, P.; Olmi, A.; et al. Particle identification using the ΔE − E technique and pulse shape discrimination with the silicon detectors of the FAZIA project. Nucl. Instruments Methods Phys. Res. Sect. A Accel. Spectrometers Detect. Assoc. Equip. 2012, 664, 251–263. [Google Scholar] [CrossRef]
  28. Li, H.; Ma, B.Q. Lorentz invariance violation induced threshold anomaly versus very-high energy cosmic photon emission from GRB 221009A. Astropart. Phys. 2023, 148, 102831. [Google Scholar] [CrossRef]
  29. Bietenholz, W. Cosmic rays and the search for a Lorentz Invariance Violation. Phys. Rep. 2011, 505, 145–185. [Google Scholar] [CrossRef] [Green Version]
  30. Petitjean, P.; Wang, F.; Wu, X.; Wei, J. Grbs and fundamental physics. Space Sci. Rev. 2016, 202, 195–234. [Google Scholar] [CrossRef] [Green Version]
  31. Dutta, S.; Moharana, R.; Kumar, M. Generalized Linear Models of T _{90}-T _{50} relation to classify GRBs. arXiv 2023, arXiv:2305.03947. [Google Scholar]
  32. Abbott, B.P.; Abbott, R.; Abbott, T.; Acernese, F.; Ackley, K.; Adams, C.; Adams, T.; Addesso, P.; Adhikari, R.; Adya, V.B.; et al. GW170817: Observation of gravitational waves from a binary neutron star inspiral. Phys. Rev. Lett. 2017, 119, 161101. [Google Scholar] [CrossRef] [PubMed] [Green Version]
  33. Abbasi, R.; Ackermann, M.; Adams, J.; Aguilar, J.; Ahlers, M.; Ahrens, M.; Alameddine, J.; Alves, A.; Amin, N.; Andeen, K.; et al. Searches for Neutrinos from Gamma-Ray Bursts Using the IceCube Neutrino Observatory. Astrophys. J. 2022, 939, 116. [Google Scholar] [CrossRef]
  34. Fiore, F.; Werner, N.; Behar, E. Distributed Architectures and Constellations for γ-ray Burst Science. Galaxies 2021, 9, 120. [Google Scholar] [CrossRef]
  35. Battiston, R.; Neubüser, C.; Follega, F.; Iuppa, R.; Vitale, V.; Ammendola, R.; Badoni, D.; Bartocci, S.; Bazzano, A.; Beolè, S.; et al. Observation of Anomalous Electron Fluxes Induced by GRB221009A on CSES-01 Low-energy Charged Particle Detector. Astrophys. J. Lett. 2023, 946, L29. [Google Scholar] [CrossRef]
  36. Agapitov, O.; Balikhin, M.; Hull, A.; Hobara, Y.; Angelopoulos, V.; Mozer, F. First Detection of the Powerful Gamma-Ray Burst GRB 221009A by the THEMIS ESA and SST Particle Detectors on 2022 October 9. Astrophys. J. Lett. 2023, 948, L21. [Google Scholar] [CrossRef]
  37. Dwyer, J.R.; Smith, D.M.; Cummer, S.A. High-energy atmospheric physics: Terrestrial gamma-ray flashes and related phenomena. Space Sci. Rev. 2012, 173, 133–196. [Google Scholar] [CrossRef] [Green Version]
  38. Tavani, M.; Marisaldi, M.; Labanti, C.; Fuschino, F.; Argan, A.; Trois, A.; Giommi, P.; Colafrancesco, S.; Pittori, C.; Palma, F.; et al. Terrestrial gamma-ray flashes as powerful particle accelerators. Phys. Rev. Lett. 2011, 106, 018501. [Google Scholar] [CrossRef]
  39. Alva-Sánchez, H.; Zepeda-Barrios, A.; Díaz-Martínez, V.; Murrieta-Rodríguez, T.; Martínez-Dávalos, A.; Rodríguez-Villafuerte, M. Understanding the intrinsic radioactivity energy spectrum from 176Lu in LYSO/LSO scintillation crystals. Sci. Rep. 2018, 8, 17310. [Google Scholar] [CrossRef] [Green Version]
  40. Group, P.D.; Zyla, P.; Barnett, R.; Beringer, J.; Dahl, O.; Dwyer, D.; Groom, D.; Lin, C.J.; Lugovsky, K.; Pianori, E.; et al. Review of particle physics. Prog. Theor. Exp. Phys. 2020, 2020, 083C01. [Google Scholar] [CrossRef]
  41. Pommé, S.; Marroyo, B.C. Improved peak shape fitting in alpha spectra. Appl. Radiat. Isot. 2015, 96, 148–153. [Google Scholar] [CrossRef] [PubMed]
Figure 1. Detection concept embedded within the detector’s geometry. In the picture, red trajectories represent discarded events, green trajectories represent good/accepted particle events, and the blue trajectory represents a good/accepted photon event.
Universe 09 00331 g001
Figure 2. Visualization of the low-energy module (LEM) geometry developed with the GEANT4 framework [24].
Universe 09 00331 g002
Figure 3. PID classifier vs. kinetic energy. (Left): 100 μ m –500 μ m PIPS detectors. (Right): 100 μ m PIPS and 1 mm CZT detectors. The three different clusters in each plot represent (from the top to the bottom): alpha particles, protons, and electrons.
Universe 09 00331 g003
Figure 4. Angular projection of the projectile’s incident direction. In this graph, the x y plane is parallel to the detectors. The colour code identifies the Δ E E silicon sensor pair that detects the particle. Left plot is relative to proton and alpha particles, whereas in the right plot electron events are shown.
Universe 09 00331 g004
Figure 5. Improvement of detection yield for γ -rays thanks to CZT sensors. The legend refers to the material and the thickness considered for the E detector.
Universe 09 00331 g005
Figure 6. (Left) LYSO spectrum measured with the fully depleted silicon detector. (Right) Spectrum of the 241 Am radioactive isotope in the silicon detector.
Universe 09 00331 g006
Figure 7. Calibration curve and measurement of the resolution of the silicon detector.
Universe 09 00331 g007
Figure 8. Results from the calibration with muons. In the picture the histogram of the amplitude of the PIPS voltage signals (points). Red line is a fit with a Landau distribution convoluted with a Gaussian.
Universe 09 00331 g008
Figure 9. The signal induced by 241 Am alpha particles in the PIPS detector. A LeCroy WaveSurfer 3000 oscilloscope has been used as a DAQ. Waveforms are displayed with different colours.
Universe 09 00331 g009
Figure 10. (Left): α particle amplitude spectra collected with the PIPS detector (colour encodes the distance). (Right): signal amplitude ( μ round points) as a function of the distance between the 241 Am source and the PIPS, with an unknown offset.
Universe 09 00331 g010
Figure 11. (Left): PIPS (fully depleted silicon detector) characterisation with alpha particles. On the x-axis, the mean energy detected by the PIPS detector assuming the detector calibration constant as measured with gamma-rays. (Right): χ 2 computed for the different hypothesis of the detector calibration constant for alpha particles. Pink shaded area depicts the calibration constant measured with gamma-rays, and yellow shaded area depicts the one measured with atmospheric muons.
Universe 09 00331 g011
Table 1. Summary of some features of the detectors studied in this section. The references from which I extracted the information are quoted within the text.
InstrumentSizeDirectionsAngularEnergyPIDDetector
Weight ResolutionRange Elements
IDP DEMETER525 g1FOV 32 deg.e: (0.07, 0.8) MeVNoSilicon diode
RAD Curiosity∼10 × 10ComplexFOV 36.7 deg.e: (0.1, 20) MeVYesPIPS (3 segments)
× 10 cm 3 segmentation p: (5, 200) MeV CsI(Tl)
α : (5, 200) MeV Plast. scint.
l.Z: (10, 300) MeV
HEPP-LLarge5 NarrowFOV 6.5 deg.e: (0.1, 3) MeVYesSi det. (2 layers)
collimators4 WideFOV 15 deg.p: (2, 20) MeV Plast. scint.
HEPP-HDSSSDsSilicon trackere: 3.2 degs.e:(1.5, 50) MeVYesDSSSDs
100 cm 2 with DSSSDsp: 2.94 degs.p:(15, 200) MeV DSSSDs
5 CsI(Tl): CsI
120 × 120
× 30 mm 3
Mars-EPA270 × 1801FOV 60 deg.e: (0.1, 12) MeVYesPIPS (2 layers)
× 148 cm 3 p: (2, 100) MeV CsI(Tl)
α : (25, 400) MeV
l.Z: (25, 400) MeV
Disclaimer/Publisher’s Note: The statements, opinions and data contained in all publications are solely those of the individual author(s) and contributor(s) and not of MDPI and/or the editor(s). MDPI and/or the editor(s) disclaim responsibility for any injury to people or property resulting from any ideas, methods, instructions or products referred to in the content.

